quantitative measures in epidemiology - interfetpthailand · • both nominal and ordinal scale...
TRANSCRIPT

Quantitative Measures in Epidemiology

2
DEFINITION OF EPIDEMIOLOGY
“The study of the distribution and determinants of diseasefrequency"
(MacMahon, 1970)
“The study of the occurrence of illness"
(Cole, 1979)

3
QUANTITATIVE MEASURES OF DISEASE FREQUENCY
Basic elements of epidemiologic inference are defining, counting, and summarizingdisease outcomes
Outcomes: expressed as either categorical (eg. Disease occurrence or severity) or continuous variables
4
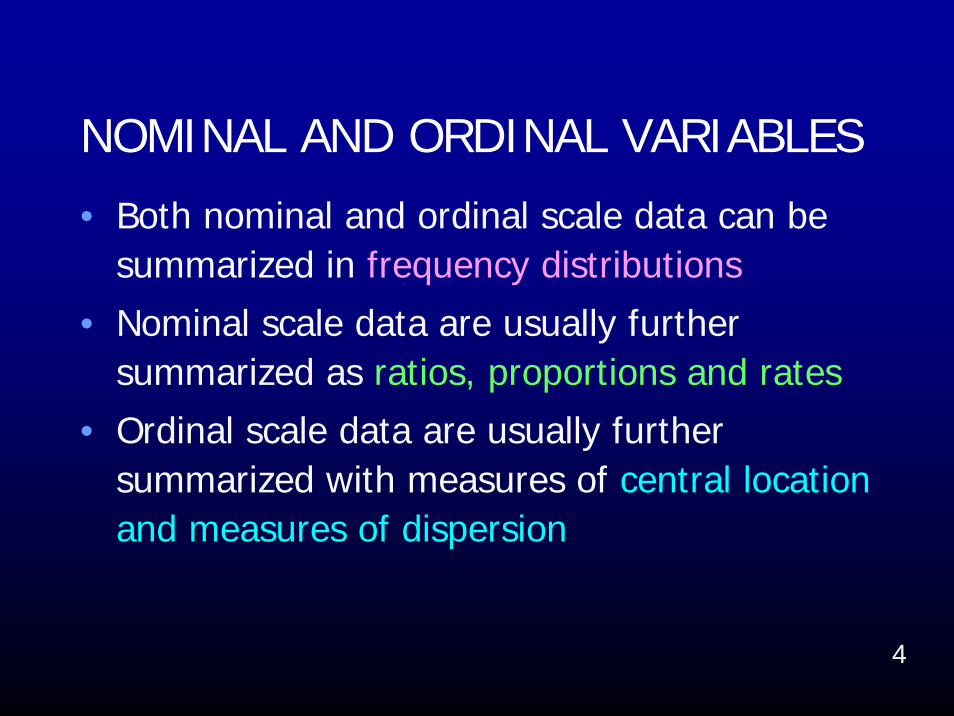
NOMINAL AND ORDINAL VARIABLES
• Both nominal and ordinal scale data can be summarized in frequency distributions
• Nominal scale data are usually further summarized as ratios, proportions and rates
• Ordinal scale data are usually further summarized with measures of central location and measures of dispersion

5
TYPES OF VARIABLES AND STATISTICS
Qualitative
Polychotomous(> 2 groups)
Categorical data
Variables
Quantitative
Nominal Ordinal
Dichotomous(2 groups)
Continuous dataMean
MedianModeRange
Inter-quartile rangeStandard deviation
RatioProportion
Rate

6
QUANTITATIVE MEASURES USED IN EPIDEMIOLOGY
• Measures of disease frequency reflect the relative occurrence of the disease in a population.
• Measures of association reflect the strength or magnitude of the statistical relationship between exposure status and disease occurrence.
• Measures of effect: Certain measures of association involving disease incidence are also measures of the exposure effect.
• Measures of impact* are used to predict the impact of an intervention on the disease occurrence in a population (extra number of cases attributable to, or prevented by, the exposure)

7
EPIDEMIOLOGIC APPROACH
• Case Definitions: – based on signs, symptoms
and results of tests
• Numbers and Rates
• Descriptive Epidemiology
• Analytic Epidemiology
QUANTITATIVE METHODS
• Measurement of variables
• Estimation of population parameters
• Testing of statistical hypothesis
8
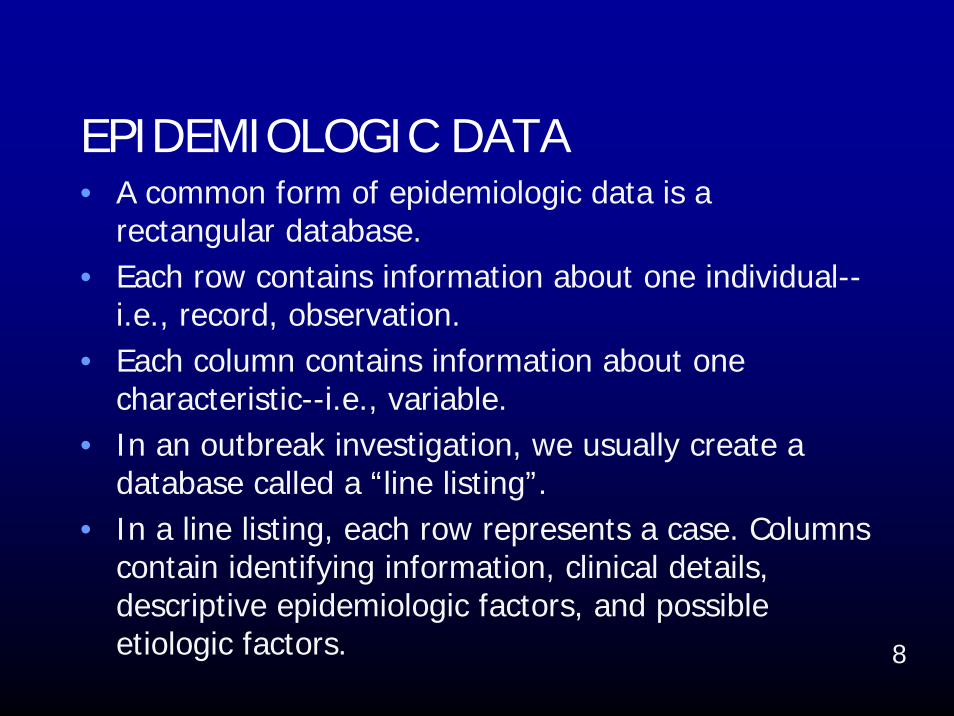
EPIDEMIOLOGIC DATA• A common form of epidemiologic data is a
rectangular database.• Each row contains information about one individual--
i.e., record, observation.• Each column contains information about one
characteristic--i.e., variable.• In an outbreak investigation, we usually create a
database called a “line listing”.• In a line listing, each row represents a case. Columns
contain identifying information, clinical details, descriptive epidemiologic factors, and possible etiologic factors.

9
Neonatal listeriosis, General Hospital A, Costa Rica, 1989
Symptom Delivery AdmittingID Sex Date DOB Type Outcome Symptoms
1 F 6/2 6/2 Vaginal Lived dyspnea2 M 6/8 6/2 C-section Lived fever3 F 6/15 6/8 Vaginal Died dyspnea4 F 6/12 6/8 Vaginal Lived fever5 F 6/15 6/11 C-section Lived pneumonia6 F 6/20 6/14 C-section Lived fever7 M 6/21 6/14 Vaginal Lived fever8 F 6/18 6/15 C-section Lived fever9 M 6/20 6/15 C-section Lived pneumonia
10 M 6/19 6/16 Forceps Lived fever11 M 7/21 7/21 Vaginal Died dyspnea
Source: Schuchat 1991
An example of “line lis
ting”.

10
SUMMARIZING DIFFERENT TYPES OF VARIABLES
When categories are used, the measurement scale is called a nominal scale.
Vaccination Number
Yes 76
No 125
Total 201
When points on a numerical scale are used, the scale is called an ordinal scale.
11
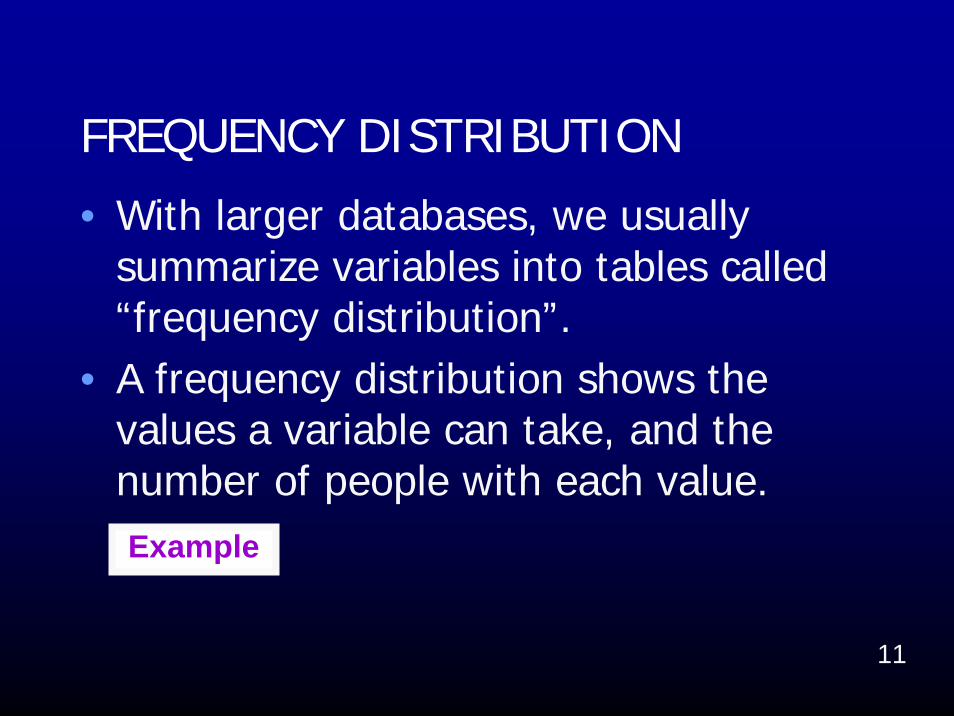
FREQUENCY DISTRIBUTION
• With larger databases, we usually summarize variables into tables called “frequency distribution”.
• A frequency distribution shows the values a variable can take, and the number of people with each value.Example

12
Distribution of Students by Levels of Blood Sugar, n=100
Bl. sugar (mg%) Number Relative freq Cumulative relative freq
52-55 4 4 4
56-59 12 12 16
60-63 16 16 32
64-67 27 27 59
68-71 13 13 72
72-75 19 19 91
76-79 4 4 95
80-83 5 5 100
Total 100 100 100Example of “frequency
distribution”.

13
In what circumstance that we should measure by counting absolute number?

14
0
2
4
6
8
10
18 -
24 M
ay
25 -
31 M
ay
1 - 7
Jun
8 - 1
4 Ju
n
15 -
21 J
un
22 -
28 J
un
29 J
un -
5 Ju
l
6 - 1
2 Ju
l
13 -
19 J
ul
20 -
26 J
ul
27 J
ul -
2 Au
g
3 - 9
Aug
10 -
16 A
ug
17 -
23 A
ug
24 -
30 A
ug
31 A
ug -
6 Se
p
7 - 1
3 Se
p
14 -
20 S
ep
21 -
27 S
ep
28 S
ep -
4 O
ct
5 - 1
1 O
ct Weekly interval
NS 1NS 2
2 / 2 Kit.
Epidemic curve and spot mapof mumps cases, kindergarten “A” ,May–September 1999
(N=38)
1 child case 1 officer case
1 / 1 1 / 2 3 / 2 3 / 1
2 / 1
Laosirithaworn, 1999
Distribution
15
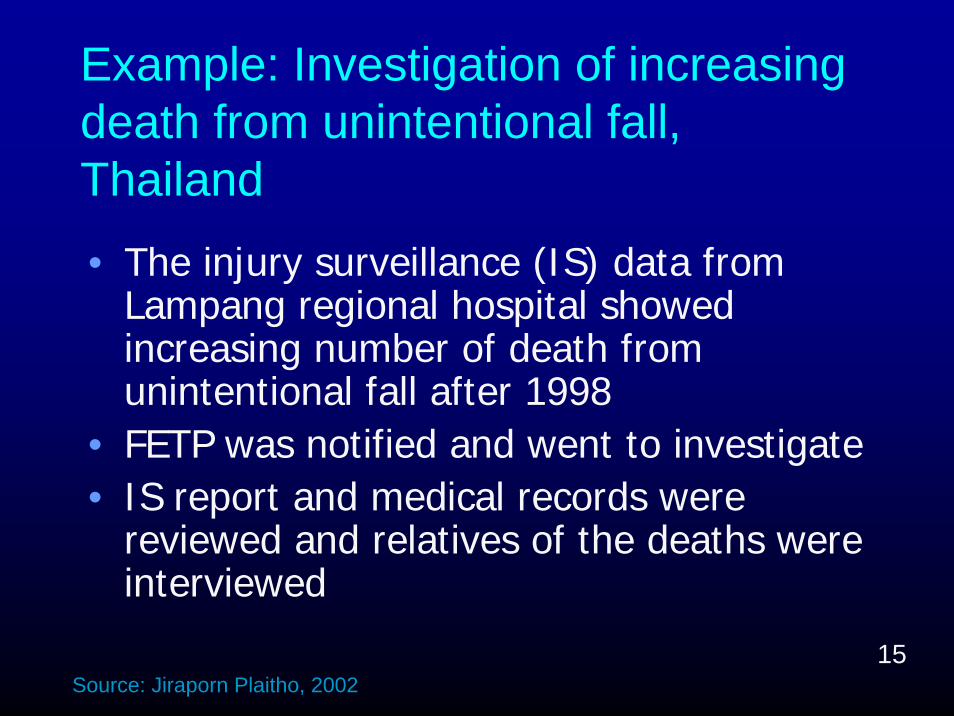
Example: Investigation of increasing death from unintentional fall, Thailand
• The injury surveillance (IS) data from Lampang regional hospital showed increasing number of death from unintentional fall after 1998
• FETP was notified and went to investigate• IS report and medical records were
reviewed and relatives of the deaths were interviewed
Source: Jiraporn Plaitho, 2002

16
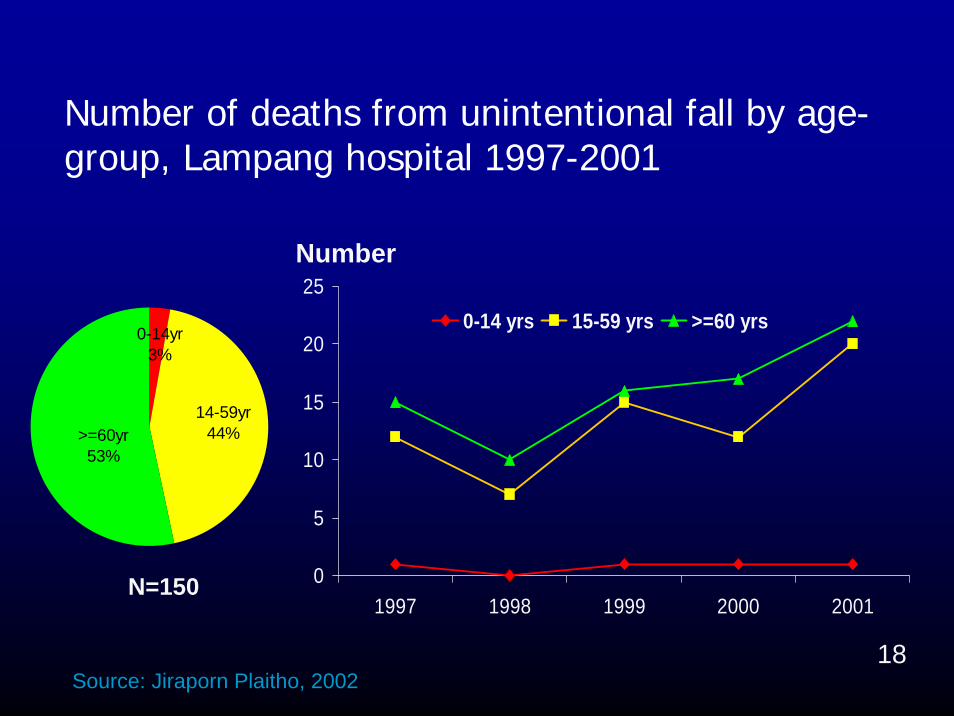
Number of deaths from unintentional fall by year and age-group, Lampang hospital 1997-2001
Source: Jiraporn Plaitho, 2002
Age 1997 1998 1999 2000 2001
0-14 yr 1 0 1 1 1
15-59 yr 12 7 15 12 20
>=60 yr 15 10 16 17 22
17
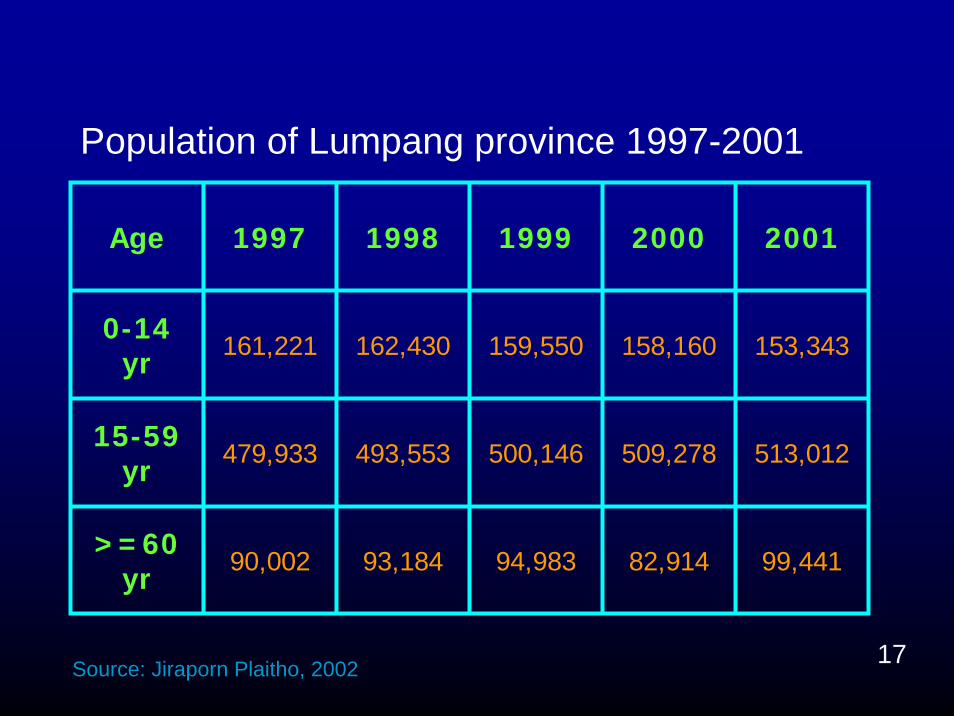
Population of Lumpang province 1997-2001
Age 1997 1998 1999 2000 2001
0-14 yr 161,221 162,430 159,550 158,160 153,343
15-59 yr 479,933 493,553 500,146 509,278 513,012
>=60 yr 90,002 93,184 94,983 82,914 99,441
Source: Jiraporn Plaitho, 2002
18
Number of deaths from unintentional fall by age-group, Lampang hospital 1997-2001
0
5
10
15
20
25
1997 1998 1999 2000 2001
0-14 yrs 15-59 yrs >=60 yrs0-14yr3%
>=60yr53%
14-59yr44%
Number
N=150
Source: Jiraporn Plaitho, 2002

19
Death rate of unintentional fall by age-group, Lumpang hospital 1997-2001
0
5
10
15
20
25
1997 1998 1999 2000 2001
0-14 yrs 15-59 yrs >=60 yrs
14-59yr44%>=60yr
53%
0-14yr3%
Rate per 100,000 pop
N=150
Source: Jiraporn Plaitho, 2002
rate ?

20
DISEASE FREQUENCY
Disease frequency is usually measured as a proportion or rate in which:
• Numerator reflects the number of cases or events of interest
• Denominator reflects the size of a population from which those cases or events are identified

21
TYPES OF FREQUENCY MEASURES
Distinguished by type of numerator• Incidence: the numerator reflects
the number of new cases identified during a given period.
• Prevalence: the numerator reflects the number of existing casesidentified at a point in time.

22
Incidence and Prevalence

23
PREVALENCE MEASURES
Prevalence is the frequency of existing cases

24
Prevalence is calculated by:
Number of people with the disease or condition at a specific time
P =Total population at a specific time

25
1 existing case at a point in time in a population of 5 babies
1Prevalence = = 0.2 = 20%
5
• Point prevalence is:
The proportion of the population affected by a disease at a specific point in time

26
PERIOD PREVALENCE
• Period prevalence is calculated by:
Number of incident and prevalent cases identified during a given period
• P =Size of the total population
during the period

27
3 existing case during a period of time in a population of 5 babies
3Period revalence = = 0.6 = 60%
5
• Period prevalence is:
The proportion of the population affected by a disease anytime during a given period

28
INTERPRETATION OF PREVALENCE
• Because prevalence reflects both incidence rate and disease duration, it is not as useful as incidence for studying causes of disease.
• It is useful for measuring disease burden on a population, especially if those who have the disease require specific medical attention.
29
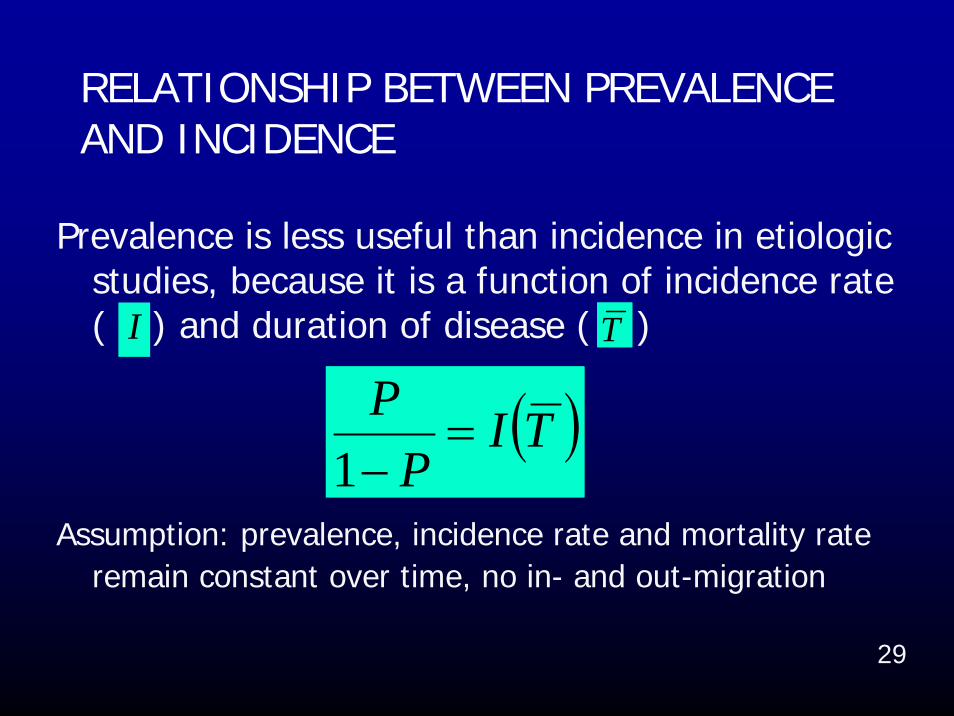
RELATIONSHIP BETWEEN PREVALENCE AND INCIDENCE
Prevalence is less useful than incidence in etiologic studies, because it is a function of incidence rate ( ) and duration of disease ( )
Assumption: prevalence, incidence rate and mortality rate remain constant over time, no in- and out-migration
( )TIP
P=
−1
TI

30
RELATIONSHIP BETWEEN PREVALENCE AND INCIDENCE
If the disease is rare,
= mean duration of diseaseAssumption: prevalence, incidence rate and
mortality rate remain constant over time, no in- and out-migration
( )TIP ≈
T

31
FACTORS INFLUENCING OBSERVED PREVALENCE
Increase/Decrease
Out-migration of cases
Longer duration of the diseaseHigh case fatality rateDecrease in incidence
In-migration of healthy people
Improved diagnostic facilitiesBetter reportingImproved cure rate
Source: WHO, 1994

32
The proportion of infants who are born alive with a defect of the ventricular septum of the
heart is a prevalence or incidence?

33
Risk and Rate

34
INCIDENCE MEASURES: RISK AND RATE
Distinguished by type of denominator• Risk (cumulative incidence, incidence
proportion): probability of the event• Incidence rate (incidence density): rate
estimate expresses the “rate” at which the events occur in the population at risk at any given point in time

35
RISK AND INCIDENCE PROPORTION
• Risk is measured on the same scale and interpreted in the same way as a probability.
• We use risk to describe the probability that a person will develop a given disease.
• Risk is used in reference to a single person• Incidence proportion is often used in
reference to a group of people• We use average taken from population to
estimate the risk experience by individuals
36
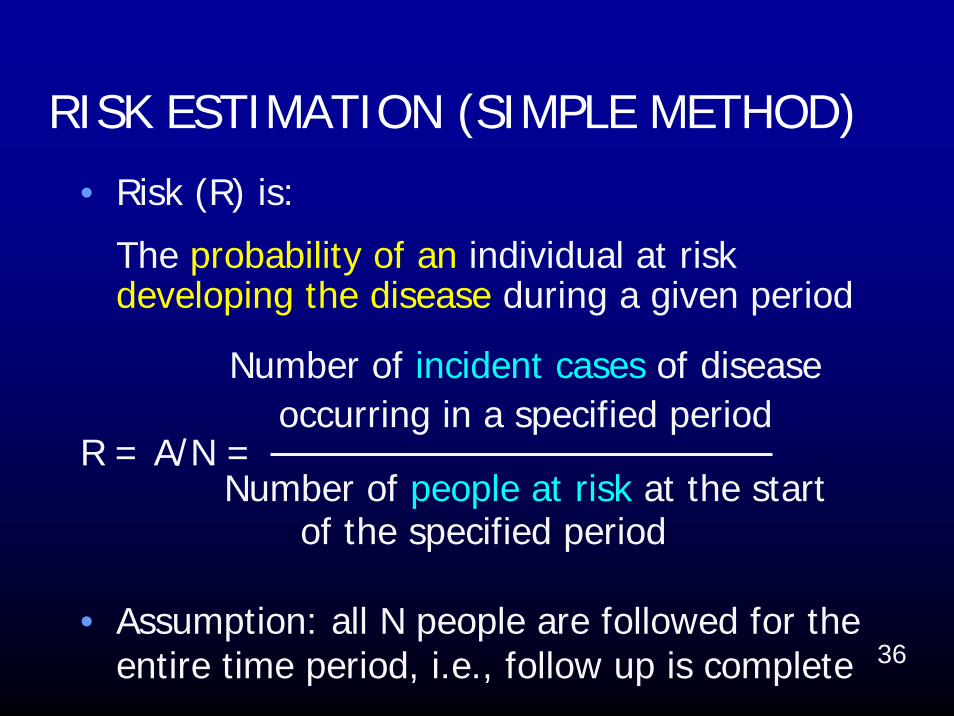
RISK ESTIMATION (SIMPLE METHOD)
• Risk (R) is:
The probability of an individual at risk developing the disease during a given period
Number of incident cases of disease occurring in a specified period
R = A/N =Number of people at risk at the start
of the specified period
• Assumption: all N people are followed for the entire time period, i.e., follow up is complete

37
When did your last health check up?
If you can choose to have either total cholesterol equal 7 or 8 mmol/l*, which level do you want?
Why?
*High total cholesterol defined as a total cholesterol level of 6.2 mmol/l or highermmol/l = mg% X 0.02586
If you interview SARS patients, will you wear full PPE (personal protection equipments),
compared to interview measlespatients? Why?

38
HYPOTHETICAL COHORT
Incidence is best understood in the context of prospective (cohort) studies
• In a typical cohort, censored observations can occur when individuals dying from other diseases or recruited later in the accrual period of the study, or migration

39
Hypothetical cohort of 10 persons followed for up to 24 months, Jan 96-Dec 98
Modified from fig. 2-1 in M. Szklo, F. Nieto. Epidemiology Beyond the Basics. Maryland: Aspen Publishers; 2000
Individuals12345678910
Jan-
96
Mar-9
6
May-
96
Jul-9
6
Sep-
96
Nov-
96
Jan-
97
Mar-9
7
May-
97
Jul-9
7
Sep-
97
Nov-
97
Jan-
98
Death
Censored observation
Follow-uptime

40
The same hypothetical cohort, started from the beginning of the study
0 4 8 12 16 20 24
12345678910
Individuals
Months of follow-up
1172092416213103
Total time under observation
Death
Censored observation
Follow-uptime
Modified from fig. 2-1 in M. Szklo, F. Nieto. Epidemiology Beyond the Basics. Maryland: Aspen Publishers; 2000

41
0 4 8 12 16 20 24
12345678910
Individuals
Months of follow-up
1172092416213103
Total time under observation
Death
Censored observation
Follow-uptime
Death = 6
Pop. at start = 10
Risk estimated from simple method
Risk of dying = 6/10 = 0.6 in 2 years

42
INTERPRETATION OF RISK• The only way to interpret a risk is to know
the length of the time period over which the risk applies.
• This time period may be short or long, but without identifying it, risk values are not meaningful
• Over a very short time period, the risk of any particular disease is usually extremely low. What is the probability that a given person will develop a disease in the next 5 minutes?

43
ATTACK RATEAn attack rate (AR) is a risk of becoming
afflicted with a condition during an epidemic period, applied to a defined population observed for a limited time.
• Attack rate is calculated by:
Number of incident cases during an epidemic period
AR =Population at risk at the beginning
of the epidemic period

44
SECONDARY ATTACK RATE
Is the attack rate among susceptible people who come into direct contact with primary cases
• Secondary attack rate is calculated by:
Number of incident cases among contacts of primary cases during the epidemic period
=Total number of contacts

45
RATE (INCIDENCE DENSITY)
• The occurrence of new cases at a point in time t, per unit of time, relative to the size of the population at risk at time t
• Denominator for incidence rate is total person-time for the study period (the sum of person-time contributed to by each individual)

46
INCIDENCE RATE ESTIMATIONWhen data on the timing of events or losses
are available from a defined cohort• We used incidence rate to measure
disease occurrence by dividing number of cases by a measure of time
• Because the instantaneous rate for each individual cannot be directly calculated, average incidence over a period of time for a population is used

47
TIME MEASURE IN INCIDENCE RATE
• This time measure is the summation, across all individuals, of time experienced by population being followed
• This denominator should include all of the time that each person was at risk of getting the outcome
• Average incidence rate can be calculated based on individual data or aggregate FU data

48
Rate: the occurrence of an event in a population over time
Number of incident cases of disease occurring in a specified period
I =Amount of person-time experienced by
population at risk in the same period
INCIDENCE RATE ESTIMATION BASED ON INDIVIDUAL DATA

49
0 4 8 12 16 20 24
12345678910
Individuals
Months of follow-up
1172092416213103
Total time under observation
Death
Censored observation
Follow-uptime
Total number of event = 6
Total amount of FU time
for all individuals is = 115
Rate = 6/115 = 0.052 per person-month
= 5.2 per 100 person-month
= 0.63 per person-year
50
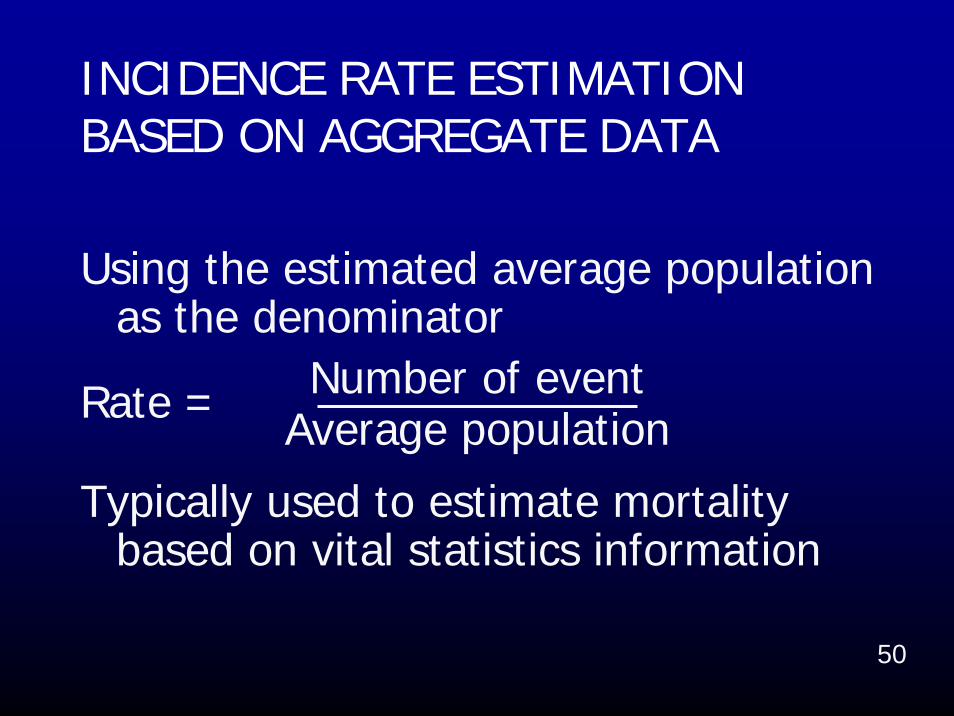
INCIDENCE RATE ESTIMATION BASED ON AGGREGATE DATA
Using the estimated average population as the denominator
Number of eventRate = Average population
Typically used to estimate mortality based on vital statistics information

51
ESTIMATE AVERAGE POPULATIONAssume that the period is not long and
population and its demographic composition in the area of interest are stable
• Population at the middle of the period• Average of the population at the
beginning and at the end of the period• Subtracting one half of the events and
losses from the initial population

52
0 4 8 12 16 20 24
12345678910
Individuals
Months of follow-up
1172092416213103
Total time under observation
Death
Censored observation
Follow-uptime
n = (10+1)/2 = 5.5
n = 10 - 0.5(6+3) = 5.5
Rate = 6/5.5 = 1.09 per 2 person-yearor
0.55 per person-year
53
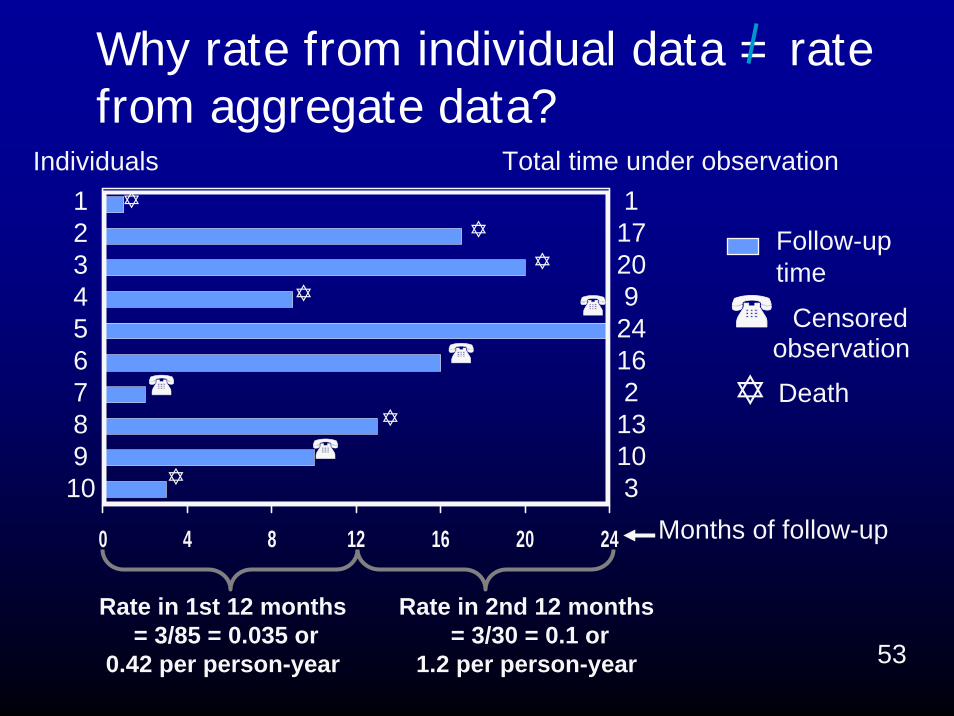
0 4 8 12 16 20 24
12345678910
Individuals
Months of follow-up
1172092416213103
Total time under observation
Death
Censored observation
Follow-uptime
Why rate from individual data = rate from aggregate data?
Rate in 1st 12 months = 3/85 = 0.035 or
0.42 per person-year
Rate in 2nd 12 months = 3/30 = 0.1 or
1.2 per person-year

54
COMPARISON OF INCIDENCE PROPORTION (RISK) AND INCIDENCE RATE
Property Risk Rate
Smallest value 0 0
Greatest value 1 Infinity
Units None 1/time
Interpretation Probability Inverse of waiting time

55
In Thailand, speed limit for 4-wheel cars on an express way is 110 km/hr
What measure?
Compute to meters per minute
The unit of time in the denominator is arbitrary and has no implication
for any period of time over which the rate is measured or applies
56
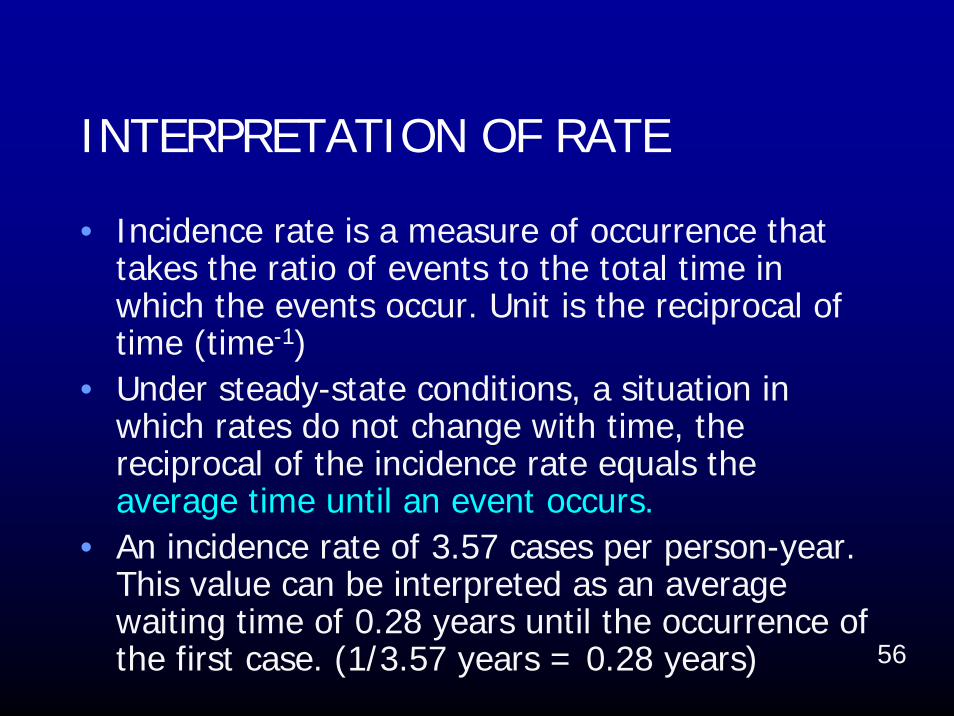
INTERPRETATION OF RATE
• Incidence rate is a measure of occurrence that takes the ratio of events to the total time in which the events occur. Unit is the reciprocal of time (time-1)
• Under steady-state conditions, a situation in which rates do not change with time, the reciprocal of the incidence rate equals the average time until an event occurs.
• An incidence rate of 3.57 cases per person-year. This value can be interpreted as an average waiting time of 0.28 years until the occurrence of the first case. (1/3.57 years = 0.28 years)

57
RELATION BETWEEN RISK AND RATE
Risk = Incidence Rate X Time
• This simplest formula is an approximation that works well as long as risk is < 20%
• Assumption: Incidence rate remains constant over the time period

58
Suppose we have a population of 1000 people who experience a mortality rate of 12 deaths per 1000 person-year for a 20-year period
At the end of 20-year period, how many deaths occur?
•The previous formula predicts that the risk of death over 20 years would be (12/1000)*20 = 0.24•This calculation neglects that size of population at risk decreases as deaths occur.

59
Year Number alive at start of year
Expected Deaths
Cumulative Deaths
1 1,000 12 122 988 12 243 976 12 364 964 12 475 953 11 596 941 11 707 930 11 818 919 11 929 908 11 103
10 897 11 11411 886 11 12412 876 11 13513 865 10 14514 855 10 15615 844 10 16616 834 10 17617 824 10 18618 814 10 19519 805 10 20520 795 10 215
Number of expected deaths over 20 years among 1000 people experiencing a mortality rate of 12 deaths per 1000 person-year
(Rothman 2002)
60
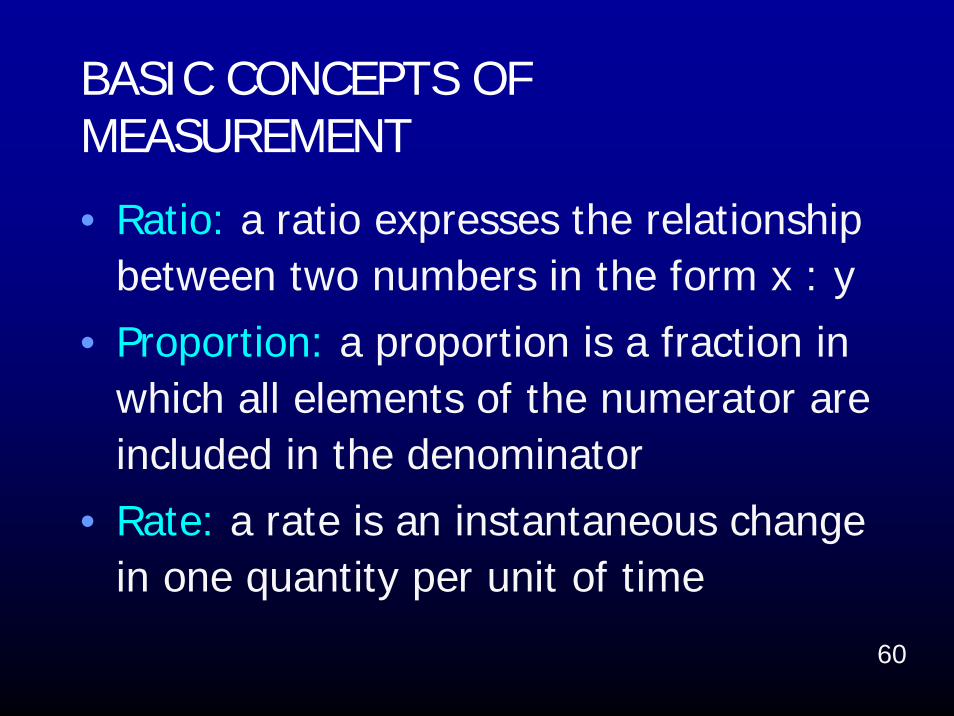
BASIC CONCEPTS OF MEASUREMENT
• Ratio: a ratio expresses the relationship between two numbers in the form x : y
• Proportion: a proportion is a fraction in which all elements of the numerator are included in the denominator
• Rate: a rate is an instantaneous change in one quantity per unit of time

61
Number of deaths in a year of children less than 1 year of age
= Number of live births in the same year
• Perinatal mortality: 28 wks gestation 1 wk of life
• Neonatal mortality: 1st month of life
• Post neonatal mortality: 1 month 1 year
INFANT MORTALITY RATIO (IMR)

62
MORTALITY MEASURES• As with incidence, the frequency of death can
be expressed as a risk (probability) in individuals or as a rate (hazard) in populations
• 3 types of mortality frequency measures:– case fatality: death from a specific disease
among cases with that disease– total mortality: all deaths in the total
population– disease-specific mortality: death from a
specific disease in the total population

63
CASE FATALITY
• Case fatality risk (CFR) is defined as:The probability of a case dying from the
disease during a given period• CFR is calculated by:
Number of deaths from a disease during a specified period after disease occurrence
CFR =Number of incident cases of the disease
during that period

64
TOTAL MORTALITY
• Total mortality risk, also called crude mortality risk (CMR), is calculated by:
Total number of deaths during a specified period
CMR =Total number of population at baseline

65
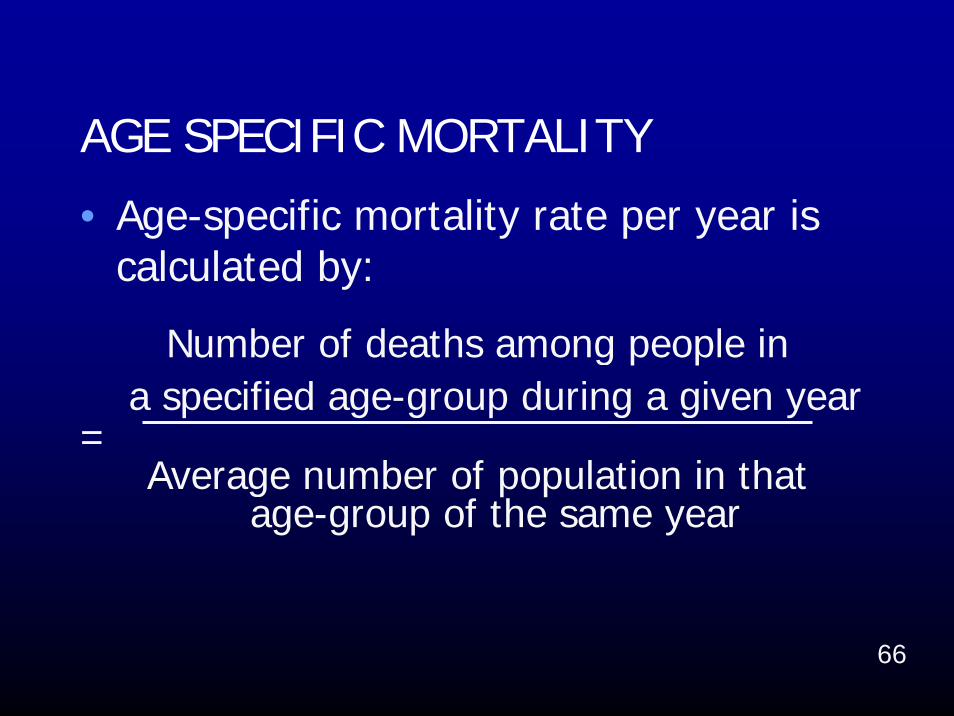
SPECIFIC MORTALITY
• Disease-specific mortality risk is calculated by:
Number of deaths from a disease during a specific period
=Total number of population at baseline
• Other specific mortality--e.g., age-specific mortality, sex-specific mortality
66
AGE SPECIFIC MORTALITY
• Age-specific mortality rate per year is calculated by:
Number of deaths among people in a specified age-group during a given year
=Average number of population in that
age-group of the same year

67
EXAMPLE

68
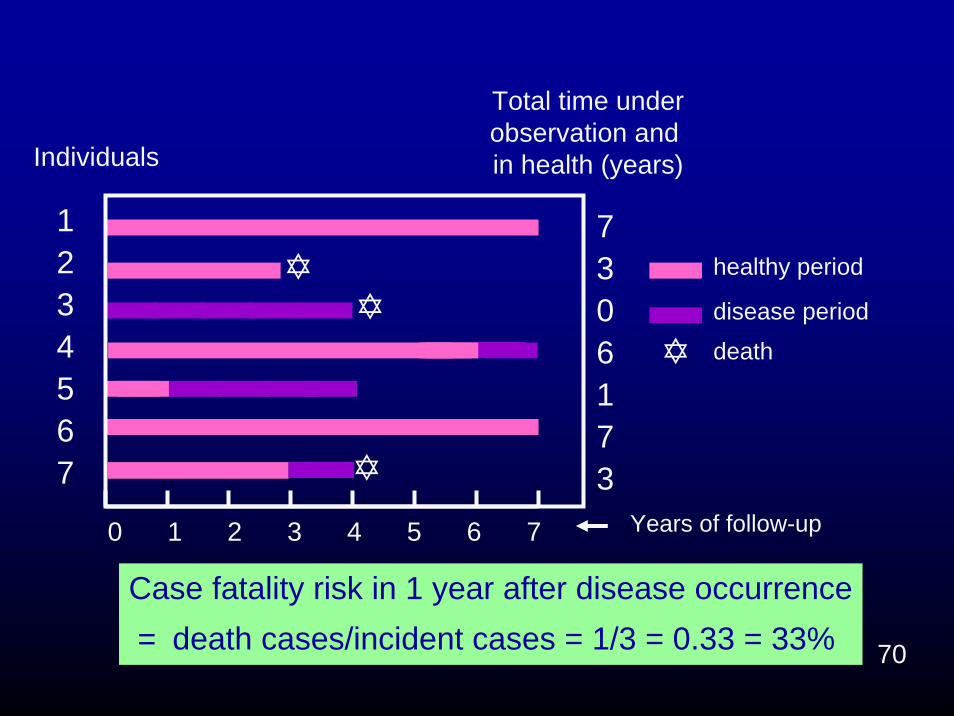
1234567
Individuals
Total time underobservation and in health (years)
0 1 2 3 4 5 6 7
7306173
Years of follow-up
healthy period
disease period
death
7-yr risk of disease (simple estimation) = 3/6 = 0.5 = 50%

69
1234567
Individuals
Total time underobservation and in health (years)
0 1 2 3 4 5 6 7
7306173
Years of follow-up
PT = 7+3+6+1+7+3 = 27 person-yearsAverage incidence rate for 7-year follow-up period =
healthy period
disease period
death
incident cases/PT = 3/27 = 0.11 / person year
70
1234567
Individuals
Total time underobservation and in health (years)
0 1 2 3 4 5 6 7
7306173
Years of follow-up
healthy period
disease period
death
Case fatality risk in 1 year after disease occurrence= death cases/incident cases = 1/3 = 0.33 = 33%

71
1234567
Individuals
Total time underobservation and in health (years)
0 1 2 3 4 5 6 7
7306173
Years of follow-up
healthy period
disease period
death
7-year total mortality risk = death cases/total pop. = 3/7 = 0.43 = 43%

72
Error! Error!
Cumulative Number of Reported Probable Cases Of SARSFrom: 1 Nov 20021 To: 2 June 2003, 18:00 GMT+2
- SARS Travel Recommendations Summary Table - 2 June
Country
Cumulativenumberof case(s)2
Number ofnew casessince lastWHOupdate2,3
Numberofdeaths
Numberrecovered4
Date lastprobablecasereported
Date for whichcumulativenumber of casesis current
Total 8384 27 770 5402
Notes:
Cumulative number of cases includes number of deaths.
As SARS is a diagnosis of exclusion, the status of a reported case may change over time. Thismeans that previously reported cases may be discarded after further investigation and follow-up.
Exercise: Compute case fatality ratio, case fatality risk, case fatality rate
73
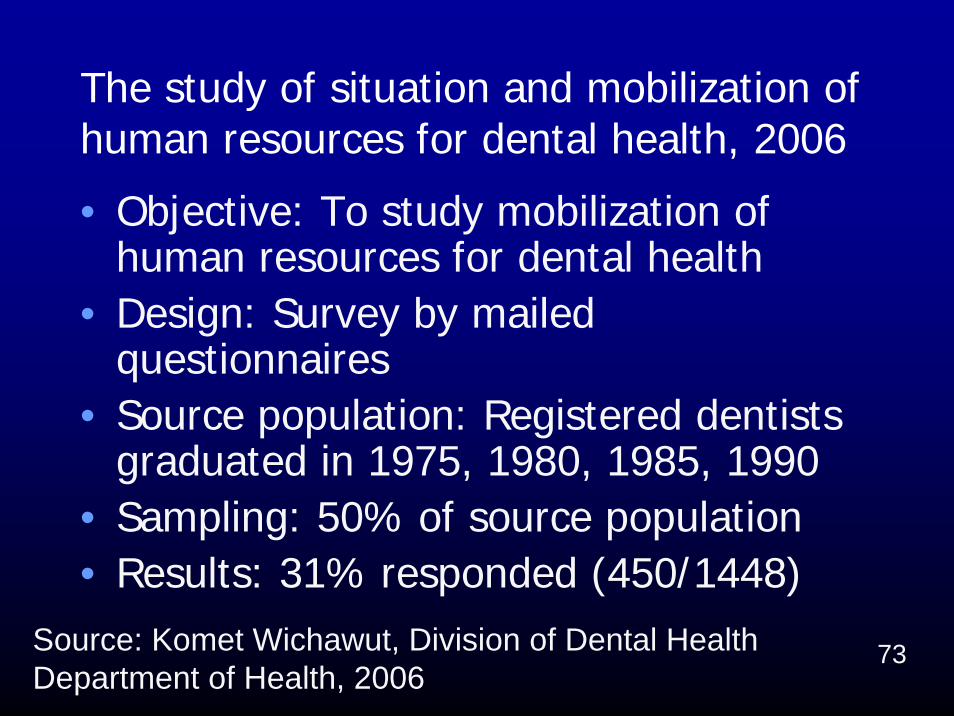
The study of situation and mobilization of human resources for dental health, 2006
• Objective: To study mobilization of human resources for dental health
• Design: Survey by mailed questionnaires
• Source population: Registered dentists graduated in 1975, 1980, 1985, 1990
• Sampling: 50% of source population• Results: 31% responded (450/1448)
Source: Komet Wichawut, Division of Dental HealthDepartment of Health, 2006

74
Proportion of dentists employed in government workforce by work year in service, 2006
403020100
1.1
1.0
.9
.8
.7
.6
.5
1975
1980
1985
1990
Graduation Year
Work Year in Service

75All PIX from Royal Flora Expo 2006