quantitative postural load assesment
TRANSCRIPT

8/8/2019 Quantitative Postural Load Assesment..
http://slidepdf.com/reader/full/quantitative-postural-load-assesment 1/15
Invited Plenary Paper
Quantitative postural load assessment for wholebody manual tasks based on perceived discomfort
MIN K. CHUNG{*, I. LEE{ and DOHYUNG KEE§
{Division of Mechanical and Industrial Engineering, Pohang University of Science and
Technology, Hyoja San 31, Pohang 790 – 784, Korea
{Department of Safety Engineering, Hankyong National University, Ansung, Korea§Department of Industrial and Systems Engineering, Keimyung University, Daegu,
Korea
Many Korean workers are exposed to repetitive manual tasks or prolonged poor
working postures that are closely related to back pain or symptoms of
musculoskeletal disorders. Workers engage in tasks that require not only
handling of heavy materials, but also assuming prolonged or repetitive non-
neutral work postures. Poor work postures that have been frequently observed in
the workplaces of shipbuilding shops, manufacturing plants, automobileassembly lines and farms often require prolonged squatting, repetitive arm
raising and wrist flexion and simultaneous trunk flexion and lateral bending. In
most manufacturing industries, workers have to assume improper work postures
repetitively, several hundreds of times per day depending on daily production
rate. A series of psychophysical laboratory experiments were conducted to
evaluate the postural load at various joints. A postural load assessment system
was then developed based on a macro-postural classification scheme. The
classification scheme was constructed based on perceived discomfort for various
joint motions as well as previous research outcomes. On the basis of the
perceived discomfort, postural stress levels for the postures at individual joints
were also defined by a ratio scale to the standing neutral posture. Laboratory
experiments simulating automobile assembly tasks were carried out to
investigate the relationship between body-joint and whole-body discomfort.
Results showed a linear relationship between the two types of discomfort, with
the shoulder and low back postures being the dominant factor in determining the
whole body postural stresses. The proposed method was implemented into a
computer software program in order to automate the procedure of analysing
postural load and to enhance usability and practical applicability.
Keywords: Repetitive tasks; Postural load; Discomfort; Stress.
*Corresponding author. Email: [email protected]
Ergonomics, Vol. 48, No. 5, 15 April 2005, 492 – 505

8/8/2019 Quantitative Postural Load Assesment..
http://slidepdf.com/reader/full/quantitative-postural-load-assesment 2/15
1. Introduction
Among the current global workforce of 2.6 billion (over 45% of the world’s population),
approximately 30% of the workforce in developed countries and 50 – 70% in developing
countries are exposed to heavy physical workloads or ergonomically poor working
conditions. These conditions involve lifting and moving heavy items and repetitivemanual tasks (World Health Organization 1997). Such tasks often lead to musculoske-
letal disorders and serious injuries. Work-related musculoskeletal disorders (WMSDs)
have been recognized as a serious social problem because of the rising costs of wage
compensation, medical expenses, reduced productivity and lower quality of life (Ayoub
and Mital 1989, Ayoub 1992, Chaffin et al . 1999). In many developed countries, WMSDs
are the main cause of both short-term and permanent work disability, leading to
economic losses that amount to as much as 5% of the gross national product (World
Health Organization 1997). In the USA, it has been reported that as many as 2% of the
entire workforce suffers from a WMSD every year and these disorders account
disproportionately for over one-third of all worker compensation costs for medical care
and lost wages (Faucett et al . 2002).
In Korea, the prevalence of WMSDs, including low back injuries, has increased
considerably (see figure 1; Korea Occupational Safety and Health Agency 2002). When
Korea was experiencing economic problems in 1997 and 1998, the number of yearly
compensated workers for WMSDs was less than 250. That number increased to 1598 in
2001. The steep increasing trend is expected to continue for several years, since the
compensation for WMSDs began in the mid 1990s. It is presumed that there are many
latent injured workers who have been exposed to the risk factors of WMSDs for a long
time. As information on WMSDs spreads in society, the social compensation costs for
WMSDs will increase significantly.
It has been known that WMSDs are caused by multi-factorial operations of variousrisk factors such as working posture, repetitive and forceful activities and static muscle
load (Kroemer 1989, Hagberg et al . 1995, Bernard 1997, Kumar 2001). Among these, the
association of poor body postures with pain or symptoms of musculoskeletal disorders
has been reported in a number of studies (van Wely 1970, Grandjean and Hu ¨ nting 1977,
Westgaard and Aara ˚ s 1984, Armstrong 1986, Putz-Anderson 1988, Armstrong et al .
1993).
Figure 1. Number of the injured of work-related musculoskeletal disorders in Korea
(Korea Occupational Safety and Health Agency 2002).
Quantitative postural load assessment 493

8/8/2019 Quantitative Postural Load Assesment..
http://slidepdf.com/reader/full/quantitative-postural-load-assesment 3/15
In many typical manufacturing settings in Korea, a majority of workers perform their
jobs by assuming prolonged or repetitive non-neutral work postures. In addition, since
there exist cross-cultural variations in postural habits (Bridger 1991, Kroemer et al . 1994,
Chung et al . 2003b), Koreans frequently assume postures that are not familiar to
Westerners, such as deep squatting, kneeling and cross-legged sitting. Figure 2 illustrates
examples of poor working postures frequently observed in Korea. Included are prolongedsquatting, repetitive arm raising and wrist flexion, simultaneous trunk flexion and lateral
bending. These postures occur in shipbuilding shops, manufacturing plants, automobile
assembly lines and farms. In most manufacturing industries, workers are required to
assume improper work postures repetitively, more than several hundred times per day
depending on the daily production rate.
For ergonomics interventions for such tasks, it is not sufficient to rely solely on
biomechanical and/or physiological approaches to assess exposure to the risks of
WMSDs, because a majority of these tasks do not require much handling of heavy
materials or dynamic motions. Instead, the methods that focus on the evaluation of
postural stresses need to be used quantitatively and objectively. These include
observational methods, instrumental or direct methods, self-reports and other
psychophysical methods (Genaidy et al . 1994, Winkel and Mathiassen 1994, Li and
Buckle 1999). Among them, the observational techniques are more widespread in
industry than other techniques. Observational methods provide relatively reliable
information about the risks of WMSDs while neither interfering with job process nor
Figure 2. Typical examples of poor working postures in Korea.
494 Min K. Chung et al.

8/8/2019 Quantitative Postural Load Assesment..
http://slidepdf.com/reader/full/quantitative-postural-load-assesment 4/15
requiring the use of equipment for recording body postures (Genaidy et al . 1994, Kilbom
1994, Winkel and Mathiassen 1994).
Several observational techniques have been reported in the ergonomics literature
(Genaidy et al . 1994, Li and Buckle 1999, Lee 2002). In many of these techniques, a
postural classification system was defined by dividing the range of motion (ROM) into a
series of ranges. Work analysts then used the classification system for recording workpostures and evaluating postural load. While many postural classification systems have
been developed to enhance the reliability of observation by adopting macro-postural
classification (Genaidy et al . 1994), few studies have presented definite criteria for the
classification of postures. Only a few postural classification schemes are equipped with
criteria for evaluating postural workload. Although some methods, such as OWAS
(Ovako Working Posture Analysis System), RULA (Rapid Upper Limb Assessment) and
REBA (Rapid Entire Body Assessment), have adopted procedures for evaluating
postural stresses (Karhu et al . 1977, McAtamney and Corlett 1993, Hignett and
McAtamney 2000), they are based on the subjective ratings of experts instead of a more
objective basis (Genaidy et al . 1994, Juul-Kristensen et al . 1997, Kee and Karwowski
2001).
In this study, a psychophysical approach was adopted in evaluating postural load and
classifying joint motions based on the level of perceived discomfort. There have been
several experimental studies to assess postural load based on the perceived discomfort for
static joint postures or motions (Putz-Anderson and Galinsky 1993, Genaidy et al . 1995 ,
Kee and Karwowski 2001). Putz-Anderson and Galinsky (1993) adopted a psycho-
physical approach to determine work durations for limiting shoulder-girdle fatigue in a
set of experiments. They showed that psychophysically determined work durations
significantly decrease as task loading variables such as repetition rate, required force, tool
weight and reach height increase. Genaidy et al . (1995) reported a ranking system for the
stressfulness of non-neutral static postures around the wrist, elbow, shoulder, neck andlower back, based on perceived discomfort. Kee and Karwowski (2001) proposed a
postural classification scheme for the upper body based on perceived joint discomfort.
These studies adopted a psychophysical approach rather than using other objective
measures such as electromyographic signals, from which it is very difficult to quantify the
stress of static postures.
This study is intended to develop a quantitative and practically useful methodology
for evaluating postural stresses based on psychophysical discomfort. An observation
method with a macro-postural classification scheme was developed based on a series of
experiments in which stresses of static postures were evaluated psychophysically. In the
experiments, perceived discomfort for various static postures at each joint wasevaluated. The perceived discomfort data were used in determining the level of postural
stresses for each classified posture in the postural classification. In addition, the
relationship between body-joint discomfort and whole-body discomfort was investi-
gated based on the results of another experiment in which the whole-body postural
discomforts for various static work postures were evaluated. Finally, the proposed
method was implemented into a computer program in order to enhance its usability
and practical applicability.
2. Psychophysical evaluation of various static postures
Three different lab experiments were conducted to measure perceived discomfort for the
upper-body (Experiment 1a), leg (Experiment 1b) and complex trunk postures
Quantitative postural load assessment 495

8/8/2019 Quantitative Postural Load Assesment..
http://slidepdf.com/reader/full/quantitative-postural-load-assesment 5/15
(Experiment 1c). Although the experiments were performed separately with different
subjects, the same experimental protocol was adopted. In each experiment, the subjects
were asked to maintain a given posture for a 1-min duration and then to report their
perceived discomfort for the posture.
2.1. Experimental methods
In Experiment 1a, participants were 19 male students. Means and standard deviations for
age, stature and weight were 25.4 (2.7) years, 171.9 (6.0) cm. and 67.1 (7.0) kg respectively.
Participants were required to report their perceived discomfort for varying postures of the
five upper-body joints, i.e. wrist, elbow, shoulder, neck and low back. For each joint
motion, perceived discomforts were measured at the five levels of joint angles that were
determined in terms of the percentage of range of joint motion (ROM): 0% (neutral
posture), 25%, 50%, 75% and 100% of ROM, respectively (Kee and Karwowski 2001).
In Experiment 1b, participants were 18 healthy male students. Means and standard
deviations for age, stature and weight were 3.1 (2.8) years, 174.4 (4.4) cm and 68.9 (5.2) kg
respectively. Thirty-one leg postures were tested in the experiment. The postures can be
grouped into six categories: standing; knee-flexed; one-foot; sitting; kneeling; and
unbalanced postures (Chung et al . 2003a).
In Experiment 1c, participants were 12 healthy male college students. The means and
standard deviations for age, stature and weight were 21.2 (2.1) years, 174.5 (5.1) cm and
66.9 (6.6) kg respectively. Participants evaluated 29 different ‘complex trunk postures’
that can be defined as trunk postures involving two or three trunk motions
simultaneously, such as flexion, lateral bending and rotation (Lee et al . 2003).
In evaluating perceived discomfort, the free-modulus magnitude estimation method
that is widely used in psychophysics to evaluate human sensations to a physical stimulus
was applied (Gescheider 1985). The participants numerically estimated their feelings of discomfort for a given posture without any standard stimulus and a corresponding
number or verbal anchor. Before conducting the main experiment, a pre-test was
conducted to familiarize participants with ratio judgement tasks and to screen out those
who lack the ability to perform a ratio judgement. In this study, ‘numeric estimation’ and
‘line production’ were used in the pre-test, because of their wide usage and practical ease
(Han et al . 1999).
The participant was asked to adopt the postures as instructed by the experimenters and
to maintain each posture for a 1-min duration. The postures were presented in a random
order for each subject. All subjects were allowed at least a 2-min rest period between
consecutive trials and a 15-min break every hour (Lee 2002).Since each participant usually assigns different numbers to a given stimulus in free-
modulus magnitude estimation (Gescheider 1985, Han et al . 1999), the discomfort rating
data were normalized by the maximum normalization method. The discomfort rating
scores were divided by the maximum discomfort rating data for each subject. For the
normalized data, ANOVA were performed to examine the effects of posture on perceived
discomfort. Duncan’s multiple range test was used to group the postures according to the
discomfort level at each joint (Montgomery 1991).
2.2. Upper body postures
The differences in discomfort ratings between joints were not noticeable at low-range
levels of joint motions. However, they became more obvious as the range of levels
496 Min K. Chung et al.

8/8/2019 Quantitative Postural Load Assesment..
http://slidepdf.com/reader/full/quantitative-postural-load-assesment 6/15
increases. Joint motions can be grouped into four categories by discomfort ratings at
100% ROM with significant differences (a= 0.05): 1) low back extension; 2) low back
flexion and lateral bending; 3) shoulder postures, low back rotation and neck extension;
4) the other postures in the neck, wrist and elbow. This result is somewhat different from
Genaidy et al . (1995), which showed that shoulder posture has the highest level of stress.
The difference may be due to different ranges of postures used in the experiment. Genaidyet al . (1995) did not consider the subject’s full range of motion in each joint motion.
In evaluating working postures, it should be noted that although there are some
differences in the order of stressfulness of joint motions, the postural load varies
according to the associated joint motion, as shown in many other studies (Genaidy and
Karwowski 1993, Genaidy et al . 1995).
Extension posture is not a common working posture as compared to other joint
motions such as low back flexion and shoulder flexion. However, it is necessary to include
extension postures in the evaluation of working postures, since this posture is found to
cause a higher level of load than other postures. Concerning joint motions in a joint,
extension showed higher discomfort ratings than other motions such as lateral bending,
flexion and rotation in the low back, neck and wrist. However, in the shoulder there were
no significant differences among joint motions. Specifically, low back extension should be
evaluated as a high-load inducing posture.
Figure 3 shows an example of the results of Experiment 1a: mean discomfort ratings
for the flexion and extension postures in the low back. The discomfort ratings for the two
motions of the low back showed a similar trend. All ranges showed statistically different
values of discomfort rating in low back flexion and extension (a= 0.05).
2.3. Leg postures
Knee flexion was found to be the most important factor for determining the discomfortlevel of leg postures. Other compounding factors, such as imbalance and one-foot
supporting condition, also increase the discomfort level. Most severely knee-flexed
postures with or without a combination of other factors showed a level of discomfort
significantly higher than other postures. Mildly knee-flexed postures also exhibited higher
discomfort than standing and sitting postures (see figure 4). The higher discomfort level
seems to be caused mainly by the contraction of large muscle groups of the thighs to
maintain the knee-flexed postures and an asymmetric postural burden in the imbalanced
postures.
Figure 3. Mean discomfort ratings for low back postures. (a) Flexion; (b) extension.
Quantitative postural load assessment 497

8/8/2019 Quantitative Postural Load Assesment..
http://slidepdf.com/reader/full/quantitative-postural-load-assesment 7/15
Kneeling postures showed the highest discomfort levels among the evaluated leg
postures. Kneeling postures with fully flexed knees and kneeling on a knee showed a
higher discomfort level than mildly knee-flexed postures, and kneeling with a knee angle
of 908 showed a significantly higher discomfort level than standing and sitting postures.
This outcome may occur because kneeling is an unstable posture, with the knees mainly
supporting body weight. It is also presumed that the high discomfort level for kneeling
with fully flexed knees resulted from fully contracted muscles in the thigh and shank
regions that restricted blood flow, resulting in the participant feeling numbness in the leg
region.
Most standing postures with variable heel distances included while tiptoeing showed a
higher discomfort level than other standing postures. Unbalanced standing also showed
relatively higher discomfort levels than balanced standing postures. This result impliesthat discomfort from standing postures is affected by supporting conditions rather than
feet position. Participants rated their discomfort for tiptoeing as double that of normal
standing; an outcome that seems attributable to the difficulty of maintaining balance
during tiptoeing.
Two floor sittings with flexed or straight knees showed a higher discomfort level than
sitting on a chair. In these postures it is difficult to maintain lumbar lordosis, which
results in an increased load on the lumbar region. However, being seated on the floor with
crossed legs showed a relatively lower discomfort level compared to other floor sittings.
This result may be explained by the common sitting habits of Korean people. The
discomfort level of the posture may be greater in other populations, such as Westernersnot accustomed to such a restricted posture.
As shown in figure 4, discomfort ratings increased as the knee angle decreased and the
‘balance’ factor moved from balanced to one-foot postures, i.e. the balancing condition
became worse. There was no significant interaction effect between the two factors. This
result implies that there is no synergetic effect of increasing postural discomfort by
simultaneously assuming several leg motions, such as knee flexed and unbalanced
postures.
2.4. Complex trunk postures
Postural stress increases synergistically as the angles of trunk motions increase in complex
trunk postures in which more than two trunk motions were adopted simultaneously (see
Figure 4. Mean discomfort ratings for leg postures. (a) Knee-flexed postures; (b) the
balanced, unbalanced and one-foot postures (*no significant difference at a= 0.05;
**knee angle in degree).
498 Min K. Chung et al.

8/8/2019 Quantitative Postural Load Assesment..
http://slidepdf.com/reader/full/quantitative-postural-load-assesment 8/15
figure 5). Statistically significant interaction effects were found between discomfort
ratings for trunk motions such as flexion, lateral bending and rotation (a= 0.05). The
effect of complex trunk postures on the synergistic increase of discomfort is more
manifest in severe trunk postures than in their moderate postures with smaller joint
angles. Interaction effects between trunk motions were significant only when severe
lateral bending (308) or rotation (908) were included. When only two levels of lateral
bending and rotation were considered, no significant interaction effects were found
between trunk motions.
3. Postural classification
Based on the results of the psychophysical experiments (Experiments 1a, 1b and 1c) andexisting literature, a macro-postural classification system was developed (see table 1). The
postural classification scheme consists of five body parts: arm; trunk; legs; wrist; and
neck. For each body part, postures were classified into three to six categories. These
categories consisted primarily of movements in the sagittal plane, such as flexion-
extension. This procedure enhances the applicability of the classification scheme by
improving ease of observation. For complex postures that involve more than two degrees
of freedom in the neck, trunk and legs, additional categories with motion in other planes
are provided, such as lateral bending, rotation and unbalance or awkwardness. Complex
postures can be recorded and assessed by combining the categories. For example, a
moderately bent trunk with lateral bending and rotation can be recorded as acombination of ‘moderate flexion’ and ‘lateral bending/rotation’.
For each classified posture, a discomfort score was assigned based on the ratio of
perceived discomfort for a certain posture to that for a neutral posture. The neutral
posture was presented in the preliminary classification of upper-body and leg postures.
Therefore, the discomfort score has ratio scale characteristics. The score ranges from 0.5
for sitting to 8 for a severely elevated arm.
A discomfort score for a complex posture such as a flexed and laterally bent trunk is
obtained by adding the discomfort score of the adjusting category to that of simple
postures. For example, the discomfort score for a moderately flexed and rotated trunk
can be calculated by adding the discomfort scores for moderate trunk flexion (4), lateral
bending and rotation ( + 5) and the adjusting discomfort score for the complex posture
(+1), i.e. 4 + 5 + 1=10.
Figure 5. Mean discomfort ratings for complex trunk postures. (a) Rotation and flexion
postures; (b) lateral bending and rotation postures.
Quantitative postural load assessment 499

8/8/2019 Quantitative Postural Load Assesment..
http://slidepdf.com/reader/full/quantitative-postural-load-assesment 9/15
This additive method is adopted based on the results of Experiments 1b and 1c. In
Experiment 1c, a synergistic increase of discomfort for complex trunk postures was
identified. Relative discomfort of a complex trunk posture to the neutral posture was
approximately the sum of relative discomfort for the included postures (Lee et al . 2003).
In Experiment 1b, no significant interaction effect was found between unbalanced leg
postures and knee flexion angle. The relative discomfort for unbalanced or awkward
Table 1. Postural classification scheme and the discomfort scores for classified postures
Body
part Category Code
Range
(8)
Discomfort
score
Arm* Neutral N (1) 0 – 45 (F), 0 –
20(E)
1
ModerateElevation
ME (2) 45 – 90 3
Severe Elevation SE (3) 90 – 135 5
Extreme
Elevation
EE (4) 4 135 8
Extension E (5) 4 20 5
Trunk Neutral N (1) 0 – 30 (F), 0 – 10
(E)
1
Moderate
Flexion
MF (2) 30 – 60 4
Severe Flexion SF (3) 60 – 90 7
Extension E (4) 4 10 7
Lateral Bending/Rotation** LBR (’) 4 10 (LB) 425(R) + 5 ( + 1)
Legs Standing STD (1) 0 – 30 1
Moderate knee
flexion
MKF (2) 30 – 60 2
Severe knee
flexion
SKF (3) 60 – 90 3
Squatting SQ (4) 4 90 3
Sitting ST (5) 0.5
Kneeling KNL (6) 2
Unbalance or
Awkward**
UA (’) + 1
Wrist* Neutral N (1) 0 – 25 (F, E) 1
Flexion F (2) 4 25 3Extension E (3) 4 25 3
Neck Neutral N (1) 0 – 20 (F), 0 – 25
(E)
1
Moderate
Flexion
MF (2) 20 – 45 2
Severe Flexion SF (3) 4 45 4
Extension E (4) 4 25 4
Lateral Bending/
Rotation**
LBR (’) 4 20 + 2 ( + 1)
*Discomfort scores for two wrists or arms are separately assessed and summed together. When two wrists
or arms are positioned in the neutral range, the discomfort score is 1.**Adjusting factors: When these postures are adopted with other joint motions simultaneously, the
discomfort score for the complex posture is obtained by adding two scores. In the neck and trunk, an
additional discomfort score of 1 is added to it when either flexion or extension is adopted simultaneously
with LBR.
500 Min K. Chung et al.

8/8/2019 Quantitative Postural Load Assesment..
http://slidepdf.com/reader/full/quantitative-postural-load-assesment 10/15
postures increased approximately by 1. Therefore, the adjusting factor of discomfort by
unbalance or awkwardness was set to 1 (Chung et al . 2003a).
4. Whole body postural stress prediction
A posture is determined by a combination of body joint motions such as wrist, elbow,shoulder, neck, lower back, knee and ankle. Hence, all body joint motions affect the
whole-body postural stresses. However, how each joint motion affects the whole-body
postural stress is complex and is not yet completely understood. Therefore, many existing
posture evaluation methods adopt a qualitative procedure based mainly on expert
opinion to combine each body joint motion stress into a stress level for the whole body
posture. In this study, the relationship between body joint motions and whole body
postural stresses was established for the representative working postures of automobile
assembly tasks.
In Experiment 2, 19 healthy male subjects rated their perceived discomfort for 42
different postures that were frequently observed during automobile assembly tasks. The
mean age, stature and weight of the subjects were 22.6 ( + 1.1) years, 173.0 (+ 3.5) cm
and 64.4 (+ 4.4) kg, respectively. The experimental protocol of Experiment 2 was the
same as that adopted in Experiment 1.
In selecting the postures to be evaluated in the experiment, the postural characteristics
of automobile assembly tasks were taken into account (Kim et al . 1998). The working
postures in the automobile assembly line vary depending on the assembled part of the
automobile. When performing the tasks inside or beneath the automobile frame, workers
often elevate their arms above shoulder level and extend their neck and trunk to work
over the head. Inside the car or engine area, squatting postures are assumed with a
severely flexed neck. With regard to the operators’ trunk postures, many workers often
adopt complex postures involving more than two simple trunk postures, such as flexion,extension, lateral bending and rotation. Extension of wrist occurs frequently when using
pneumatic hand tools.
A multiple linear regression analysis was performed to investigate the relationship
between whole-body discomfort ratings and joint discomfort scores. In the multiple-
linear regression model, five independent variables (discomfort scores for shoulders,
trunk, legs, wrists and neck) and one dependent variable, whole-body discomfort rating,
were considered. The result showed that the model was statistically significant ( p5 0.01)
with the coefficient of determination (R2) of 0.71 (see table 2). Tests for the null
hypothesis, i.e. H0: the slope parameter is 0, showed that four parameters (shoulders,
trunk, legs and neck) were significantly larger than 0 ( p5 0.01), thus rejecting the nullhypothesis; whereas, the parameter for wrist is not significantly larger than 0 ( p4 0.05).
From the regression result, it is presumed that a linear relationship exists between the
whole-body discomfort ratings and the joint discomfort scores. The variance of the
whole-body discomfort rating was explained as much as 71% by adopting the multiple
linear model. The coefficient of determination of 0.71 is high enough to accept the model
as an explanation for the relationship between whole-body discomfort ratings and the
joint discomfort scores.
The estimated coefficients of the independent variables were all positive, indicating that
the whole-body discomfort rating increases as the joint discomfort scores increase. The
legs have the highest coefficient value (5.82), followed by the neck (3.03), shoulders (2.27),
trunk (1.85) and wrists (1.09). However, it should be noted that independent variables
had different ranges of the discomfort score. The maximum discomfort scores for each
Quantitative postural load assessment 501
8/8/2019 Quantitative Postural Load Assesment..
http://slidepdf.com/reader/full/quantitative-postural-load-assesment 11/15
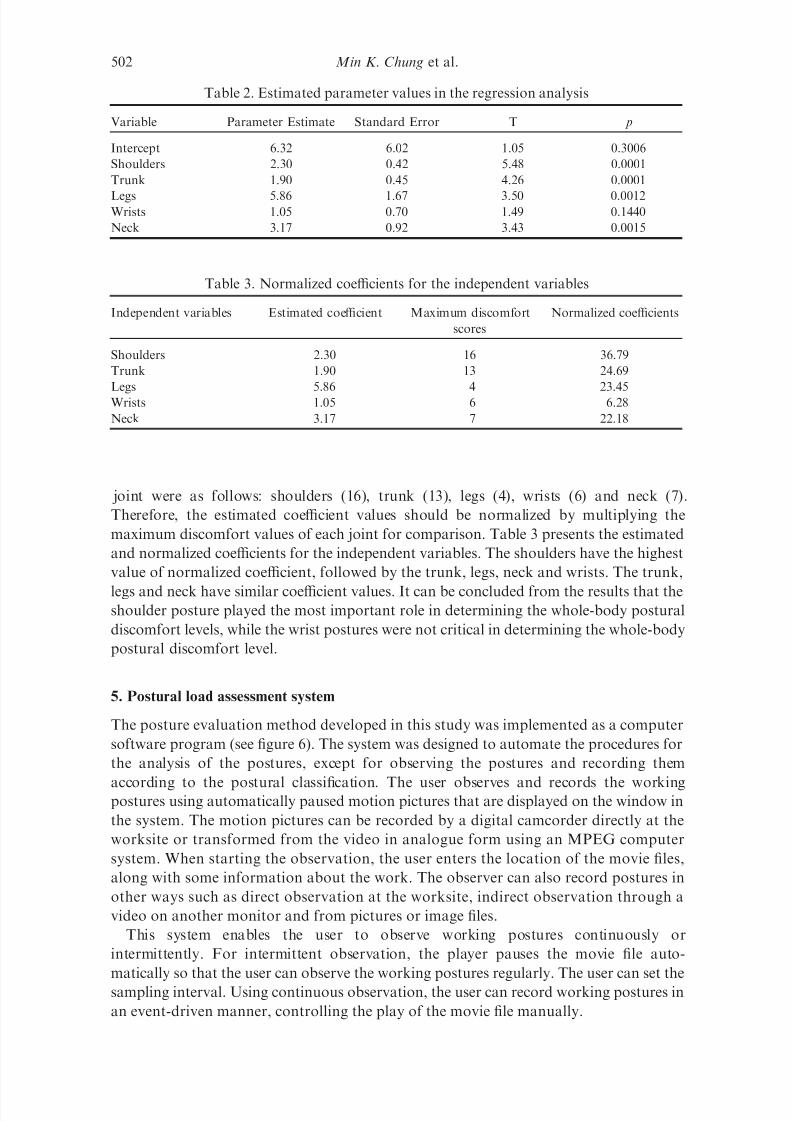
joint were as follows: shoulders (16), trunk (13), legs (4), wrists (6) and neck (7).
Therefore, the estimated coefficient values should be normalized by multiplying the
maximum discomfort values of each joint for comparison. Table 3 presents the estimated
and normalized coefficients for the independent variables. The shoulders have the highest
value of normalized coefficient, followed by the trunk, legs, neck and wrists. The trunk,
legs and neck have similar coefficient values. It can be concluded from the results that theshoulder posture played the most important role in determining the whole-body postural
discomfort levels, while the wrist postures were not critical in determining the whole-body
postural discomfort level.
5. Postural load assessment system
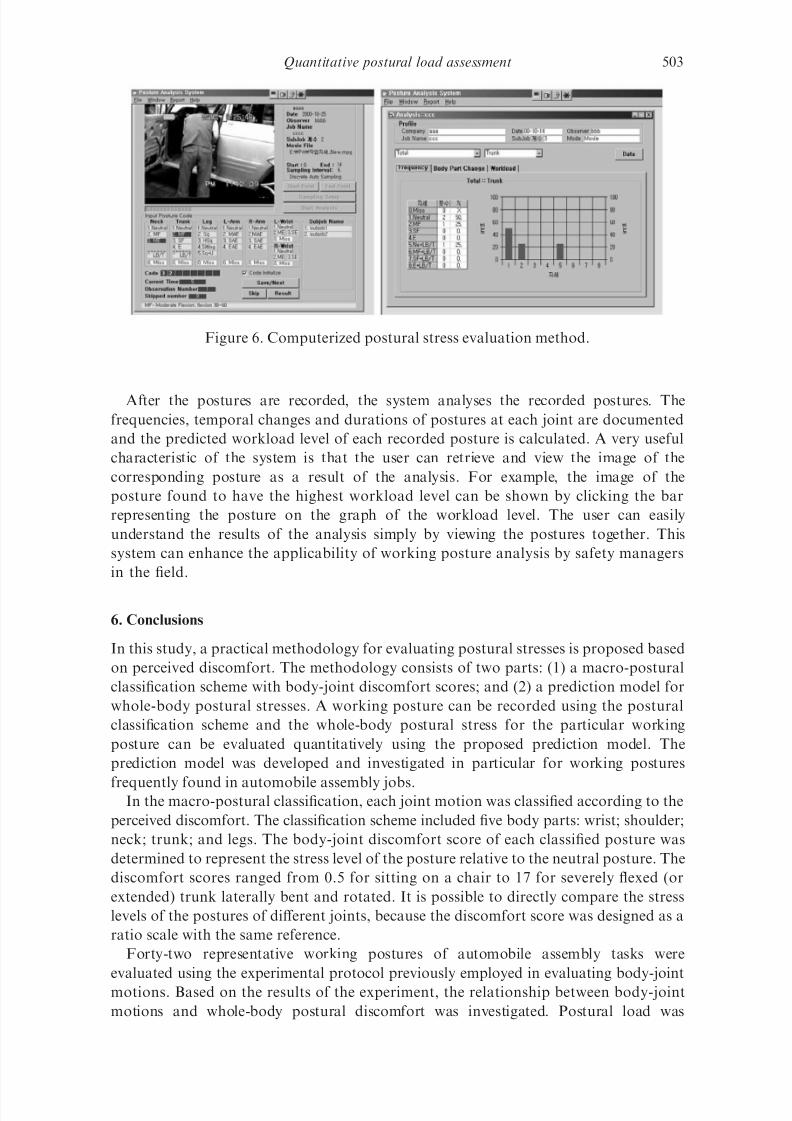
The posture evaluation method developed in this study was implemented as a computer
software program (see figure 6). The system was designed to automate the procedures for
the analysis of the postures, except for observing the postures and recording them
according to the postural classification. The user observes and records the workingpostures using automatically paused motion pictures that are displayed on the window in
the system. The motion pictures can be recorded by a digital camcorder directly at the
worksite or transformed from the video in analogue form using an MPEG computer
system. When starting the observation, the user enters the location of the movie files,
along with some information about the work. The observer can also record postures in
other ways such as direct observation at the worksite, indirect observation through a
video on another monitor and from pictures or image files.
This system enables the user to observe working postures continuously or
intermittently. For intermittent observation, the player pauses the movie file auto-
matically so that the user can observe the working postures regularly. The user can set the
sampling interval. Using continuous observation, the user can record working postures in
an event-driven manner, controlling the play of the movie file manually.
Table 2. Estimated parameter values in the regression analysis
Variable Parameter Estimate Standard Error T p
Intercept 6.32 6.02 1.05 0.3006
Shoulders 2.30 0.42 5.48 0.0001
Trunk 1.90 0.45 4.26 0.0001
Legs 5.86 1.67 3.50 0.0012Wrists 1.05 0.70 1.49 0.1440
Neck 3.17 0.92 3.43 0.0015
Table 3. Normalized coefficients for the independent variables
Independent variables Estimated coefficient Maximum discomfort
scores
Normalized coefficients
Shoulders 2.30 16 36.79
Trunk 1.90 13 24.69
Legs 5.86 4 23.45Wrists 1.05 6 6.28
Neck 3.17 7 22.18
502 Min K. Chung et al.
8/8/2019 Quantitative Postural Load Assesment..
http://slidepdf.com/reader/full/quantitative-postural-load-assesment 12/15
After the postures are recorded, the system analyses the recorded postures. The
frequencies, temporal changes and durations of postures at each joint are documented
and the predicted workload level of each recorded posture is calculated. A very useful
characteristic of the system is that the user can retrieve and view the image of the
corresponding posture as a result of the analysis. For example, the image of the
posture found to have the highest workload level can be shown by clicking the bar
representing the posture on the graph of the workload level. The user can easily
understand the results of the analysis simply by viewing the postures together. This
system can enhance the applicability of working posture analysis by safety managers
in the field.
6. Conclusions
In this study, a practical methodology for evaluating postural stresses is proposed based
on perceived discomfort. The methodology consists of two parts: (1) a macro-postural
classification scheme with body-joint discomfort scores; and (2) a prediction model for
whole-body postural stresses. A working posture can be recorded using the postural
classification scheme and the whole-body postural stress for the particular working
posture can be evaluated quantitatively using the proposed prediction model. The
prediction model was developed and investigated in particular for working postures
frequently found in automobile assembly jobs.In the macro-postural classification, each joint motion was classified according to the
perceived discomfort. The classification scheme included five body parts: wrist; shoulder;
neck; trunk; and legs. The body-joint discomfort score of each classified posture was
determined to represent the stress level of the posture relative to the neutral posture. The
discomfort scores ranged from 0.5 for sitting on a chair to 17 for severely flexed (or
extended) trunk laterally bent and rotated. It is possible to directly compare the stress
levels of the postures of different joints, because the discomfort score was designed as a
ratio scale with the same reference.
Forty-two representative working postures of automobile assembly tasks were
evaluated using the experimental protocol previously employed in evaluating body-joint
motions. Based on the results of the experiment, the relationship between body-joint
motions and whole-body postural discomfort was investigated. Postural load was
Figure 6. Computerized postural stress evaluation method.
Quantitative postural load assessment 503

8/8/2019 Quantitative Postural Load Assesment..
http://slidepdf.com/reader/full/quantitative-postural-load-assesment 13/15
strongly associated with the combination of non-neutral joint postures. The more joints
involved in a severely non-neutral position, the higher the level of whole-body postural
discomfort imposed. The relationship between body-joint motions and whole-body
postural stresses was examined using linear regression analysis. The analysis showed that
the linear model explained the relationship well. Using regression analysis, the shoulder
was found to be the most affecting factor for whole-body postural stresses, while the wristwas the least affecting factor. However, there should be caution over generalizing the
relationship, since it was obtained from an experiment limited to representative working
postures of automobile assembly tasks.
The proposed postural stress evaluation model was computerized to automate the
analysis of postures as conveniently as possible. The user is able analyse the postural
stresses by simply observing the postures and coding them according to the classification
system. Since the analysis results are closely associated with the images of the
corresponding postures, it is feasible for the user to understand the results and use
them to improve the work method in practical situations.
References
ARMSTRONG, T.J., 1986, Upper-extremity postures: definition, measurement and control. In The Ergonomics of
Working Postures: Models, Methods and Cases, E.N. Corlett, J. Wilson and I. Manenica (Eds), 59 – 73
(London, Taylor & Francis).
ARMSTRONG, T.J., BUCKLE, P. , FINE, L.J., HARBERG, M., JONSSON, B., KILBORN, A., KUORINKA, I.A.A.,
SILVERSTEIN, B.A., SJOGAARD, G. and VIIKARI-JUNTURA, E.R.A., 1993, A conceptual model for work-related
neck and upper-limb musculoskeletal disorders. Scandinavian Journal of Work, Environment and Health, 19,
73–74.
AYOUB, M.M., 1992, Problems and solutions in manual materials handling: the state of the art. Ergonomics, 35,
713– 728.
AYOUB, M.M. and MITAL, A., 1989, Manual Materials Handling. (London, Taylor & Francis).
BERNARD, B.(Ed.), 1997, Musculoskeletal Disorders and Workplace Factors: A Critical Review of Epidemiologic
Evidence for Work-related Musculoskeletal Disorders of the Neck, Upper Extremity, Low Backs, NIOSH
Publication No. 97 – 141, (Cincinnati, OH: US Department of Health and Human Services).
BRIDGER, R.S., 1991, Some fundamental aspects of posture related to ergonomics. International Journal of
Industrial Ergonomics, 8, 3–15.
CHAFFIN, D.B. ANDERSSON, G.B.J. and MARTIN, B.J., 1999, Occupational Biomechanics, 3rd ed. (New York:
Wiley).
CHUNG, M.K., LEE, I. and KEE, D., 2003a, Assessment of postural load for varying lower limb postures based on
perceived discomfort. International Journal of Industrial Ergonomics, 31, 17–32.
CHUNG, M.K., LEE, I. and KEE, D., 2003b, Effect of stool height and holding time on postural load of squatting
postures. International Journal of Industrial Ergonomics, 32, 309 – 317.
FAUCETT, J., GARRY, M., NADLER, D. and ETTARE, D., 2002, A test of two training interventions to prevent
work-related musculoskeletal disorders of the upper extremity. Applied Ergonomics, 33, 337– 347.GENAIDY, A.M., AL-SHEDI, A.A. and KARWOWSKI, W., 1994, Postural stress analysis in industry. Applied
Ergonomics, 25, 77–87.
GENAIDY, A., BARKAWI, H. and CHRISTENSEN, D., 1995, Ranking of static non-neutral postures around the joints
of the upper extremity and the spine. Ergonomics, 38, 1851 – 1858.
GENAIDY, A.M. and KARWOWSKI, W., 1993, The effects of neutral posture deviation on perceived joint
discomfort ratings in sitting and standing postures. Ergonomics, 36, 785 – 792.
GESCHEIDER, G.A., 1985, Psychophysics: Method, Theory and Application, 2nd ed. (Hillsdale, NJ: Erlbaum).
GRANDJEAN, E. and HU ¨ NTING, W., 1977, Ergonomics of postures – review of various problems of standing and
sitting postures. Applied Ergonomics, 8, 135 – 140.
HAGBERG, M., SILVERSTEIN, B., WELLS, R., SMITH, M.J., HENDRICK, H.W., CARAYON, P. , PERUSSE, M.,
KUORINKA, I.A.A. and FORCIER, L. (Eds), 1995, Work-Related Musculoskeletal Disorders (WMSDs): A
Reference Book for Prevention. (London, Taylor & Francis).HAN, S.H., SONG, M. and KWAHK, J., 1999, A systematic method for analyzing magnitude estimation data.
International Journal of Industrial Ergonomics, 23, 513 – 524.
504 Min K. Chung et al.

8/8/2019 Quantitative Postural Load Assesment..
http://slidepdf.com/reader/full/quantitative-postural-load-assesment 14/15
HIGNETT, S. and MCATAMNEY, L., 2000, Rapid entire body assessment (REBA). Applied Ergonomics, 31, 201 –
205.
JUUL-KRISTENSEN, B., FALLENTIN, N. and EKDAHL, C., 1997, Criteria for classification of posture in repetitive
work by observation methods: a review. International Journal of Industrial Ergonomics, 19, 397 – 411.
KARHU, O., KANSI, P. and KUORINKA, I., 1977, Correcting working postures in industry: a practical method for
analysis. Applied Ergonomics, 8, 199 – 201.
KEE, D. and KARWOWSKI, W., 2001, LUBA: An assessment technique for postural loading on the upper body
based on joint motion discomfort and maximum holding time. Applied Ergonomics, 32, 357 – 366.
KILBOM, A., 1994, Assessment of physical exposure in relation to work-related musculoskeletal disorders – what
information can be obtained from systematic observations? Scandinavian Journal of Work, Environment and
Health, 20, 30–45.
KIM, S.H., CHUNG, M.K., KEE, D. and LEE, I., 1998, Workload evaluation of automobile assembly tasks.
Proceedings of the 13th Occupational Ergonomics and Safety Conference .
KOREA OCCUPATIONAL SAFETY and HEALTH AGENCY,2002, KOSHA NET. Available online at: http://
www.kosha.net/
KROEMER, K.H.E., 1989, Cumulative trauma disorders: their recognition and ergonomics measures to avoid
them. Applied Ergonomics, 20, 274– 280.
KROEMER, K.H.E., KROEMER, H. and KROEMER-ELBERT, K., 1994, Ergonomics: How to Design For Ease and
Efficiency. (Englewood Cliffs, NJ: Prentice Hall).
KUMAR, S., 2001, Theories of musculoskeletal injury causation. Ergonomics, 44, 17–47.LEE, I., 2002, Psychophysical evaluation of whole-body postural stresses based on discomfort for body joint
motions, PhD dissertation, Pohang University of Science and Technology, Korea.
LEE, I., RYU, H., CHUNG, M.K. and KEE, D., 2003, Evaluation of complex trunk postures based on perceived
discomfort. CD-ROM Proceedings of the 15th Trienniel Congress of the International Ergonomics Association.
LI, G. and BUCKLE, P., 1999, Current techniques for assessing physical exposure to work-related musculoskeletal
risks, with emphasis on posture-based methods. Ergonomics, 42, 674 – 695.
MCATAMNEY, L. and CORLETT, E.N., 1993, RULA: a survey method for the investigation of work-related upper
limb disorders. Applied Ergonomics, 24, 91–99.
MONTGOMERY, D.C., 1991, Design and Analysis of Experiments, 3rd ed. (New York: Wiley).
PUTZ-ANDERSON, V. (Ed.), 1988, Cumulative Trauma Disorders: A Manual for Musculoskeletal Diseases of the
Upper Limbs. (London: Taylor & Francis).
PUTZ-ANDERSON, V. and GALINSKY, T.L., 1993, Psychophysically determined work durations for limitingshoulder girdle fatigue from elevated manual work. International Journal of Industrial Engineering, 11, 19–28.
VAN WELY, P., 1970, Design and disease. Applied Ergonomics, 1, 262–269.
WESTGAARD, R.H. and AARA ˚ S, A., 1984, Postural muscle strain as a causal factor in the development of
musculoskeletal illnesses. Applied Ergonomics, 15, 162– 174.
WINKEL, J. and MATHIASSEN, S.E., 1994, Assessment of physical work load in epidemiologic studies: concepts,
issues and operational considerations. Ergonomics, 37, 979 – 988.
WORLD HEALTH ORGANIZATION, 1997, Health and Environment in Sustainable Development: Five Years After the
Earth Summit. (Geneva: WHO).
Quantitative postural load assessment 505

8/8/2019 Quantitative Postural Load Assesment..
http://slidepdf.com/reader/full/quantitative-postural-load-assesment 15/15