quantitative risk assessment evaluating the risk ... · report number: 16171 issue: 2.3 dnv gl...
TRANSCRIPT

This Report is protected by copyright and may not be reproduced in whole or in part by any means without the approval in writing of DNV GL.
No Person, other than the Customer for whom it has been prepared, may place reliance on its contents and no duty of care is assumed by DNV
GL toward any Person other than the Customer.
This Report must be read in its entirety and is subject to any assumptions and qualifications expressed therein. Elements of this Report
contain detailed technical data which is intended for analysis only by persons possessing requisite expertise in its subject matter.
DNV GL is the trading name of GL Industrial Services UK Ltd
Registered in England and Wales No. 3294136 Registered Office: Holywell Park, Ashby Road, Loughborough, Leicestershire, LE11 3GR UK.
© 2014 GL Industrial Services UK Ltd
Report Number: 16171 5 January 2016
Quantitative Risk Assessment Evaluating the Risk Associated with Carbon
Monoxide and Changing Acceptable Gas Quality - Final Report
Prepared for: Prepared by:
Jamie McAinsh Hazel Richardson & Martin Brown
Innovation Project Manager
Scotia Gas Networks
Axis House
5 Lonehead Drive
Newbridge
Edinburgh
EH28 8TG
GL Industrial Services UK Ltd trading as DNV GL
Holywell Park
Ashby Road
Loughborough Leicestershire
LE11 3GR
United Kingdom
Tel: +44 (0)7807 576133
E-mail: [email protected]
Website: www.dnvgl.com
Customer Reference: SGN Opening up the Gas Market

Report Number: 16171 Issue: 2.3
DNV GL restricted Page i
Report Issue / Amendment Record
Report Title: Quantitative Risk Assessment Evaluating the Risk Associated with Carbon Monoxide and Changing Acceptable Gas Quality - Final Report
Report Number: 16171 Project Title: SGN Opening up the Gas Market
Project SAP Code: E-3247 and E-5308
Amendment details
Issue Description of Amendment Originator/Author
1.0 Original Martin Brown
Hazel Richardson
2.0 Incorporation of comments by SGN Hazel Richardson
Martin Brown
2.1 Incorporation of comments by Project Team Hazel Richardson
Martin Brown
2.2 Added micromort for solid fuel and addressed comment on extent of survey
Martin Brown
Sarah Kimpton
2.3 Report status changed to final Sarah Kimpton
2.4 Report Updated to reflect latest survey results and amended fault tree.
Hazel Richardson
Report approval
Issue Checked by Approved by Date
1.0 Sarah Kimpton Sarah Kimpton
5 February 2015
2.0 Martin Brown Sarah Kimpton
4 March 2015
2.1 Martin Brown Sarah Kimpton 4 March 2015
2.2 Martin Brown
Sarah Kimpton 10 March 2015
2.3 Hazel Richardson Sarah Kimpton
16 December 2015
2.4 Martin Brown
Sarah Kimpton 5 January 2016
Previous issues of this document shall be destroyed or marked SUPERSEDED

Report Number: 16171 Issue: 2.3
DNV GL restricted Page ii
Project Code: E-3247 and E-5308
Distribution
Name Company
Jamie McAinsh Innovation Project Manager
Scotia Gas Networks Axis House 5 Lonehead Drive Newbridge Edinburgh EH28 8TG

Report Number: 16171 Issue: 2.3
DNV GL restricted Page iii
Executive Summary
DNV GL has carried out a Quantitative Risk Assessment (QRA) as part of the “Opening Up the Gas Market” NIC project being undertaken by SGN in Oban, Scotland. The assessment determined the change in risk associated with transporting gas with Wobbe Indices outside those currently allowed by the Gas Safety (Management) Regulations, noting that any change in Wobbe Index is typically
associated with changes in the concentration of CO in the combustion products.
Where risk is defined as the number of fatalities per million people per year, the results in Table 1 have been estimated using the fault tree approach to evaluating the risk associated with CO and changing the acceptable gas quality.
Wobbe Index (MJ/m³)
Risk Difference versus existing GB risk
level
GS(M)R Limit
51.4 Without Mitigation 0.011 0.0000
With Mitigation* 0.0014 -0.0096
Survey Test Gas Limit, G21 (from survey data)
54.7 Without Mitigation 0.0152 0.0042
With Mitigation* 0.0019 -0.0091
HSE Exemption Limit (from survey data)
53.25 Without Mitigation 0.0135 0.0025
With Mitigation* 0.0017 -0.0093
Proposed Oban Field Trial Limit (from survey data) (Assuming that the Wobbe Index is the average of the likely Zeebrugge gas quality)
51.8 Without Mitigation 0.0118 0.0008
With Mitigation* 0.0015 -0.0095
*Mitigation includes surveying appliance installations regarding their condition and performance, and rectifying where necessary.
Table 1: Summary of Fault Tree Results
To assist in the understanding of risk, a review of micromort values has been carried out which
suggests the risk at 53.25 MJ/m3 (HSE exemption) is approximately thirty times lower than that of electrocution in the home, and over five hundred times lower than those for CO poisoning from solid fuel.
The resultant risk has been calculated using all the available Oban survey data.
A risk value for “no access” properties shall be calculated on a case by case basis by combining known information and assuming a reasonable worst case for unknown information.

Report Number: 16171 Issue: 2.3
DNV GL restricted Page iv
Contents
1 Introduction ............................................................................ 1
2 Gas Quality Information .......................................................... 1
3 Fault Tree Structure ................................................................ 2
3.1 Part 1 – CO Incident ........................................................................................ 3
3.2 Part 2 – Appliance producing high CO concentration ....................................... 6
3.3 Part 3 – Inadequate ventilation ....................................................................... 9
3.4 Part 4 – Inadequate Flue Function ................................................................ 10
3.5 Part 5 – Occupant Exposed for Sufficient Time .............................................. 11
4 Fault Tree Inputs .................................................................. 13
4.1 Frequencies ................................................................................................... 13
4.2 Probabilities .................................................................................................. 14
5 Fault Tree Factors ................................................................. 15
5.1 Tenure Type .................................................................................................. 15
5.2 Occupancy Type............................................................................................. 15
5.3 Occupant Age ................................................................................................ 15
5.4 Appliance Type .............................................................................................. 16
6 Statistical Approach .............................................................. 16
6.1 Frequency and Probability Calculations ......................................................... 16
6.1.1 Combining Probabilities.................................................................... 16
6.1.2 Combining Frequencies .................................................................... 17
6.1.3 Combining Frequencies and Probabilities ............................................ 17
6.2 Monte Carlo ................................................................................................... 17
7 Sensitivity Study ................................................................... 18
8 Current Results ..................................................................... 19
8.1 Risk Results ................................................................................................... 20
8.1.1 Absolute CO Risk ............................................................................ 21
8.1.2 Risk Factors ................................................................................... 21
9 No Access .............................................................................. 22
10 Summary ............................................................................... 22
11 References ............................................................................ 23
Appendix A Fault Tree .............................................................. A-1
Appendix B Micromorts ............................................................. B-1

Report Number: 16171 Issue: 2.3
DNV GL Restricted
Page 1
1 Introduction
The “Opening Up the Gas Market” NIC Project being undertaken by SGN in Oban requires an HSE Exemption to the Gas Safety (Management) Regulations [GS(M)R] to progress to the next stage. To enable an assessment to be made of the impact of widening the acceptable gas quality range, it is necessary to perform a Quantitative Risk Assessment (QRA) to determine adverse (or positive) effects
that may result.
A key aspect of this study is to build up a picture of the factors that impact on the overall risk, understand the magnitude, frequency or probability of these factors and then combine the output to quantify the effects for different scenarios.
In parallel with this QRA, Kiwa Gastec and SGN have undertaken detailed laboratory appliance testing and house to house appliance testing in Oban using three test gases with Wobbe Indices within, below and above the acceptable limits defined in the GS(M)R. The results from these tests are being used as input data to the QRA.
Within this document, the following definitions have been used:
Risk = Carbon Monoxide (CO) fatalities per million people per year involving natural gas usage.
Base Case = the current average risk in Great Britain.
Survey = Results determined from the initial Oban survey outcomes.
2 Gas Quality Information
An exemption to convey gas with a Wobbe Index of up to 53.25 MJ/m³ is requested for the duration of one year. However, the Wobbe Index of the gas sources used during the trial will be much lower, at a value of 51.8 ± 0.25 MJ/m³. Table 2 details the Wobbe Indices for several test gases and sources.
Gas Source Reference Gross Wobbe Index (MJ/m³)
Minimum Maximum
Group E [1] 40.9 54.7
Group H [1] 45.7 54.7
Group L [1] 39.1 44.8
G20 [1] 50.72
G21 [1] 54.76
G23 [1] 45.66
GS(M)R Limits [2] 47.20 51.41
GS(M)R Emergency Limits [3] 46.50 52.85
HSE Exemption for Oban Gas Trial 47.20 53.25
Quality During Oban Trial (Zeebrugge, Belgium) 51.55 52.05
Zeebrugge, Belgium (contractual range) 48.4 53.14
Montoir-de-Bretagne, France 46.46 53.48
Bilbao, Spain (likely values) 51.50 53.20
Table 2: Wobbe Index Limits at 15 °C Combustion and 15 °C and 1.01325 bar Metering Reference Conditions
[Note on information in Table 2 : Within the European Standard [1], gases are classified as belonging
to “families” and “groups”. Gas families are those with similar burning behaviour linked by similar

Report Number: 16171 Issue: 2.3
DNV GL Restricted
Page 2
Wobbe Index values. Gas groups are sub-divisions of the “families”. Natural gas is a “second family” gas subdivided into Group H, L or E. Group H is the high range; Group L the low range and Group E the extended or European range. Different European member states use different Gas Groups for gas appliance certification tests. In the UK, the test gases are from Group H, and the commonly used test gases are G20, G21 and G23. G20 is the Group H “Reference gas”, G21 is the “Incomplete combustion and sooting limit gas” and G23 is the “Flame lift limit gas”.]
During the initial survey tests undertaken at properties in Oban, the Wobbe Indices used were those of the G20, G21 and G23 test gases.
Based on LNG contracts at these terminals, it is highly unlikely that gas specifications will change during the period of the Oban trial; however the HSE exemption allows sufficient headroom if required.
3 Fault Tree Structure
The Fault Tree method provides a structured approach to the QRA process. It provides a mechanism to
highlight the potential impact and includes factors that may lead to that impact.
The approach uses a Boolean system where factors can be combined to provide pathways for coupled effects that can give rise to a specific event or fault. These “Gates” are “AND” or “OR” gates and represent factors that require single or multiple actions to have an overall effect. “NOT” gates
determine the probability of an event not occurring. In general, single event pathways lead to higher levels of risk whereas factors that require combined or multiple events tend to have lower risk ratings.
“AND” gate “OR” gate “NOT” gate
Figure 1: Fault Tree Gates
For this study, an initial appraisal of the impact of widening the range of gas quality that domestic appliances may use suggested that the main consequence was change to the CO concentration in the combustion products. The potential increase in CO concentration is dependent on a wide number of factors and these factors need to be combined to derive the overall risk.
Another impact considered was gas leakage and resultant potential for explosion, but this was not thought to be strongly dependent on gas quality.
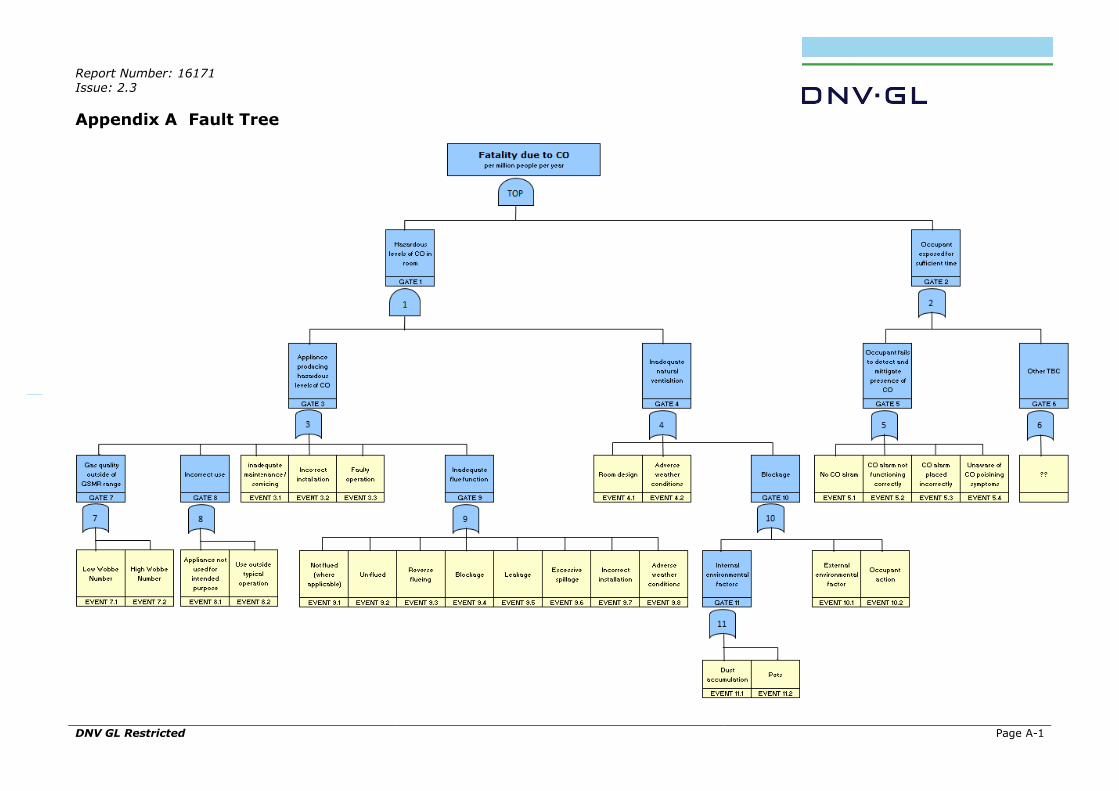
The fault tree developed attempts to provide an overview of the factors or topics that could influence a CO poisoning event. An overview of the whole fault tree is shown in Appendix A. For demonstration
purposes the fault tree has been broken down into several components in the following sections.

Report Number: 16171 Issue: 2.3
DNV GL Restricted
Page 3
3.1 Part 1 – CO Incident
Figure 2: Fault Tree Section 1
The top level of the fault tree is “Fatality due to Carbon Monoxide Poisoning”; the events underneath
this top level consist of the individual incidents which may or may not lead to a fatality.
In the first section of the fault tree, Figure 2, the top level impact “Fatality due to Carbon Monoxide Poisoning” has two factors:
High CO concentration within the room An occupant that is exposed to that high concentration for sufficient time to cause injury.
These factors are not fully independent as CO poisoning has a concentration/exposure time relationship
due to the accumulation of carboxyhaemoglobin (COHb) within the blood stream when the occupant is in an environment containing CO.
The concentration of CO in the room is dependent on two factors:
A source of CO – assumed to be from domestic appliances present in the room Ineffective removal of CO through natural ventilation.
[Although it is recognised that other CO sources are possible (eg. External sources from neighbouring properties or deliberate acts – like introducing vehicle exhaust), for this initial fault tree they have been excluded.]

Report Number: 16171 Issue: 2.3
DNV GL Restricted
Page 4
Figure 3 shows the inter-relationship between exposure time and CO concentration [1]. All
combinations of CO concentration and time above the curve (the lined area) are deemed unacceptable while those below the curve are deemed acceptable.
Figure 3: Relationship between exposure time and CO concentration [4]
The location of the line is dependent on the health of the individual (and this is included in the
“Occupant” factor in Figure 2). To support the input an extract from BS EN 50292 (2002) [1] has been
used:
Individuals with coronary artery disease exposed to low levels of CO show reduced ability to exercise, and the time of onset of exercise-induced angina pectoris in such patients exposed to low levels of CO is reduced.
Carbon monoxide readily crosses the placental barrier and may endanger the normal development of the foetus.
A number of high risk groups are particularly sensitive to the effects of CO because of various organ impairments or specific changes, mainly:
a) those whose oxygen carrying capacity is decreased due to anaemia or other haemoglobin disorders;
b) those with increased oxygen needs such as those encountered in fever, hyperthyroidism or pregnancy;
c) those with systemic hypoxia due to respiratory insufficiency;
d) those with heart disease and any vascular insufficiency, such as cerebral ischaemia and peripheral vascular diseases.
The CO concentration factor and the time element are detailed in Table 3 taken from BS 7967 Part 5
(2010) [5].

Report Number: 16171 Issue: 2.3
DNV GL Restricted
Page 5
Table 3: CO Concentration and Time [5]
These relationships will provide a basis on which the potential risk of a CO incident may arise. Although the health impact symptoms are well documented, there is no specific symptom and most exposure to
high CO concentrations is initially blamed on a headache. The awareness of the general population to impacts of CO is poor.
Recently, IGEM [6] has reported that:
“An online poll of 2,000 people carried out by OnePoll, on behalf of the Gas Safety Trust, has found that despite a number of recent high profile campaigns, only 13% of the people questioned were able to identify the main symptoms and characteristics of carbon monoxide (CO) poisoning. The poll identified that the under 25s were the least able to identify all of the symptoms with under a third owning an audible CO alarm.
Commenting on the polls' findings, Chris Bielby, chair of Gas Safety Trust, said: "We were disappointed to find that despite a concerted effort by industry and others, there is still a worrying lack of awareness about the dangers of CO.”
The ranges of factors that lead to the above mechanisms are detailed in the following sections.

Report Number: 16171 Issue: 2.3
DNV GL Restricted
Page 6
3.2 Part 2 – Appliance producing high CO concentration
Figure 4: Fault Tree Section 2
In Figure 4 above, the fault tree branch related to the domestic appliances producing hazardous CO
concentrations is considered. There are several factors and mechanisms that could give rise to high emission rates of CO and these include:
Gas quality outside of the normal range – both high and low Wobbe Index gas may give rise to increased CO concentration in the flue gas products. The response of the appliance to
change in gas quality is dependent on several factors, including appliance design, burner-type and overall operation. Details of the gas quality range likely to be conveyed during the Oban
field trial are given in section 2.
Incorrect use – Here it is recognised that sometimes appliances are not used for the purpose they were designed for. The most common “Incorrect Use” is for the cooker/hob to be used for space heating – often correlated with specific demographics. The other instance is when the
appliance is used in a way that is not typical and outside of its normal mode of operation. A recent survey in Oban found that a cooker burner was producing high CO concentration as a result of an oversized pan on the hob giving rise to excessive flame quenching and restriction
of secondary air [7].
Incorrect installation – If an appliance has not been installed correctly then it may give rise
to increased CO emissions. This factor is thought to be significant for boilers, water heaters and space heaters, but not cookers/hobs.
Faulty operation – If the appliance develops a fault that does not render it inoperable then this may give rise to increased emissions
Age of the appliance – It is known that general “wear and tear” through ageing of the appliance may impact on the overall combustion performance, and may give rise to elevated
CO concentration in the flue gas products. Figure 5, from the recent EU GasQual study [8],
highlights the increase in emissions as a function of age for different gas qualities.

Report Number: 16171 Issue: 2.3
DNV GL Restricted
Page 7
Inadequate maintenance / servicing – Figure 6, from the recent EU GasQual study [8],
highlights the change to emissions resulting from appliance maintenance/cleaning.
Inadequate flue function – see Section 3.4.
Figure 5: Impact of age on CO concentration in the flue gas products [8]
Figure 5, taken from the GasQual study, provides an example of how the CO emission may change with ageing of the appliance. The light blue curve represents the CO emission profile for a new
appliance and the dark blue line the emission profile for a used appliance. As the appliance becomes more “used” it is expected that the CO emission will increase and the magnitude of the increase will be dependent on the gas quality (Wobbe Index) of the fuel gas.

Report Number: 16171 Issue: 2.3
DNV GL Restricted
Page 8
Figure 6: Impact of maintenance on CO emissions [8]
Figure 6 shows some data provided for the GasQual project demonstrating the impact of cleaning,
maintenance and servicing on the CO emission profile from a number of boilers. Again the light blue line represents the CO emission profile from a new appliance (labelled as Trend 1). The darkest blue line represents the CO emission profile as a function of Wobbe Index for used appliances before cleaning (labelled Trend 2). The intermediate lines represent the trends in CO emissions for cleaned appliances. It can be seen that 2 of the 8 appliances (labelled Trend 4) still gave elevated CO emissions after cleaning whereas 6 of the 8 appliances (labelled Trend 3) gave CO emission profiles similar to the new appliance.
The data presented in Figure 5 and Figure 6 provide examples of the possible change to the CO emission factors as a result of aging and servicing and provide supporting evidence for inclusion in the Fault Tree.

Report Number: 16171 Issue: 2.3
DNV GL Restricted
Page 9
3.3 Part 3 – Inadequate ventilation
Figure 7: Fault Tree Section 3
Figure 7, develops the Fault Tree approach focussing on inadequate ventilation and the factors that may give rise to increased CO production potential. These include:
Room design – This category endeavours to cover specific aspects related to the building and the room containing the appliance. An example of the effect could be if a property has been
extended and the ventilation for the appliance has not been taken into consideration during the building work. This could give rise to restricted ventilation.
Blockage – The combustion air required for correct appliance operation could be restricted due to blockage of either the main room vents (air bricks) or the air intake for the appliances. These effects are appliance-type dependent and the impacts are greatest when the appliance
draws its combustion air from the room containing the appliance. “Linting” of some appliances, especially Back Boiler units is a known issue and lint screens can become clogged by pet hairs or general household detritus. External factors can also lead to vent blockage. Grilles can become blocked through accumulation of leaves or waste, and ivy growing up walls can also lead to vent blockage. An additional cause of air vent blockage is the deliberate action of the occupant. Vents are often deemed to be sources of cold-air draughts and in some cases are
blocked by the occupant – either temporarily or permanently. Also, natural room ventilation through suspended floors (ventilated under the floor) can be restricted through floor covering type. Vinyl flooring is known to inhibit fortuitous underfloor ventilation.
Report Number: 16171 Issue: 2.3
DNV GL Restricted
Page 10
Adverse weather conditions – Strong winds impacting directly on flues may prevent CO being removed from the room.
For commercial equipment, the HSE Information sheet [9] provides details of factors that can impact
on operation and give rise to potential risk including:
Evidence that the ventilation system is not used or is unreliable
Small room volume
Obvious poor design/maintenance of the ventilation system (long, convoluted ducts, broken fans, leaking ductwork, visible escape of cooking fumes/steam etc)
Lack of user awareness of the effect of using gas appliances without adequate ventilation
Poor general ventilation
Extensive use of gas-fired appliances for long periods
Ageing system/installation
Lack of routine or planned maintenance.
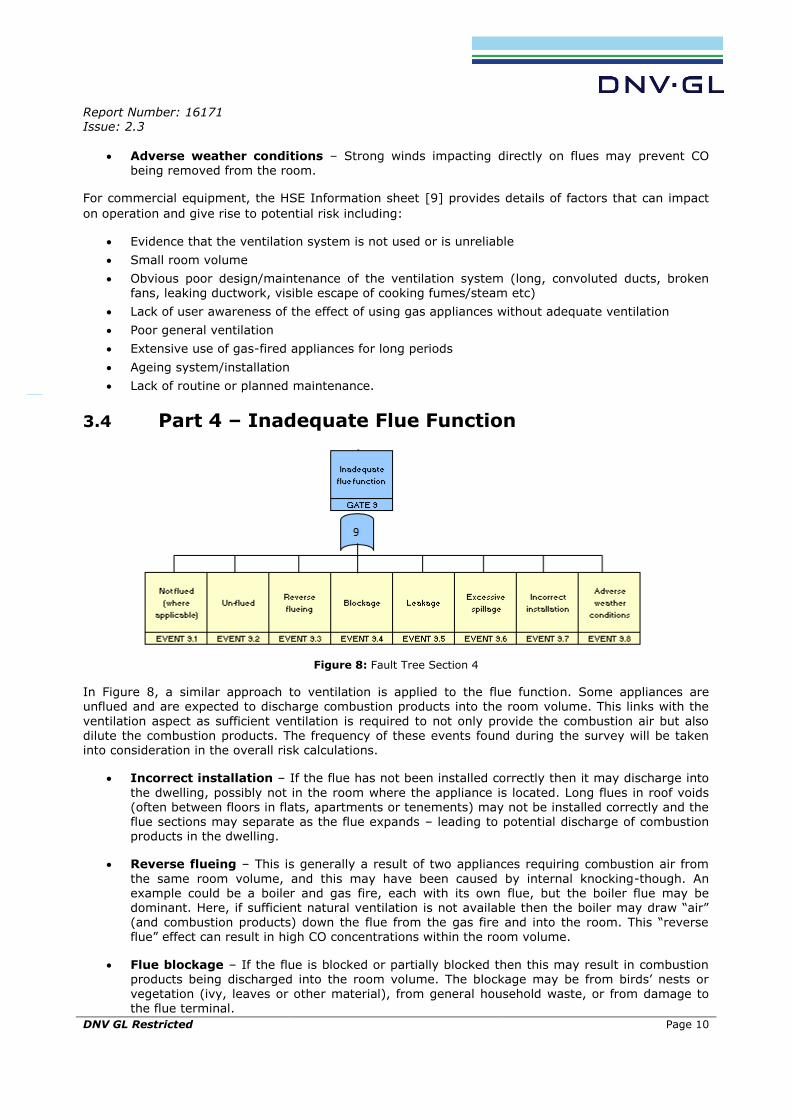
3.4 Part 4 – Inadequate Flue Function
Figure 8: Fault Tree Section 4
In Figure 8, a similar approach to ventilation is applied to the flue function. Some appliances are unflued and are expected to discharge combustion products into the room volume. This links with the
ventilation aspect as sufficient ventilation is required to not only provide the combustion air but also dilute the combustion products. The frequency of these events found during the survey will be taken into consideration in the overall risk calculations.
Incorrect installation – If the flue has not been installed correctly then it may discharge into
the dwelling, possibly not in the room where the appliance is located. Long flues in roof voids (often between floors in flats, apartments or tenements) may not be installed correctly and the flue sections may separate as the flue expands – leading to potential discharge of combustion products in the dwelling.
Reverse flueing – This is generally a result of two appliances requiring combustion air from
the same room volume, and this may have been caused by internal knocking-though. An example could be a boiler and gas fire, each with its own flue, but the boiler flue may be dominant. Here, if sufficient natural ventilation is not available then the boiler may draw “air” (and combustion products) down the flue from the gas fire and into the room. This “reverse flue” effect can result in high CO concentrations within the room volume.
Flue blockage – If the flue is blocked or partially blocked then this may result in combustion products being discharged into the room volume. The blockage may be from birds’ nests or
vegetation (ivy, leaves or other material), from general household waste, or from damage to the flue terminal.

Report Number: 16171 Issue: 2.3
DNV GL Restricted
Page 11
Flue leakage – If there is general “wear and tear” then the flue may leak in the dwelling. An example of this may be unlined flues in traditional chimneys. Here the older brick type flues may crack or the mortar fails giving a potential flue path into the dwelling.
Spillage – Spillage may occur when an appliance is first lit from cold. Without the draw from
the chimney, it is possible for the combustion products to enter the room. This event usually stops as the chimney/flue warms up, but there is the possibility that excessive spillage may occur in some circumstances. This can often be detected as staining or scorching around the vents of appliances
Adverse weather conditions – Strong winds impacting directly on flues may give rise to incorrect operation. This will be appliance type and flue specific.
Not flued (where applicable) – This refers to appliances which are required to have a flue but do not have one installed.
Un-flued – This refers to appliances which do not require a flue.
3.5 Part 5 – Occupant Exposed for Sufficient Time
Figure 9: Fault Tree Section 5

Report Number: 16171 Issue: 2.3
DNV GL Restricted
Page 12
In Figure 9 above, it is recognised that the occupant may be a factor in the build-up of CO in the dwelling by either failing to detect or mitigate the presence of combustion products. Here, the occupant may be unaware of CO poisoning symptoms, or there may not be a CO alarm in the property. The additional factors relate to incorrect location of CO alarms or faulty alarms.

Report Number: 16171 Issue: 2.3
DNV GL Restricted
Page 13
4 Fault Tree Inputs
This section details the fault tree inputs (see Table 4) into the base case, i.e. the current average fatality per million people per year in Great Britain. For details on how the impact of the survey is reflected in the fault tree, please see section 5.
Please see Appendix A for the fault tree diagram with locations. Inputs for GATE 7 (changing the
Wobbe Index) are discussed in Section 8.1.1.
Fault Tree
Location Cause Reference
Frequency* /
Probability Value
EVENT 3.3 Appliance Fault [10] Frequency 0.02
EVENT 3.2 Appliance Installation Fault [10] Frequency 0.01
GATE 8 Customer Misuse [10] Frequency 0.01
GATE 9 Fuel / Terminal Fault [10] Frequency 0.02
EVENT 3.1 Lack of Servicing [10] Frequency 0.05
GATE 4 Sub-standard Compartment [10] Frequency 0.01
EVENT 3.1 Sub-standard Servicing [10] Frequency 0.01
GATE 4 Ventilation Fault [10] Frequency 0.12
EVENT 5.1 No CO alarm [11] Probability 0.80
EVENT 5.2 CO alarm not functioning correctly [12] Probability 0.04
EVENT 5.3 CO alarm not placed correctly [12] Probability 0.24
EVENT 5.4 Unaware of CO poisoning symptoms [6] Probability 0.87
* Frequency = Fatalities per million people per year
Table 4: Frequency and Probability Fault Tree Inputs
4.1 Frequencies
A frequency, i.e. the number of fatalities per million people per year has been estimated for the
following causes:
Appliance fault: Event 3.3 – faulty operation
Appliance installation fault: Event 3.2 – incorrect installation
Customer misuse: Gate 8 – incorrect use
Fuel / terminal fault: Gate 9 – inadequate flue function
Lack of servicing: Event 3.1 – inadequate maintenance / servicing
Sub-standard compartment: Gate 4 – inadequate natural ventilation
Sub-standard servicing: Event 3.1 – inadequate maintenance / servicing
Ventilation fault: Gate 4 – inadequate natural ventilation
Please see Appendix A for the fault tree diagram with locations.
Estimates have been made using the average number of CO fatalities involving natural gas usage per year over a 10 year period (between 2002 / 2003 and 2011 / 2012) and the average percentage of established causes of incidents. This data has been obtained from the 2011 / 2012 Gas Safety Trust
Carbon Monoxide Incident Report [10].

Report Number: 16171 Issue: 2.3
DNV GL Restricted
Page 14
Figure 10 shows the number of fatalities involving natural gas usage per million people per year as reported by the Gas Safety Trust. A large decrease in CO fatalities was noticed between 1999 and 2002 and therefore only data after 2002 has been used for this fault tree analysis.
Figure 10: Fatalities per Million People per Year Involving Natural Gas Usage [13]
4.2 Probabilities
Probabilities, i.e. the likelihood of a fatality due to CO poisoning has been estimated for the victim
being made aware of a CO incident either by a CO alarm or by the knowledge of, and acting on, CO poisoning symptoms.
No CO Alarm
A study on the “Provision of Carbon Monoxide Detectors Under The Building Regulations BD 2754. Department for Communities and Local Government” in September 2009 [11] estimated that 80% of
the GB population does not have a CO alarm installed.
It is understood that as part of the Oban survey work, SGN engineers have handed out CO alarms to all surveyed properties.
CO Alarm not Functioning Correctly and not Placed Correctly
An HSE study on “Domestic Carbon Monoxide Alarms: Long-Term Reliability and Use Scoping Study” in 2011 [12] found that 23.6% of alarms were incorrectly deployed and 4% of CO alarms were not
functioning correctly.
Unaware of CO Poisoning Symptoms
An IGEM study on the knowledge of CO poisoning in 2014 [6] found that 87% of the UK population are
unaware of the symptoms of CO poisoning.
0
0.1
0.2
0.3
0.4
0.5
0.6
Fata
liti
es P
er M
illio
n P
eo
ple
per Y
ear
Reporting Year (1st July - 30th June)
Fatalities per Million People per Year

Report Number: 16171 Issue: 2.3
DNV GL Restricted
Page 15
5 Fault Tree Factors
When determining the risk at an individual case it is necessary to look at several features which can be determined by a survey in order to alter the average value (for better or for worse). These factors include the tenure type, occupancy type, occupant age and appliance type and age.
When calculating the risk of an individual case, a factor for each of these features can be applied to the average risk in order to determine the individual risk for this case. The factors have been determined by looking at the comparative risks for different features (e.g. the risk for a detached house compared to that of a terraced house).
When certain features are unknown, please see the procedure for no access in section 9.
5.1 Tenure Type
The categories in tenure type are: owner occupied, tenanted and commercial.
The Gas Safety Trust Report indicates "The risk of a CO incident occurring in a property with a private landlord is 50% greater than that either in an owner occupied property or one with a social sector landlord although the risk has tended to reduce since 1996." [13]. This factor has also been backed up
by the data from “Big Picture COHB Dailies.xlsx” [14].
The relative risk score for commercial properties is currently unknown.
5.2 Occupancy Type
The categories in occupancy type are: detached, semi-detached, terraced, bungalow and flat.
The relative risk scores shown in Table 5 have been estimated from the dwelling type figures of the Gas Safety Trust report.
Occupancy Type Relative Risk Score
Detached 0.62
Semi-detached 0.81
Terraced 1.64
Flat 1.02
Table 5: Occupancy Type Relative Risk Scores
The relative risk score for bungalows is currently unknown and it is assumed that this will be equal to that for a detached house.
5.3 Occupant Age
The categories in occupant age are: <70, ≥ 70 in sheltered accommodation and ≥ 70 in non-sheltered
accommodation.
The Gas Safety Trust report indicates "The risk that someone 70 years or older will be fatally injured in a CO incident is now 5 times that of anyone younger."[13]. This factor has also been backed up by the
data from “Big Picture COHB Dailies.xlsx” [14].
It is known from the current progress of the Oban survey that people in sheltered accommodation are under the care of a warden and this mitigates some of the increase in risk due to an occupant’s age.

Report Number: 16171 Issue: 2.3
DNV GL Restricted
Page 16
5.4 Appliance Type
The number of different appliances with different inherent CO poisoning risks as well as different risks for the age of each different appliance type is an extensive list and comparative risk factors are yet to be confirmed.
6 Statistical Approach
6.1 Frequency and Probability Calculations
Calculations have been carried out for combining probabilities and frequencies of events under “AND” and “OR” gates in the following way, see reference [15].
6.1.1 Combining Probabilities
6.1.1.1 AND
The probability of two or more independent events occurring at the same time is the product of their probabilities, see Figure 11. Examples of combining 2, 3 and 4 events in this way are shown below.
Figure 11: Combining AND Probabilities
𝑷(𝑨 𝒂𝒏𝒅 𝑩) = 𝑃(𝐴) ∙ 𝑃(𝐵)
𝑷(𝑨 𝒂𝒏𝒅 𝑩 𝒂𝒏𝒅 𝑪) = 𝑃(𝐴) ∙ 𝑃(𝐵) ∙ 𝑃(𝐶)
𝑷(𝑨 𝒂𝒏𝒅 𝑩 𝒂𝒏𝒅 𝑪 𝒂𝒏𝒅 𝑫) = 𝑃(𝐴) ∙ 𝑃(𝐵) ∙ 𝑃(𝐶) ∙ 𝑃(𝐷)
And so on.
6.1.1.2 OR
The probability of event A or event B occurring (not mutually exclusive) includes the probability of only event A occurring, only event B occurring and both event A and event B occurring at the same time. However you need to make sure that you don’t double count when both event A and event B occur, see Figure 12. Examples of combining 2, 3 and 4 events in this way are shown below.
P(A) P(B)
P (A and B)

Report Number: 16171 Issue: 2.3
DNV GL Restricted
Page 17
Figure 12: Combining OR Probabilities
𝑷(𝑨 𝒐𝒓 𝑩) = 𝑃(𝐴) + 𝑃(𝐵) − 𝑃(𝐴) ∙ 𝑃(𝐵)
𝑷(𝑨 𝒐𝒓 𝑩 𝒐𝒓 𝑪) = [𝑃(𝐴) + 𝑃(𝐵) + 𝑃(𝐶)] − [𝑃(𝐴) ∙ 𝑃(𝐵) + 𝑃(𝐴) ∙ 𝑃(𝐶) + 𝑃(𝐵) ∙ 𝑃(𝐶)] + 𝑃(𝐴) ∙ 𝑃(𝐵) ∙ 𝑃(𝐶)
𝑷(𝑨 𝒐𝒓 𝑩 𝒐𝒓 𝑪 𝒐𝒓 𝑫) = [𝑃(𝐴) + 𝑃(𝐵) + 𝑃(𝐶) + 𝑃(𝐷)]
−[𝑃(𝐴) ∙ 𝑃(𝐵) + 𝑃(𝐴) ∙ 𝑃(𝐶) + 𝑃(𝐴) ∙ 𝑃(𝐷) + 𝑃(𝐵) ∙ 𝑃(𝐶) + 𝑃(𝐵) ∙ 𝑃(𝐷) + 𝑃(𝐶) ∙ 𝑃(𝐷)]
+[𝑃(𝐴) ∙ 𝑃(𝐵) ∙ 𝑃(𝐶) + 𝑃(𝐴) ∙ 𝑃(𝐵) ∙ 𝑃(𝐷) + 𝑃(𝐴) ∙ 𝑃(𝐶) ∙ 𝑃(𝐷) + 𝑃(𝐵) ∙ 𝑃(𝐶) ∙ 𝑃(𝐷)]
−[𝑃(𝐴) ∙ 𝑃(𝐵) ∙ 𝑃(𝐶) ∙ 𝑃(𝐷)]
And so on.
6.1.2 Combining Frequencies
Frequencies are combined in a slightly different way to probabilities. Frequencies cannot be combined
under and gates, therefore they do not appear in this way within the fault tree.
When combining frequencies under or gates we simply add all the frequencies together. For example, if A occurred 3 days a week and B occurred 1 day a week, the frequency of A or B occurring would be 4 days a week (3/7 + 1/7 = 4/7).
𝑷(𝑨 𝒐𝒓 𝑩) = 𝑃(𝐴) + 𝑃(𝐵)
6.1.3 Combining Frequencies and Probabilities
Frequencies and probabilities cannot be combined under or gates, therefore they do not appear in this way within the fault tree.
To combine a frequency and probability under an and gate we need to multiply the two together. The result of multiplying a probability and a frequency is a frequency.
𝑷(𝑨𝒇𝒓𝒆𝒒𝒖𝒆𝒏𝒄𝒚 𝑨𝑵𝑫 𝑨𝒑𝒓𝒐𝒃𝒂𝒃𝒊𝒍𝒊𝒕𝒚) = 𝑃(𝐴𝑓𝑟𝑒𝑞𝑢𝑒𝑛𝑐𝑦) ∙ 𝑃(𝐴𝑝𝑟𝑜𝑏𝑎𝑏𝑖𝑙𝑖𝑡𝑦)
6.2 Monte Carlo
When calculating the risk of a particular area, e.g. Oban, then the average risk score for the UK could be fine-tuned by using population data for the features mentioned in Section 0 and the Monte Carlo
method.
Monte Carlo is a numerical method which is used to estimate uncertainty and bias error by running error calculations for a large number of hypothetical scenarios
Information from the 2011 Census for England and Wales [16], initial Oban survey results [17] and
supported housing information for older people in the UK [18] has been utilised in determining
population distributions for the Monte Carlo method.
P (A or B) P(A) P(B) P (A and B)
Report Number: 16171 Issue: 2.3
DNV GL Restricted
Page 18
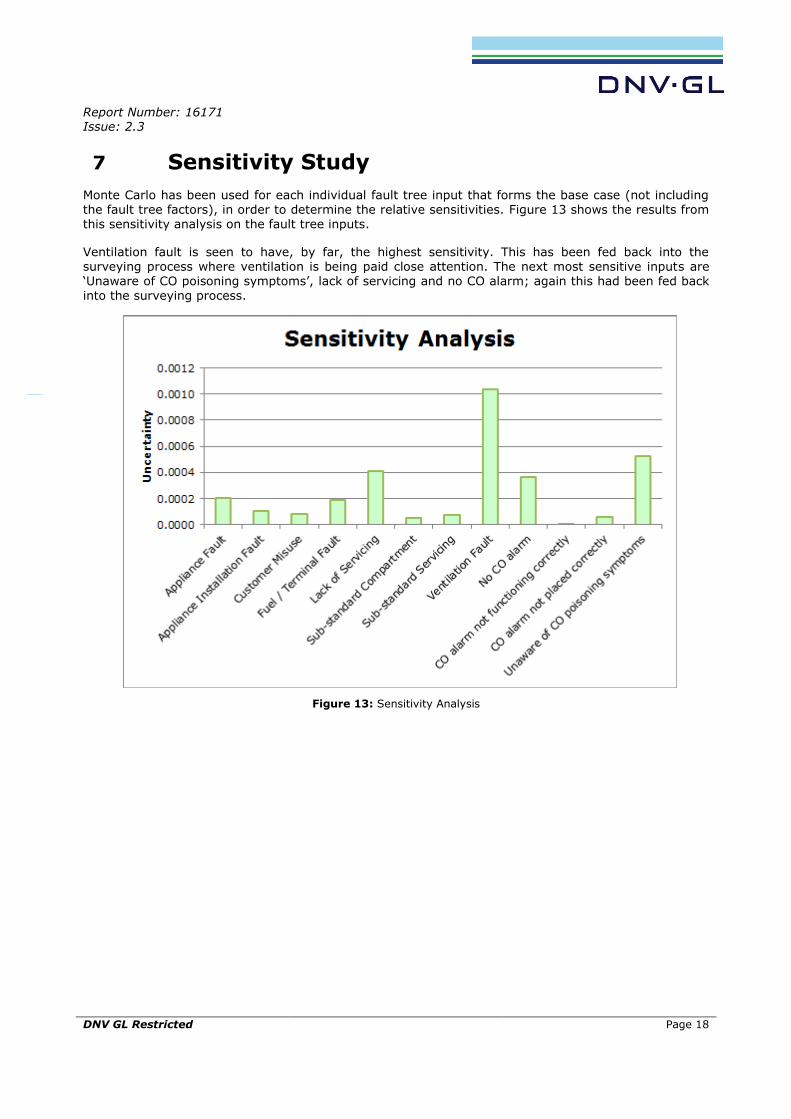
7 Sensitivity Study
Monte Carlo has been used for each individual fault tree input that forms the base case (not including the fault tree factors), in order to determine the relative sensitivities. Figure 13 shows the results from this sensitivity analysis on the fault tree inputs.
Ventilation fault is seen to have, by far, the highest sensitivity. This has been fed back into the surveying process where ventilation is being paid close attention. The next most sensitive inputs are ‘Unaware of CO poisoning symptoms’, lack of servicing and no CO alarm; again this had been fed back into the surveying process.
Figure 13: Sensitivity Analysis
Report Number: 16171 Issue: 2.3
DNV GL Restricted
Page 19
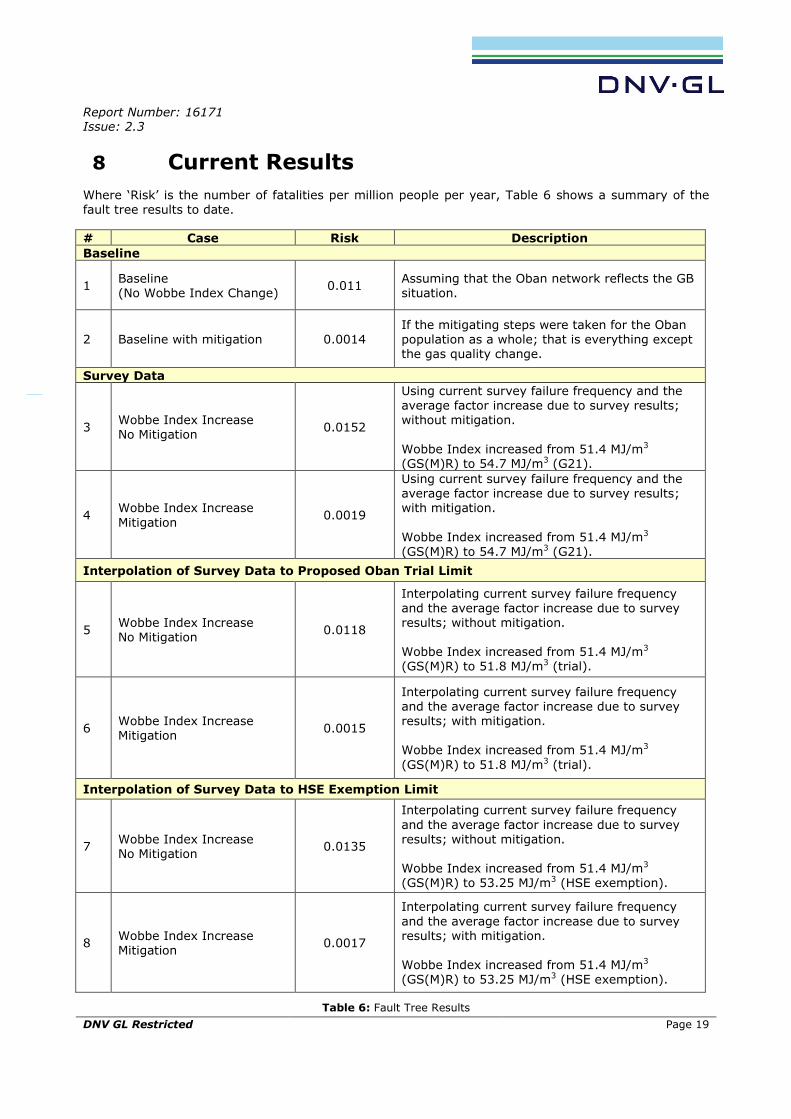
8 Current Results
Where ‘Risk’ is the number of fatalities per million people per year, Table 6 shows a summary of the fault tree results to date.
# Case Risk Description
Baseline
1 Baseline (No Wobbe Index Change)
0.011 Assuming that the Oban network reflects the GB situation.
2 Baseline with mitigation 0.0014 If the mitigating steps were taken for the Oban population as a whole; that is everything except the gas quality change.
Survey Data
3 Wobbe Index Increase No Mitigation
0.0152
Using current survey failure frequency and the average factor increase due to survey results; without mitigation.
Wobbe Index increased from 51.4 MJ/m3 (GS(M)R) to 54.7 MJ/m3 (G21).
4 Wobbe Index Increase
Mitigation 0.0019
Using current survey failure frequency and the average factor increase due to survey results; with mitigation.
Wobbe Index increased from 51.4 MJ/m3
(GS(M)R) to 54.7 MJ/m3 (G21).
Interpolation of Survey Data to Proposed Oban Trial Limit
5 Wobbe Index Increase No Mitigation
0.0118
Interpolating current survey failure frequency and the average factor increase due to survey results; without mitigation. Wobbe Index increased from 51.4 MJ/m3 (GS(M)R) to 51.8 MJ/m3 (trial).
6 Wobbe Index Increase Mitigation
0.0015
Interpolating current survey failure frequency and the average factor increase due to survey results; with mitigation. Wobbe Index increased from 51.4 MJ/m3
(GS(M)R) to 51.8 MJ/m3 (trial).
Interpolation of Survey Data to HSE Exemption Limit
7 Wobbe Index Increase No Mitigation
0.0135
Interpolating current survey failure frequency
and the average factor increase due to survey results; without mitigation. Wobbe Index increased from 51.4 MJ/m3 (GS(M)R) to 53.25 MJ/m3 (HSE exemption).
8 Wobbe Index Increase Mitigation
0.0017
Interpolating current survey failure frequency
and the average factor increase due to survey results; with mitigation. Wobbe Index increased from 51.4 MJ/m3 (GS(M)R) to 53.25 MJ/m3 (HSE exemption).
Table 6: Fault Tree Results

Report Number: 16171 Issue: 2.3
DNV GL Restricted
Page 20
The data in the table is categorised into “Cases” with risks resulting from the QRA model and a description of the result. The table has been built up using previous data, together with the new results from this work. The study introduces “mitigation” that highlights the beneficial effects of surveying appliances and properties with regard to overall appliance condition and performance and, for example, ventilation within the property. For more details on the change in Wobbe Index please see section 2.
Results 1 and 2 are the base risks. Results 3 and 4 have been estimated using the Oban survey data [20]; these results will be discussed further in section 8.1.
Results 5 - 8 have been generated by interpolating between the results for Wobbe Indices 51.4 MJ/m3 and 54.7 MJ/m3, see Figure 14. A linear interpolation has been adopted based on the test results
achieved at G20 and G21. These results are expected to be conservative, providing the CO emission trend is as in Figure 5 and Figure 6, which has been observed in previous studies, for example, the recent GasQual study [8].
Figure 14: Interpolated Risk
Using the Oban survey data, the base case risk of 0.011 increases to 0.0152 for an increase in Wobbe Index from 51.4 MJ/m3 (GS(M)R) to 54.7 MJ/m3 (G21) without mitigation; with mitigation, the base risk of 0.011 decreases to 0.0019.
Using interpolation, the base case risk of 0.011 increases to 0.0118 for an increase in Wobbe Index
from 51.4 MJ/m3 (GS(M)R) to 51.8 MJ/m3 without mitigation; with mitigation, the base risk of 0.011
decreases to 0.0015.
Using interpolation, the base case risk of 0.011 increases to 0.0135 for an increase in Wobbe Index from 51.4 MJ/m3 (GS(M)R) to 53.25 MJ/m3 without mitigation; with mitigation, the base risk of 0.011 decreases to 0.0017.
As the number of properties surveyed increases, the confidence intervals on the number of unsafe appliances found will tighten. For more information see the DNV GL report titled “Support to Statistical Approach Relating to the Survey of Gas Appliances within Oban” [21].
8.1 Risk Results
Kiwa Gastec has conducted house-to-house appliance tests in Oban using three test gases. One test gas is within, one below and one above the current GS(M)R limits on Wobbe Index (see section 2 for
more details). The tests have been carried out on all gas appliances within a property. Note that gas cookers may give rise to more than one test result due to the presence of a number of different
Report Number: 16171 Issue: 2.3
DNV GL Restricted
Page 21
burners – grills, ovens and large and small hob burners were each tested separately. Results have been calculated by estimating both the base risk associated with changing the Wobbe Index and the average risk factor of appliances surveyed. Please note that the data has not been screened by DNV GL, with the exception of ignoring records where CO ppm results are zero or blank, and the data has been used as received.
8.1.1 Absolute CO Risk
The percentage of appliances in the survey which have exhibited an absolute CO ppm value greater than or equal to 1000 ppm for decreased Wobbe Index (using test gas G23 as defined in EN 437) and
increased the Wobbe Index (using test gas G21 as defined in EN 437) have been inspected. G20 is the reference gas [22].
Four appliances exhibited a CO ppm value greater than or equal to 1000 ppm (1069, 1276, 1740 and 2105 ppm) for the G23 test gas from a total of 1875 records; this leads to a frequency of 0.0021.
18 appliances exhibited a CO ppm value greater than or equal to 1000 ppm (ranging from 1048 -
5652 ppm) for the G21 test gas from a total of 1916 records; this leads to a frequency of 0.0094.
In both cases, the percentage of extreme absolute CO values (>1000 ppm) is less than 1% of the surveyed properties.
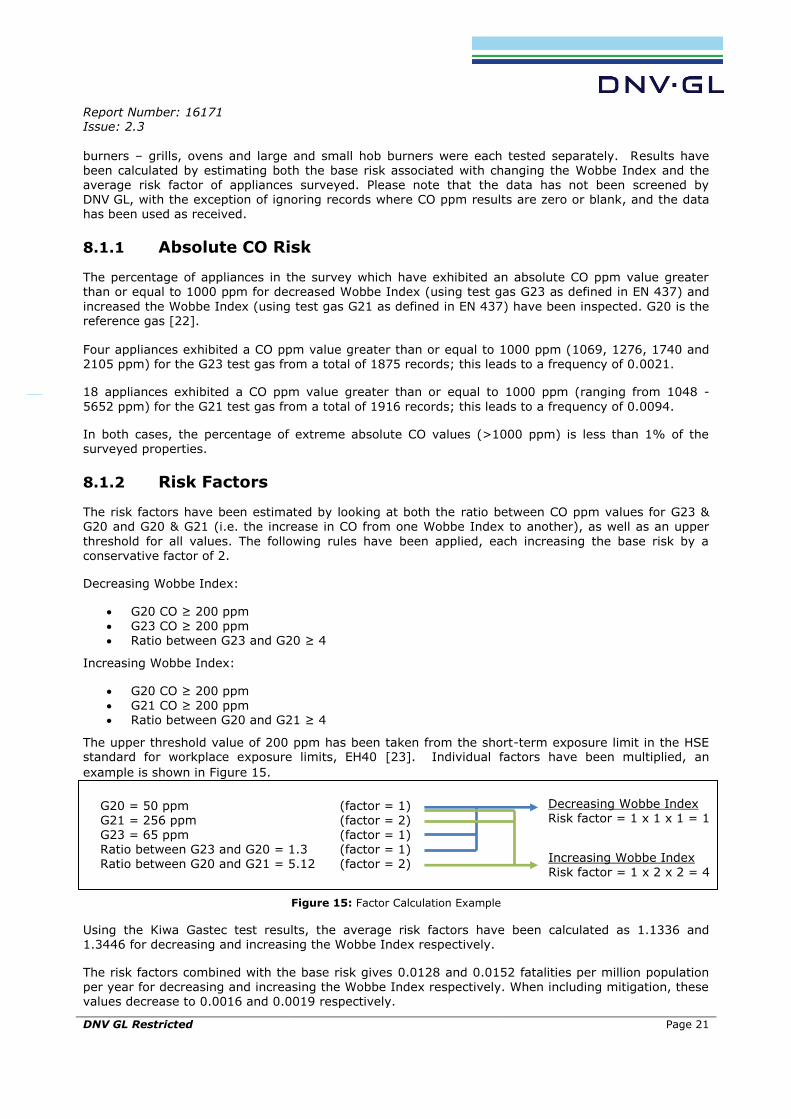
8.1.2 Risk Factors
The risk factors have been estimated by looking at both the ratio between CO ppm values for G23 & G20 and G20 & G21 (i.e. the increase in CO from one Wobbe Index to another), as well as an upper
threshold for all values. The following rules have been applied, each increasing the base risk by a
conservative factor of 2.
Decreasing Wobbe Index:
G20 CO ≥ 200 ppm G23 CO ≥ 200 ppm Ratio between G23 and G20 ≥ 4
Increasing Wobbe Index:
G20 CO ≥ 200 ppm G21 CO ≥ 200 ppm Ratio between G20 and G21 ≥ 4
The upper threshold value of 200 ppm has been taken from the short-term exposure limit in the HSE standard for workplace exposure limits, EH40 [23]. Individual factors have been multiplied, an
example is shown in Figure 15.
Figure 15: Factor Calculation Example
Using the Kiwa Gastec test results, the average risk factors have been calculated as 1.1336 and 1.3446 for decreasing and increasing the Wobbe Index respectively.
The risk factors combined with the base risk gives 0.0128 and 0.0152 fatalities per million population
per year for decreasing and increasing the Wobbe Index respectively. When including mitigation, these values decrease to 0.0016 and 0.0019 respectively.
G20 = 50 ppm (factor = 1) G21 = 256 ppm (factor = 2) G23 = 65 ppm (factor = 1) Ratio between G23 and G20 = 1.3 (factor = 1) Ratio between G20 and G21 = 5.12 (factor = 2)
Increasing Wobbe Index Risk factor = 1 x 2 x 2 = 4
Decreasing Wobbe Index Risk factor = 1 x 1 x 1 = 1

Report Number: 16171 Issue: 2.3
DNV GL Restricted
Page 22
Micromorts are used as a comparative measure of risk for various hazards. A variety of micromorts are listed in Appendix B as a comparison for the risks of CO fatalities calculated for this project.
9 No Access
The more properties surveyed in Oban, the higher the accuracy of the estimated overall risk score for Oban. However, properties for which no access can be gained must be looked at on a case by case
basis.
When looking at individual cases all known factors about the property (see Section 5) can be applied. If
however, there is something unknown about the property (which is inevitable if a full inspection is not
undertaken), then a reasonable worst case must be assumed. For example, if the occupant age is unknown the reasonable worst case is that the occupant is over the age of 70.
10 Summary
Where risk is defined as the number of fatalities per million people per year, the results in Table 7 have been estimated using the fault tree approach to evaluating the risk associated with CO and changing the acceptable gas quality.
Wobbe Index
(MJ/m³) Risk
Difference versus existing GB risk
level
GS(M)R Limit
51.4 Without Mitigation 0.011 0.0000
With Mitigation* 0.0014 -0.0096
Survey Test Gas Limit, G21 (from survey data)
54.7 Without Mitigation 0.0152 0.0042
With Mitigation* 0.0019 -0.0091
HSE Exemption Limit (from survey data)
53.25 Without Mitigation 0.0135 0.0025
With Mitigation* 0.0017 -0.0093
Proposed Oban Field Trial Limit (from survey data) (Assuming that the Wobbe Index is the average of the likely Zeebrugge gas quality)
51.8 Without Mitigation 0.0118 0.0008
With Mitigation* 0.0015 -0.0095
*Mitigation includes surveying appliance installations regarding their condition and performance, and rectifying where necessary.
Table 7: Summary of Fault Tree Results
The resultant risk has been calculated using all the available Oban survey data. A risk value for “no
access” properties shall be calculated on a case by case basis by combining known information and assuming a reasonable worst case for unknown information.
Using interpolation of the latest survey results, the base risk of 0.011 increases to 0.0135 for an increase in Wobbe Index from 51.4 MJ/m3 (GS(M)R) to 53.25 MJ/m3 (HSE exemption). The risk values
for gas quality are approximately thirty times lower than those for electrocution in the home, and over
five hundred times lower than those for CO poisoning from solid fuel.

Report Number: 16171 Issue: 2.3
DNV GL Restricted
Page 23
11 References
[1] BS EN 437:2003+A1:2009 “Test Gases, Test Pressures, Appliance Categories”, Tables 1 and 2, 2009.
[2] Gas Safety (Management) Regulations 1996, Part I “Requirements Under Normal Conditions”, 1996.
[3] Gas Safety (Management) Regulations 1996, Part II “Requirements for Gas Conveyed to Prevent a Supply Emergency”, 1996.
[4] BS EN 50292:2002 “Electrical apparatus for the detection of carbon monoxide in domestic premises. Guide on the selection, installation, use and maintenance”, February 2002.
[5] BS 7967-5:2010 “Carbon monoxide in dwellings and other premises and the combustion performance of gas-fired appliances. Guide for using electronic portable combustion gas
analysers in non-domestic premises for the measurement of carbon monoxide and carbon dioxide levels and the determination of combustion performance”, September 2010.
[6] IGEM Flame newsfeed - Issue 70, IGEM, 5th June 2014.
[7] Rationale for the selection of 18 appliances for laboratory tests using gases over an extended Wobbe Index range, Kiwa, 2014.
[8] D6-1 Conclusions on domestic appliances, GasQual, January 2012.
[9] CAIS23 revision 2: Gas Safety in Catering and Hospitality, HSE, July 2013.
[10] Downstream Incident Data Report (DIDR) 2011/2012, Gas Safety Trust, 2012.
[11] Study on the Provision of Carbon Monoxide Detectors Under The Building Regulations BD 2754, Department for Communities and Local Government, September 2009.
[12] Domestic Carbon Monoxide Alarms Long-term Reliability and Use Scoping Study, HSE, 2011.
[13] Gas Safety Trust; Carbon Monoxide Trends Report – 1996 to 2010, Gas Safety Trust, 2011.
[14] Big Picture COHB Dailies.xlsx, Kiwa, 2014.
[15] “FaultTree+” software package (V11.2.3), Isograph Ltd.
[16] 2011 Census: Key Statistics for England and Wales, Office for National Statistics, March 2011.
[17] Oban_Survey_Results_Cleansed_v3.1.xlsx, Dave Lander Consulting, 2014.
[18] Supported Housing for Older People in the UK: An Evidence Review, Joseph Rowntree Foundation, December 2012.
[19] SGN Exemption Application for the Oban Field Trial, SGN, November 2014 – draft document by Dave Lander Consulting.
[20] Export-2015-01-30-13-48.xlsx, Kiwa, January 2014.
[21] 15870 “Support to Statistical Approach Relating to the Survey of Gas Appliances within Oban”, Suzanne Bradbury (DNV GL), 20th October 2014.
[22] BS EN 437:2003+A1:2009 “Test gases. Test pressures. Appliance categories” 31 May 2009
[23] EH40/2005 Workplace Exposure Limits, HSE, March 2013.
[24] “The Odds of Dying”, LiveScience.com, http://www.livescience.com/3780-odds-dying.html, 3rd March 2015 14:00
[25] Statistics on fatal injuries in the workplace in Great Britain 2014, The Health and Safety Executive, July 2014.
[26] Electrical Safety First Core Data Set - 2010, Electrical Safety First, http://www.electricalsafetyfirst.org.uk/news-and-campaigns/policies-and-research/statistics/, 3rd March 2015 14:00
[27] Re-valuation of Home Accidents, Transport Research Laboratory, March 2010
[28] 2010-Based Statistical Bulletin, Office for National Statistics, National Population Projections
October 2011.
[29] Home Population and Components of Change 2000-2013, Northern Ireland Statistics and Research Agency, 2014.
[30] Measuring National Well-being - Households and Families, 2012. Office for National Statistics 26 April 2012)

Report Number: 16171 Issue: 2.3
DNV GL Restricted
Page 24
[31] Off-gas consumers Information on households without mains gas heating. Consumer Focus http://www.consumerfocus.org.uk/files/2011/10/Off-gas-consumers.pdf
[32] CO-Gas Safety’s 20th Anniversary (1995-2015)
http://www.co-gassafety.co.uk/presspack/Press%20Pack%20%202015.pdf
Report Number: 16171 Issue: 2.3
DNV GL Restricted Page A-1
Appendix A Fault Tree
Report Number: 16171 Issue: 2.3
DNV GL Restricted Page B-1
Appendix B Micromorts
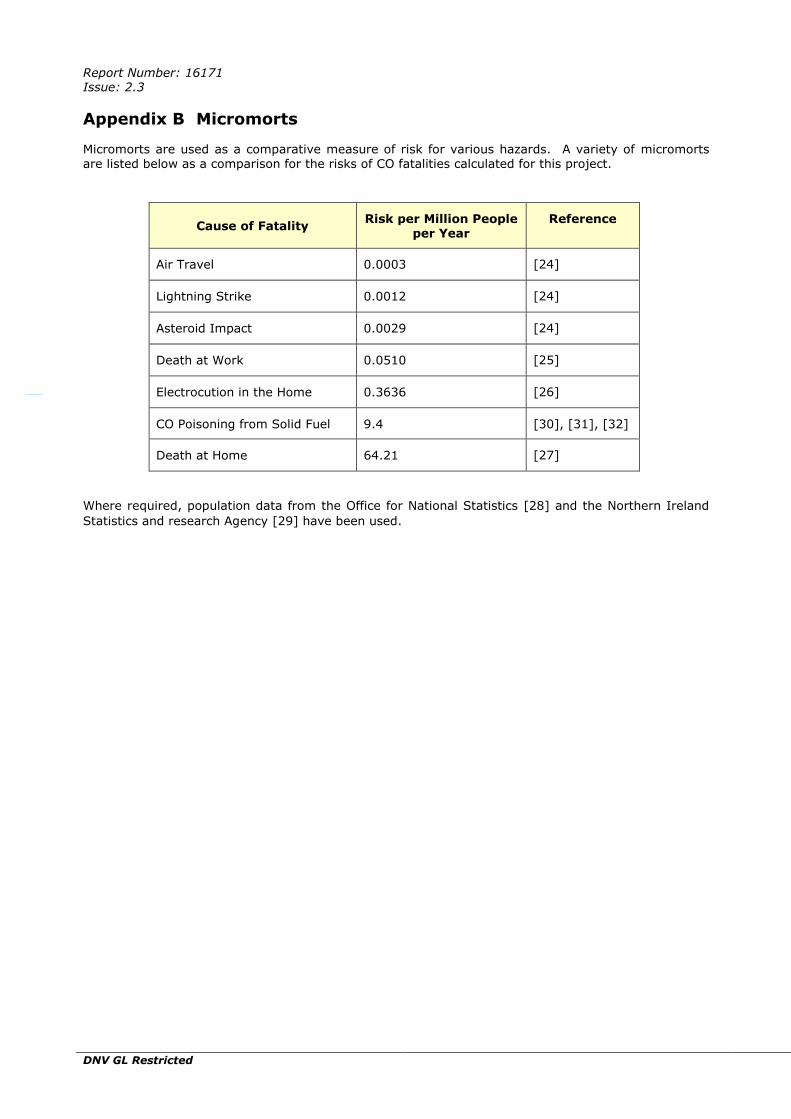
Micromorts are used as a comparative measure of risk for various hazards. A variety of micromorts are listed below as a comparison for the risks of CO fatalities calculated for this project.
Cause of Fatality Risk per Million People
per Year Reference
Air Travel 0.0003 [24]
Lightning Strike 0.0012 [24]
Asteroid Impact 0.0029 [24]
Death at Work 0.0510 [25]
Electrocution in the Home 0.3636 [26]
CO Poisoning from Solid Fuel 9.4 [30], [31], [32]
Death at Home 64.21 [27]
Where required, population data from the Office for National Statistics [28] and the Northern Ireland
Statistics and research Agency [29] have been used.