quantitative sharia-screening effect on portfolio
TRANSCRIPT

Global Review of Islamic Economics and Business, Vol. 9, No. 1 (2021) 043-063
Published by Faculty of Islamic Economics and Business, State Islamic University Sunan Kalijaga Yogyakarta e-ISSN: 2338-7920, p-ISSN: 2338-2619
*Corresponding author.
[email protected] (S. Arifin), [email protected] (I. Qizam).
https://doi.org/10.14421/grieb.2021.091-04 This is an open access article under the CC–BY-SA license
Quantitative Sharia-Screening Effect on Portfolio Performance and Volatility:
Evidence from Indonesia
Syamsul Arifina and Ibnu Qizamb, *
aIAIN Pekalongan, Indonesia bUIN Syarif Hidayatullah Jakarta, Indonesia
Abstract: The aim of this study is to examine the comparative performance and volatility between
Sharia and conventional portfolios listed on the Indonesia Stock Exchange (IDX) and to investigate
the effect of quantitative (debt-ratio) screening on the Sharia-and-conventional-portfolios returns
specifically applied in the selected public firms with the inter-industrial low-correlations. Applying a
non-parametric test, the autoregressive integrated moving average (ARIMA) model, and the
regression analysis, the results suggest that there is no difference in performance between Sharia and
conventional portfolios; Sharia portfolios show the lower risks than conventional portfolios. Using
quantitative Sharia-screening, the debt-to-equity ratio (DER) affects Sharia-portfolio returns, but not
conventional-portfolio returns. This study contributes to providing country-specific evidence on
applying quantitative Sharia-screening. Taking notice of the existing high-profile debt-ratio and
applying the relatively loose standard of quantitative Sharia-screening for the public firms in
Indonesia, this suggests that a country-specific quantitative Sharia-screening standard should be
supported.
Keywords: Quantitative Sharia-Screening, Debt-Ratio, Sharia-Portfolio Return, Conventional-
Portfolio Return, and Portfolio Volatility.
Article History
Received 8 February 2021; Accepted 5 July 2021; Available Online 21 August 2021
Introduction
Sharia screening is a relatively new phenomenon for Islamic finance. Up to the 1970s, Muslim
communities reluctantly took part in the stock market due to the Sharia constraints on the capital
market. In the 1990s, a breakthrough occurred in connection with stock investments, and Muslims
were allowed to participate in the stock market under certain conditions (Htay et al., 2013). The
selection of Sharia-compliant companies is carried out through a Sharia-screening process based on
two parameters: qualitative and quantitative. In considering a firm’s status, qualitative criteria are
used to ensure that they are not involved in several activities such as financial services based on riba
(usury), gharar (speculation), maisir (gambling), and production or trade for non-halal goods such as
alcohol and pork while the quantitative screening address three angles such as the level of earnings,
income from interest and other items, and cash-flow level and accounts receivable (Sani & Othman,
2013).
Sharia screening is run by different providers of Sharia indices and all providers should be under
the conditions set by the respective Sharia supervisory bodies. However, there is no consistent Sharia-
screening standard among the users from all the respective countries. No Sharia-screening standard
for practice is considered to hinder the progress of the Islamic capital market and can decrease
investors’ confidence in the future (Htay et al., 2013). The different standards in quantitative Sharia
screening, especially in debt screening, exist among the respective countries as depicted in Table 1.
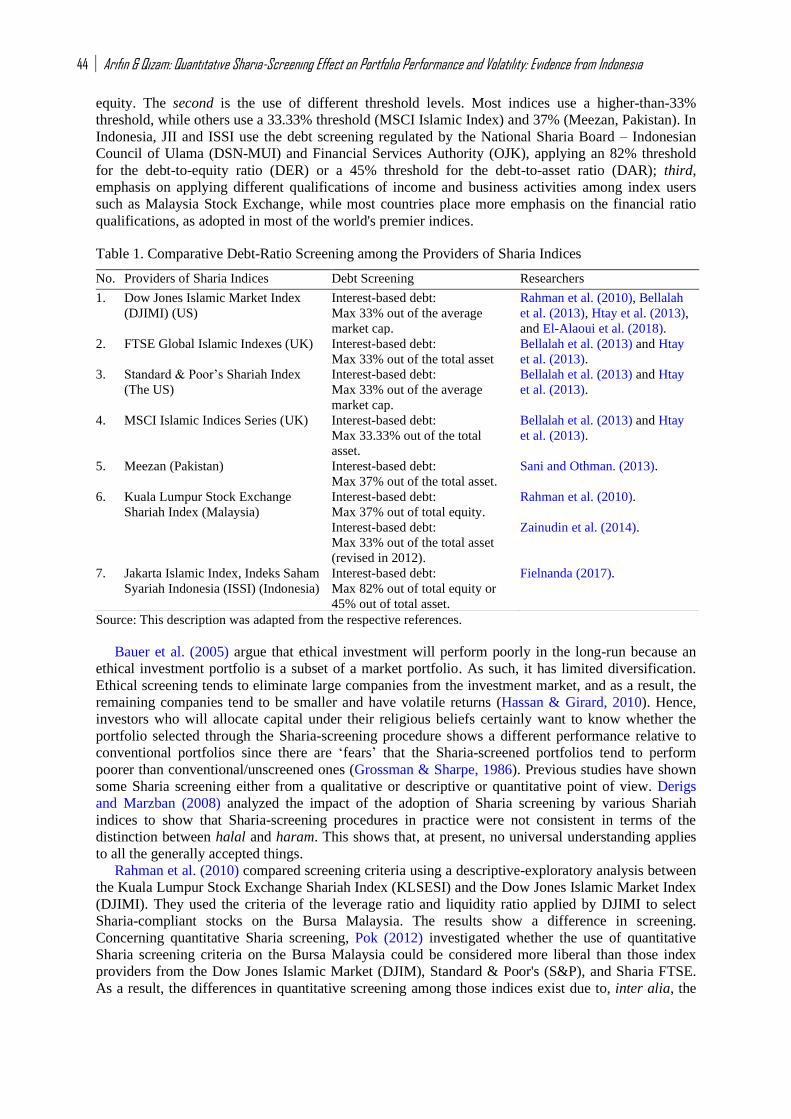
The difference in quantitative Sharia screening, according to Pok (2012), occurs due to a
combination of the following factors: first, the use of different denominators. For example, the DJIM
index calculates a firm’s value using market capitalization, while other indices use total assets or total
44 Arifin & Qizam: Quantitative Sharia-Screening Effect on Portfolio Performance and Volatility: Evidence from Indonesia
equity. The second is the use of different threshold levels. Most indices use a higher-than-33%
threshold, while others use a 33.33% threshold (MSCI Islamic Index) and 37% (Meezan, Pakistan). In
Indonesia, JII and ISSI use the debt screening regulated by the National Sharia Board – Indonesian
Council of Ulama (DSN-MUI) and Financial Services Authority (OJK), applying an 82% threshold
for the debt-to-equity ratio (DER) or a 45% threshold for the debt-to-asset ratio (DAR); third,
emphasis on applying different qualifications of income and business activities among index users
such as Malaysia Stock Exchange, while most countries place more emphasis on the financial ratio
qualifications, as adopted in most of the world's premier indices.
Table 1. Comparative Debt-Ratio Screening among the Providers of Sharia Indices
Source: This description was adapted from the respective references.
Bauer et al. (2005) argue that ethical investment will perform poorly in the long-run because an
ethical investment portfolio is a subset of a market portfolio. As such, it has limited diversification.
Ethical screening tends to eliminate large companies from the investment market, and as a result, the
remaining companies tend to be smaller and have volatile returns (Hassan & Girard, 2010). Hence,
investors who will allocate capital under their religious beliefs certainly want to know whether the
portfolio selected through the Sharia-screening procedure shows a different performance relative to
conventional portfolios since there are ‘fears’ that the Sharia-screened portfolios tend to perform
poorer than conventional/unscreened ones (Grossman & Sharpe, 1986). Previous studies have shown
some Sharia screening either from a qualitative or descriptive or quantitative point of view. Derigs
and Marzban (2008) analyzed the impact of the adoption of Sharia screening by various Shariah
indices to show that Sharia-screening procedures in practice were not consistent in terms of the
distinction between halal and haram. This shows that, at present, no universal understanding applies
to all the generally accepted things.
Rahman et al. (2010) compared screening criteria using a descriptive-exploratory analysis between
the Kuala Lumpur Stock Exchange Shariah Index (KLSESI) and the Dow Jones Islamic Market Index
(DJIMI). They used the criteria of the leverage ratio and liquidity ratio applied by DJIMI to select
Sharia-compliant stocks on the Bursa Malaysia. The results show a difference in screening.
Concerning quantitative Sharia screening, Pok (2012) investigated whether the use of quantitative
Sharia screening criteria on the Bursa Malaysia could be considered more liberal than those index
providers from the Dow Jones Islamic Market (DJIM), Standard & Poor's (S&P), and Sharia FTSE.
As a result, the differences in quantitative screening among those indices exist due to, inter alia, the
No. Providers of Sharia Indices Debt Screening Researchers
1. Dow Jones Islamic Market Index
(DJIMI) (US)
Interest-based debt:
Max 33% out of the average
market cap.
Rahman et al. (2010), Bellalah
et al. (2013), Htay et al. (2013),
and El-Alaoui et al. (2018).
2. FTSE Global Islamic Indexes (UK) Interest-based debt:
Max 33% out of the total asset
Bellalah et al. (2013) and Htay
et al. (2013).
3. Standard & Poor’s Shariah Index
(The US)
Interest-based debt:
Max 33% out of the average
market cap.
Bellalah et al. (2013) and Htay
et al. (2013).
4. MSCI Islamic Indices Series (UK) Interest-based debt:
Max 33.33% out of the total
asset.
Bellalah et al. (2013) and Htay
et al. (2013).
5. Meezan (Pakistan) Interest-based debt:
Max 37% out of the total asset.
Sani and Othman. (2013).
6. Kuala Lumpur Stock Exchange
Shariah Index (Malaysia)
Interest-based debt:
Max 37% out of total equity.
Rahman et al. (2010).
Interest-based debt:
Max 33% out of the total asset
(revised in 2012).
Zainudin et al. (2014).
7. Jakarta Islamic Index, Indeks Saham
Syariah Indonesia (ISSI) (Indonesia)
Interest-based debt:
Max 82% out of total equity or
45% out of total asset.
Fielnanda (2017).

Global Review of Islamic Economics and Business, Vol. 9, No. 1 (2021) 043-063 45
use of different formulas to calculate ratios, the use of different thresholds, and the different emphases
applied by the indices from the respective countries.
In this study, we investigate the differences in performance and volatility of Sharia and
conventional stock portfolios. Besides, we also examine the effect of quantitative Sharia screening,
namely the ratio of leverage on returns and volatility of stock portfolios. In Indonesia, Sharia-
screening literature, especially focusing on quantitative screening, is still limited. Research related to
portfolio performance in Indonesia, inter alia, was conducted by Setiawan and Oktariza (2013) and
Listyaningsih and Krishnamurti (2015). Setiawan and Oktariza (2013) looked into the effect of
financial ratios, including debt-to-equity ratio (DER), on portfolio returns. To the best of our
knowledge, however, they did not discuss financial ratios which were specifically only related to a
variety of quantitative Sharia screening. As such, this study aims to investigate whether or not the
differences in performance and volatility between Sharia and conventional stock portfolios listed on
the Indonesia Stock Exchange (IDX) arise. Also, this study is intended to check into the effect of
quantitative Sharia screening (using debt ratios) on returns for Sharia and conventional stock
portfolios.
To arrive at these ends, the next discussion will be arranged as follows. Section 2 will present
literature review and hypothesis development; Section 3 will explain methodology; Section 4 will be
concerned with the results and discussion; and Section 5 will summarize all the above discussion to
make a conclusion and implications.
Literature Review and Hypothesis Development
Most of the previous studies on the performance of indices either for ethical or Sharia or conventional
indices do not exhibit any difference. For instance, Bauer et al. (2005) compared the performance of
ethical and conventional mutual funds in three countries such as Germany, the United Kingdom, and
the United States during the period of 1990-2001 using the Carhart multi-factor model. They found no
statistically significant difference between ethical and conventional mutual funds. Albaity and Ahmad
(2008) tested the return and risk performance of the Kuala Lumpur Shariah Index (KLSI) and
compared it with the Kuala Lumpur Composite Index (KLCI). The results suggest no statistically
significant difference in risk adjusted-return between Sharia and conventional indices during a 1999-
to-2005 period. They also used co-integration tests to look into the short-term and long-term
relationships of the two indices. They found that the indices moved together and in the same direction.
Likewise, in Hassan and Girard (2010)'s study, the performance of seven indices selected from the
Dow Jones Islamic Market (DJIM) was examined and was compared with conventional indices using
several measures such as Sharpe-ratio, Treynor-ratio, the selectivity of Jensen and Fama, and
Carhart's four-factor model using a co-integration test. The results show no difference between the
two indices being compared.
In Indonesia, Setiawan and Oktariza (2013) compared the performance of Sharia and conventional
stock portfolios of public firms listed on the Indonesia Stock Exchange (IDX). In addition to testing
the performance of stock portfolios, this study also examined the effect of financial ratios on stock
returns. Regarding its performance, they did not find any difference in performance between Sharia
and conventional stocks in terms of cumulative returns, standard deviations, and betas. Regarding
these financial ratios, they found a significant simultaneous relationship between financial ratios and
both Sharia and conventional stock returns. Likewise, Listyaningsih and Krishnamurti (2015)
compared the performance of the Jakarta Islamic Index (JII) with other indices, both Sharia index
(ISSI) and non-Sharia one, divided into two research periods, that is, 2005-2007 and 2008-2012. The
results show no difference in performance between the JII index and the non-JII index. As a result, the
hypotheses are stated as follows.
H1a: There is a significant difference in performance between Sharia and conventional stock portfolios
measured using the Sharpe-ratio.
H1b: There is a significant difference in performance between Sharia and conventional stock portfolios
measured using the Treynor-ratio.
H1c: There is a significant difference in performance between Sharia and conventional stock portfolios
measured using the M2-ratio.

46 Arifin & Qizam: Quantitative Sharia-Screening Effect on Portfolio Performance and Volatility: Evidence from Indonesia
Furthermore, the relationship between Sharia screening, performance, and volatility was
investigated, inter alia, by Ashraf et al. (2017). They investigate the effect of quantitative Sharia
screening, involving the limitation on financial leverage and investment in real assets (operating
leverage), on the performance of Sharia portfolios. Given the empirical results, they found that
investors sacrificed potential returns on limited portfolios (due to screening) but also avoided some
risk. El-Alaoui et al. (2018) also investigated the relationship between corporate leverage, return, and
stock price volatility from the perspective of Islamic finance and capital structure theory. They used
mean-variance efficient frontier (MVEF) to analyze a sample of 320 firms from eight countries in
Europe which were divided into two types of portfolios, i.e., low debt-portfolios and high debt-
portfolios using a debt-screening threshold of 33%. The results show that changes in return and
volatility occur when changes in capital structure exist. In addition, in many cases, Sharia-compliant
stocks tend to have lower volatility relative to non-Sharia-compliant stocks, but there is no difference
in terms of return. Hence, the hypothesis below is worth testing.
H2: The volatility of Sharia portfolio is lower than that of conventional portfolio.
Concerning financial ratios, Suharli (2005) looked into two factors that affected stock returns. The
two factors included debt ratio (debt to equity ratio or DER) and the level of risk as measured by stock
beta based on the capital asset pricing model (CAPM) theory. The results suggest that neither the debt
ratio nor the level of risk affects stock returns. Arista and Astohar (2012) analyzed the factors that
influenced stock returns, including debt-to-equity ratio (DER), the price-to-book value (PBV),
earning-per-share (EPS), and return-on-assets (ROA). The results imply that DER and PBV have a
significant positive effect on stock returns, while ROA and EPS have no significant effect on stock
returns. For the effect of DER and stock returns, the results of this study are different from the
previous results, showing that DER has no significant effect on stock returns. Setiawan and Oktariza
(2013), in addition to comparing the performance of Sharia and conventional stock portfolios, also
analyzed the effect of financial ratios (DER, EPS, PER, NPM, ROE, and PBV) on both Sharia and
conventional stock returns. For Sharia stocks, all variables, except for NPM, have a significant effect
on stock returns, while for conventional stocks, all variables, except for NPM and PBV, have a
significant effect on stock returns. As such, the hypothesis is stated as follows.
H3: Debt-to-equity ratio (DER) has a positive impact on the returns of both Sharia and conventional
stock portfolios.
Methodology
Data and Samples
This research applied the comparative-explanatory analysis to examine the effect of Sharia screening
on portfolio performance and volatility and compared the results between Sharia and conventional
stock portfolios in the Indonesia Stock Exchange. This research used secondary data to be arranged
across firms and in time-series (panel data). Data is taken from monthly and annual data from stock
prices and financial-ratios of public firms listed on the Indonesia Stock Exchange (IDX) for
quantitative screening analysis. We also collected data from the official website of the Indonesia
Stock Exchange (www.idx.co.id) and Yahoo Finance (www.finance.yahoo.com).
The sample in this study was drawn from a population of stock prices and financial ratios,
amounting to 173 out of 627 public firms listed on the Indonesia Stock Exchange (IDX). Both
monthly and annual data were collected for five years (2013-2017). In sampling, the purposive
method was adopted, i.e., selecting companies listed on the Indonesia Stock Exchange (IDX), the
shares of which were compliant with Sharia and non-Sharia screening through first of all classifying
them into the industrial sector. In the first step, we took seven industrial sectors (excluding the
financial sector), inter alia, including property, trade, consumption, infrastructure, agriculture,
mining, and manufacturing. Furthermore, of the seven sectors, we selected three industrial sectors, the
performances (returns) of which were negatively correlated to one another (having the lowest
coefficients of correlation across industrial sectors). Low correlation shows that little effect exists
across the industrial sectors. In the context of the portfolio theory, low correlation leads to the lower
unsystematic risk (Markowitz, 1991; Setiawan & Oktariza, 2013).

Global Review of Islamic Economics and Business, Vol. 9, No. 1 (2021) 043-063 47
Table 2. Coefficients of Return Correlation across Industrial Sectors (2015-2017)
Agriculture Consumer Infrastructure Manufacture Mining Property Trade
Agriculture 1 0.026242 -0.185467 0.081605 0.095016 -0.074472 -0.0439
Consumer 1 0.229734 0.595908 0.083677 0.25889 0.04626
Infrastructure 1 0.226076 0.05375 0.305920 -0.1697
Manufacture 1 0.304922 0.524755 0.15601
Mining 1 0.630240 0.33778
Property 1 0.18479
Trade 1
Source: Data was collected and adapted from www.yahoo.finance.com.
Holding Table 2, it appears that to observe the clearer impact of the test, only three negative
correlations out of the four negative correlations are selected, involving three industries where they
show a negative relationship with each other from one industry to the two other industries (see the
numbers in bold in Table 2, that is, linking agriculture to infrastructure, agriculture to trade, and trade
to infrastructure). The three industries have been successfully collected, i.e., the trade sector with a
total of 114 firms, consisting of 51 Sharia firms and 63 conventional firms, the infrastructure sector of
42 firms, consisting of 16 Sharia firms and 26 conventional ones, and the agriculture sector of 17
firms, consisting of 9 Sharia firms and 8 conventional firms. As such, the total of firms to be studied
were 173 units, consisting of 76 Sharia firms and 97 conventional firms. For the regression method,
we took annual data, while to analyze portfolio returns and volatility, we picked up monthly stock-
price data. The selected samples were the same and taken through purposive sampling, consisting of
25 firms, each of which was from the Sharia and conventional shares for five years (2013-2017).
Measurement of Variables and Analysis
Return
We used monthly and annual historical return data to be added and adjusted with adjusted-dividends
and stock splits, referring to the formula used by Hartono (2009) as follows.
(1)
where,
= return in period
= stock prices in period
= stock prices in period -1.
Portfolio Performance
To measure portfolio performance, we used three measures, including Sharpe-ratio, Treynor-ratio, and
the M2-ratio. Measurement using Sharpe-ratio or also known as reward-to-variability ratio emphasizes
total risk, in this case, proxied by the standard deviation. Standard deviation indicates the magnitude
of the stock-return changes to the average stock-return. In general, the higher the Sharpe-ratio is, the
better the performance of the stock portfolio will be. The formula is as follows.
(2)
where,
Sharpe-ratio
return of stock portfolio in period t
risk-free return (using the rate of Bank Indonesia)
total risk (standard deviation) of stock portfolio in period .
48 Arifin & Qizam: Quantitative Sharia-Screening Effect on Portfolio Performance and Volatility: Evidence from Indonesia
Measurement of stock-portfolio performance using the Treynor-ratio or also known as reward-to-
volatility ratio uses past average returns as expected returns and also beta as a risk measure. In
general, the performance of stock portfolios will be better if Treynor-ratio is higher. The formula is as
follows.
(3)
where,
Treynor-ratio
return of stock portfolio in period t
risk-free return (using the rate of Bank Indonesia)
total risk (standard deviation) of the stock portfolio in period .
βp = beta portfolio
Measuring portfolio performance using the Sharpe-ratio and Treynor-ratio could be easily
undertaken, but it is difficult to interpret the comparison between portfolio performance and market
performance. For example, a portfolio has a Sharpe-ratio of 0.60 and a market portfolio has a Sharpe-
ratio of 0.75. These results indicate that the portfolio has a value below market performance.
However, since the two Sharpe-ratios are two different measurements, the difference in the value of
0.15 is difficult to interpret. Graham and Harvey (1994) proposed an easier ratio to compare portfolio
performance with market performance, which was later popularized by Franco Modigliani and his
grandson Leah Modigliani, henceforth, known as the M2 ratio (Hartono, 2009: 637). The formula is as
follows.
(4)
where,
return of stock portofolio in period t
risk-free return (using the rate of Bank Indonesia)
market return in period t
market risk in period t
total risk (standard deviation) of the stock portfolio in period t.
Upon measuring portfolio performance using the aforementioned three measures, the Mann-
Whitney test, and t-test were run to test the difference in average portfolio performance between
Sharia and conventional stocks using the Sharpe ratio, Treynor ratio, and the M2-ratio.
Time-Series Analysis
In addition to comparing portfolio performance, this study also examines and compares portfolio
volatility between Sharia and conventional stocks. Volatility testing in this study used time series
analysis. According to Gujarati (2009), there are five approaches to time-based forecasting, such as
the exponential smoothing method, single-equation regression method, simultaneous-equation
regression model, autoregressive integrated moving average (ARIMA) model, and vector
autoregression.
In this study, we employed ARIMA, derived from a combination of auto-regression with
differencing-orders (AR) and moving-average (MA), for time-series analysis assuming that the data
has been stationary. It is often found that data relating to economics is non-stationary; as such,
modifications are needed to make distinctions to produce stationary data.
In general, the data becomes stationary if it has experienced a first-order differencing. When the
first-order differencing of data is not stationary, it is necessary to run the next differencing, and so on
until the data gets stationary. Thus, if the time-series data has enjoyed differencing as many times as it
becomes stationary and, then, is applied to the ARMA model (p, q), the model will become ARIMA
(p, d, q). For instance, the ARIMA model (2, 1, 3) means a model the data of which has experienced a
first-order differencing, has 2 autoregressive components, and 3 moving-average components. We

Global Review of Islamic Economics and Business, Vol. 9, No. 1 (2021) 043-063 49
have diagnosed a model using the ARCH (autoregressive conditional heteroskedasticity) tests and an
autocorrelation-test to get the best ARIMA model. Furthermore, the ARIMA model is run to test and,
then, compare the volatility between Sharia and conventional portfolios.
Multiple Regression Analysis
We employed multiple-regression analysis to examine the effect of quantitative Sharia screening
(using the debt-to-equity ratio) on portfolio returns of both Sharia and conventional stocks. The model
is as follows.
(5)
where,
= return of stock portofolio
= debt to equity
= return on equity
= price to book value
= earning per share
= current ratio
= coefficients of independent variables
= error terms.
Portfolio return is a dependent variable while DER is an independent variable as a proxy of
quantitative Sharia-screening while the other four independent variables, i.e., ROE, PBV, EPS, and
CR served as the control variables.
Results and Discussion
Comparative Performance using Sharp-Ratio, Treynor-Ratio, and M2-Ratio
Measurement of portfolio return, using the Sharpe-ratio, or also referred to as the reward-to-variability
ratio (RVAR), emphasizes the total risk as measured using standard deviations. To predict future
performance, historical data are employed. Historical data returns are considered as predictive future
returns. To analyze portfolio performance using the Sharpe-ratio requires data such as average return
on a portfolio, standard deviation, and risk-free rate. Descriptive statistics of the Sharpe-ratio,
Treynor-ratio, and M2-ratio measurements of the Sharia and conventional stocks in the Indonesia
Stock Exchange for the period of 2013-2017 (upon data transformation) could be highlighted in Table
3.
Table 3: Descriptive Statistics and Normality Test of Sharp-Ratio, Treynor-Ratio, and M2-Ratio for
Sharia and Conventional Portfolio
Statistics Panel A: Sharp-Ratio
Sharpe-Ratio
Panel B: Treynor-Ratio
Treynor-Ratio
Panel C: M2-Ratio
The M2-Ratio Sharia Conv. Sharia Conv. Sharia Conv.
Mean 2.452077 2.457883 1.028214 -0.072256 -0.006239 -0.002856 Median 2.426904 2.548467 1.043537 -0.038041 -0.010602 -0.009442
Maximum 3.578835 3.945533 3.001639 2.078560 0.013513 0.205077 Minimum 1.414387 0.825954 -0.596698 -2.911.305 -0.020475 -0.020434
Std. Dev. 0.419158 0.640701 0.967411 0.727486 0.010301 0.025043
Skewness 0.440530 -0.291034 0.109983 -0.310201 0.430114 5.855803 Kurtosis 3.311188 2.872980 1.906973 5.058476 1.722423 45.36792
Jarque-Bera 4.110872 1.671164 5.852902 21.76296 12.35519 10063.56 Probability 0.128037 0.433622 0.053587 0.000019 0.002075 0.000000
Observations 113 113 113 113 125 125
Source: These results were adapted from the data run with Eviews.
Given Panel A of Table 3, it appears that the Sharia portfolio has a higher minimum value of
Sharpe-ratio relative to conventional stock portfolios even though the maximum value of the Sharpe-

50 Arifin & Qizam: Quantitative Sharia-Screening Effect on Portfolio Performance and Volatility: Evidence from Indonesia
ratio of Sharia portfolios is below the conventional portfolio. The average performance of the two
portfolios shows comparable values. Likewise, the standard deviation of the Sharia stock portfolio is
only slightly smaller than the conventional stock portfolio. For the normality test, it appears that the
Sharpe-ratio’s data for both portfolios are normally distributed, denoted by the probability value of
each is 0.128037 and 0.433622, which is greater than the critical value (0.05) and the value of Jarque-
Bera for each portfolio is very small, meaning that the data is normally distributed.
Since both samples were normally distributed, an independent t-test was run to show whether there
was a difference in performance between Sharia and conventional stock portfolios using the Sharpe-
ratio. Before the test was carried out, the homogeneity of variance test was first a prerequisite needed
to determine the type of independent t-test, whether or not the assumption that variance was equal
could be met. F-value was found to be higher (2.336443) than its F-critical value (1.366389), meaning
that the variance was unequal. The results of the independent t-test are presented in Table 4.
Table 4. Independent t-Test for Sharpe-Ratio Performance (Two-Sample Assuming Unequal
Variances)
Statistics Sharia Conventional
Mean 2.452077 2.457882648
Variance 0.175694 0.410497953
Observations 113 113
Hypothesized Mean Difference 0
Df 193
t-Stat -0.0806
P(T<=t) One-Tail 0.467921
t Critical One-Tail 1.652787
P(T<=t) Two-Tail 0.935842
t Critical Two-Tail 1.972332
Source: These results were adapted from the data run with Ms. Excel.
Given Table 4, the t-stat value (-0.0806) is smaller than its critical value, i.e., 1,972332; hence, we
fail to reject the null hypothesis. As such, we infer that there is no difference in performance between
Sharia and conventional stock portfolios using the Sharpe ratio.
Similar to the initial data of Sharpe-ratio, the data of Treynor-ratio is also not normally distributed,
both for Sharia and conventional portfolios (see Panel B of Table 3). As a result, the data were also
transformed following the same case as the Sharpe-ratio. A significant probability value of the Sharia
portfolio is obtained since it is greater than the critical value of 0.05, while the probability of a
conventional portfolio is less than the critical value of 0.05. In other words, Sharia-portfolio data is
normally distributed while conventional portfolios are not normally distributed. As such, a non-
parametric test, the Mann-Whitney test, was performed where this test did not need the normality
assumption but should meet the assumption that the values of the random variables of the two groups
being compared were continuously distributed instead. This test applied either two directions or one
direction.
The Mann-Whitney test, also called the U test, is used as an alternative to the parametric test if the
assumptions needed for the test are not satisfied. Upon testing, the results are as shown in Table 5.
Table 5. Mann-Whitney Statistical Test for Treynor-Ratio
Statistics Values
The number of sample 1 ( ) 113
The number of sample 2 ( ) 113
Number of levels from ( ) 12588
Number of levels from ( ) 13063
Value of 6622
Comparison for U 6384.5
Value of employed 6622 = 6147
Source: These results were adapted from the data run with Ms. Excel.

Global Review of Islamic Economics and Business, Vol. 9, No. 1 (2021) 043-063 51
Since there are more than 20 data samples, the normal curve approach is used as follows:
1. Mean
2. Standard deviation
3. Calculated Value of Z = .
Using the significant level of , Z-value (Z-table) amounts to . Since the calculated-Z
is under the acceptance area, we fail to reject the null hypothesis ( ). As such, we conclude that there
is no different performance between Sharia and non-Sharia (conventional) portfolios when using
Treynor-ratio.
Given the results of statistical tests on previous ratios, the M2 ratio is also not normally distributed
(see Panel C of Table 3); hence, the non-parametric Mann-Whitney test was applied. The results are
depicted as seen in Table 6.
Table 6. Mann-Whitney Statistical Test for M2-Ratio
Statistics Values
Number of sample 1 ( ) 125
Number of sample 2 ( ) 125
Number of levels from ( ) 15538
Number of levels from ( ) 15837
Value of 7962
Comparison for U 7812.5
U-Value employed 7962 = 7663
Source: These results were adapted from the data run with Ms. Excel
Since there are more than 20 data samples, the normal curve approach was applied as follows:
1. Mean
2. Standard deviation
3. Calculated Value of Z =
Applying the significant level of , Z-value (Z-table) shows . Since the calculated-Z
covers the acceptance area, we also failed to reject the null hypothesis ( ). Hence, no different
performance exists between Sharia and non-Sharia (conventional) portfolios when using the M2 ratio.
Thus, these results confirm most of the previous studies regarding portfolio performance, i.e., there
is no difference in performance between Sharia and conventional portfolios. These results are in line
with several research results, inter alia, conducted by Bauer et al. (2004), Albaity and Ahmad (2008),
Hassan and Girrard (2010), Setiawan and Oktariza (2013), and Listyaningsih and Krishnamurti
(2015). Different results, however, were found by Ashraf et al. (2017) and El-Alaoui et al. (2018)
related to portfolio performance. Ashraf et al. (2017) and El-Alaoui et al. (2018) found differences in
performance, i.e., Sharia portfolio performance tended to be worse than conventional portfolios only
when the research was conducted during the financial crisis (2007-2008) while during the normal
market conditions, they did not find performance difference.
Comparative Portfolio Volatility
This section explains the process of finding the best time-series model of ARIMA (p, d, q) for Sharia
and conventional portfolios and employs them to measure the volatility of each portfolio, and then
compare the results. Descriptive statistics of monthly return data for Sharia and conventional stock
portfolio, each of which consists of 60 observations during 2013-2017 could be exhibited in Table 7.
52 Arifin & Qizam: Quantitative Sharia-Screening Effect on Portfolio Performance and Volatility: Evidence from Indonesia
Table 7. Descriptive Statistics of Portfolio Return for Sharia and Conventional Stocks
Statistics Sharia Conventional
Mean 0.013336 0.041546
Standard Dev. 0.056853 0.107166
Skewness -0.065571 2.900754
Kurtosis 3.940878 12.79791
Probability 0.323660 0.000000
Observations 60 60
Source: These results were adapted from the data run with Eviews.
Given Table 7, it appears that the Sharia stock portfolios over five years (2013-2017) show quite
good performance (return) since it has a positive average. Likewise, it also equally does for the
returns of conventional stock portfolios. When looking at its standard deviation, the conventional
portfolio has a higher value than the Sharia portfolio. Standard deviation indicates the level of risk or
volatility. Skewness on the Sharia portfolio with a negative value of -0.065571 indicates that more
data are distributed to the left side, while for conventional portfolios, a positive inclination of
2.900754 shows that data are more distributed to the right one. This suggests that the nature of the
data is asymmetrical. Furthermore, the kurtosis value of the Sharia and conventional portfolios are
3.940878 and 12.79791 respectively, indicating that both have quite high volatility.
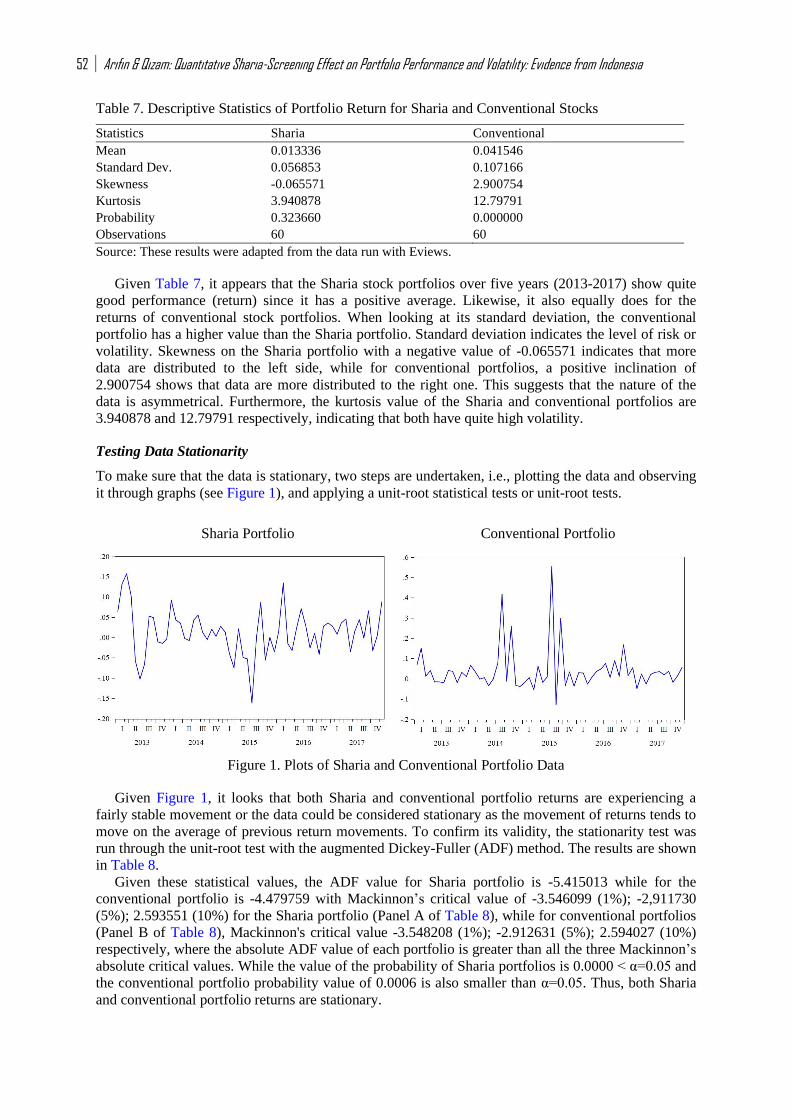
Testing Data Stationarity
To make sure that the data is stationary, two steps are undertaken, i.e., plotting the data and observing
it through graphs (see Figure 1), and applying a unit-root statistical tests or unit-root tests.
Sharia Portfolio Conventional Portfolio
Figure 1. Plots of Sharia and Conventional Portfolio Data
Given Figure 1, it looks that both Sharia and conventional portfolio returns are experiencing a
fairly stable movement or the data could be considered stationary as the movement of returns tends to
move on the average of previous return movements. To confirm its validity, the stationarity test was
run through the unit-root test with the augmented Dickey-Fuller (ADF) method. The results are shown
in Table 8.
Given these statistical values, the ADF value for Sharia portfolio is -5.415013 while for the
conventional portfolio is -4.479759 with Mackinnon’s critical value of -3.546099 (1%); -2,911730
(5%); 2.593551 (10%) for the Sharia portfolio (Panel A of Table 8), while for conventional portfolios
(Panel B of Table 8), Mackinnon's critical value -3.548208 (1%); -2.912631 (5%); 2.594027 (10%)
respectively, where the absolute ADF value of each portfolio is greater than all the three Mackinnon’s
absolute critical values. While the value of the probability of Sharia portfolios is 0.0000 < α=0.05 and
the conventional portfolio probability value of 0.0006 is also smaller than α=0.05. Thus, both Sharia
and conventional portfolio returns are stationary.

Global Review of Islamic Economics and Business, Vol. 9, No. 1 (2021) 043-063 53
Table 8. Results of the Unit Root Tests on Sharia and Conventional Portofolio using Augmented
Dickey-Fuller (ADF) Method
Panel A: Unit-root Test for Sharia Portfolio
Augmented Dickey-Fuller test statistic t-Statistic Prob.*
-5,415013 0,0000
Test critical values : 1% level -3,546099
5% level -2,911730
10% level -2,593551
Panel B: Unit-root Test for Conventional Portfolio
Augmented Dickey-Fuller test statistic t-Statistic Prob.*
-4,479759 0,0006
Test critical values : 1% level -3,548208
5% level -2,912631
10% level -2,594027
Notes: data is considered stationary if the absolute statistical value of the Augmented Dickey-Fuller (ADF) is
greater than the critical value or if the ADF probability value < 0.05.
Identifying ARIMA Models
The initial step to set the ARIMA model (p, d, q) is to identify the model. Identification could be
carried out by observing the ACF and PACF correlograms as presented in Table 9.
Table 9. The ACF dan PACF Correlograms for Sharia Portfolio and Conventional
Sharia Portfolio Conventional Portfolio
As seen in Table 9, it looks that in the Sharia portfolio, the corelogram bars break out the Bartlett
line (dashed line) in the first and fifth lags of both ACF and PACF, while in the conventional
portfolio, the corelogram bars goes out from the Bartlett line at the first, second, and eleventh lags of
ACF and PACF. Thus, there seems to be some differences in identifying the ARIMA model for
Sharia and conventional portfolios. Given the corelogram above, the identified ARIMA models for
Sharia portfolios come under: ARIMA (1, 0, 0), ARIMA (0, 0, 1), ARIMA (1, 0, 1), ARIMA (5, 0, 0),
ARIMA (0, 0, 5), ARIMA (1, 0, 5), ARIMA (5, 0, 1), ARIMA (5, 0, 5), ARIMA ([1, 5], 0, 0) and
ARIMA (0, 0, [1, 5]), while for conventional portfolios, the identified ARIMA models comprise:

54 Arifin & Qizam: Quantitative Sharia-Screening Effect on Portfolio Performance and Volatility: Evidence from Indonesia
ARIMA (1, 0, 0), ARIMA (0, 0, 2), ARIMA (1, 0, 2), ARIMA (0, 0, 11), ARIMA (1, 0, 11), ARIMA
(0, 0, [2, 11]) and ARIMA (1, 0, [2, 11]).
Estimating the Parameters of ARIMA Models
Upon identifying the model, the next is the process of estimating the parameters of the ARIMA model
(p, d, q). In estimating each model, a constant is added to one of the models. The following is the
over-fitting (classifying the data) of the identified ARIMA model for the Sharia portfolio (Table 10).
Table 10. Identifying the ARIMA Models for Sharia Portfolio
Notes: These results were adapted from the data run with Eviews; Coefficients in bold refer to the probability
value less than 0.01 or 0.05 or 0.10 respectively and have the lowest Schwarz info criterion (SIC) value.
ARIMA Model (p, d, q) Estimated coefficients of
parameters
Probability SIC
ARIMA
(1 , 0, 0)
With constants
0.012653 0.2261 -2.873447
0.312367 0.0170
Without constants
0.344358 0.0076 -2.917758
ARIMA
(0, 0, 1)
With constants
0.013857 0.1673 -2.925348
0.446446 0.0004
Without constants
0.470531 0.0001 -2.960951
ARIMA
(1, 0, 1)
With constants
0.012442 0.1602 -2.880987
-0.447148 0.0271
0.835522 0.0000
Without constants
-0.412003 0.0415 -2.915144
0.824384 0.0000
ARIMA
(5, 0, 0)
With constants
0.005380 0.5562 -3.108492
0.275791 0.0192
Without constants
0.289734 0.0117 -3.174952
ARIMA
(0, 0, 5)
With constants
0.14496 0.1612 -2.907530
0.493701 0.0000
Without constants
0.541918 0.0000 -2.943067
ARIMA
(5, 0, 1)
With constants
0.005020 0.6949 -3.103386
0.327482 0.0094
0.340007 0.0124
Without constants
0.336066 0.0065 -3.173323
0.342925 0.0109
ARIMA
(1, 0, 5)
With constants
0.013330 0.3283 -2.983801
0.309574 0.0159
0.448059 0.0002
Without constants
0.329317 0.0094 -3.036240
0.453088 0.0001
ARIMA
(5, 0, 5)
With constants
0.010326 0.2069 -3.224076
-0.414313 0.0008
0.944524 0.0000
Without constants
-0.418010 0.0010 -3.267284
0.934696 0.0000
ARIMA
(0, 0, [1, 5])
With constants
0.015242 0.1814 -2.946947
0.435078 0.0003
0.286117 0.0179
Without constants
0.451938 0.0001 -2.983898
0.291542 0.0132

Global Review of Islamic Economics and Business, Vol. 9, No. 1 (2021) 043-063 55
As exhibited in Table 10, the best ARIMA models (p, d, q) is found, i.e., ARIMA (0, 0, 1),
ARIMA (5, 0, 0), ARIMA (5, 0, 1), ARIMA (1, 0, 5), ARIMA (5, 0, 5), ARIMA (0, 0, [1, 5]), all of
which are without constants. The best model criteria are based on a probability value that is less than
the critical value (0.05) and on the lowest Schwarz info criterion (SIC) value. The next is over-fitting
(classifying the data) of the identified ARIMA model for the conventional portfolio (Table 11).
Table 11. Identifying the ARIMA Models for the Conventional Portfolio
Notes: These results were adapted from the data run with Eviews; Coefficients in bold refer to the probability
value less than 0.01 or 0.05 or 0.10 respectively and have the lowest Schwarz info criterion (SIC) value.
Given Table 11, the best ARIMA models (p, d, q) have been identified, comprising ARIMA (0, 0,
2) with constants and without constants, ARIMA (0, 0, 11) without constants, ARIMA (1, 0, 11) with
constants and without constants, and ARIMA (0, 0, [2, 11]) with and without constants. The best
model criteria are based on a probability value that is less than the alpha value of 0.05 and the
smallest SIC value. The next step is to test the diagnosis of the selected ARIMA model.
ARIMA Model (p, d, q) Estimated coefficients of
parameters
Probability SIC
ARIMA
(1, 0, 0)
With constants
0.041115 0.0004 -1.557895
-0.252775 0.0533
Without constants
-0.091508 0.4864 -1.432145
ARIMA
(0, 0, 2)
With constants
0.041889 0.0330 -1.716764
0.535164 0.0000
Without constants
0.571666 0.0000 -1.707926
ARIMA
(1, 0, 2)
With constants
0.041292 0.0147 -1.659410
-0.168569 0.2132
0.518239 0.0000
Without constants -0.081853 0.5424 -1.632543
0.569334 0.0000
ARIMA
(0, 0, 11)
With constants
0.040434 0.0580 -1.899634
0.865218 0.0000
Without constants
0.869727 0.0000 -1.905363
ARIMA
(1, 0, 11)
With constants
0.041068 0.0034 -2.035343
-0.448795 0.0004
0.883152 0.0000
Without constants
-0.366799 0.0045 -1.957221§
0.887839 0.0000
ARIMA
(0, 0, [2, 11])
With constants
0.049781 0.0217 -1.878715
0.632266 0.0000
0.482373 0.0000
Without constants
0.321561 0.0010 -1.908190
0.649829 0.0000
ARIMA
(1, 0, [2, 11])
With constants
0.040764 0.0049 -1.969150
-0.430933 0.0009
0.027626 0.6215
0.881848 0.0000
Without constants
-0.324783 0.0138 -1.906741
0.084469 0.2249
0.860613 0.0000

56 Arifin & Qizam: Quantitative Sharia-Screening Effect on Portfolio Performance and Volatility: Evidence from Indonesia
Results of Testing the Diagnosis and Selection of the Best ARIMA Models
The diagnostic test of the ARIMA model includes the ARCH (heteroscedasticity) effect test, the
normality test, and the white-noise test (autocorrelation). The following is a summary of the results of
the diagnostic test of the ARIMA model for the Sharia portfolio.
Table 12. Summary of the diagnostic-test results of the ARIMA model for the Sharia portfolio
Model Heteroscedasticity Normality Autocorrelation
ARIMA (0, 0, 1) without constants Yes Yes No
ARIMA (5, 0, 0) without constants No No No
ARIMA (5, 0, 1) without constants No Yes No
ARIMA (1, 0, 5) without constants No Yes No
ARIMA (5, 0, 5) without constants No Yes Yes
ARIMA (0, 0, [1, 5]) without constants No Yes No
As highlighted in Table 12, there seems to be one model that violates the normality assumption
and the other model violates the autocorrelation assumption, i.e., ARIMA (5, 0, 0) and ARIMA (5, 0,
5). As such, both models are eliminated from the model list of the best ARIMA. The next step is to
compare the probability value of the heteroscedasticity test and the normality test of the model and the
Q-stat value at the last lag of the autocorrelation test to get the best ARIMA model.
Table 13. Comparative statistical tests of the ARIMA models for Sharia portfolio
Model Heteroscedastisity
(Probability)
Normality
(Probability)
Autocorrelation
(Q-stat for the last lag)
ARIMA (0, 0, 1) without constants 0.2343 0.404305 38.342 (lag 28)
ARIMA (5, 0, 1) without constants 0.2962 0.068413 24.373 (lag 24)
ARIMA (1, 0, 5) without constants 0.0705 0.601303 29.682 (lag 24)
ARIMA (0, 0, [1, 5]) without constants 0.1388♣ 0.660537* 23.862♠ (lag 28)
Source: These results were adapted from the data run with Eviews; *Refers to the highest probability in the
normality test; ♣ Reflects a quite high heteroscedasticity; ♠ Denotes the lowest Q-stat value among the other
models.
As depicted in Table 13, it looks that the ARIMA model (0, 0, [1, 5]) without constants has the
highest probability in the normality test and is quite high in the heteroscedasticity test, and has the
lowest Q-stat value among the other models. As a result, the model is chosen as the best ARIMA
model for the Sharia portfolios and used as a measure of the volatility level for the Sharia portfolio.
The equation for the ARIMA model (0, 0, [1, 5]) is stated as follows:
(6)
where,
= return of Sharia portfolio in period
= residual return of Sharia portfolio in period
= residual return of Sharia portfolio in period
= residual return of Sharia portfolio in period
The next step is to diagnose the ARIMA models from the conventional portfolio. The summary of
the diagnosis results of the ARIMA-model tests for conventional portfolios is exhibited in Table 14.
Table 14 suggests that all ARIMA models in the conventional portfolios violate the assumption of
residual normality. However, the best ARIMA model could be determined since a model has already
appeared to satisfy the requirements of being free from autocorrelation and heteroscedasticity
problems. Taking notice in Table 14, the only model being free from autocorrelation and
heteroscedasticity is the ARIMA model (0, 0, [2, 11]) with constants. Hence, the model could be
Global Review of Islamic Economics and Business, Vol. 9, No. 1 (2021) 043-063 57
suggested to be the best ARIMA model and be employed to forecast returns for the conventional
portfolios. The equation of the ARIMA model (0,0, [2,11]) with constants is presented by Equation 7.
Table 14. Summary of the diagnostic-test results of the ARIMA models for conventional portfolio
Model Heteroscedastisity Normality Autocorrelation
ARIMA (0, 0, 2) with constants No No Yes
ARIMA (0, 0, 2) without constants No No Yes
ARIMA (0, 0, 11) without constants No No Yes
ARIMA (1, 0, 11) with constants No No Yes
ARIMA (1, 0, 11) without constants No No Yes
ARIMA (0, 0, [2, 11]) with constants No No No
ARIMA (0, 0, [2, 11]) without constants No No Yes
Source: These results were adapted from the data run with Eviews.
(7)
where,
= returns of conventional portfolio in period
= residual returns of conventional portfolio in period
= residual returns of conventional portfolio in period
= residual returns of conventional portfolio in period .
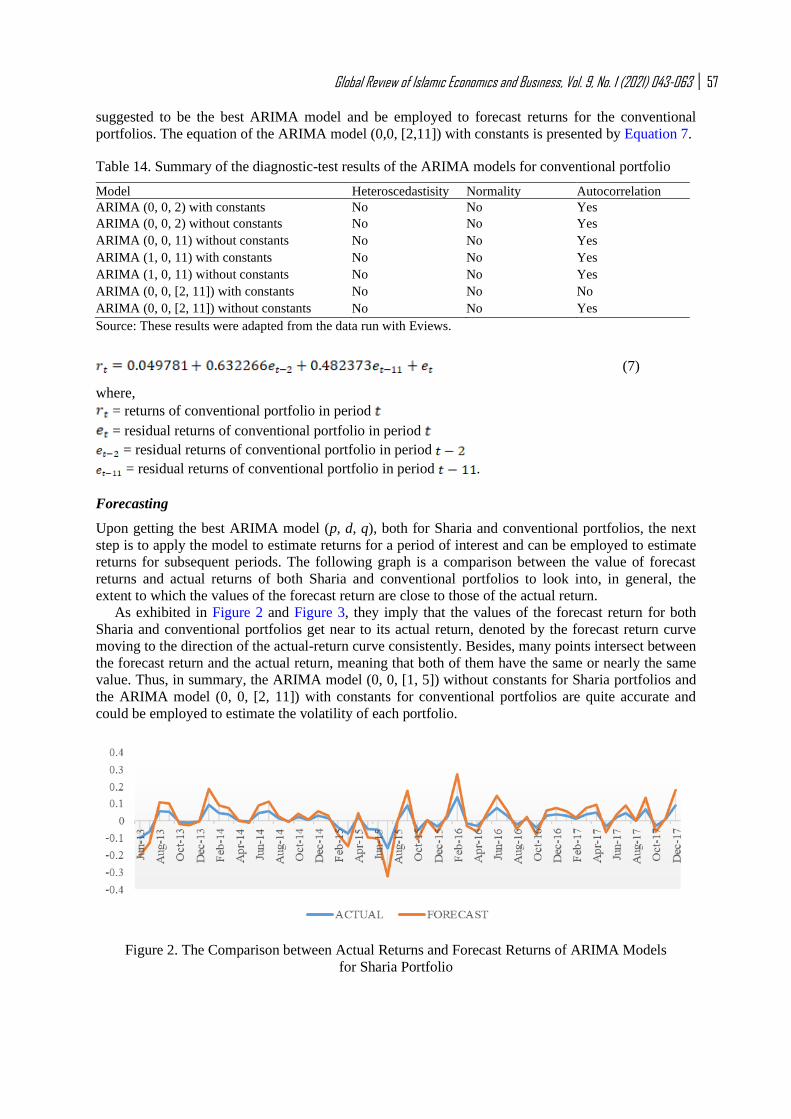
Forecasting
Upon getting the best ARIMA model (p, d, q), both for Sharia and conventional portfolios, the next
step is to apply the model to estimate returns for a period of interest and can be employed to estimate
returns for subsequent periods. The following graph is a comparison between the value of forecast
returns and actual returns of both Sharia and conventional portfolios to look into, in general, the
extent to which the values of the forecast return are close to those of the actual return.
As exhibited in Figure 2 and Figure 3, they imply that the values of the forecast return for both
Sharia and conventional portfolios get near to its actual return, denoted by the forecast return curve
moving to the direction of the actual-return curve consistently. Besides, many points intersect between
the forecast return and the actual return, meaning that both of them have the same or nearly the same
value. Thus, in summary, the ARIMA model (0, 0, [1, 5]) without constants for Sharia portfolios and
the ARIMA model (0, 0, [2, 11]) with constants for conventional portfolios are quite accurate and
could be employed to estimate the volatility of each portfolio.
Figure 2. The Comparison between Actual Returns and Forecast Returns of ARIMA Models
for Sharia Portfolio

58 Arifin & Qizam: Quantitative Sharia-Screening Effect on Portfolio Performance and Volatility: Evidence from Indonesia
Figure 3. The Comparison between Actual Returns and Forecast Returns of ARIMA Models f
or Conventional Portfolio
The Comparative Volatility of Portfolios
The best ARIMA models for Sharia and conventional portfolios have been identified and have also
been applied to forecast the returns and to determine the portfolio volatility. However, we cannot
determine which ARIMA model is the best, whether the ARIMA models originate from Sharia or
conventional portfolios. To answer these questions, the first step is to consider the lags and
differences in the ARIMA model (p, d, q). The greater the lags and the level of differencing for an
ARIMA model are, the higher the volatility will be. Thus, the ability to predict the actual value is
lower.
To make the results of the comparison clearer, a formula is utilized to measure the magnitude of
the forecast error i.e., mean absolute percent error (MAPE). MAPE is calculated using absolute error
in each period divided by the actual observation value during the period. The results of forecast
analysis applying the Eviews program are presented in Figure 4.
Sharia Portfolio Conventional Portfolio
Notes: Forecast of Sharia portfolio includes 12
observations from Month 1 of 2017 to Month 12 of
2017 with root mean squared error = 0.042412, mean
absolute error = 0.033465, mean absolute percent
error = 95.95912, and bias proportion = 0.242604.
Notes: Forecast of conventional portfolio includes 12
observations from Month 1 of 2017 to Month 12 of 2017
with root mean squared error=0.063070, mean absolute
error=0.049755, mean absolute percent error=202.6239,
and bias proportion=0.389270.
Figure 4. The Statistic Results of Forecast Return
The comparative values of mean absolute percent error (MAPE) from Figure 4 suggest that the
value of the Sharia portfolio’s MAPE is 95.96, smaller than the conventional portfolio’s MAPE,
amounting to 202.62. Thus, to sum up, the ARIMA models for the Sharia portfolios have lower

Global Review of Islamic Economics and Business, Vol. 9, No. 1 (2021) 043-063 59
volatility than for conventional portfolios. These results are in line with the findings of Ashraf et al.
(2017) and El-Alaoui (2018), suggesting that Sharia portfolio volatility proves to be lower than
conventional portfolios.
Quantitative Sharia Screening and Its Effect on Portfolio Return
We took the debt screening criteria in the form of a debt-to-equity ratio (DER) as a proxy for testing
its effect on portfolio returns. Descriptive statistics of debt-to-equity-ratio (DER) data for Sharia and
conventional portfolios are presented in Table 15.
Table 15. The Comparative Descriptive Statistics of Debt-to-Equity Ratio (DER) between Sharia and
Conventional Portfolio
Statistics DER for Sharia Portfolio DER for Conventional Portfolio
Mean 0.813040 2.731920
Median 0.710000 1.830000
Maximum 3.620000 22.46000
Minimum 0.010000 0.040000
Std. Dev. 0.650449 3.533982
Skewness 1.471310 3.594083
Kurtosis 5.637095 16.78144
Observations 125 125
Table 15 suggests that the average DER of 81.3% for the Sharia portfolio is still below the
threshold value of 82%, a debt screening set by DSN-MUI and the Financial Services Authority
(OJK). These results suggest that DSN-MUI and OJK have consistently implemented quantitative
Sharia-screening to select firms listed on the Indonesia stock exchange (IDX). Furthermore, it implies
that the maximum value of DER for the Sharia portfolio is 362%. This suggests that even though it
does not pass DER screening at 82%, a firm could still get through the debt-to-asset ratio (DAR)
screening of 45%. As such, to choose between DER and DAR screening is optional; applying both
simultaneously is not obligatory.
This shows that the implementation of Sharia screening set by DSN-MUI and OJK is still very
flexible; thus, this opens up opportunities for wider diversification. Furthermore, we employed panel-
data regression analysis to examine the effect of financial ratios, that was, specifically debt to equity
ratio (DER) as a proxy of quantitative screening, on the returns of both Sharia and conventional
portfolios. Before applying regression, the model approach was first tested, and, then, the classical-
assumption test followed. The summary of the results of the model-approach test and the classical-
assumption test are highlighted as follows.
Table 16. Summary of Comparative Results using a Model Approach and the Classical-Assumption
Tests
Portfolio Model Approach Normality Multicolinearity Heteroscedasticity Autocorrelation
Sharia Fixed Effect Yes No No No
Conventional Random Effect Yes No No No
Given Table 16, it suggests that the regression models for both Sharia and conventional portfolio
have passed the classical assumption test; hence, it is feasible to apply for further analysis. Upon
getting the right model and classical-assumption test, the hypothesis test was then run to measure the
extent to which the impact of the independent variables on the dependent variable. This test consisted
of three steps: a partial test of variables, a simultaneous test, and determination test. The hypothesis
test applied significance levels of 0.01, 0.05, and 0.10.

60 Arifin & Qizam: Quantitative Sharia-Screening Effect on Portfolio Performance and Volatility: Evidence from Indonesia
Partial t-Test (t-Test Statistics)
The statistical t-test aims to see how much influence each of the independent variables
partially (individually) in explaining the dependent variable. One way is to look at the
probability value in the t-test table. If a probability < 0.01, 0.05, or 0.10, partially or
individually the independent variable influences the dependent variable. The results of the t-
statistical test on the Sharia portfolio are presented in Table 17. Given Panel A of Table 17, the statistical t-test results show that, of the five independent variables,
only the debt-to-equity ratio (DER) partially has a significantly positive effect on Sharia portfolio
returns (the t-stat probability value is 0.0087, lower than a significance level of 0.01).
The model chosen for the Sharia portfolio is a fixed effect in which the estimated model, the F-
statistic probability value of 0.074215 is less than 0.10, i.e., being significant at a 10% significance
level. This suggests that the independent variables jointly influence the dependent variable; thus, the
financial ratios altogether affect the returns of the Sharia portfolio. The adjusted-R squared value for
the Sharia portfolio amounts to 0.2277, meaning that this model could explain the dependent variable
by 22.77% while the remaining 77.23% is attributable to the other independent variables outside the
model.
Table 17. t-statistics test for Sharia and Conventional Portfolio
Panel A: t-Statistics Test for Sharia
Variable Coefficients Std. Error t-Statistic Prob.
C -4.104852 0.834496 -4.918958 0.0000
PBV 0.352946 0.215551 1.637414 0.1103
EPS -0.000518 0.001610 -0.321483 0.7497
ROE 0.030840 0.023583 1.307735 0.1993
DER 2.174720*** 0.783775 2.774675 0.0087
CR -2.37E-05 0.000133 -0.178181 0.8596
F-test=0.074215; Adj-R2=0.2277
Panel B: t-Statistics Test for Conventional Portfolio
Variable Coefficient Std. Error t-Statistic Prob.
C -1.037600 0.321536 -3.227012 0.0021
PBV -0.013079 0.010090 -1.296194 0.2001
EPS 0.000150 0.001136 0.131631 0.8957
ROE -0.004791 0.003078 -1.556455 0.1251
DER 0.008991 0.057409 0.156613 0.8761
CR 0.000352 0.000552 0.637778 0.5262
F-test = 0.718966; Adj-R2 = -0.035504
Notes: These results were adapted and run with Eviews; *, **, *** refer to a significant level at 0,10; 0,05; and
0,01 respectively.
Panel B of Table 17 demonstrates that all the independent variables (price-to-book value [PBV],
earning per share [EPS], return on equity [ROE], the debt-to-equity ratio [DER], the current ratio
[CR]) does not have a significant effect on conventional portfolio returns. The t-statistical table shows
that the t-statistical probability value for all the independent variables is more than a critical value of
0,01 or 0,05 or 0.10. Meanwhile, this also implies that the independent variables simultaneously do
not affect the dependent variable (F-statistical probability value is 0.718966, more than 0.10 for the
conventional portfolio with adjusted-R squared value= -0.035504) applying the random effect for the
estimated model.
Several studies related to the effect of financial ratios, especially the effect of debt-to-equity ratio
(DER) on stock returns or stock portfolios have shown inconsistent results. Suharli (2005), inter alia,
examined the effect of DER and stock beta on stock returns. The results have shown that the two

Global Review of Islamic Economics and Business, Vol. 9, No. 1 (2021) 043-063 61
factors do not affect stock returns. Arista and Astohar (2012) and Setiawan and Oktariza (2013) also
found that DER had a significantly positive effect on stock returns. These previous results are in line
with this study, investigating the effect of DER on Sharia portfolio returns. The results of these two
regressions differ only in terms of significance and are reaffirmed by some of the previous studies.
Hence, in conclusion, the debt-to-equity ratio (DER) has a positive impact on the sharia portfolio
returns.
Conclusion and Implications
The study specifically involves the portfolios having inter-industrial low (negative)-correlations,
theoretically leading to lower unsystematic (diversifiable) risk. Taking notice of the results of a
statistical comparison test using the independent t-test and the Mann-Whitney non-parametric test, we
sum up that there is no different performance between Sharia and conventional portfolios when
employing the Sharpe-ratio, Treynor-ratio, and the M2-ratio. It means that all Hypotheses 1 (H1a, H1b,
and H1c) are not supported. Thus, the Sharia portfolio has a comparable performance with
conventional portfolios. This is in contrast to the ever ‘worrying’ results, originating, inter alia, from
Grossman and Sharpe (1986) and Bauer et al. (2006).
Henceforth, given these results of testing ARIMA models, we conclude that the best ARIMA
model to predict Sharia portfolio returns points to ARIMA (0, 0, [1, 5]) without constants, while the
best ARIMA model to predict conventional portfolio returns falls under ARIMA (0, 0, [2, 11]) with
constants. Comparing forecast graphs between Sharia and conventional portfolios, the conventional-
portfolio forecast returns tend to be more volatile attributable to adopting the ARIMA model with
greater lags (2 and 11 moving-averages) than the Sharia-portfolio forecast returns due to the ARIMA
model with smaller lags (1 and 5 moving-averages). Besides, the percentage of absolute error or mean
absolute percent error (MAPE) suggests that the value of MAPE of Sharia portfolios is found to be
smaller than the conventional portfolio MAPE. In summary, the Sharia portfolio has lower volatility
than the conventional portfolios. Thus, it necessarily means that Hypothesis 2 is empirically
supported. Thus, when shocks occur in the stock market, Sharia portfolios prove to be more resilient
than conventional ones.
Concerning the DER effect on portfolio returns, we conclude that when applying the five ratios,
only the debt ratio (DER) has a significantly positive effect on the Sharia-portfolio returns, but not on
the conventional portfolio returns. These results suggest that Hypothesis 3 is partially empirically
supported. This result is in line with one of Durand (1952)’s theories on capital structure, that is, a
traditional approach which states that, to some extent, leverage could increase the value of the firms.
Contrarily, Ashraf et al. (2017) and El-Alaoui et al. (2018) found that leverage tends to worsen
portfolio performance. The findings, however, were found in the period of the financial crisis (2007-
2008), while, in normal market conditions, they found no difference in performance.
Thus, the presence of Sharia screening renders another ‘virtue’ to capital markets. This means that
even though leverage is subject to Sharia-screening, portfolio performance remains positive, even in
turn, leading to the decreased risk. As such, investors and managers do not need to worry about
Sharia-screening. This evidence confirms the reasons why many firms have high-debt profiles in
Indonesia and why DSN-MUI and OJK set a relatively loose threshold of 82% for the debt-to-equity
ratio (DER) or 45% for the debt-to-asset ratio (DAR).
References
Albaity, M., & Ahmad, R. (2008). Performance of syariah and composite indices: Evidence from
Bursa Malaysia. Asian Academy of Management Journal of Accounting and Finance, 4(1), 23–43.
Arista, D., & Astohar, A. (2012). Analysis of factors affecting stock returns (Analisis faktor–faktor
yang mempengaruhi return saham). Jurnal Ilmu Manajemen Dan Akuntansi Terapan (JIMAT),
3(1), 1-15.
Ashraf, D., Felixson, K., Khawaja, M., & Hussain, S. M. (2017). Do constraints on financial and
operating leverage affect the performance of Islamic equity portfolios? Pacific-Basin Finance
Journal, 42(April), 171–182. https://doi.org/10.1016/j.pacfin.2017.02.009

62 Arifin & Qizam: Quantitative Sharia-Screening Effect on Portfolio Performance and Volatility: Evidence from Indonesia
Bauer, R., Koedijk, K., & Otten, R. (2005). International evidence on ethical mutual fund
performance and investment style. Journal of Banking & Finance, 29(7), 1751–1767.
https://doi.org/10.1016/j.jbankfin.2004.06.035
Bellalah, M., Rehman, A., & Masood, O. (2013). Shariah compliant screening practices, théorie
economique, modélisation et applications (Université de Cergy-Pontoise, Thema Working Paper
No. 2013-16). https://www.semanticscholar.org/paper/SYARIAH-COMPLIANT-SCREENING-
PRACTICES-Bellalah Rehman/571efffaa54ab657ee1590d941d7bb187f13c0d6
Derigs, U., & Marzban, S. (2008). Review and analysis of current shariah-compliant equity screening
practices. International Journal of Islamic and Middle Eastern Finance and Management, 1 (4),
285-303 https://doi.org/10.1108/17538390810919600
Djarwanto (2001). Statistik non-parametrik. BPFE.
Durand, D. (1952). Cost of debt and equity funds for business: Trends and problems of measurement.
In Universities-National Bureau (Ed.), Conference on research in business finance (pp. 215-262).
National Bureau of Economic Research. http://www.nber.org/chapters/c4790.pdf
El-Alaoui, A. O., Bacha, O. I., Masih, M., & Asutay, M. (2018). Does low leverage minimise the
impact of financial shocks? New optimisation strategies using Islamic stock screening for
european portfolios. Journal of International Financial Markets, Institutions and Money,
57(November), 160–184. https://doi.org/10.1016/j.intfin.2018.07.007
Fielnanda, R. (2017). The concept of screening sharia stocks in Indonesia (Konsep screening saham
Syariah di Indonesia). AL-FALAH: Journal of Islamic Economics, 2(2), 103-122.
https://doi.org/10.29240/jie.v2i2.255
Grossman, B. R., & Sharpe, W. F. (1986). Financial implications of South African divestment.
Financial Analysts Journal, 42(4), 15–29. https://www.jstor.org/stable/4478945
Gujarati, D. N. (2009). Basic econometrics. Tata McGraw-Hill Education.
Hartono, J. (2009). Teori portofolio dan analisis investasi. BPFE.
Hassan, M. K., & Girard, E. (2010). Faith-based ethical investing: The case of Dow Jones Islamic
Indices. Islamic Economic Studies, 17(2), 1-31.
Htay, S. N. N., Abedeen, Z., & Salman, S. A. (2013). Towards standardization of Shari’ah screening
norms and practices. International Journal of Humanities and Social Science Invention, 2(11), 23–
30.
Irkhami, N. (2016). Islamic ethical investment: Membincang aspek hukum dan ekonomi syariah.
LP2M-Press.
Kasmir. (2017). Analisis laporan keuangan. Raja Grasindo Persada.
Listyaningsih, E., & Krishnamurti, C. (2015). How performance of Jakarta Islamic Index (JII) stocks
relative to other stocks? Jurnal Dinamika Manajemen, 6(2), 145-164.
Markowitz, H. M. (1991). Foundations of portfolio theory. The Journal of Finance, 46(2), 469–477.
https://doi.org/10.2307/2328831
Pok, W. C. (2012). Analysis of syariah quantitative screening norms among Malaysia Syariah-
compliant stocks, Investment Management and Financial Innovations, 9(2), 69-80.
Rahman, A. A., Yahya, M. A., & Nasir, M. H. M. (2010). Islamic norms for stock screening: A
comparison between the Kuala Lumpur Stock Exchange Islamic Index and the Dow Jones Islamic
Market Index, International Journal of Islamic and Middle Eastern Finance and Management,
3(3), 228-240. https://doi.org/10.1108/17538391011072426
Najmudin (2011). Manajemen keuangan dan aktualisasi syar’iyyah modern. Penerbit Andi.
Sani, N. A., & Othman, R. (2013). Revision of shariah screening methodology: The status of Shariah-
compliant companies in Malaysia (Proceedings of the 3rd International Conference on Management
(3rd ICM 2013), Malaysia, 51–63).
Setiawan, C., & Oktariza, H. (2013). Syariah and conventional stocks performance of public
companies listed on Indonesia Stock Exchange. Journal of Accounting, Finance and Economics,
3(1), 51–64.
Suharli, M. (2005). Empirical study of two factors affecting stock returns in the food & beverages
industry on the Jakarta Stock Exchange (Studi empiris terhadap dua faktor yang mempengaruhi
return saham pada industri food & beverages di Bursa Efek Jakarta). Jurnal Akuntansi dan
Keuangan, 7(2), 99–116.

Global Review of Islamic Economics and Business, Vol. 9, No. 1 (2021) 043-063 63
Winarno, W. W. (2009). Analisis ekonometrika dan statistika dengan Eviews. UPP STIM YKPN.
Zainudin, N. B., Miskam, S. B., & Sulaiman, M. B. (2014). Revised shariah screening methodology
for Shariah-compliant securities: New standard to meet global expectation (Conference on
Management and Muamalah, International Islamic University College Selangor, Malaysia).