quantitative techniques in management: hypothesis testing
TRANSCRIPT

Quantitative Techniques inManagement
MODULE: HYPOTHESIS
Reference Text Book:1. Statistics for Business & Economics – Jits Chandan2. Business Statistics – Naval Bajpai
NJ Jaissy

Module – 3.0Topics covered: Hypothesis
Objective:Introduction to Hypothesis testing, confidence& significance levels,Learn about types of errors – Type 1 and IIParametric test – tests involving onepopulation means & two population means &proportionsLearn of the z test & the t test
NJ Jaissy

What is Hypothesis testingA hypothesis is a metric or statistic about thepopulation that you want to test or verify with asample. e.g.: The average age of this college is 20could be a hypothesis about Viswajyothi collegestudentsThe assumption being that there is NO differencebetween the sample statistic & population statisticThe hypothesis in this case would be Mean Age = 20yrsThe Hypothesis is designated by Ho and is called the‘Null Hypothesis’We have to verify this from a sample ( of say 30students randomly selected).
NJ Jaissy

Hypothesis Testing Cont..Usually the Null Hypothesis ( Ho) isassumed to be the variable in thepopulation as is given in question eg: Age= 20The alternate Hypothesis is the oppositeof the Null Hypothesis; in this case itwould be: ‘Mean age is NOT’ 20 yrs.Alternate hypothesis is designated by H1Objective is to test to verify whether Hois correct or not
NJ Jaissy

Hypothesis Testing Cont..
Ho = Null Hypothesis: Mean age = 20 yrsH1 = Alternate Hypothesis: Mean age = 20Population: VJ college students = 6000Sample: 30 students,Statistic: Mean ageMean ageof sample
NullHypothesis –Ho
Alternate Hypo-H1
Age is 20 ACCEPT REJECT
Age not 20 REJECT ACCEPT
/
NJ Jaissy

Types of Errors: Type I and Type II
Accept Ho Reject H1
Ho isTrue
Correct Decision Wrong Decision:Type 1 Error(Alpha ‘a’)
Ho isFalse
Wrong Decision:Type II error(Beta ‘b’)
Correct Decision
DECISION
ACTUAL
NJ Jaissy

Significance Level
We accept or reject the null hypothesisbased on some criteria e.g: if we get themean of the sample to be within a certainlevel – we accept, else we rejectThe probability with which we will rejecta null hypothesis when it is true is thelevel of significanceSignificance level is defined by alpha ‘a’1-alpha = 1 – ‘a’ = Confidence interval
NJ Jaissy

Significance level
Area of rejection =
Area whereNullHypothesis isaccepted(1 – a)
Read ‘a’ as ‘alpha’
a/2a/2
NJ Jaissy

Quick questions
If alpha ‘a’ = 5% = 0.05, what is theequivalent value of ‘z’ on the normaldistribution?
If alpha ‘a’ = 1% = 0.01, what is theequivalent value of ‘z’ on the normaldistribution?
Z = +- 1.96
Z = +- 2.575
NJ Jaissy

Significance level = 0.05 (Two tailedtest)
Area of rejection = 0.05 =
Area whereNullHypothesis isaccepted(0.5 - .025 =0.475)
Read ‘a’ as ‘alpha’
0.05/2=.025
0.05/2=.025
Area of acceptance:0.5-.025 = 0.4750
Uo = 20IZ = -1.96 Z = 1.96
Z = is also knownas the ‘critical’value
NJ Jaissy

Significance level = 0.05 ( One tailedtest)
Area of rejection = 0.05 =
Area whereNullHypothesis isaccepted(0.5)
Read ‘a’ as ‘alpha’
0.05
Area of acceptance:0.5-.05 = 0.4500
Uo = 20IAlternateHypo H1 =Mean <20
Z = -1.645
NJ Jaissy

Significance level = 0.05 ( One tailedtest)
Area of rejection = 0.05 =
Area whereNullHypothesis isaccepted(0.5 – 0.05 =0.4500)
Read ‘a’ as ‘alpha’
Area of acceptance:0.5
Uo = 20IAlternateHypo H1 =Mean >20
Z = 1.645
NJ Jaissy

Critical Values of Z for differentsignificance levels
Significance Level 5% ( = 0.05) 1% ( = 0.01)
One Tailed test: Zc + / - 1.645 + / - 2.33
Two Tailed test: Zc + / - 1.96 + / - 2.56
NJ Jaissy

Which test: Two tail or single tail?
The average age of students in a college is said tobe 20 yrs. A sample is taken to verify that this isthe average age. What is Ho & H1? 1 tail / 2 tail?A manufacturer says his batteries have an averagelife of 1000 hours. A claim is rejected only if theaverage life is much lower. A sample is drawn toverify this. What is Ho & HI? 1 tail / 2 tail?Amul claims that the fat content of its low fat icecream is less than 500 mg. The ice cream will berejected if the fat content is higher. A sample istaken to verify this. What is Ho and H1. 1 tail or2 tail?
NJ Jaissy

Steps in Hypothesis Testing1. Determine what is being asked ( Do we have
one sample / 2 samples? Are they testing meanor proportion- %)
2. Determine Null Hypothesis ( Ho) & AlternateHypothesis ( H1)
3. Select a significance level ( 1% , 5% etc): area of‘rejection’ or ‘acceptance’ of Ho & determinecritical values of ‘z’ or ‘t’
4. Determine which test ( z for n > 30 and t for n<30)
5. Compute test statistic ( ‘z’ or ‘t’ test)6. Accept or reject Ho basis whether the test
statistic falls within the ‘rejection’ region or not
NJ Jaissy

Hypothesis Testing: Which test &what hypothesis
Null Hypothesis ( Ho) Alternate Hypo ( H1) Type ofTest
= Equals(e.g. Avg. age = 20)
= Not equal (Avg. age = 20) Two Tail
> = Greater than or equal(e.g Avg. age >= 20)
Less than ( Avg. Age <20) One Tail
<= Less than or equal( e.g. Avg. age <=20)
Greater than ( Avg.Age >20) One tail
NJ Jaissy

Testing of mean or proportion ofone sample from the population
Population Size = NMean = USD = ‘sigma’ - o
Sample Size = nMean = xSD = ‘s’ -
•A sample is taken from the population and tested because it is too expensive /too time consuming to test the full population.
•We assume the sample follows a normal distribution (n >=30) and find ‘z’ elsewe assume the sample follows a ‘T’ distribution (n<30) and find ‘t’
•We assume the sample is representative of population and therefore can usesample test results to accept or reject claims /hypothesis about population
Testing ofclaim /hypothesis
NJ Jaissy

Summary of different type of tests:a) Testing of mean ( one sample)b) Testing of proportions / % ( one sample)c) Comparison of mean ( across 2 samples)d) Comparison of proportion / % ( across 2
samples)
For each of the above, from the various ‘x’values got from the sample, we calculateeither ‘t’ or ‘z’ ( depending on sample size)and compare with Tc or Zc to accept orreject claim / Hypothesis
NJ Jaissy

If the variable in the population follows anormal distribution or if the sample is large (ie >= 30) – we assume a normal distributionfor sample & we find the value of ‘z’. This iscalled the ‘z’ – test. Population Standarddeviation IS knownNote: However, if population follows anormal distribution & if population SD is notknown but if the sample deviation is known,we assume sample follows a normaldistribution & use the ‘z’ test.
‘z’ test : Samples >= 30
NJ Jaissy

Z test - Key formulae – 1 ( Pop. SDknown)
If ‘Mean’ U = population mean ( that isbeing verified)SD of the population = SD =‘n’ = sample size‘x’= sample mean ( that we obtained fromexperiment)SE of sample = (Standard Error)
Then _z = (x – U) = (x – U)
I_
O
+
_O
X
_O
_O x
/
_O
/ n
/ /_
\
/ n
_\_
Once we compute ‘Z’ wecompare with critical value Zcand accept or reject claim NJ Jaissy

Z test - Key formulae – 1 ( Pop. SDNOT known)
If ‘Mean’ U = population mean ( that isbeing verified)Standard Deviation of the sample = s‘n’ = sample size‘x’= sample mean ( that we obtained fromexperiment)SE of sample = (Standard Error)
Then _z = (x – U) = (x – U)
I
+
S
_O x
/
s/ n
/ /
\
/ n_
\_
_
_O
X
Once we compute ‘Z’ wecompare with critical value Zcand accept or reject claim NJ Jaissy

Quick Questions1. Population mean = 1000 and population Standard
deviation = 50. A sample of 49 is drawn and thesample mean is found to be 955. Assuming asignificance level of 5%, - can I accept the samplemean to be an accurate representative of thepopulation?
HINT:a) Define Ho & Define H1b) Choose test statistic ‘z’ or ‘t’ ( Here it is z – why?)c) Determine limits of z at the significance levelsd) Check whether computed z is in ‘acceptable’ rangee) Take decision on whether to accept or reject Ho
NJ Jaissy

Quick Questions1. Population of VJ college has an average age of = 20
yrs and population Standard deviation = 2 yrs. Asample of 30 is drawn and the sample mean is foundto be 21 yrs. Assuming a significance level of 5%, -can you verify this statement about VJ?
HINT:a) Define Ho & Define H1b) Choose test statistic ‘z’ or ‘t’ ( Here it is z – why?)c) Determine limits of z at the significance levelsd) Check whether computed z is in ‘acceptable’ rangee) Take decision on whether to accept or reject Ho
NJ Jaissy

Question Set 1 : Mean1. Average nation income for government
employees is Rs 18, 750. There was some doubtwhether the average national income ofgovernment employees in Trivandrum isrepresentative of the national average. Arandom sample of 100 government employeesin Trivandrum was taken and it was found thattheir average salary was Rs 19,240 with astandard deviation of Rs 2.610. At a significancelevel of alpha ‘a’ = 0.05, ( 95% confidence level)can we conclude that the average salary ofgovernment employees in Trivandrum isrepresentative of the national average?
Ho: avg = 18,750. H1 avg is not18,750. Two tailed test. Z= 1.877 which is < 1.96 so claim is accepted
NJ Jaissy

Question Set 1: Mean2. The manufacturer of light bulbs claims
that a light bulb lasts on an average 1600hours. The bulbs will be rejected if theydon’t last this long.A sample of 100bulbs was taken at random and theaverage bulb life of this sample wascomputed to be 1570 hours withstandard deviation of 120 hours. Atsignificance level, alpha ‘a’ = 0.01, test thevalidity of the manufacturer claim.Ho: avg = 1600. H1: avg <1600. One tailed test. Z = -2.5which is larger than the critical value of Zc = -2.33 so claimis rejected NJ Jaissy

Question Set 1: Mean3. An insurance company claims that it takes 2
weeks ( 14 days) on an average to process anauto accident claim. The standard deviation is 6day. To test the validity of this claim, aninvestigator randomly selected 36 people whorecently filed claims. The sample revealed that ittook the company an average of 16 days toprocess these claims. At 99% level of confidence,check if it take the company more than 14 dayson average to process a claim. ( = checkwhether company’s claim is valid)
H0 = Avg time = 14 days. H1: avg >14 days. This is a onetailed test. Z = 2 which is smaller than the critical value ofZc = 2.33 so claim is accepted NJ Jaissy

Question Set 1: Mean4. A law professor has told his students that
in Mumbai city, criminals spend an averageof 15 months in jail. A student from theclass a a part of his term project, takes arandom sample of 35 such cases from thecourt files. His study showed that theaverage of this sample was 13.8 months injail with a standard deviation of 4.2 months.At alpha ‘a’ = 0.05, should the studentaccept the professors claim that theaverage jail time of convicted criminals isindeed 15 months?
Ho: avg time = 15 mths. H1: avg time not = 15 mths. Two tailed test.Z = -1.69 which is < than Z @ 0.05 significance level = 1.96 so wehave to accept the claim NJ Jaissy

Testing of PROPORTIONSHere instead of mean of the population, we aretesting some proportion or % of the population.Let population proportion of success = pLet sample proportion of success = p^Let sample size = n
Then the Z statistic = p^ - p
Where standard deviation of proportion of success=
p q / n
p q / n
Once we compute ‘Z’we compare withcritical value Zc andaccept or reject claim
NJ Jaissy

Question Set 1: ProportionsThe mayor of a city claims that 60% of thepeople of the city follow him and supporthis policies. We think less people followhim & want to test whether his claim isvalid or not. A random sample of 400persons was taken and it was found that220 of these people supported the mayor.At the level of significance ‘alpha’ = 0.01,what can we conclude about the mayor’sclaim.
One tailed test. Ho: P =0.6 H1: P< 0.6. P^ = 0.55, Z = -2.04 whichis less than Zc = -2.33. So we have to accept the null Hypothesis
NJ Jaissy

Question Set 1: Proportions:5. In a psychology class, a professor read a
report that noted that 30% of all womenare afraid of flying. A student was giventhe project to take a sample and test ifthe report was correct. The studenttook a random sample of 150 womenand found that 50 of these women wereafraid of flying. At alpha ‘a’ = 0.05, test ifthe sample results verify the reportedfigures.
Two tailed test. Ho: P = 0.3, P^ = 0.33. Z = 0.81 which is less than theZc = 1.96 so we accept the claim
NJ Jaissy

Question Set 1:Proportion
2. An airline claims that at most 8% of itslost luggage is never found. A consumeradvocacy agency wants to test this claim.In a study of 200 random cases of lostluggage, it was found that in 22 cases, thelost luggage was never found. At 99%confidence level, test the accuracy of theairline’s claim.
One tailed test. Ho: P<=0.08, H1 P>0.08. P = 0.08, P^ = 0.11. Z = 1.58which is less than the Zc = 2.33 so we accept the claim
NJ Jaissy

Question Set 2
1. An educator claims the average IQ ofCity college students is no more than110. To test this claim, a random sampleof 150 students was taken and givenrelevant tests. Their average IQ scorecame to 111.2 with a standard deviationof 7.2. At level of significance of 0.01, testif the claim of the educator is justified.
Ho: IQ<=110 , H1: IQ>110 One tailed test. Z = 2.03 which is lessthan the Zc = 2.33 so we accept the claim
NJ Jaissy

Test: Equality of two PopulationmeansNull Hypothesis for testing of equality of twopopulation means Ho: U1 = U2 whereU1 = mean of population 1U2 = mean of population 2X1 and O 1 are mean and SD of sample n1 frompopulation 1X2 and O are mean and SD of sample n2 frompopulation 2
Z = X1 – X2
O + On1 n2
/
_
_22
_
_
21
Once we compute ‘Z’ wecompare with critical value Zcand accept or reject claim
NJ Jaissy

Question Set 2: Equality of mean2. A potential buyer of electric bulbs bought 100
bulbs each of two famous brands A and B.Upon testing both these samples, he foundthat brand A had a mean life of 1500 hourswith a standard deviation of 50 hourswhereas brand B had an average life of 1530hours with a standard deviation of 60 hours.Can it be concluded at 5% level of significance( ‘alpha’ a = 0.05) that the two brands differsignificantly?
Ho: U1 = U2, H1: U1 = U2. Z = 7.81 which is more than thecritical value of Zc = 1.96 therefore H0 is rejected; the brandsdiffer significantly.
/
NJ Jaissy

Question Set 23. A researcher claims that American 18 yr old girls are on
average taller than Indian 18 yr old girls. To test thisclaim, a random sample of 50 American and 50 Indiangirls was taken and their measurements are below:
American IndianAvg. height(Inches) 65.2 64.5SD 2.5 2.8Test the hypothesis that American girls are taller than Indiangirls.
One Sided Tail. Ho: U1 >=U2, H1: U1< U2. Z = 1.32 which is lessthan the critical value of Zc = 1.64 therefore we cannot reject the nullhypothesis; we accept it – i.e American girls are taller than IndianGirls.
NJ Jaissy

Question Set 24. The Dean of students wants to find out if there is
any significant difference in the mathematical abilityof male & female students as determined by thescores in a test in mathematics. A random sample of50 female students and 100 male students wasselected from all the students who took the test.Their results are summarized as follows:
Male students Female studentsAvg. score x1 = 75 x2 = 70SD s1 = 10 s2 = 12At 0.01 level of significance, test if there is a significantdifference in the avg. scores of Male & Female students
Ho: U1 = U2, H1: U1 = U2. Z = 2.54 which is less than thecritical value of Zc = 2.58. therefore H0 is accepted; there isno significant difference in scores.
/
NJ Jaissy
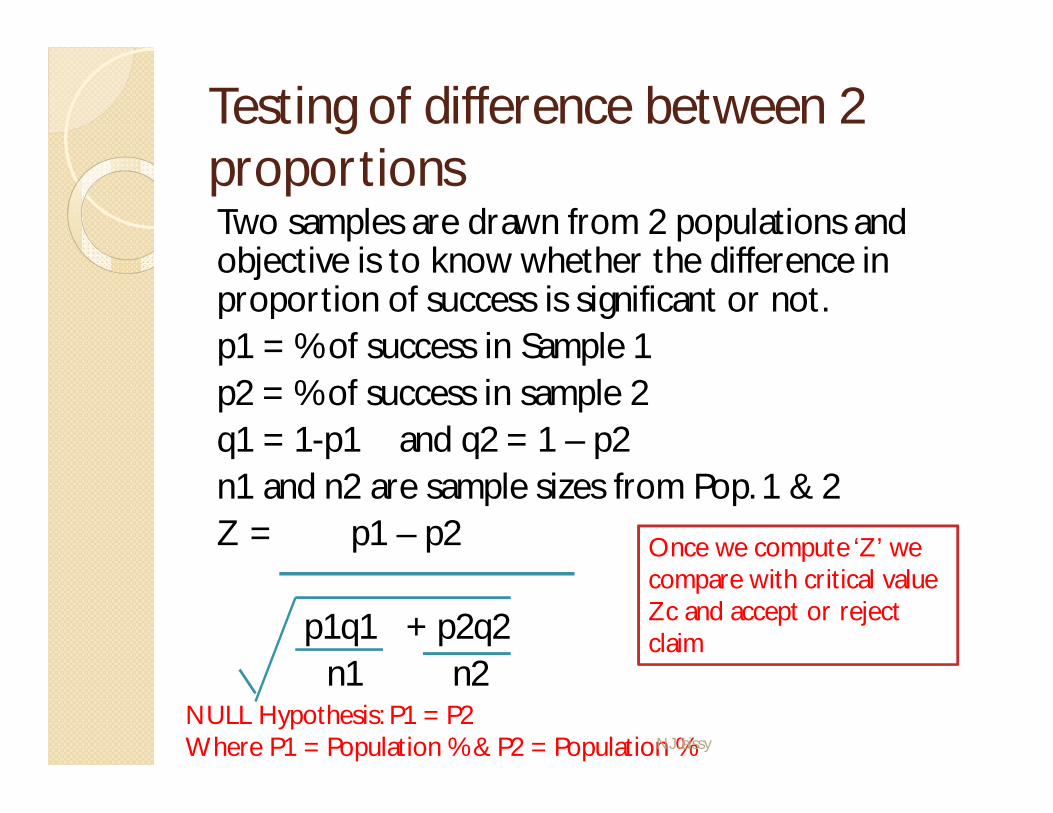
Testing of difference between 2proportionsTwo samples are drawn from 2 populations andobjective is to know whether the difference inproportion of success is significant or not.p1 = % of success in Sample 1p2 = % of success in sample 2q1 = 1-p1 and q2 = 1 – p2n1 and n2 are sample sizes from Pop. 1 & 2Z = p1 – p2
p1q1 + p2q2n1 n2
NULL Hypothesis: P1 = P2Where P1 = Population % & P2 = Population %
Once we compute ‘Z’ wecompare with critical valueZc and accept or rejectclaim
NJ Jaissy

Question Set 25. An advertising agency wants to find out if
there is is any difference in the degree ofloyalty for a given product between men andwomen. A random sample of 200 men and 200women was taken and it was determined that58% of women and 65% of men showed brandloyalty. At ‘alpha’ a = 0.05, test the nullhypothesis that there is no significantdifference between the population % of loyalmen & women
Ho: P1 = P2, H1: P1 = U2. Z = 1.47 which is less than thecritical value of Zc = 1.96 therefore H0 is accepted; there isno significant difference in Population loyalties
/
NJ Jaissy
Confidence interval
Confidence level = 1 – significance level
Ie if Significance level = 5%, thenconfidence level = 1 – 0.05 = 0.95 = 95%
Confidence level = the area where thenull hypothesis will be accepted ie wherewe are confident that the null hypothesisis correct & will be accepted
NJ Jaissy

Finding a confidence interval_ z = X – U where =
If z = Zc and we rewrite this equation tofind the value of X at Zc
As sample represents population we firstassume U (pop mean) = sample mean (x)and are finding the range the sample meancan take.
Xc = U _ Zc will give the confidenceinterval: ie values of X for which Ho=true
O x
/_ O x
_ _
/ n_
\
O+
+ O x
_
NJ Jaissy

Question Set 26. The sponsor of a television program
targeted at the children’s market wants tofind out the average amount of timechildren spend watching TV. A randomsample of 100 children indicated the avgtime spent by these children watching TVper week to be 27.2 hours. From previousexperience, the population SD of theweekly extent of TV watch is known wtobe 8 hours. A confidence interval of 95% isconsidered to be adequate.
X = +/- Zc* Ax. Zc = +/- 1.96. x1 =25.632 x2 = 28.768NJ Jaissy

Question Set 27. We want to estimate the avaerage age of
students who graduate with an MBAdegree. A random sampling of 64graduating students showed that theaverage age was 27 yrs with a standarddeviation of 4 yrs.
a) If we take a 95% confidence interval -what is the estimate of the true avgpopulation of all graduating students?
b) How would the confidence intervalschange if the confidence level is 99%?
X = +/- Zc* Ax. Zc = +/- 1.96. 26.02 >interval >27.98NJ Jaissy

The ‘t’ test: Small samplesThis is used when the sample size is SMALL( i.e. < 30) and the Standard Deviation of thepopulation is NOT known.Higher the sample size, closer ‘t’ scorecomes to ‘z’ scoreDegrees of freedom: = ( n-1)t = x – U
sn
U = population means = sample meanx = sample parameter beingmeasured
Once we compute ‘t’ we compare with critical value Tc andaccept or reject claim
NJ Jaissy

Question Set 28. A gas station repair shop claims that it can do
a lubrication job and oil change in at most 30minutes. The Consumer Protectiondepartment wants to test his claim. A sampleof six cars were sent to the station for oilchange and lubrication. The job took anaverage of 34 minutes with a standarddeviation of 4 minutes. This claim is to betested at ‘alpha’ a = 0.05
Ho:: U< = 30, H1: U>30. One tailed test. Sample smalltherefore use T –test. T = 2.45. Critical value of T for df = 5, a= 0.05 = 2.015. As T is higher than Tc the claim is rejected.
NJ Jaissy

Question Set 29. A claim is made that VJ college students have
an IQ of 120. To test this claim, a randomsample of 10 students was taken and their IQscores are recorded as follows:
105 110 120 125 100 130 120 115 125130
At 0.05 level of significance, test the validity of theclaim.
Ho::IQ= 120, H1: IQ=120. Two tailed test. Sample smalltherefore use T –test. T = -0.612. Critical value of T for df = 5,a = 0.05 = 2.26. As T is less than Tc the claim is accepted
/
NJ Jaissy

Hint for No. 7, Question Set 2
Mean = Sum of X / N
Variance = ( x- Mean)^2 / ( n-1)
SD = square root of variance
NJ Jaissy

Solution to No. &, Question Set 2x x - x* (x-X*)^2
100 -18 324105 -13 169110 -8 64115 -3 9120 2 4120 2 4125 7 49125 7 49130 12 144130 12 144
Total 1180 0 960
n= 10x* (mean) = Sum x / n = 1180/10Here Mean = 118
Var = SD =( x- x*) / ( n-1) =
Here SD = 10.32
T = (x* – U)sn
= (118 – 120)/ 10.3 2 / 10
= -0.61
2
Ho::IQ= 120, H1: IQ=120. Two tailed test. Sample smalltherefore use T –test. T = -0.612. Critical value of T for df = 5,a = 0.05 = 2.26. As T is less than Tc the claim is accepted
NJ Jaissy

Question Set 210. A sample of 8 students majoring in
Economics was taken to determine theirtest scores. Their scores were recordedas follows:120,116,122,125,120,115,110,132
Construct a 95% confidence interval forthe true average scores for all studentsmajoring in Economics. Assume that thesample is from population that is anormal distribution.
X1 = 114.42 x2 = 125.58
NJ Jaissy

T test – for comparing means of 2small samples from 2 populationsAssumptions:
Each population is normally distributedSample size taken from each population issmall ( samples can be of different sizes)The two samples are independentThe population SD are unknownNo. of degrees of freedom = sum ofdegrees of freedom for each sample
NJ Jaissy

If n1 = sample from population 1 and n2= sample from population 2
DF = ( n1 – 1) + (n2 – 1) = n1+n2 – 2The 2 SD (s1 and s2) from the twosamples are pooled together to get asingle estimate sp of the population SD
Sp = (n1-1)s1 + (n2-1)s2( n1+n2 – 2)
T test – for comparing means of 2small samples from 2 populations
2 2
NJ Jaissy

t = x1 – x2
T test – for comparing means of 2small samples from 2 populations
sp 1 + 1n1 n2
2
Where Sp is defined in the previous slide
Once we compute ‘t’ we compare withcritical value Tc and accept or reject claim
NJ Jaissy

Question Set 211. We want to find out if there is any significant
difference in the avg. amount of money carried bymale and female students at VJ college on any givenday. A random sample of 8 male students and 10female students was selected and the amount ofmoney they each had was found. From each sample,the sample mean and sample SD were calculated.We want to test if there is any significant differencein the avg. amount of money carried by male &female students at 5% level of significance. Thesample results are given below:
Male Students Female studentsn1 = 8 n2 = 10x1 = Rs 20.5 x2 = Rs 17.00s1 = Rs 2 s2 = Rs 1.5
Ho: U1 = U2, H1: U1 = U2…Two tailed test t = 4.25 which is > Tc= 2.12 ( at alpha ‘a’ = 0.05 ( two tailed), DF = 16 ( =8+10-2)NJ Jaissy

‘t’ test for comparing the differencebetween 2 samplesThis is similar to finding the difference in meanbetween 2 samples – except that we’re notbothered with the values of x1 and x2 but with justthe ‘difference’ or deltaThis is used when the two samples are dependent (i.e sample 2 depends on sample 1)E.g: if sample 1 is the weight of 10 people before adiet and sample 2 is after the diet – the sampleresults are not independent. If the diet has worked,sample 2 results will be < sample 1 results.Here we are concerned with the differencebetween the 2 samples instead of the value of theobservations
NJ Jaissy

‘t’ test for comparing the differencebetween 2 samplesIf we plot the differences ‘d’ it will form a tdistribution.
Let ‘d’ = avg of the distribution of differences.Sd = SD of the distribution of differences,
Then: t = dSdn
Once we compute ‘t’ we compare with criticalvalue Tc and accept or reject claim
NJ Jaissy

Question Set 2:12. VJ Fitness center claims that completion of their weight loss
program will result in a weight loss. To test this claim, six personswere selected at random and they were put through the weightloss program and their weights before and after the programwere recorded. We want to test the claim of the fitness center at‘alpha’ ‘a’ = 0.05. The weights in pounds of these six personsrecorded before and after the program are as follows:
Person # Weight (before) Weight (after)
1 145 143
2 200 190
3 160 165
4 185 183
5 164 160
6 175 176
Null Hypo: Ho: No weight loss or difference D = 0. H1: D > 0, t = 0.97which is less than Tc=2.015 ( one tail, ‘a’ = 0.05, df = 5). Ho is acceptedNJ Jaissy

Hint for No. 12, Question Set 2
Mean = Sum of X / N
Variance = ( x- Mean)^2 / ( n-1)
SD = square root of variance
NJ Jaissy