quantum%20change%20in%20irish%20drinks%20culture%20rport
DESCRIPTION
http://banda.ie/assets/files/Quantum%20Change%20In%20Irish%20Drinks%20Culture%20Rport.pdfTRANSCRIPT

Quantum Change in Irish Drinks Culture Report September 2010
PREPARED BY;
Behaviour & Attitudes
Milltown House, Mount St Anne’s, Milltown,
Dublin 6.
MAIN CONTACTS:
Luke Reaper Director
T: 01 205 7500 E: [email protected] Des Byrne Chairman
T: 01 205 7500 E: [email protected]

2
Table of Contents
Page No.
1. Introduction ................................................................. 3
2. About Behaviour & Attitudes ............................................. 4
Findings
3. The Demise of the Irish Pub .............................................. 6
4. Pre-Drinking: A New Phenomenon ...................................... 9
5. Prevalence ................................................................. 10
6. Who Are the Pre-Drinkers? ............................................... 12
7. Understanding Pre-Drinking ............................................. 13
8. Care is Needed when Driving to the Pub .............................. 19
9. A Lucrative Market ........................................................ 21
10. Looking to the Future .................................................... 24

3
1. Introduction
The latest Consumer Watch report from Ireland‟s leading independent research company- Behaviour & Attitudes- highlights the quantum change that has occurred in the Irish Drinks Culture in the last decade. It also draws attention to a new phenomenon- Pre-Drinking- the practice of having a few drinks at home before going to the pub.
The survey was carried out using the Behaviour & Attitudes Barometer Survey. This is a syndicated survey allowing client companies cost effective access to a nationally representative sample of 1,000 adults. The survey is conducted fortnightly, using a fresh sample of respondents each time. The sample is quota controlled by all of the normal demographic variables to correctly reflect the known characteristics of the adult population of the Republic of Ireland.
All interviewing was carried out on a face-to-face basis by trained members of the Behaviour & Attitudes field force working under supervision and within the guidelines set by the Marketing Society of Ireland and ESOMAR.
The data for this study derives from a Barometer Phase with fieldwork between 6th – 17th August, 2010.
A copy of the questionnaire used for the survey is included as an appendix to this report.
Additional tabular data is available on request from [email protected]

4
2. About Behaviour & Attitudes
Behaviour and Attitudes is Ireland‟s largest and most experienced independently owned research company. We have 30 permanent staff members including 10 directors, the most experienced team in the Irish market. In addition, we have a team of over 150 experienced, fully trained face-to-face interviewers nationwide. Our Dublin CATI (telephone) Unit is based in our offices in Milltown and has a capacity of over 75 interviewers.
Established 25 years ago, Behaviour and Attitudes provides a full range of market research services, ranging from CAPI (Computer Aided Personal Interviewing), through to standard face-to-face interviewing surveys, CATI (Computer Aided Telephone Interviewing), central location interviewing, as well as an in-house CAWI Unit (Computer Aided Web Interviewing). The company would be well known for having pioneered the development of qualitative research in Ireland.
Despite being the second largest market research company in Ireland, Behaviour & Attitudes has a very well defined and tight company structure which is built around excellent client service delivery principles.
Behaviour & Attitudes is fully owned by its 10 Directors. These Directors are continuously involved in day-to-day research on behalf of their clients. Hence, our clients have access to the most senior team in the Irish marketplace.
For more information please visit our website at: www.banda.ie

5
Findings

6
3. The Demise of the Irish Pub
The archetype of the Irish drinker is of a regular pub goer who loves his (for they are primarily male) pint. Traditionally drinking at home was for weddings, christenings or visits by the local parish priest. How things have changed in the Celtic Tiger years and in the subsequent Crash. Irish people are drinking “on- trade”- in pubs, bars, and hotels much less often now, than they were at the beginning of the decade.
Pub Drinking Frequency
4 2 2 4
4241
3026
1010
87
811
12 16
35 37
48 47
2002 2004
3+ times a week
1 / 2 times a week
Once a fortnight
Once every 3-4 weeks
Less often/never
20102008
% % % %
In 2002 two out of every three Irish adults went to the pub to drink alcohol once a month or more often. Today only half the population do so. The decline has been even more marked if we focus on people who go to the pub once a week or more often.

7
At the same time there has been a rapid rise in home drinking.
Home Drinking Frequency
3 3 6 8
21 2326
25
8 6
7 56 6
7 9
63 6254 53
3+ times a week
1 / 2 times a week
Once a fortnight
Once every 3 - 4 weeks
Less often/never
2002 2004 20102008
% % % %
There are more people drinking at home than in pubs on a weekly basis. (33% at home vs. 30% in pub) The difference is even more acute if we focus on those drinking three or more times a week- 8% at home vs. 4% in pubs.

8
Indeed, if we gross up the relative frequencies reported in these charts we see a dramatic shift in the share of alcohol drinking occasions taking place at home as against licensed premises. The position is as follows.
Share of Drinking OccasionsHome vs Licensed Premises
64 6050
46
36 4050
54
Licensed
premises
Home
2002 2004 20102008
% % % %
The share attributed to licensed premises has fallen from 64% to 46% over an eight year time span.

9
4. Pre-Drinking: A new phenomenon The trend towards home drinking has been underway for some time and has been influenced by many factors- drink driving legislation, relative pricing on vs off trade, and latterly, anti smoking regulations. However it does appear there has been a sharp acceleration in the trend recently. We believe that the major accelerant has been a phenomenon reported with increasing frequency in our focus group work- the habit of having a few drinks at home before going to the pub- which we refer to as Pre -Drinking.
The psychology of this occasion had different motivations to typical „at home‟ consumption – more high energy, sociable, with a sense of togetherness and fun.
This is the first time, to the best of our knowledge, that this phenomenon has been measured in a quantitative manner.

10
5. Prevalence How prevalent is Pre-Drinking? To avoid any confusion, we explained Pre- Drinking to our survey respondents as follows:
“We hear that some people nowadays, when they are going out for a drink, sometimes have a few drinks beforehand at home or in somebody else’s home flat or apartment. This tends to be called Pre-Drinking.”
Q.3 How often, if at all nowadays do you have pre drinks of this kind?
This is what we found-
Frequency of Pre-DrinkingBase: All adults 18+ 974 (Pop = 3,362 million)
716
7 2
9
15
11
4
5
6
8
2
79
63
74
92
All
Adults
Pub-Goers
% % % %
Every time you go out
Occasionally before you go out
Rarely before you go out
Never
Weekly Monthly Less often
In simple terms this suggests that almost a quarter of a million adults pre-drink every time they visit a pub, and almost half a million do so occasionally or rarely.

11
These are very large numbers when we bear in mind that just under a million Irish adults visit a pub weekly or more often nowadays. We can see from the chart earlier that the practice is most pronounced among regular pub goers- those who visit the pub weekly or more often. Pre-drinking is largely a weekend phenomenon as can be seen here:
Pre-Drinking DaysBase: All pre-drinking nowadays 198
Monday
10 37
26
55
5 1
Total
%
Q.5 On what day of the week was that?
TuesdayWednesday
Thursday
Friday
Saturday
Sunday

12
6. Who are the Pre-Drinkers? The survey allows us to draw a pen picture of these Pre-Drinkers.
Profile of Pre-DrinkersBase: All Pre-Drinkers 198
56
44
Male
(49)
Female
(51)
ABC1
(41)
Total Social Class
% % % % %
Region Area
C2DE
(51)
18-24
(13)
Age
25-34
(23)
35-49
(27)
35
40
16
6
2
45
49
6
F
(8)
50-64
(21)
65+
(15)
( ) bracketed figure relate to all adults aged 18+
35
28
28
9
Dublin
(28)
Rof
Leinster
(26)
Munster
(28)
Conn/
Ulster (18)
68
32
Urban
(61)
Rural
(39)
As can be seen from the chart, Pre-Drinkers are likely to be much younger than average, primarily male urbanites and especially Dubliners.

13
7. Understanding Pre-Drinking The location for pre drinks varies depending on the age of the drinker. For older people it tends to be in their own home. For under 25‟s it is more likely to be in someone else‟s home, flat or apartment.
Location of Pre-DrinkingBase: All Pre-Drinkers 198
50
39
56
36
36
36
12
22
72 3 1
All Adults Age
% % %
Own home
Someone else's home
Friend’s Flat/apartment
Elsewhere
18-24 25+

14
The average Pre-Drinking group consists of five or six individuals.
Average Pre-Drinking GroupBase: All pre-drinking nowadays 198
11+
7-10
5-6
3-4
1-2
Don’t know
7 104
14
3 510 6
1518
12
22
1015
20
13
2623
30
34
2418
22
28
33 3135
27
43
26
24 38
18 18 17
3
21
34
2414
0 1 2 1
Total Age Region
Outside
Dublin
Dublin25-34 35+
% % % % % % % %
Male Female 18-24
Gender
AVERAGE 5.76 6.38 4.98 7.86 4.57 4.67 6.7 5.26
Q.7 How many people were in your drinking group, including yourself? WRITE IN

15
Two thirds of Pre-Drinking groups are mixed gender.
Gender balance of last pre-drinking groupBase: All pre-drinking nowadays 198
Q.8 Was the pre drinking group…. READ OUT
1527
0
180
41
6572
56
2 1 3
All Adults Gender
% % %
All male
All female
Mixed
Don’t know
Male Female
There is an apparent anomaly in male and female reports of mixed gender groups. The most likely explanation is that in many mixed gender groups, males outnumber females.

16
Pre-Drinking groups tend to be homogenous in age composition.
Age Balance of Last Pre-Drinking GroupBase: All pre-drinking nowadays 198
Q.9 Was the pre drinking group made up of people..
82
15
3
All roughly the same
age as yourself
Very mixed in terms of
age
Don’t know

17
A wide variety of drinks are consumed on these occasions. Canned/bottled beer/lager is the drink of choice (60%) – driven by males. However wine (26%) and vodka (23%) are also consumed – driven more by females, albeit not exclusively.
Type of Drink ConsumedBase: All pre-drinking nowadays 198
Total
GENDER A G E SOCIAL CLASS
Male Female 18-24 25-34 35+ Abc1 C2DE
Base: 198 108 90 75 78 45 92 93
. % % % % % % % %
Beer/lager 60 77 38 60 68 48 58 61
Any non-beer/lager 53 39 70 58 45 58 57 50
Only beer/lager 46 61 27 41 53 42 42 49
Any spirits 33 27 40 53 22 31 31 35
Only spirits 20 14 28 32 13 14 17 25
Wine 26 17 38 14 27 42 34 18
Vodka 23 18 29 41 16 8 23 23
Whiskey 5 7 4 5 4 9 5 6
Any other spirits 8 6 11 14 5 4 6 11
Don't know 1 - 3 1 2 - 1 2
Q.10 What type of drink or drinks did you have on that occasion?

18
The choice of drink before going to the pub strongly influences choice in pub also.
Pre and Pub Drinking Choices
75
3541
22
69
20
2 4
45
Pre-Drink Choice
% % %
Beer
Spirits
Wine
Beer Spirits Wine
Pub Choice
NB There are some multiple choices here so some columns add to more than 100%
19
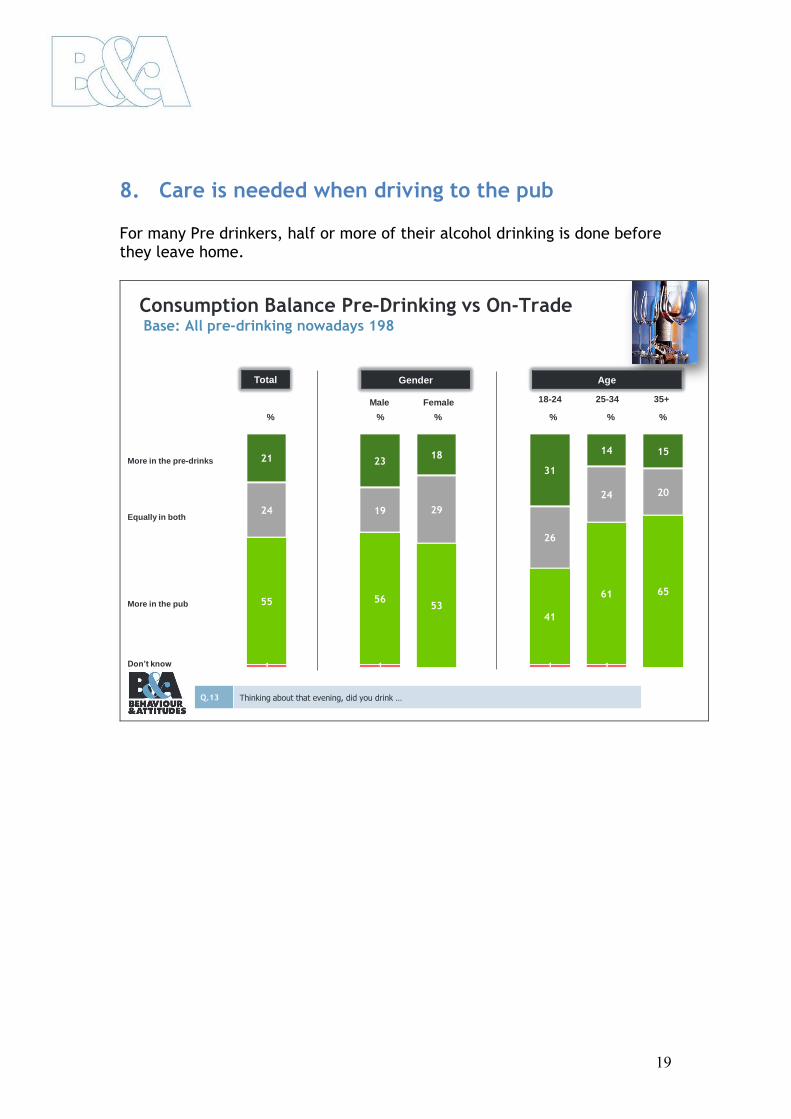
8. Care is needed when driving to the pub For many Pre drinkers, half or more of their alcohol drinking is done before they leave home.
Consumption Balance Pre-Drinking vs On-TradeBase: All pre-drinking nowadays 198
More in the pre-drinks
Equally in both
More in the pub
Don’t know
21 2318
31
14 15
24 19 29
26
24 20
55 5653
41
61 65
1 1 1 1
Total Age
25-34 35+
% % % % % %
Male Female 18-24
Gender
Q.13 Thinking about that evening, did you drink …

20
The amounts of alcohol consumed in Pre-Drinking sessions are quite substantial as can be seen here.
Number of Pre-Drinks Consumed Last OccasionBase: All pre-drinking nowadays 198
11+
7-10
5-6
3-4
1-2
Don’t know
- 1 - 1 -4 62
81 4
1721
11
19
1910
36
38
33
50
31
24
4030
53
22
46
59
2 3 1 1 3 2
Total Age
25-34 35+
% % % % % %Male Female 18-24
Gender
AVERAGE 3.38 3.85 2.79 3.95 3.31 2.64
Q.11 And how many cans/bottles of beer or glasses of wine or spirits did you yourself drink on that occasion?
*
*Less than 0.5%
The point we need to note here is that the majority of Pre-Drinkers are over the legal drinks limit on their way to the pub. They may not of course be driving but it is a point that needs to be noted by the authorities as a potential risk.

21
9. A Lucrative Market From everything that has been said it is clear that Pre-Drinking is a significant niche market. Most buy their own pre-drinks but there is also considerable pooling of funds, especially among younger people.
Degree of Pooling for Pre-Drinking sessionsBase: All pre-drinking nowadays 198
Pay for the drinks myself
Pool funds with your friends
Don’t know
7467 69
92
2431 29
62 1 1 2
J.2183
% % % %
18-24
Total Age
25-34 35+
Q.17 Do you normally pay for the pre-drinks yourself or do you pool funds with your friends?

22
Some of these pools are quite large as is the typical contribution to a pool.
Pooling BehaviourBase: All pooling funds 47
1-2
Q.18 How many friends would you usually pool with?
3-4
5-6
7-10
10+
Average 4.72
13
55
21
6
5
18
47
11
17
3 22
€10
Under €10
Average €14
€11-19
€20
€21-50
Over
€50 Don’t
know
Q.19 And how much would you normally spend/put into the pool on that occasion? WRITE IN
Number of Friends in a pool Amount usually pooled

23
The main beneficiaries of this newly emergent market are specialist off-licenses, but the major Multiples also benefit significantly.
Location of Purchasing Drinks for a
Pre-drinking SessionBase: All pre-drinks nowadays 198
Q.16 When you are buying drinks for a pre drinking session of that kind where do you normally buy them?
49
13
22
1
11
2
5
5
7
1
In an off licence
Dunnes
Tesco
Superquinn
Supervalu
Aldi
Lidl
Specialist off licence
Other
Don't know

24
10. Looking to the Future One question which must be considered is whether Pre-Drinking is a short-term fad or a more fundamental change in our drinks culture. To hazard a guess at this we must look separately at proximate and ultimate causes of change. Price differentials, on and off-trade are, almost certainly the main proximate driver of change. The evidence here is that home drinking wins “hands down” on value for money.
Better Value LocationBase: All pre-drinking nowadays 198
The pre-drink session
Both equally
The session in the pub
Total Age
J.2183
25-34 35+
% % % % % %
Male Female 18-24
Gender
Q.15 Which was the better value in your view..
4 3 4 72 2
9 9 89
812
87 87 87 8490
86
As price differentials and the consumers‟ concern about value for money are unlikely to change for some time to come, it seems likely that the Pre-Drinking phenomenon is likely to be with us for some time to come. Ultimately the consumer verdict will depend on the relative enjoyment people get from the in-home or the in-pub drinking experience.

25
The evidence on this score is not particularly encouraging from the publican‟s perspective.
Session most enjoyedBase: All pre-drinking nowadays 198
The pre-drink session
Equally in both
The session in the pub
16 1319 19 16
10
42
36
4943
3451
4351
3237
50
38
Total Age
25-34 35+
% % % % % %
Male Female 18-24
Gender
Q.14 Which did you enjoy most….
It can be seen that many people claim to get at least as much fun from their Pre-Drinking as from the pub. Inevitably that judgement must be coloured to some degree by price differentials. We can‟t separate influencing factors quite so neatly as that, but the evidence seems to suggest that Pre-Drinking will be with us for quite some time.