quarterly bulletin and publications...2 quarterly bulletin december 2015 price inflation, and...
TRANSCRIPT

Quarterly B
ulletin
So
uth African R
eserve Bank
Quarterly BulletinDecember 2015
Decem
ber 2015
No
. 278
South African Reserve Bank

Quarterly BulletinDecember 2015
No. 278

Quarterly Bulletin December 2015
© South African Reserve Bank
All rights reserved. No part of this publication may be reproduced, stored in a retrieval system, or transmitted in any form or by any means, electronic, mechanical, photocopying, recording or otherwise, without fully acknowledging the Quarterly Bulletin of the South African Reserve Bank as the source. The contents of this publication are intended for general information only and are not intended to serve as financial or other advice. While every precaution is taken to ensure the accuracy of information, the South African Reserve Bank shall not be liable to any person for inaccurate information or opinions contained in this publication.
Enquiries relating to this Bulletin should be addressed to: Head: Economic Research and Statistics Department South African Reserve Bank P O Box 427 Pretoria 0001 Tel. +27 12 313-3668/3676
http://www.reservebank.co.za ISSN 0038-2620

Quarterly Bulletin December 2015
ContentsQuarterly Economic Review
Introduction ............................................................................................................................. 1Domestic economic developments .......................................................................................... 4 Domestic output ................................................................................................................ 4 Real gross domestic expenditure ....................................................................................... 8 Factor income ..................................................................................................................13 Gross saving ....................................................................................................................13 Employment .....................................................................................................................14 Labour cost and productivity ............................................................................................19 Prices .............................................................................................................................. 20Foreign trade and payments .................................................................................................. 27 International economic developments .............................................................................. 27 Current account ............................................................................................................... 30 Financial account ............................................................................................................. 36 Foreign debt .................................................................................................................... 39 International reserves and liquidity ................................................................................... 40 Exchange rates ................................................................................................................ 42 Turnover in the South African foreign-exchange market ................................................... 43Monetary developments, interest rates and financial markets ................................................. 44 Money supply .................................................................................................................. 44 Credit extension ............................................................................................................... 48 Interest rates and yields ....................................................................................................51 Money market .................................................................................................................. 55 Bond market .................................................................................................................... 56 Share market ................................................................................................................... 58 Market for exchange-traded derivatives ........................................................................... 60 Real-estate market........................................................................................................... 61 Non-bank financial intermediaries .................................................................................... 62 Flow of funds ................................................................................................................... 63Public finance ........................................................................................................................ 66 Non-financial public-sector borrowing requirement .......................................................... 66 Budget comparable analysis of national government finance ........................................... 69The 2015 Medium Term Budget Policy Statement ................................................................. 78 Fiscal policy stance .......................................................................................................... 78
Statements issued by Lesetja Kganyago, Governor of the South African Reserve Bank
Statement of the Monetary Policy Committee23 September 2015 ............................................................................................................... 82
Statement of the Monetary Policy Committee19 November 2015 ................................................................................................................ 88
Notes to tables ..................................................................................................................... 96
Statistical tables
Contents ............................................................................................................................. S–0Statistical tables .................................................................................................................. S–2Key information ............................................................................................................... S–146


1Quarterly Bulletin December 2015
Quarterly Economic Review
IntroductionGlobal economic activity recovered further in the third quarter of 2015 against the background of a generally accommodative financial environment. Real global output rose at a rate of 3,5 per cent during the quarter and is projected to expand at a broadly similar pace in 2016. While overall growth picked up steadily in the first three quarters of 2015, the expansion in the third quarter primarily reflected faster growth in several major emerging-market economies, whereas the pace of expansion in the advanced economies moderated somewhat due to slower growth in the United States (US), the United Kingdom (UK) and the euro area.
The moderate recovery in global economic activity did not arrest the almost unabated decline in international commodity prices that commenced in 2011. In fact, commodity prices receded further, adversely affecting prospects for export growth in commodity-exporting countries, including South Africa. However, the downward trend in international commodity prices and, more in particular, international oil prices from the middle of 2014 contributed meaningfully to containing inflation across most countries.
In South Africa, real growth turned positive in the third quarter of 2015, thereby evading a recession following the short-lived contraction in the second quarter. The acceleration in growth to an annualised rate of 0,7 per cent in the third quarter was largely brought about by a turnaround in the real value added by the manufacturing sector. By contrast, the real output of the primary sector shrank further at a somewhat faster pace over the period. The real output of the agricultural sector declined sharply in all three quarters of 2015, suppressed by adverse drought conditions in many parts of the country. In addition, mining production shrank for the second consecutive quarter, affected primarily by lower production of platinum and iron ore in the third quarter. Platinum production declined due to scheduled maintenance work at certain platinum furnaces as well as safety stoppages, while iron ore production was reduced in reaction to a global oversupply. In manufacturing, higher production levels mainly replicated increased domestic demand as export volumes receded over the period. Notwithstanding the pickup in production, the manufacturing sector continued to be characterised by substantial surplus capacity. Activity in the construction sector remained lacklustre, while electricity output contracted during the quarter under review as a moderate winter resulted in lower demand. The tertiary sector continued its perennial solid growth performance in the third quarter.
In the third quarter of 2015, growth in real gross domestic expenditure was broadly in step with that in real gross domestic product (GDP). Growth in household consumption slowed further in the third quarter, influenced by a moderation in real income growth and persistently low consumer confidence levels. Spending on durable and non-durable goods contracted while outlays on services increased at a slower pace. In line with the relatively weak growth prospects for the South African economy and low business confidence, growth in gross fixed capital formation decelerated further in the third quarter of 2015. Real capital spending by private business enterprises, constituting the largest part of total capital formation, contracted slightly, whereas real capital outlays of public corporations increased at a marginally faster pace in the third quarter. Inventory investment decreased further, though at a somewhat slower pace, as companies continued to align their inventory levels with lower expected sales.
Consistent with the lacklustre growth performance of the economy, employment continued to trend sideways in the first half of 2015. Average wage settlements moderated somewhat in the first three quarters of 2015 compared with the corresponding period in 2014.
Domestic inflationary pressures intensified at a more gradual pace than initially anticipated thus far in 2015, bringing headline consumer price inflation to a level only slightly above the midpoint of the inflation target range of 3 to 6 per cent in October 2015. Consumer goods

Quarterly Bulletin December 20152
price inflation, and particularly the behaviour of non-durable goods prices, shaped the recent trajectory of headline consumer price inflation. However, consumer goods price inflation has not yet fully responded to the acceleration in agricultural producer food price inflation following the severe drought conditions in many parts of the country. The further depreciation of the exchange value of the rand since mid-2015, partly induced by weaker export commodity prices, also represents a risk for inflation going forward.
Despite the acceleration in global economic growth, growth in export volumes slowed in the third quarter of 2015, following firm increases in the preceding four quarters. Together with a further decline in international commodity prices, in part offset by the depreciation in the exchange rate of the rand, the nominal value of export proceeds remained essentially unchanged during the period. Conversely, import volumes advanced in the third quarter, in line with the moderate pickup in gross domestic expenditure. Boosted by the domestic price-raising effect of the depreciation of the rand, import values advanced moderately during the period. However, with imports rising more strongly than exports, the trade surplus recorded in the second quarter of 2015 reverted to a deficit in the third quarter. Alongside a further increase in net income payments to the rest of the world, the deficit on the current account of the balance of payments rose from 3,1 per cent of GDP in the second quarter of 2015 to 4,1 per cent in the third quarter.
South Africa continued to attract financial flows on a net basis in the third quarter of 2015 despite investors remaining cautious towards investment in emerging-market assets. The capital inflow in the third quarter consisted mainly of a reduction in the other foreign investment assets of the domestic banking sector, as bank advances and trade finance extended to non-resident parties declined while local banks also withdrew some of their deposits held with foreign banks. Foreign direct investment, widely regarded as essential for the promotion of sustainable growth, recorded a small inflow on a net basis. Non-resident investment in South African equity and debt securities was more than offset by the acquisition of foreign portfolio assets by South African investors over the period.
Overall growth in bank loans and advances to the private sector remained lustreless, registering single-digit rates of increase in the first ten months of 2015. Credit extension to the household sector was particularly subdued, expanding at rates marginally below the concurrent rate of consumer price inflation as consumer confidence remained low and personal income constrained. However, bank advances to the corporate sector maintained double-digit rates of growth throughout the ten months to October 2015, propelled by brisk credit extension to the energy, commercial real-estate and financial services sectors – areas where opportunities continued to beacon.
Having raised the repurchase (repo) rate by 25 basis points to 6,0 per cent in July 2015, the Monetary Policy Committee (MPC) agreed on an unchanged rate in September, but at its meeting in November 2015 decided to raise the repo rate further to 6,25 per cent per annum. This was mainly motivated by a deterioration in the risk of inflation overshooting the trajectory that was adopted by the MPC as its central scenario. The increase in the repurchase rate was mirrored by other money-market interest rates.
In the South African capital market, bond yields steepened from February to September 2015. Several factors contributed to the upward trend, including the deterioration of inflation expectations in the wake of currency depreciation, but the expected resumption of monetary policy normalisation by the US Federal Reserve (Fed) was the most enduring factor. After the Fed refrained from raising its policy rate at the September meeting, bond yields had a short-lived respite but again picked up with the approach of the December policy meeting in the US.

3Quarterly Bulletin December 2015
Inflation in residential house prices continued to broadly match consumer price inflation outcomes in the ten months to October 2015 alongside the weak economy, constrained employment prospects, stagnating household disposable income and gradually rising interest rates. However, commercial property development gained momentum and was accompanied by an acceleration in commercial mortgage credit growth. Share prices fell back notably in the third quarter of 2015 following the significant setbacks in the Chinese equity market, but recovered in the subsequent months.
At end September 2015, the first half of fiscal 2015/16 ended with a slight shortfall of revenue against the budgeted projections, while expenditure progressed in close alignment with expectations so that the resultant cash-book deficit widened slightly. The October 2015 Medium Term Budget Policy Statement (MTBPS) entrenched the expenditure ceiling introduced in the previous fiscal year aimed at stabilising debt levels. Improving the effectiveness of spending was a theme that was emphasised in the policy statement, along with some broad structural reforms to nurture a more competitive economy. For the non-financial public sector as a whole, the borrowing requirement remained around 6 per cent of GDP in both the second and the third quarters of 2015.

Quarterly Bulletin December 20154
Domestic economic developments
Domestic output1
Real economic growth in South Africa turned positive in the third quarter of 2015. Following a contraction of 1,3 per cent in the second quarter of 2015, growth in real gross domestic product accelerated to an annualised rate of 0,7 per cent in the third quarter. This turnaround in growth reflected increases in the real value added by both the secondary and tertiary sectors. By contrast, the real value added by the primary sector declined at a slightly faster pace over the period.
Real gross domestic product
Percentage change
2010 2011 2012 2013 2014 2015-2
-1
0
1
2
3
4
5
6 Quarter to quarter * Year on year
* Seasonally adjusted annualised rates
Despite the contraction in the second quarter of 2015, the level of real gross domestic production in the first three quarters of 2015 was still 1,0 per cent higher than in the corresponding period in 2014. The International Monetary Fund (IMF) in its October 2015 World Economic Outlook (WEO) downgraded the outlook for economic growth in South Africa to 1,4 per cent in 2015, similar to the revised growth projection of 1,5 per cent as announced by the Minister of Finance in the Medium Term Budget Policy Statement (MTBPS) in October 2015.
Real gross domestic product
Percentage change at seasonally adjusted annualised rates
Sector2014 2015
1st qr 2nd qr 3rd qr 4th qr Year 1st qr 2nd qr 3rd qr
Primary sector ..................... -17,2 -1,0 5,2 13,3 0,0 2,9 -9,5 -10,4
Agriculture ....................... 4,8 5,6 9,5 7,5 5,6 -18,0 -19,7 -12,6
Mining.............................. -22,8 -3,0 3,9 15,2 -1,6 10,2 -6,4 -9,8
Secondary sector ................ -3,8 -2,1 -0,2 7,5 0,6 -1,0 -5,1 3,3
Manufacturing .................. -6,4 -4,0 -1,0 9,5 0,0 -2,4 -6,3 6,2
Tertiary sector ...................... 1,7 1,9 2,4 1,8 2,1 1,7 1,0 1,9
Non-primary sector ............. 0,4 1,0 1,8 3,0 1,8 1,1 -0,4 2,2
Total .................................... -1,5 0,5 2,1 4,2 1,5 1,4 -1,3 0,7
Excluding the contribution of the usually more volatile primary sector, growth in GDP would have bounced back from negative growth of 0,4 per cent in the second quarter of 2015 to positive growth of 2,2 per cent in the third quarter.
1 The quarter-to-quarter growth rates referred to in this section are based on seasonally adjusted data.

5Quarterly Bulletin December 2015
The pace of decline in the real value added by the primary sector accelerated from an annualised rate of 9,5 per cent in the second quarter of 2015 to 10,4 per cent in the third quarter. The real output of the agricultural sector declined at a slower pace, whereas the real value added by the mining sector contracted at a somewhat faster pace in the third quarter.
Contribution of the primary sector to growth in aggregate real gross domestic product
Percentage points
Total primarysector
Agriculture
Mining
-1,5 -1,0 -0,5 0,0 0,5 1,0
First quarter 2015 Second quarter 2015 Third quarter 2015
-0,5
-0,8
-0,5
-0,5
-0,3
-1,0
-1,1
0,8
0,3
Growth in the real value added by the agricultural sector remained under pressure throughout the first three quarters of 2015 as dry weather conditions and low moisture levels in arable land adversely affected the maize, sugar cane and sunflower crops in particular. The maize crop for the 2014/15 production season amounted to 9,9 million tons compared to 14,3 million tons in the preceding season. Owing to the current dry weather conditions, producers are expected to plant approximately 2,6 million hectares of maize in the 2015/16 production season, 3,9 per cent less than in the preceding season.
The level of real value added by the agricultural sector in the first three quarters of 2015 was 7,3 per cent less than in the corresponding period of 2014 shaving, on average, 0,4 percentage points from total growth in aggregate GDP over the period.
Disappointingly, total mining production receded further in the third quarter of 2015, subtracting 0,8 percentage points from growth in aggregate GDP. Subsequent to a contraction of 6,4 per cent in the second quarter of 2015, the real value added by the mining sector declined at an annualised rate of 9,8 per cent in the third quarter, largely brought about by decreases in the production of platinum, diamonds, iron ore and manganese ore. Production volumes of coal and gold mines, however, remained broadly unchanged over the period.
Platinum production declined in the third quarter of 2015 affected by, among other factors, scheduled maintenance to platinum furnaces and Section 54 safety stoppages. The decrease in the real output of diamond mining largely reflected reduced throughput as well as the processing of lower grade ore in the current low commodity price environment. A global oversupply of iron ore alongside sluggish demand and attempts to contain operational costs gave rise to lower production levels at certain iron ore mines.

Quarterly Bulletin December 20156
In general, mining production continued to be affected by declining international commodity prices and rising production costs. Furthermore, the mining industry reduced its output levels in response to an oversupply and the simultaneous dwindling demand for some minerals from China.
Owing mainly to the improved performance of the manufacturing sector, growth in the real value added by the secondary sector rebounded from -5,1 per cent in the second quarter of 2015 to positive growth at an annualised rate of 3,3 per cent in the third quarter. Increases in the value added by the manufacturing and construction subsectors were partly offset by a contraction in electricity production.
Subsequent to two successive quarters of negative growth, real output of the manufacturing sector picked up in the third quarter of 2015. Following a quarter-to-quarter annualised decline of 6,3 per cent in the second quarter of 2015, the real value added by the manufacturing sector increased by 6,2 per cent in the third quarter, adding 0,8 percentage points to overall GDP growth in the quarter. Increased production was evident, in particular, in the subsectors supplying food and beverages; textiles and clothing; petroleum and chemical products; and electrical machinery. However, owing in part to dwindling demand from China, production receded somewhat in the subsectors producing glass and non-metallic mineral products; basic iron and steel; and non-ferrous metal products. The demand for durable goods specifically seemed to come under pressure in line with the dwindling consumer spending on these products in recent months. Consistent with the lower production levels in a number of subsectors in August, the utilisation of production capacity in the manufacturing sector slowed further from 80,7 per cent in the second quarter of 2015 to 79,7 per cent in the third quarter. Real manufacturing output in the first three quarters of 2015 was only 0,4 per cent higher than in the corresponding period of 2014.
Percentage change from quarter to quarter
Indices: 2010 = 100
Real value added by the manufacturing sector
2010 2011 2012 2013 2014 201580
90
100
110
120
130
-9
-6
-3
0
3
6
9
12
15
Seasonally adjusted
Seasonally adjusted annualised rates
Total
Volume of manufacturing production: major subsectors
Food and beverages Motor vehicles Petroleum products Basic iron and steel products
7Quarterly Bulletin December 2015
In contrast to the second quarter when load-shedding was widespread, Eskom essentially avoided load-shedding in the third quarter of 2015. The real value added by the sector supplying electricity, gas and water nevertheless continued to trend downwards over the period. Real output declined at annualised rates of 7,5 per cent and 8,0 per cent respectively in the second and third quarters of 2015. The demand for electricity was dampened by moderate winter temperatures, subdued mining production, the increased use of alternative sources of electricity generation, high winter tariffs and the usual annual electricity tariff increases introduced by local authorities in July 2015. This made it possible to deal with scheduled maintenance work commissioned by Eskom and maintenance at the Cahora Bassa hydroelectric scheme in Mozambique without resorting to further load-shedding in the third quarter.
Activity in the construction sector remained lacklustre in the third quarter of 2015. The real output of the construction sector rose at an annualised rate of 0,5 per cent in the third quarter, roughly similar to the pace of increase of 0,8 per cent registered in the second quarter of 2015. Activity in civil construction tapered off, partly due to delays by public corporations and general government in awarding major construction projects, while activity in the non-residential building subsector remained sluggish. Encouragingly, activity in the residential building segment continued to gather momentum in the third quarter.
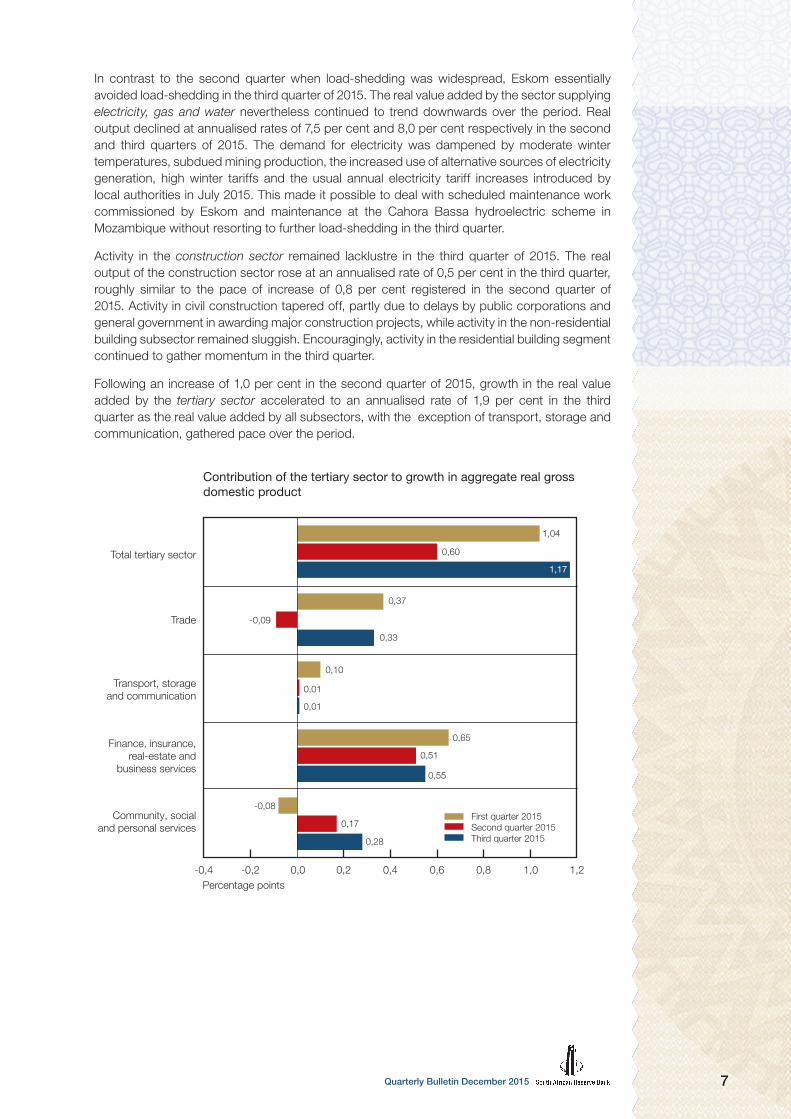
Following an increase of 1,0 per cent in the second quarter of 2015, growth in the real value added by the tertiary sector accelerated to an annualised rate of 1,9 per cent in the third quarter as the real value added by all subsectors, with the exception of transport, storage and communication, gathered pace over the period.
Contribution of the tertiary sector to growth in aggregate real grossdomestic product
Percentage points
Community, socialand personal services
Finance, insurance,real-estate and
business services
Transport, storageand communication
Trade
Total tertiary sector
-0,4 -0,2 0,0 0,2 0,4 0,6 0,8 1,0 1,2
First quarter 2015 Second quarter 2015 Third quarter 2015
-0,08
-0,09
0,17
0,28
0,65
0,51
0,55
0,37
0,33
1,04
0,60
1,17
0,10
0,01
0,01

Quarterly Bulletin December 20158
Growth in the real value added by the commerce sector accelerated firmly in the third quarter of 2015. Following a contraction at an annualised rate of 0,6 per cent in the second quarter of 2015, activity in the trade sector advanced by 2,5 per cent as the real value added by both the wholesale and retail trade subsectors increased. Subsequent to its dismal performance in the second quarter of 2015, growth in the real value added by the wholesale trade subsector rebounded in the third quarter. Owing to increased demand for especially commercial vehicles, activity in the motor-trade subsector picked up marginally in the third quarter. The motor-trade subsector probably also benefited from pre-emptive buying by businesses, rental companies and, to a lesser extent, households in an attempt to avoid anticipated price increases following the sharp depreciation of the rand against the currencies of South Africa’s most important trading-partner countries. However, activity in the accommodation sector remained broadly the same over the period, probably inhibited by the more restrictive visa regulations introduced earlier; some of the visa regulations were subsequently amended to facilitate tourism and avoid unintended consequences.
Growth in the real output of the transport, storage and communication sector decelerated from 0,2 per cent in the second quarter of 2015 to 0,1 per cent in the third quarter. This slightly weaker performance followed reduced activity in the transport subsector alongside sustained growth in the communication subsector.
The real value added by the finance, insurance, real-estate and business services sector inched higher from an annualised rate of 2,6 per cent in the second quarter of 2015 to 2,8 per cent in the third quarter, reflecting continued growth in the output of the banking sector. Activity in the equity and derivatives markets remained firm over the period.
Growth in the real value added by general government expanded at an annualised rate of 1,2 per cent in the third quarter of 2015, slightly faster than the rate of 0,6 per cent recorded in the preceding quarter.
Real gross domestic expenditureConsistent with the increase in domestic production in the third quarter of 2015, real gross domestic expenditure advanced at an annualised rate of 0,8 per cent in the third quarter. A slower pace of de-accumulation in real inventory holdings alongside an acceleration in real final consumption expenditure by general government fully outpaced the slower growth in expenditure by households and real gross fixed capital formation over the period.
Real gross domestic expenditure
Percentage change at seasonally adjusted annualised rates
Component2014 2015
1st qr 2nd qr 3rd qr 4th qr Year 1st qr 2nd qr 3rd qr
Final consumption expenditure
Households ..................................... 1,0 1,0 1,1 1,6 1,4 2,4 1,2 0,9
General government ........................ 1,7 2,4 1,4 1,0 1,9 -1,9 0,4 1,0
Gross fixed capital formation .............. -9,2 -5,4 2,4 2,6 -0,4 1,8 1,0 0,6
Domestic final demand ..................... -1,0 0,0 1,5 1,7 1,1 1,4 1,0 0,8
Change in inventories (R billions)* ....... -4,1 -1,0 2,9 3,8 0,4 8,8 -38,9 -31,6
Gross domestic expenditure ............. 3,8 0,9 3,2 0,3 0,6 2,8 -7,3 0,8
* At constant 2010 prices
The largest contribution to growth in real GDP in the third quarter of 2015 emanated from the change in real inventories which added 1,0 percentage point after having subtracted 6,2 percentage points from total GDP growth in the second quarter of 2015. Disappointingly, the contribution of net exports turned negative over the period.

9Quarterly Bulletin December 2015
Contribution of expenditure components to growth in real gross domestic product
Percentage points
Component2014 2015
1st qr 2nd qr 3rd qr 4th qr Year 1st qr 2nd qr 3rd qr
Final consumption expenditure
Households ..................................... 0,6 0,6 0,7 1,0 0,8 1,5 0,7 0,5
General government ........................ 0,3 0,5 0,3 0,2 0,4 -0,4 0,1 0,2
Gross fixed capital formation .............. -2,0 -1,1 0,5 0,5 -0,1 0,4 0,2 0,1
Change in inventories ......................... 4,1 0,4 0,5 0,1 -0,1 0,7 -6,2 1,0
Net exports ........................................ -5,2 -0,4 -1,1 3,9 0,9 -1,4 6,1 -0,1
Residual ............................................. 0,6 0,5 1,2 -1,6 -0,4 0,7 -2,2 -1,0
Gross domestic product ................... -1,5 0,5 2,1 4,2 1,5 1,4 -1,3 0,7
Final consumption expenditure by households
Affected by a moderation in real income growth and persistently low consumer confidence levels, real consumption expenditure by households rose at a slower pace in the third quarter of 2015. Following an increase of 1,2 per cent in the second quarter of 2015, growth in real spending by households moderated to an annualised rate of 0,9 per cent in the third quarter. Spending on durable and non-durable goods contracted while real outlays on services increased at a slower pace. However, spending on semi-durable goods remained firm over the period.
Real final consumption expenditure by households
Percentage change at seasonally adjusted annualised rates
Category2014 2015
1st qr 2nd qr 3rd qr 4th qr Year 1st qr 2nd qr 3rd qr
Durable goods ...................... 4,8 3,4 4,0 5,3 5,3 1,3 0,2 -4,9
Semi-durable goods ............. 1,9 1,8 2,8 3,3 3,2 3,5 3,1 4,3
Non-durable goods .............. 0,8 0,9 -0,1 1,5 0,8 3,2 -0,7 -0,2
Services ............................... 0,1 0,4 1,2 0,4 0,5 1,8 2,9 2,6
Total ..................................... 1,0 1,0 1,1 1,6 1,4 2,4 1,2 0,9
Having moderated considerably in the first half of 2015, real spending on durable goods contracted in the third quarter of 2015 – the first decline to be recorded since the second quarter of 2009. Mainly due to a decline in sales of passenger vehicles, real outlays on durable goods contracted by 4,9 per cent in the third quarter of 2015 following an increase at an annualised rate of 0,2 per cent in the second quarter. Spending on furniture and household appliances moderated in the third quarter of 2015, while growth in spending on computers, recreational and entertainment goods and on other durable goods accelerated.
Sales of passenger vehicles continued to be affected by relatively low consumer confidence levels, relatively high levels of household debt and slower growth in household income alongside sluggish employment gains. As a result, consumers had less appetite for acquiring new motor vehicles and other durable goods despite attractive packages being offered on these items.
Mainly underpinned by increased spending on clothing, footwear and textiles, real outlays on semi-durable goods rose at an annualised rate of 4,3 per cent in the third quarter of 2015. Stronger growth was recorded in all semi-durable categories, with the exception of motorcar tyres, parts and accessories.
Quarterly Bulletin December 201510
Real final consumption expenditure by households
Percentage change from quarter to quarter
Seasonally adjusted annualised rates
2010 2011 2012 2013 2014 2015-10
0
10
20
30
40 Durable goods Semi-durable goods Non-durable goods Services
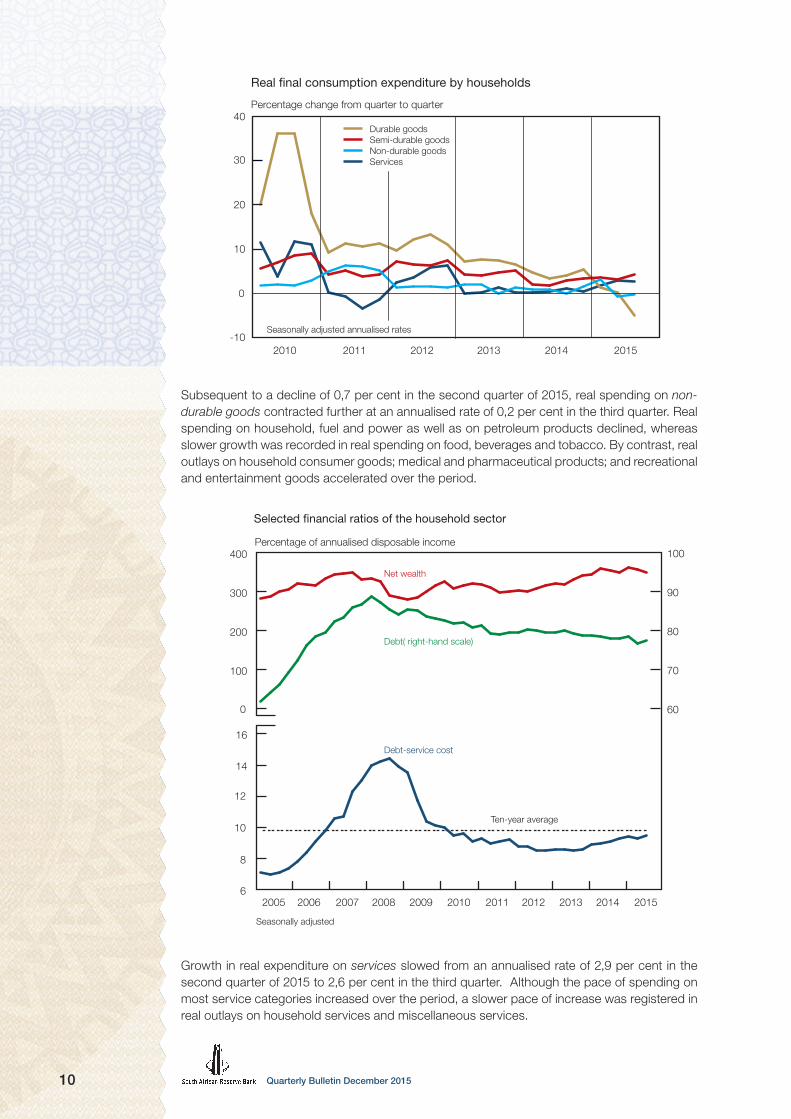
Subsequent to a decline of 0,7 per cent in the second quarter of 2015, real spending on non-durable goods contracted further at an annualised rate of 0,2 per cent in the third quarter. Real spending on household, fuel and power as well as on petroleum products declined, whereas slower growth was recorded in real spending on food, beverages and tobacco. By contrast, real outlays on household consumer goods; medical and pharmaceutical products; and recreational and entertainment goods accelerated over the period.
Percentage of annualised disposable income
Selected financial ratios of the household sector
0
100
200
300
400
60
70
80
90
100
6
8
10
12
14
16
Net wealth
Debt( right-hand scale)
Debt-service cost
Seasonally adjusted
2010 2011 2012 201320062005 2007 2008 2009 2014 2015
Ten-year average
Growth in real expenditure on services slowed from an annualised rate of 2,9 per cent in the second quarter of 2015 to 2,6 per cent in the third quarter. Although the pace of spending on most service categories increased over the period, a slower pace of increase was registered in real outlays on household services and miscellaneous services.

11Quarterly Bulletin December 2015
Households continued to incur debt at a slightly faster pace in the third quarter of 2015. Owing to quarter-to-quarter growth in household debt exceeding concomitant growth in nominal disposable income, the ratio of debt to disposable income edged higher from 77,7 per cent in the second quarter of 2015 to 78,3 per cent in the third quarter. Consistent with the increase in the prime lending rate in July 2015, the cost of servicing household debt as a ratio of disposable income rose from 9,4 per cent in the second quarter of 2015 to 9,6 per cent in the third quarter – the highest debt-servicing ratio since the third quarter of 2010.
A further increase in the financial liabilities of the household sector in combination with a slower pace of increase in the value of housing stock and equity holdings of the sector contributed to a moderation in growth in household net wealth in the third quarter of 2015.
Final consumption expenditure by government
Real final consumption expenditure by general government increased at an annualised rate of 1,0 per cent in the third quarter of 2015, slightly faster than the rate of 0,4 per cent in the second quarter. The faster pace of spending reflected the net effect of a decline in real outlays on non-wage goods and services in the third quarter, which was more than fully offset by an increase in compensation of employees. Real spending on compensation of employees edged slightly higher as employment levels in the general government services sector increased marginally over the period. Relative to the country’s nominal GDP, final consumption expenditure by general government inched higher from 20,1 per cent in the second quarter of 2015 to 20,7 per cent in the third quarter.
Fixed capital formation
Following an increase of 1,0 per cent in the second quarter of 2015, growth in real gross fixed capital formation decelerated to an annualised rate of 0,6 per cent in the third quarter. Capital investment by private business enterprises, constituting the largest part of total capital formation, contracted slightly over the period while capital outlays by general government increased at a slower pace. By contrast, real fixed capital spending by public corporations increased at a marginally faster pace over the period.
Real gross fixed capital formation
Percentage change from quarter to quarter
2010 2011 2012 2013 2014 2015-20
-15
-10
-5
0
5
10
15
20 Total Private business enterprises
Seasonally adjusted annualised rates
Quarterly Bulletin December 201512
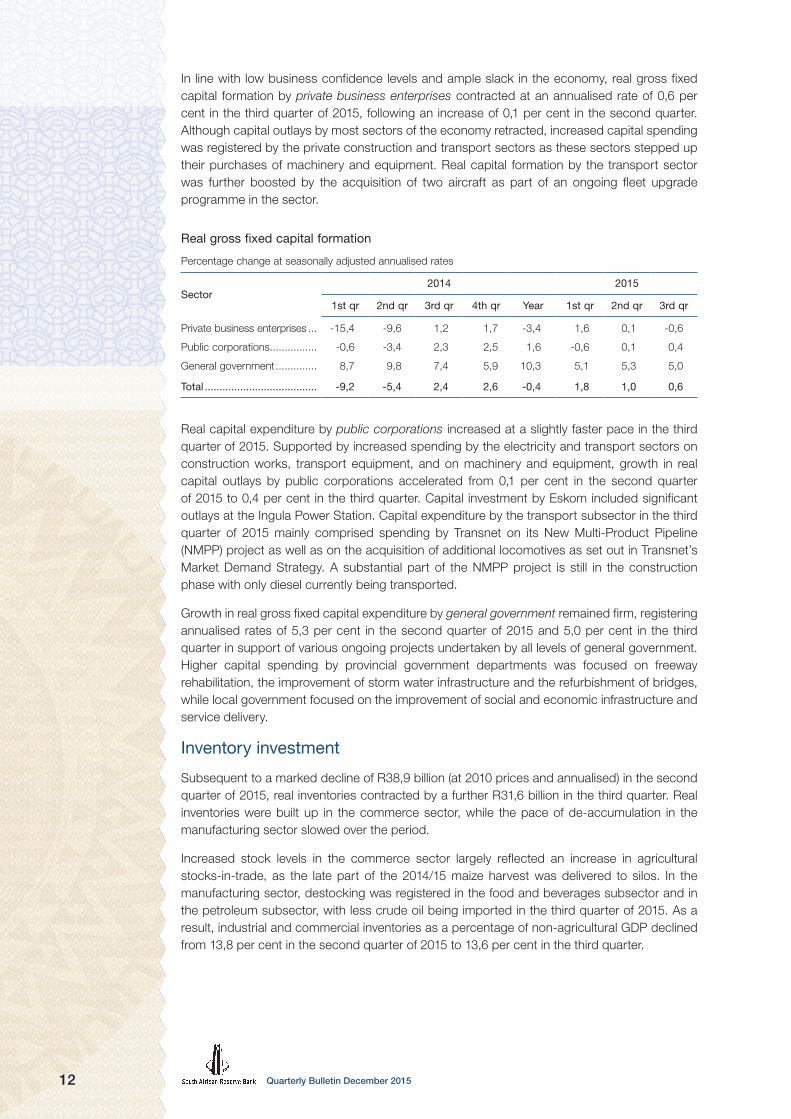
In line with low business confidence levels and ample slack in the economy, real gross fixed capital formation by private business enterprises contracted at an annualised rate of 0,6 per cent in the third quarter of 2015, following an increase of 0,1 per cent in the second quarter. Although capital outlays by most sectors of the economy retracted, increased capital spending was registered by the private construction and transport sectors as these sectors stepped up their purchases of machinery and equipment. Real capital formation by the transport sector was further boosted by the acquisition of two aircraft as part of an ongoing fleet upgrade programme in the sector.
Real gross fixed capital formation
Percentage change at seasonally adjusted annualised rates
Sector2014 2015
1st qr 2nd qr 3rd qr 4th qr Year 1st qr 2nd qr 3rd qr
Private business enterprises ... -15,4 -9,6 1,2 1,7 -3,4 1,6 0,1 -0,6
Public corporations................ -0,6 -3,4 2,3 2,5 1,6 -0,6 0,1 0,4
General government .............. 8,7 9,8 7,4 5,9 10,3 5,1 5,3 5,0
Total ...................................... -9,2 -5,4 2,4 2,6 -0,4 1,8 1,0 0,6
Real capital expenditure by public corporations increased at a slightly faster pace in the third quarter of 2015. Supported by increased spending by the electricity and transport sectors on construction works, transport equipment, and on machinery and equipment, growth in real capital outlays by public corporations accelerated from 0,1 per cent in the second quarter of 2015 to 0,4 per cent in the third quarter. Capital investment by Eskom included significant outlays at the Ingula Power Station. Capital expenditure by the transport subsector in the third quarter of 2015 mainly comprised spending by Transnet on its New Multi-Product Pipeline (NMPP) project as well as on the acquisition of additional locomotives as set out in Transnet’s Market Demand Strategy. A substantial part of the NMPP project is still in the construction phase with only diesel currently being transported.
Growth in real gross fixed capital expenditure by general government remained firm, registering annualised rates of 5,3 per cent in the second quarter of 2015 and 5,0 per cent in the third quarter in support of various ongoing projects undertaken by all levels of general government. Higher capital spending by provincial government departments was focused on freeway rehabilitation, the improvement of storm water infrastructure and the refurbishment of bridges, while local government focused on the improvement of social and economic infrastructure and service delivery.
Inventory investment
Subsequent to a marked decline of R38,9 billion (at 2010 prices and annualised) in the second quarter of 2015, real inventories contracted by a further R31,6 billion in the third quarter. Real inventories were built up in the commerce sector, while the pace of de-accumulation in the manufacturing sector slowed over the period.
Increased stock levels in the commerce sector largely reflected an increase in agricultural stocks-in-trade, as the late part of the 2014/15 maize harvest was delivered to silos. In the manufacturing sector, destocking was registered in the food and beverages subsector and in the petroleum subsector, with less crude oil being imported in the third quarter of 2015. As a result, industrial and commercial inventories as a percentage of non-agricultural GDP declined from 13,8 per cent in the second quarter of 2015 to 13,6 per cent in the third quarter.

13Quarterly Bulletin December 2015
Factor incomeGrowth in total nominal factor income, measured over four quarters, moderated from 4,9 per cent in the second quarter of 2015 to 4,1 per cent in the third quarter as the gross operating surpluses of business enterprises increased at a slower pace while the compensation of employees edged slightly higher over the period.
Measured over a year, growth in total compensation of employees inched higher from 7,8 per cent in the second quarter of 2015 to 7,9 per cent in the third quarter, mainly reflecting an increase in remuneration of employees in the general government sector. The average wage settlement rate for the first three quarters of 2015 as compiled by Andrew Levy Employment Publications amounted to 7,7 per cent compared with an average rate of 8,0 per cent in the corresponding period in 2014. Accordingly, the share of total compensation of employees in total factor income inched higher from 53,0 per cent in the second quarter of 2015 to 53,8 per cent in the third quarter.
Overall profitability in the economy remained under downward pressure. The year-on-year change in total gross operating surplus decelerated from 2,1 per cent in the second quarter of 2015 to 0,1 per cent in the third quarter as the agricultural, mining and manufacturing sectors performed weaker over the period. Economic conditions in the mining industry deteriorated further with the contraction in production volumes being reinforced by declining commodity prices. In addition, the gross operating surpluses of the manufacturing sector remained weak as profit margins remained under pressure due to escalating production costs. Consequently, the share of gross operating surplus in total factor income inched lower from 47,0 per cent in the second quarter of 2015 to 46,2 per cent in the third quarter.
Gross saving South Africa’s national saving ratio decreased for the second consecutive quarter in the third quarter of 2015. Aggregate gross saving as a ratio of GDP slowed from 16,0 per cent in the second quarter of 2015 to 15,2 per cent in the third quarter. The lower saving ratio stemmed largely from lower gross saving by general government, which outweighed a somewhat higher saving ratio by the corporate sector. The saving ratio of the household sector has remained broadly unchanged since the middle of 2014. As a result of the deterioration in the national saving ratio, the portion of total gross capital formation to be financed through a net inflow of foreign capital increased from 16,4 per cent in the second quarter of 2015 to 21,4 per cent in the third quarter.
Gross saving by the corporate sector advanced from 14,3 per cent of GDP in the second quarter of 2015 to 14,7 per cent in the third quarter. The higher saving ratio mainly reflected lower dividend and tax payments over the period which neutralised sluggish operating surplus growth.
Gross saving by general government as a ratio of GDP deteriorated from 1,5 per cent in the second quarter of 2015 to 0,3 per cent in the third quarter. Final consumption expenditure by general government increased somewhat and was amplified by a notable decline in income tax collections over the period.
The household saving ratio remained unchanged at 0,2 per cent in the second and third quarter of 2015, as consumption expenditure by households remained closely aligned with household income.

Quarterly Bulletin December 201514
EmploymentThe extended period of subdued growth in the South African economy was reflected in a decline in the level of total formal non-agricultural employment in the first half of 2015. According to Statistics South Africa’s (Stats SA’s) Quarterly Employment Statistics (QES) survey, employment decreased by 0,4 per cent on a seasonally adjusted and annualised basis in the second quarter of 2015, with the total level of formal non-agricultural employment receding by 9 300 job opportunities to an estimated 8,95 million.
2
Following a moderate pickup in the first quarter of 2015, labour paring in the private sector occurred once more in the second quarter, as roughly 15 800 private job opportunities were lost during the quarter. Employment losses were fairly pervasive among a number of subsectors, with only the trade, catering and accommodation services sector recording marginal job growth in the second quarter of 2015. Employment losses were recorded in the private community, social and personal services sector; the manufacturing sector; the construction sector; the private transport and communication sector; the finance, insurance, real-estate and business services sector; and the mining sector.
2010 2011 2012 2013 2014 20156,5
6,6
6,7
6,8
6,9
* Election-related outlier
Private sector
Public sector (right-hand scale)
Formal non-agricultural employment
Number (millions)
1,9
2,0
2,1
2,2
2,3
2,4
*
By contrast, public-sector employment levels increased somewhat in the second quarter of 2015, as national departments and, to a lesser extent, other public-sector enterprises expanded their staff complement. The notable increase in employment at national departments occurred largely due to the transfer of employees of technical vocational education and training colleges (former further education and training colleges) and community and education training colleges (CETCs) from provincial governments to the National Department of Higher Education and Training from 1 April 2015. This resulted in a concomitant decrease in employment levels at provincial level in the second quarter of 2015. Although public-sector employment decreased by 138 000 employment opportunities in the year to the second quarter of 2015, this was largely due to the high base created in the second quarter of 2014 when the Independent Electoral Commission (IEC) temporarily employed 130 000 people to assist with the general elections.
2 The QES data reported in this section are seasonally adjusted, unless stated to the contrary.

15Quarterly Bulletin December 2015
Change in enterprise-surveyed formal non-agricultural employment by sector*
Sector
Change over one quarter at annualised rate
2nd qr 2015
Change over four quarters to
2nd qr 2015Cumulative job
losses (-) gains (+)
NumberPer cent Number
Per cent
4th qr 2008 to
1st qr 2010
2nd qr 2010 to
2nd qr 2015
Total mining ............................................ -300 -0,2 -1 200 -0,2 -40 700 -1 300
Gold mining ........................................ -100 -0,3 -3 700 -3,1 -9 600 -44 700
Other mining ....................................... -200 -0,2 2 500 0,7 -31 100 43 400
Manufacturing ........................................ -6 300 -2,2 -7 400 -0,6 -113 800 -66 400
Construction ........................................... -2 300 -1,9 -23 800 -4,7 -54 500 -16 100
Trade, catering and accommodation services ........................ 500 0,1 6 100 0,3 -77 500 78 700
Private transport, storage andcommunication services ......................... -600 -0,8 -6 700 -2,1 400 -6 900
Finance, insurance, real-estateand business services ............................ -3 000 -0,6 13 700 0,7 -190 900 109 300
Community, social andpersonal services .................................... -3 900 -3,1 - 700 -0,1 16 400 24 400
Private sector ........................................ -15 800 -0,9 -20 000 -0,3 -460 700 121 600
National departments ............................. 25 000 24,2 17 600 3,9 -2 500 63 100
Provinces ............................................... -18 200 -6,4 -32 900 -2,9 51 600 79 100
Local governments ................................. -800 -1,1 2 500 0,8 15 200 72 400
Public transport, storage andcommunication services ......................... -2 500 -7,4 1 000 0,8 -4 900 26 200
Other public-sector enterprises, including electricity and IEC ................................... 3 100 5,9 -125 600 -37,0 -5 000 21 100
Total public sector ................................. 6 500 1,2 -137 400 -5,8 54 400 261 900
Grand total ............................................ -9 300 -0,4 -157 400 -1,7 -406 400 383 500
* Seasonally adjusted. Components may not add up to totals due to rounding** IEC: Independent Electoral CommissionSource: Statistics South Africa, Quarterly Employment Statistics (QES) survey
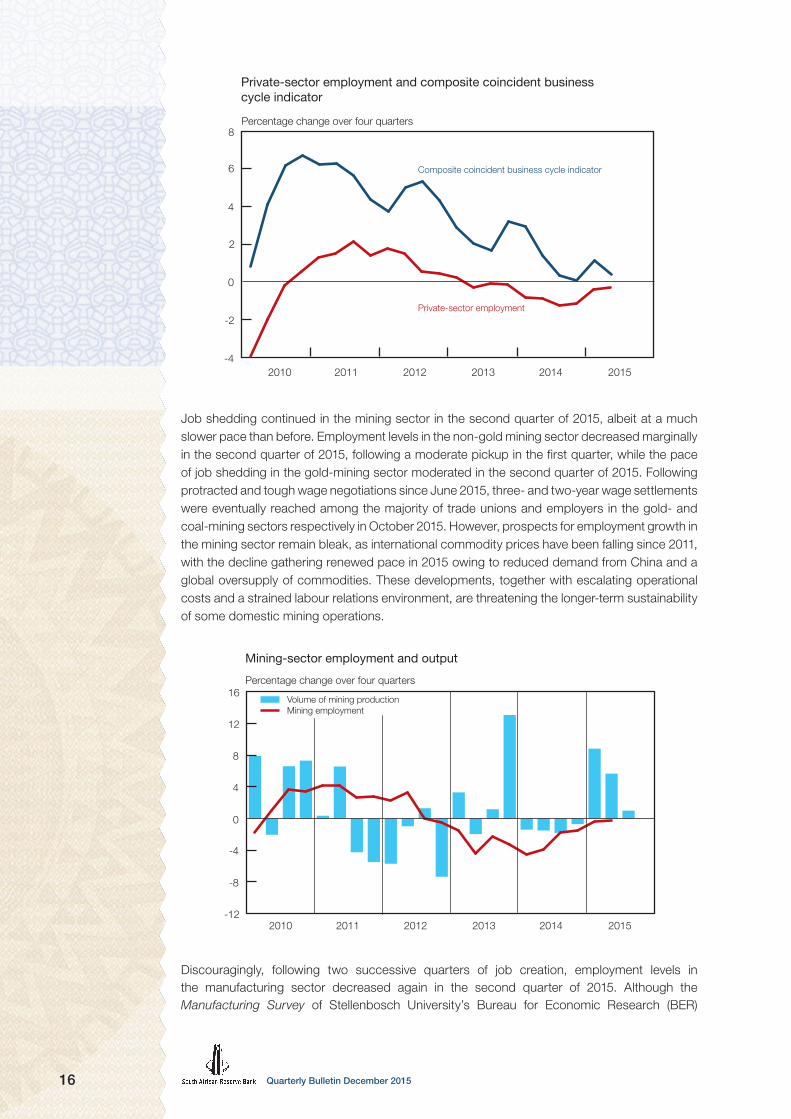
A gradual slowdown in output growth, exacerbated by, among other things, persistently low business confidence, electricity-supply constraints, disruptive industrial action and a fragile global economic environment, has suppressed meaningful employment gains and facilitated a loss of momentum in formal private-sector employment growth over the past four years. The graph on the next page illustrates the gradual moderation in the year-on-year rates of change in private-sector employment and the composite coincident business cycle indicator in recent years. In addition, the accompanying table shows that following the 2008–09 recession, a mere 121 600 employment opportunities were, on balance, created in the private sector up to the second quarter of 2015. However, since the most recent peak in formal non-agricultural private-sector employment in the first quarter of 2013, the private sector has shed a cumulative 101 000 job opportunities up to the second quarter of 2015.
Quarterly Bulletin December 201516
2010 2011 2012 2013 2014 2015-4
-2
0
2
4
6
8
Composite coincident business cycle indicator
Private-sector employment
Private-sector employment and composite coincident businesscycle indicator
Percentage change over four quarters
Job shedding continued in the mining sector in the second quarter of 2015, albeit at a much slower pace than before. Employment levels in the non-gold mining sector decreased marginally in the second quarter of 2015, following a moderate pickup in the first quarter, while the pace of job shedding in the gold-mining sector moderated in the second quarter of 2015. Following protracted and tough wage negotiations since June 2015, three- and two-year wage settlements were eventually reached among the majority of trade unions and employers in the gold- and coal-mining sectors respectively in October 2015. However, prospects for employment growth in the mining sector remain bleak, as international commodity prices have been falling since 2011, with the decline gathering renewed pace in 2015 owing to reduced demand from China and a global oversupply of commodities. These developments, together with escalating operational costs and a strained labour relations environment, are threatening the longer-term sustainability of some domestic mining operations.
Mining-sector employment and output
Percentage change over four quarters
2010 2011 2012 2013 2014 2015-12
-8
-4
0
4
8
12
16 Volume of mining production Mining employment
Discouragingly, following two successive quarters of job creation, employment levels in the manufacturing sector decreased again in the second quarter of 2015. Although the Manufacturing Survey of Stellenbosch University’s Bureau for Economic Research (BER)

17Quarterly Bulletin December 2015
reported that business confidence among manufacturers ticked up from 29 index points in the second quarter of 2015 to 34 in the third quarter, both values represented a sombre state of affairs. In fact, the BER noted that manufacturing business confidence has averaged just 35 index points over the past four years, well below the neutral level of 50 and the long-term average of 45 index points. Despite the marginal improvement in confidence, respondents indicated that domestic demand and production volume growth remained under pressure in the third quarter of 2015. Encouragingly, export sales and order volumes improved notably. Insufficient demand remained a serious constraint on business activity and long-term investment decisions, with manufacturers postponing investment in additional capacity or even the replacement of machinery and equipment. Moreover, the political climate was rated as the most constraining factor to general business conditions – rising to a record-high 84 per cent in the third quarter of 2015, eclipsing the previous record level of 77 per cent recorded in the third quarter of 1993 during South Africa’s democratic transition.
The accompanying graph shows the inverse correlation between real remuneration per employee and employment in the manufacturing sector; while there are many more factors that influence manufacturing employment, real labour costs and real production volumes certainly count among them.
Employment, output and real wages in manufacturing
Indices: 2010 = 100
90
95
100
105
110
115
120
2010 2011 2012 2013 2014 2015
Real salaries and wagesper worker
Employment
Output
Employment in the construction sector continued on its downward path, although the pace of job shedding moderated notably in the second quarter of 2015. Job losses in the construction sector are consistent with weak capital expenditure in the manufacturing and mining sectors in particular. As such, both building and civil construction confidence levels receded further; the First National Bank (FNB)/BER Building Confidence Index decreased for a third successive quarter from 53 index points in the second quarter of 2015 to 44 in the third quarter, while the FNB/BER Civil Confidence Index declined from 44 index points to a low 39 index points over the same period. The BER noted that the outlook for the building sector remains dimmed by a lack of demand for new buildings and slowing activity at the start of the building pipeline. Weak demand also remained a major constraint for civil contractors, as 83 per cent of respondents rated insufficient demand for new construction work as a constraint to business operations in the third quarter of 2015, compared to 71 per cent in the second quarter.

Quarterly Bulletin December 201518
Employment in the finance, insurance, real-estate and business services sector decreased marginally in the second quarter of 2015, following two consecutive quarters of employment gains. Conversely, following moderate job losses in the second half of 2014, the trade, catering and accommodation services sector created 16 700 employment opportunities in the first half of 2015, with the majority of those being created in the first quarter of the year. However, results from the BER’s Retail Survey for the third quarter of 2015 showed that conditions in the trade sectors deteriorated further during the quarter, suggesting that underlying consumer demand remains fairly weak. Business confidence among retailers and wholesalers deteriorated considerably during the quarter, while the confidence levels of new vehicle dealers remained depressed. Although the FNB/BER Consumer Confidence Index recovered to -5 index points in the third quarter of 2015 from a 14-year low of -15 in the second quarter, it remains roughly on par with the levels recorded during the 2008–09 recession. Encouragingly, the recent announcement by government related to the easing of some of the onerous aspects of the new visa application regulations should support the tourism industry in the medium term.
According to the Quarterly Labour Force Survey (QLFS) conducted by Stats SA, the number of persons employed in South Africa increased by 171 000 from the second quarter of 2015 to the third quarter, raising the total level of employment to roughly 15,83 million.
3 Bearing in mind
that QLFS outcomes for 2015 are not strictly comparable to those of 2014, total employment – mechanistically calculated – increased by 712 000 in the year to the third quarter of 2015. However, the bulk of these employment opportunities were created in the informal sector and in the agricultural sector, where employment rose by 314 000 and 211 000 respectively. Somewhat disappointingly, only 87 000 employment opportunities were created in the formal sector of the economy in the year to the third quarter of 2015.
The number of unemployed persons increased by 188 000 from the second to the third quarter of 2015 and by a notable 267 000 in the year to the third quarter of 2015, bringing the total number of unemployed South Africans to around 5,42 million. Conversely, the number of discouraged job seekers decreased notably by 287 000 in the year to the third quarter of 2015. As such, the seasonally adjusted unemployment rate increased from 24,7 per cent in the second quarter of 2015 to 25,3 per cent in the third quarter.
4 The youth unemployment rate remained unchanged
at a high 49,9 per cent in the third quarter of 2015, down from 51,3 per cent a year earlier.
Unemployment rate
Per cent
Official unemployment rate
Seasonally adjustedunemployment rate
2010 2011 2012 2013 2014 201523
24
25
26
27
3 The QLFS outcome for the first quarter of 2015 represents the first results of a master sample redesigned by Stats SA. The new master sample was designed in 2013 using the 2011 population census data, replacing the original master sample that was designed in 2007. The effect of this redesign is that the results for the first three quarters of 2015 are not directly comparable to historical QLFS data.
4 The official unemployment rate, which is not seasonally adjusted, increased from 25,0 per cent in the second quarter of 2015 to 25,5 per cent in the third quarter, marginally up from 25,4 per cent recorded a year earlier.
19Quarterly Bulletin December 2015
Labour cost and productivityThe pace of increase in total nominal remuneration per worker in the formal non-agricultural sector of the economy quickened from 6,9 per cent in the first quarter of 2015 to 8,7 per cent in the second quarter, due to a marked acceleration in public-sector remuneration growth in particular as well as a quickening in private-sector remuneration growth. Similarly, growth in the average real take-home pay of those gainfully employed in the formal non-agricultural sector accelerated to 5,2 per cent in the second quarter of 2015.
The pace of increase in public-sector salaries and wages per worker accelerated markedly from a year-on-year rate of 7,8 per cent in the first quarter of 2015 to 12,5 per cent in the second quarter. However, the acceleration resulted largely from the low base created in the second quarter of 2014, when a large number of low-earning temporary employees were appointed by the IEC to assist with the general elections; without that effect, the year-on-year increase in the second quarter would have been 6,8 per cent. In fact, remuneration growth slowed at national department and provincial levels, while quickening marginally at local government level in the second quarter of 2015.
Year-on-year growth in nominal remuneration per worker in the private sector also accelerated, from 6,5 per cent in the first quarter of 2015 to 7,6 per cent in the second quarter. The quickening in private-sector remuneration growth was most pronounced in the non-gold mining sector (26,7 per cent) on account of the low base which resulted from the platinum-mining strike in the first half of 2014; striking workers are counted as employed, while not receiving wages. In addition, remuneration growth per worker accelerated to 7,4 per cent in the trade, catering and accommodation services sector; to 7,3 per cent in the construction sector; to 6,5 per cent in the gold-mining sector; and to 6,2 per cent in the finance, insurance, real-estate and business services sector. Conversely, remuneration growth slowed in the private community, social and personal services sector (to 7,4 per cent); the private transport, storage and communication services sector (to 5,2 per cent); and the manufacturing sector (to 5,0 per cent) in the second quarter of 2015.
According to Andrew Levy Employment Publications, the average wage settlement rate in collective bargaining agreements moderated to 7,7 per cent in the first three quarters of 2015, marginally below the average settlement rate of 8,1 per cent for 2014 as a whole. Encouragingly, the number of working days lost due to strike action fell notably from 11,6 million in the first three quarters of 2014 (exacerbated by the prolonged platinum-mining strike in the first half of that year) to 270 000 in the first three quarters of 2015 – the lowest comparable number since the data became available in 1995. Furthermore, the Department of Labour noted in its Annual Industrial Action Report for 2014 that incidents of prolonged strikes are likely to be reduced in future following the implementation of labour law amendments that came into effect from 1 April 2015, which allow the Commission for Conciliation, Mediation and Arbitration (CCMA) to intervene in strikes without the consent of the affected parties.

Quarterly Bulletin December 201520
0
2
4
6
8
10
12
14
Number of workdays lost due to industrial action
Millions
2010 2011 2012 2013 2014 2015
Year-on-year growth in labour productivity accelerated from 2,5 per cent in the first quarter of 2015 to 3,4 per cent in the second quarter as output growth moderated at a slower pace than employment growth, exacerbated by the election-related high employment base in the second quarter of 2014. With year-on-year remuneration growth accelerating somewhat and year-on-year output growth moderating marginally, nominal unit labour cost inflation in the formal non-agricultural sector of the economy accelerated from 4,3 per cent in the first quarter of 2015 to 5,1 per cent in the second quarter, still remaining comfortably within the inflation-target range.
Percentage change over four quarters
Formal non-agricultural labour productivity and nominal unit labour cost
2010 2011 2012 2013 2014 2015
Unit labour costProductivityUnadjusted for election-related outlier
-2
0
2
4
6
8
10
12
14
PricesAs 2015 progressed, domestic inflationary pressures intensified at a more gradual pace than initially anticipated, consistent with weaker-than-expected outcomes in output growth over the period. Following a recent trough of 3,9 per cent in February 2015, headline consumer price inflation accelerated steadily to 5,0 per cent in July 2015, before moderating to 4,7 per cent in October.
5 The lower-than-anticipated inflation outcomes resulted largely from persistently low
5 All rates mentioned reflect year-on-year changes, unless stated to the contrary.

21Quarterly Bulletin December 2015
petrol price inflation coupled with a delay in the onset of the expected acceleration in consumer food price inflation. Nevertheless, underlying inflationary pressures also subsided somewhat in the first ten months of 2015.
Falling international commodity prices and weak pricing power in the domestic economy was reflected in the continued benign outcome in most measures of producer price inflation in recent months. Producer price inflation for final manufactured goods remained fairly subdued throughout 2015, reaching a low of 3,3 per cent in July, largely due to a slackening in price inflation for food products, beverages, tobacco products, metals and machinery, as well as transport products. Final manufactured producer price inflation subsequently accelerated marginally to 4,2 per cent in October 2015 as price inflation for food products, textiles, clothing and footwear products, wood and paper products and transport products quickened somewhat. Similarly, producer price inflation for intermediate manufactured goods moderated to -0,4 per cent in August 2015, reflecting a slowdown across a broad range of product categories. However, intermediate manufactured goods price inflation quickened to 0,9 per cent in October 2015 as price inflation accelerated somewhat for basic and fabricated metals, saw-milling and wood products, and textiles and leather goods. Suppressed by the continued fall in international mining commodity prices, producer price inflation for mining products remained in negative territory throughout the first ten months of 2015, registering a low of -10,8 per cent in August 2015, before accelerating somewhat to -0,8 per cent in October.
Producer price inflation for agriculture, forestry and fishing products accelerated from 3,1 per cent in May 2015 to 6,8 per cent in October, driven largely by movements in agricultural food prices. Producer price inflation for electricity and water – both administered prices – remained elevated in recent months, amounting to 13,5 per cent in October 2015.
Consumer price inflation
Percentage change over twelve months
Services prices Total prices Goods prices
2010 2011 2012 2013 2014 20151
2
3
4
5
6
7
8
Considerable movements in consumer goods price inflation, particularly that of non-durable goods, shaped the recent trajectory of headline consumer price inflation. Consumer goods price inflation accelerated from a recent low of 1,9 per cent in February 2015 to 4,1 per cent in July, before moderating to 3,7 per cent in October, driven by non-durable goods prices. In turn, recent outcomes for non-durable goods price inflation were largely shaped by movements in the petrol price.

Quarterly Bulletin December 201522
Consumer goods price inflation
Percentage change over twelve months
2010 2011 2012 2013 2014 2015-4
-2
0
2
4
6
8
10
12 Non-durable goods Semi-durable goods Durable goods
Durable and semi-durable goods price inflation have remained fairly subdued in recent months; semi-durable goods price inflation slowed marginally from 4,3 per cent in June 2015 to 3,8 per cent in October 2015, while durable goods price inflation accelerated slightly from 2,2 per cent to 3,0 per cent over the same period. The moderation in semi-durable goods price inflation resulted largely from slowing clothing and footwear price inflation, while the marginal quickening in durable goods price inflation stemmed largely from higher prices of import-intensive household appliances, following the depreciation in the exchange rate of the rand. However, new vehicle price inflation moderated further in recent months as consumer demand for new vehicles slowed notably in 2015.
Following a two-year period of extraordinarily stable rates of increase around the 6,0 per cent upper limit of the inflation target range, consumer services price inflation slowed somewhat in recent months, amounting to 5,6 per cent in October 2015. Price inflation decelerated across a number of services price categories, notably transport services, restaurant and hotel services, funeral services and financial services in the five months to October 2015. Conversely, water tariffs and assessment rates accelerated over this period.
International food prices decreased further in recent months on account of high global production, large global stocks and a strong US dollar. As such, the international food price index of the United Nations Food and Agriculture Organization (FAO) (denominated in US dollar) was 18,1 per cent lower in November 2015 than a year earlier. Large inventories and generally good crop prospects resulted in the international prices of cereals falling further in November 2015. In particular, wheat prices in US dollar fell by more than 20 per cent in the year to November 2015 following record production. However, when expressed in rand terms the most recent year-on-year change in the FAO international cereals price index is an increase of 6,8 per cent registered in November 2015, reflective of the depreciation of the currency.
Domestic agricultural producer food price inflation accelerated from -3,0 per cent in January 2015 to 8,6 per cent in August, and to 7,2 per cent in October. The quickening in agricultural producer food price inflation resulted almost entirely from a marked acceleration in price inflation for cereals and other crops, from -17,5 per cent in January 2015 to 41,0 per cent in October, reflecting the impact of the severe drought conditions on the maize crop in particular. Conversely, producer price inflation of live animals decelerated from a recent high of 11,5 per cent in May 2015 to only 2,6 per cent in October as drought and substantially higher input prices of cereals used for animal feed probably led to increased culling of herds by farmers.

23Quarterly Bulletin December 2015
Producer food price inflation at the manufactured level remained contained, picking up from 5,0 per cent in July and August 2015 to 6,0 per cent in October. Despite decelerating from elevated levels at the start of 2015, price inflation for final manufactured meat and meat products remained fairly high at 6,0 per cent in October. In addition, some pass-through from the notable acceleration in agricultural crops and cereals price inflation became visible in manufactured food price inflation in recent months; price inflation for grain mill products for instance quickened notably to 11,6 per cent in October 2015.
2010 2011 2012 2013 2014 20150
2
4
6
8
10
12
-9
-6
-3
0
3
6
9
12
15
PPI: agricultureCPI: unprocessed food
PPI: final manufactured foodCPI: processed food
Food price inflation
Percentage change over twelve months
Consumer food price inflation has not yet responded fully to the recent acceleration in agricultural producer food price inflation, moderating gradually from a recent high of 9,5 per cent in August 2014 to 4,3 per cent in June 2015, before accelerating marginally to 4,9 per cent in October. Offsetting forces were at work: the prolonged drought conditions manifested in a quickening of price inflation for bread and cereals from 2,4 per cent in April 2015 to 7,1 per cent in October, but this was countered by a deceleration in consumer meat price inflation from around 9,0 per cent at the start of 2015 to 4,4 per cent in October. In addition, vegetable price inflation moderated notably over the same period.
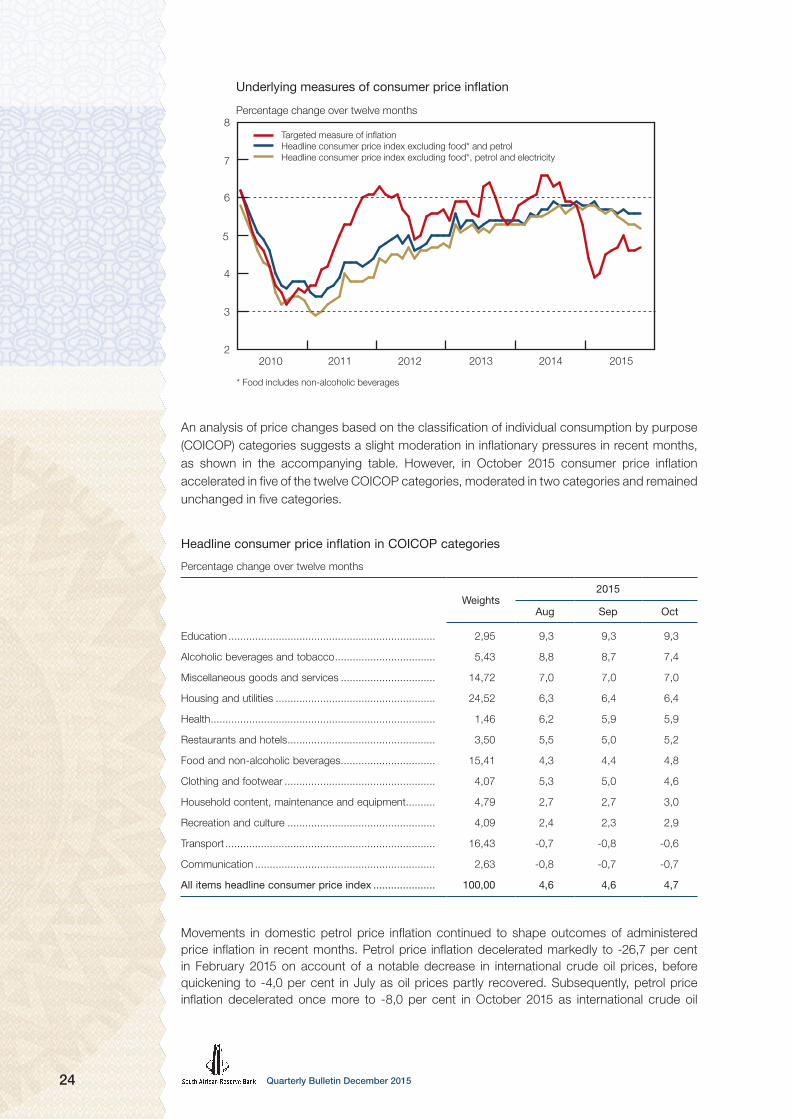
Most measures of underlying inflation have receded somewhat in 2015, reflective of fairly weak pricing power in the domestic economy. Subtracting the impact of the more volatile food and petrol prices from the calculation of targeted headline consumer price inflation, underlying inflation slowed from 5,9 per cent in February 2015 to 5,6 per cent in August, September and October. Similarly, when further excluding the impact of electricity prices from the calculation, the resultant underlying measure of inflation moderated from 5,8 per cent in February 2015 to 5,2 per cent over the same period – its lowest level since February 2014.
Quarterly Bulletin December 201524
Underlying measures of consumer price inflation
Percentage change over twelve months
Targeted measure of inflation Headline consumer price index excluding food* and petrol Headline consumer price index excluding food*, petrol and electricity
2010 2011 2012 2013 2014 20152
3
4
5
6
7
8
* Food includes non-alcoholic beverages
An analysis of price changes based on the classification of individual consumption by purpose (COICOP) categories suggests a slight moderation in inflationary pressures in recent months, as shown in the accompanying table. However, in October 2015 consumer price inflation accelerated in five of the twelve COICOP categories, moderated in two categories and remained unchanged in five categories.
Headline consumer price inflation in COICOP categories
Percentage change over twelve months
Weights2015
Aug Sep Oct
Education ...................................................................... 2,95 9,3 9,3 9,3
Alcoholic beverages and tobacco .................................. 5,43 8,8 8,7 7,4
Miscellaneous goods and services ................................ 14,72 7,0 7,0 7,0
Housing and utilities ...................................................... 24,52 6,3 6,4 6,4
Health ............................................................................ 1,46 6,2 5,9 5,9
Restaurants and hotels .................................................. 3,50 5,5 5,0 5,2
Food and non-alcoholic beverages ................................ 15,41 4,3 4,4 4,8
Clothing and footwear ................................................... 4,07 5,3 5,0 4,6
Household content, maintenance and equipment.......... 4,79 2,7 2,7 3,0
Recreation and culture .................................................. 4,09 2,4 2,3 2,9
Transport ....................................................................... 16,43 -0,7 -0,8 -0,6
Communication ............................................................. 2,63 -0,8 -0,7 -0,7
All items headline consumer price index ..................... 100,00 4,6 4,6 4,7
Movements in domestic petrol price inflation continued to shape outcomes of administered price inflation in recent months. Petrol price inflation decelerated markedly to -26,7 per cent in February 2015 on account of a notable decrease in international crude oil prices, before quickening to -4,0 per cent in July as oil prices partly recovered. Subsequently, petrol price inflation decelerated once more to -8,0 per cent in October 2015 as international crude oil

25Quarterly Bulletin December 2015
prices receded again. However, the accompanying graph illustrates that the full benefit of the most recent drop in international crude oil prices was not passed on to domestic petrol prices because of the depreciation in the exchange rate of the rand versus the US dollar.
International oil and domestic petrol price inflation
Percentage change over twelve months
-80
-60
-40
-20
0
20
40
60
80
2010 2011 2012 2013 2014 2015
International oil prices (Brent crude, US dollar)
Domestic petrol prices
Similar to petrol price inflation, administered price inflation quickened from a recent low of -4,5 per cent in February 2015 to 4,5 per cent in July, before slowing marginally to 3,3 per cent in August, September and October. Nonetheless, when excluding the effect of petrol prices from the calculation of administered prices, the rate of increase accelerated from 6,3 per cent in February 2015 to 8,3 per cent in August, September and October, driven largely by accelerations in price inflation for electricity, water and assessment rates.
Average inflation expectations, as measured in the third quarter 2015 Inflation Expectations Survey conducted by the BER, shifted marginally lower for 2015 and marginally higher for 2017, while remaining unchanged for 2016. While both the financial analysts and trade union officials lowered their inflation expectations for 2015 by 0,1 per cent to 4,9 per cent and 5,5 per cent respectively, business representatives kept their expectations for 2015 constant at 6,2 per cent. However, for 2016 financial analysts lowered their expectations marginally to 5,9 per cent, while business representatives and trade union officials lifted their expectations somewhat to 6,5 per cent and 6,0 per cent respectively. Only trade union officials changed their inflation expectations for 2017, from 5,6 per cent in the second quarter of 2015 to 5,9 per cent in the third quarter.
Headline consumer price inflation expectations
Per cent, as surveyed in the third quarter of 2015
Average inflation expected for:Financial analysts
Business representatives
Trade union representatives
All surveyed participants
2015.......................................................... 4,9 6,2 5,5 5,5
2016.......................................................... 5,9 6,5 6,0 6,1
2017.......................................................... 5,4 6,5 5,9 5,9
The next five years .................................... 5,4 6,5 5,9 5,9
Source: Bureau for Economic Research, Stellenbosch University
Following an increase in the second quarter of 2015, average five-year inflation expectations declined marginally from 6,0 per cent to 5,9 per cent in the third quarter. After surging from 6,3 per cent in the fourth quarter of 2014 to 6,8 per cent in the first quarter of 2015 and further to

Quarterly Bulletin December 201526
7,1 per cent in the second quarter, average household inflation expectations retracted to 6,7 per cent in the third quarter. This decline could mainly be attributed to lower inflation expectations among the higher income groups, that is, those earning more than R7 000 per month; the lower the income group, the higher the inflation expectations of people surveyed.
Inflation expectations
Per cent
20112010 2012 2013 2014 20152
4
6
8
10 Headline consumer price inflation Two years ahead One year ahead Current year
Source: Bureau for Economic Research, Stellenbosch University

27Quarterly Bulletin December 2015
Foreign trade and payments
International economic developmentsGlobal economic growth improved from 3,0 per cent in the second quarter of 2015 to 3,5 per cent in the third quarter. This acceleration was driven by faster growth in several major emerging-market economies, including India, Indonesia and Mexico. The Russian economy, after contracting for three consecutive quarters, also experienced positive growth in the third quarter. By contrast, economic growth in advanced economies moderated slightly in the third quarter of 2015 as growth slowed in the US, the UK and the euro area. Economic activity in Japan, on the contrary, contracted further in the third quarter.
Global growth and contributions from advanced and emerging economies
Percentage change from quarter to quarter Percentage points
2010 2011 2012 2013 2015-1
0
1
2
3
4
5
6
7
-1
0
1
2
3
4
5
6
7Advanced economies (right-hand scale)Emerging economies (right-hand scale)Global growth
Seasonally adjusted annualised rates
Sources: National statistical offices, JPMorgan and staff calculations
2014
The IMF pared back its global growth forecast for 2015 by 0,2 percentage points to 3,1 per cent in its October 2015 WEO. Growth in emerging-market and developing economies was expected to moderate for the fifth consecutive year in 2015, weighed down by declining commodity prices, heightened financial market volatility and reduced capital flows. As such, the 2015 growth forecast for this group of countries was lowered by 0,2 percentage points to 4,0 per cent, reflecting downward revisions in some large emerging-market and oil-exporting countries, including Brazil, Russia, South Africa and Nigeria. The latter’s growth is expected to slow substantially from 6,3 per cent in 2014 to 4,0 per cent in 2015, mainly due to declining oil prices. Advanced economies were expected to grow by 2,0 per cent in 2015, some 0,1 percentage points lower than anticipated in the previous forecast, but nevertheless an improvement on the preceding year’s growth. The economic recovery was expected to continue in the US, supported by lower energy prices, reduced fiscal drag, stronger balance sheets and the improving housing market. Lower oil and other commodity prices, weaker currencies as well as monetary easing were expected to sustain the moderate recovery in the euro area and Japan.

Quarterly Bulletin December 201528
Real growth in selected advanced economies
Percentage change at seasonally adjusted annualised rates
2013 2014 2015
Countries 4th qr Year 1st qr 2nd qr 3rd qr 4th qr Year 1st qr 2nd qr 3rd qr
United States................. 3,8 1,5 -0,9 4,6 4,3 2,1 2,4 0,6 3,9 2,1
Japan ............................ -0,9 1,6 4,7 -7,7 -1,1 1,2 -0,1 4,6 -0,7 -0,8
Euro area ....................... 0,9 -0,3 0,8 0,3 1,0 1,6 0,9 2,1 1,4 1,2
United Kingdom ............ 2,6 2,2 2,5 3,8 2,6 3,0 2,9 1,5 2,6 1,9
Canada ......................... 4,0 2,2 0,5 3,7 2,1 3,4 2,5 -0,7 -0,3 2,3
Australia ........................ 3,1 2,0 3,8 1,8 1,5 1,6 2,6 3,6 1,0 3,8
New Zealand ................. 2,0 2,5 4,3 3,1 3,6 3,1 3,0 0,9 1,7 1,3
Advanced economies ... 2,4 1,1 0,9 1,6 2,4 1,9 1,8 1,8 1,9 1,6
Underlined numbers indicate projections. Some regional totals include countries with forecasted data.
Sources: Bloomberg, national statistical offices and staff calculations
Real economic growth in the US decelerated to a revised 2,1 per cent in the third quarter of 2015, having amounted to 3,9 per cent in the second quarter. This slower growth largely reflected a decline in private inventory investment along with a moderation in the growth of exports, non-residential fixed investment and household expenditure. The Federal Reserve Open Market Committee (FOMC) remains relatively positive on the growth and labour market outlook of the US economy. Even though the FOMC left its policy rate unchanged at its October 2015 meeting, the tone of its statement raised expectations of a potential interest rate increase at its December meeting. The US economy added 271 000 jobs in October 2015, the largest gain since December 2014, and well ahead of expectations. This robust report on US employment has further strengthened the possibility that the FOMC could increase the federal funds rate in December. US consumer price inflation edged up slightly in October 2015, but remained subdued at 0,2 per cent.
Growth in the euro area unexpectedly eased to 1,2 per cent in the third quarter of 2015, largely reflecting weaker economic activity in Germany, Italy, Spain and Portugal. Euro area consumer price inflation increased marginally to 0,1 per cent in October 2015, after contracting the previous month. The Governing Council of the European Central Bank decided at its meeting in early December 2015 to lower the interest rate on the deposit facility by 10 basis points to -0,30 per cent, to extend the asset purchase programme by six months to at least March 2017, and to include local and regional government debt in the list of eligible assets.
Real output in Japan declined at a rate of 0,8 per cent in the third quarter of 2015, mainly due to a large negative contribution from private inventory investment. This means the Japanese economy has technically entered a recession as output shrunk for two consecutive quarters. Although still subdued as a result of lower energy prices, Japan’s consumer price inflation increased marginally to 0,3 per cent in October 2015. The Bank of Japan (BOJ) left interest rates unchanged at its October 2015 meeting and maintained its bond purchase programme at ¥80 trillion per annum. The BOJ has revised its inflation and growth forecasts down, and pushed back its expectation of reaching the 2 per cent inflation target towards the end of 2016.
Economic growth in the UK eased to 1,9 per cent in the third quarter of 2015 from 2,6 per cent in the second quarter. UK consumer prices declined by 0,1 per cent in October 2015. The Bank of England kept interest rates steady at 0,5 per cent at its October 2015 meeting and maintained the stock of purchased assets financed by the issuance of central bank reserves at £375 billion.
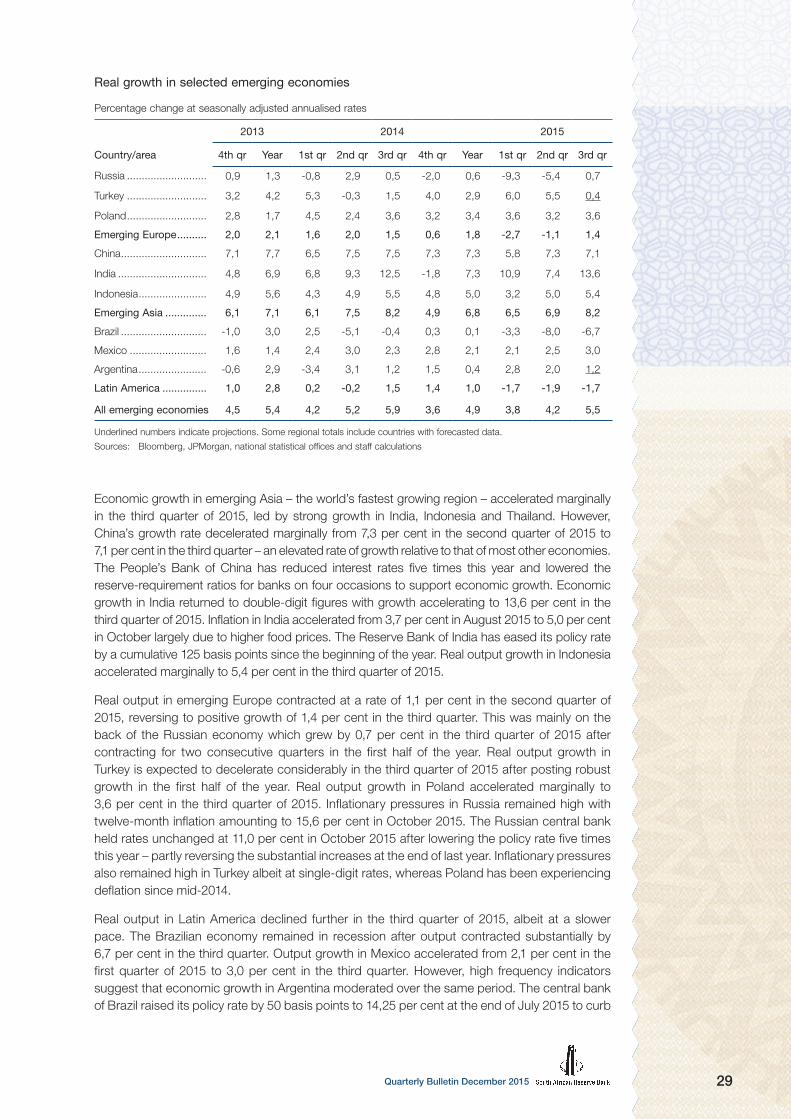
29Quarterly Bulletin December 2015
Real growth in selected emerging economies
Percentage change at seasonally adjusted annualised rates
2013 2014 2015
Country/area 4th qr Year 1st qr 2nd qr 3rd qr 4th qr Year 1st qr 2nd qr 3rd qr
Russia ........................... 0,9 1,3 -0,8 2,9 0,5 -2,0 0,6 -9,3 -5,4 0,7
Turkey ........................... 3,2 4,2 5,3 -0,3 1,5 4,0 2,9 6,0 5,5 0,4
Poland ........................... 2,8 1,7 4,5 2,4 3,6 3,2 3,4 3,6 3,2 3,6
Emerging Europe .......... 2,0 2,1 1,6 2,0 1,5 0,6 1,8 -2,7 -1,1 1,4
China ............................. 7,1 7,7 6,5 7,5 7,5 7,3 7,3 5,8 7,3 7,1
India .............................. 4,8 6,9 6,8 9,3 12,5 -1,8 7,3 10,9 7,4 13,6
Indonesia ....................... 4,9 5,6 4,3 4,9 5,5 4,8 5,0 3,2 5,0 5,4
Emerging Asia .............. 6,1 7,1 6,1 7,5 8,2 4,9 6,8 6,5 6,9 8,2
Brazil ............................. -1,0 3,0 2,5 -5,1 -0,4 0,3 0,1 -3,3 -8,0 -6,7
Mexico .......................... 1,6 1,4 2,4 3,0 2,3 2,8 2,1 2,1 2,5 3,0
Argentina ....................... -0,6 2,9 -3,4 3,1 1,2 1,5 0,4 2,8 2,0 1,2
Latin America ............... 1,0 2,8 0,2 -0,2 1,5 1,4 1,0 -1,7 -1,9 -1,7
All emerging economies 4,5 5,4 4,2 5,2 5,9 3,6 4,9 3,8 4,2 5,5
Underlined numbers indicate projections. Some regional totals include countries with forecasted data.
Sources: Bloomberg, JPMorgan, national statistical offices and staff calculations
Economic growth in emerging Asia – the world’s fastest growing region – accelerated marginally in the third quarter of 2015, led by strong growth in India, Indonesia and Thailand. However, China’s growth rate decelerated marginally from 7,3 per cent in the second quarter of 2015 to 7,1 per cent in the third quarter – an elevated rate of growth relative to that of most other economies. The People’s Bank of China has reduced interest rates five times this year and lowered the reserve-requirement ratios for banks on four occasions to support economic growth. Economic growth in India returned to double-digit figures with growth accelerating to 13,6 per cent in the third quarter of 2015. Inflation in India accelerated from 3,7 per cent in August 2015 to 5,0 per cent in October largely due to higher food prices. The Reserve Bank of India has eased its policy rate by a cumulative 125 basis points since the beginning of the year. Real output growth in Indonesia accelerated marginally to 5,4 per cent in the third quarter of 2015.
Real output in emerging Europe contracted at a rate of 1,1 per cent in the second quarter of 2015, reversing to positive growth of 1,4 per cent in the third quarter. This was mainly on the back of the Russian economy which grew by 0,7 per cent in the third quarter of 2015 after contracting for two consecutive quarters in the first half of the year. Real output growth in Turkey is expected to decelerate considerably in the third quarter of 2015 after posting robust growth in the first half of the year. Real output growth in Poland accelerated marginally to 3,6 per cent in the third quarter of 2015. Inflationary pressures in Russia remained high with twelve-month inflation amounting to 15,6 per cent in October 2015. The Russian central bank held rates unchanged at 11,0 per cent in October 2015 after lowering the policy rate five times this year – partly reversing the substantial increases at the end of last year. Inflationary pressures also remained high in Turkey albeit at single-digit rates, whereas Poland has been experiencing deflation since mid-2014.
Real output in Latin America declined further in the third quarter of 2015, albeit at a slower pace. The Brazilian economy remained in recession after output contracted substantially by 6,7 per cent in the third quarter. Output growth in Mexico accelerated from 2,1 per cent in the first quarter of 2015 to 3,0 per cent in the third quarter. However, high frequency indicators suggest that economic growth in Argentina moderated over the same period. The central bank of Brazil raised its policy rate by 50 basis points to 14,25 per cent at the end of July 2015 to curb

Quarterly Bulletin December 201530
inflationary pressures. Following the steep depreciation of the real and increases in administered prices, inflation in Brazil accelerated from 6,4 per cent in December 2014 to 9,9 per cent in October 2015. Inflationary pressures were subdued in Mexico where inflation amounted to 2,5 per cent in October 2015.
According to the CPB Netherlands Bureau for Economic Policy Analysis, the volume of world trade (calculated as the three-month average of world exports relative to that of the preceding three months) accelerated by 2,8 per cent in September 2015. This is significantly lower than August’s increase of 7,2 per cent, which was the largest increase since November 2014. The September expansion was driven mainly by a 3,8 per cent increase in the volumes exported by advanced economies. Export volumes in emerging economies increased by 1,7 per cent in September, from 12,2 per cent in August.
The price of Brent crude oil declined from US$65 per barrel in early May 2015 to a six-year low of around US$40 per barrel in mid-August. The sharp decline was brought about by heightened concerns about global growth, particularly in China, and the continuing oversupply in global oil markets. Crude oil prices recovered towards the end of August to levels just above US$50 per barrel due to technical factors, including the offsetting of positions by hedge funds and other speculators. Weak economic growth in China subsequently pushed prices lower to levels around US$44 per barrel in recent weeks. The record high levels of global oil inventories and concerns about spare storage capacity have resulted in lower spot prices and a steeply upward sloping oil futures curve, as shown in the accompanying graph.
International crude oil prices
US dollar per barrel
Futures prices (on 4 December 2015)
30
60
90
120
150
Brent crude spot price
Source: Bloomberg
2010 2011 2012 2013 2014 2015 2016
Current account 6
With imports rising more strongly than exports, the positive trade balance recorded by South Africa in the second quarter of 2015 reverted to a deficit of R14 billion in the third quarter. The shortfall on the trade account could largely be attributed to increased domestic demand for foreign-produced intermediate and consumption goods. At the same time, growth in export volumes moderated, following steady growth in the physical quantity of exports from the middle of 2014.
6 Unless stated to the contrary, the current-account transaction flows referred to in this section are all seasonally adjusted and annualised.

31Quarterly Bulletin December 2015
Balance of payments on current account
R billions, seasonally adjusted and annualised
2014 2015
2nd qr 3rd qr 4th qr Year 1st qr 2nd qr 3rd qr
Merchandise exports .................................... 909 931 959 941 937 1 001 1 009
Net gold exports ........................................... 64 63 62 63 62 71 64
Merchandise imports .................................... -1 064 -1 071 -1 056 -1 072 -1 067 -1 059 -1 087
Trade balance .............................................. -90 -77 -35 -69 -68 14 -14
Net service, income and current transfer payments ............................. -142 -145 -163 -138 -117 -138 -151
Balance on current account ........................ -232 -223 -198 -207 -185 -124 -165
As percentage of gross domestic product -6,2 -5,8 -5,1 -5,4 -4,7 -3,1 -4,1
Components may not add up to totals due to rounding
The shortfall on the services, income and current transfer account with the rest of the world also widened in the third quarter of 2015, largely due to higher net income payments to international investors. The annualised deficit on the current account of the balance of payments accordingly rose from R124 billion in the second quarter of 2015 to R165 billion in the third quarter. Expressed as a ratio of nominal GDP, the deficit increased from 3,1 per cent to 4,1 per cent over the period.
2011 2012 2013 2014 20152010
Balance of payments: current account
R billions
Percentage of gross domestic product
Trade account
Seasonally adjusted and annualised
Balance on current account
-150
-100
-50
0
50
100
-8
-6
-4
-2
0
Having advanced by 4,9 per cent in the second quarter of 2015, growth in the volume of merchandise exports slowed to 1,5 per cent in the third quarter. An increase in the volume of mining exports was partly offset by a decline in the volume of manufactured exports over the period. The physical quantity of manufactured exports declined in the third quarter of 2015, largely due to a notable decrease in the volume of chemicals exported, which more than outweighed increases in the export volume of machinery and electrical equipment over the period.

Quarterly Bulletin December 201532
The volume of mining exports advanced further in the third quarter of 2015, albeit at a somewhat slower pace. Increases in exports of coal (mainly destined for Spain, Morocco and the Netherlands) and ferrochrome were partly offset by decreases in export quantities of especially platinum group metals and iron ore in the third quarter of 2015. The decline in the volume of platinum group metal exports partly reflected lower production levels, while the decrease in the volume of iron ore exports could be explained by the slowdown in global demand from, inter alia, China in view of a global oversupply of iron ore. The demand for iron ore was furthermore dampened by a plea from the Chinese government to reduce production at some mills in order to limit air pollution in Beijing. According to the Chinese Iron and Steel Association, steel production in China, the world’s largest producer, shrank by 2,2 per cent to 675 million tons in the first ten months of 2015 compared with the corresponding period of 2014. The overall volume of South Africa’s merchandise exports also benefited from an increase in the physical quantity of exported agricultural products, especially edible fruits.
20112010 2012 2013 2014 2015
Volume of merchandise exports
R billions, 2010 prices
Seasonally adjusted
150
300
450
600
750
900
Total
Mining
Manufacturing
The average US dollar price for a basket of South African-produced non-gold export commodities, which had declined since the first quarter of 2014, fell by a further 8,4 per cent in the third quarter of 2015. Notable declines were recorded in the prices of nickel, copper, platinum, coal and iron ore. The US dollar price of iron ore, in particular, dropped notably due to an oversupply as the world’s two largest iron ore producers, Rio Tinto in Australia and Vale SA in Brazil, raised output amid a slowdown in demand from, inter alia, China. The further decline in international commodity prices in the third quarter of 2015 was only partly offset by the decline in the external value of the rand – the rand price of total merchandise exports accordingly decreased by 0,8 per cent over the period. Given the volume increase, the value of merchandise exports consequently rose by 0,7 per cent from the second quarter of 2015 to the third quarter.

33Quarterly Bulletin December 2015
20112010 2012 2013 2014 2015
South African-produced export commodity prices*
Indices: 2010 = 100
* Excluding gold
40
60
80
100
120
140
US dollar
Rand
The average fixing price of gold on the London market declined from US$1 193 per fine ounce in the second quarter of 2015 to US$1 125 per fine ounce in the third quarter, rising to US$1 158 per fine ounce in October 2015. However, owing to the depreciation in the exchange rate of the rand, the average realised rand price of gold receded by only 0,3 per cent in the third quarter of 2015. Together with a 9 per cent contraction in the physical quantity of net gold exports, net gold export proceeds decreased by 9,3 per cent in the third quarter.
2014 2015
International price of gold
Indices: January 2014 = 100
85
90
95
100
105
110
115
120
US dollar
Rand
The value of merchandise imports rose by 3,6 per cent in the third quarter of 2015, boosted by increases in the physical quantity as well as in the price of imported goods. Despite inflation remaining well contained in South Africa’s most important trading-partner countries, the unit price of imported goods rose by 1,6 per cent in the third quarter of 2015 mainly on account of a further decline in the external value of the rand.
In line with a moderate pickup in gross domestic expenditure in the third quarter of 2015, the volume of merchandise imports advanced by 1,0 per cent over the period, following a decline of 1,4 per cent in the second quarter. As a result, the country’s import penetration ratio increased marginally to 26,7 per cent in the third quarter of 2015 – a level last recorded in 2008.

Quarterly Bulletin December 201534
The increase in merchandise import volumes largely reflected an increase in manufactured imports as not only fertiliser imports but more especially imports of vehicles and transport equipment rose over the period. Over and above the acquisition of two aircraft, imports of vehicles and transport equipment were also bolstered by the importation of locomotives as part of government’s national infrastructure development programme. As a result, the physical quantity of vehicle and transport equipment imports rose by 6,8 per cent in the first three quarters of 2015 compared with the corresponding period in 2014.
Box 1 Imports of locomotives by public corporations
In an effort to improve the country’s rail transportation system and to ease logistical bottlenecks, the
Passenger Rail Agency of South Africa (Prasa) and Transnet are expanding their fleet of locomotives. The
importation of locomotives gained momentum recently as 12 locomotives to be used in the transportation
of passengers were acquired from Spain in the first quarter of 2015, while 47 locomotives to be used in
the transportation of freight were imported from China in the third quarter of 2015.
0,0
0,5
1,0
1,5
2,0
2,5
2010 2011 2012 2013 2014 2015
Imports of vehicles and transport equipment*
R billions
Vehicles and transport equipment Locomotives (right-hand scale)
* Not seasonally adjusted and not annualised
20
30
40
50
60
Relative to the total value of imported vehicles and transport equipment, the value of imported
locomotives rose from 0,7 per cent in 2014 to 3,7 per cent in the first three quarters of 2015. The import
value in the category for vehicles and transport equipment is expected to increase further as the delivery
of 1 064 diesel and electric locomotives ordered by Transnet is scheduled in the period up to March
2018, albeit with diminishing import and rising local content.
0
30
60
90
120
150
2015 2016 2017 2018
Planned schedule for delivery of freight locomotives to Transnet
Number
Sources: Transnet and South African Reserve Bank own calculations

35Quarterly Bulletin December 2015
The volume of imported mining products dropped in the third quarter of 2015 mainly on account of lower volumes of manganese ore, sulphur, and cobalt ores and concentrates. Large quantities of manganese ore were imported in the second quarter of 2015 in anticipation of the closure of the railway line being used for transporting manganese ore in August 2015. The volume of crude oil imports also edged lower from the second to the third quarter of 2015, with imports of refined petroleum products also declining over the period.
40
60
80
100
120
140
160
300
400
500
600
700
20112010 2012 2013 2014 2015
Volume of merchandise imports
R billion, 2010 prices
Vehicles and transport equipment* Total manufacturing (right-hand scale)
* Including parts and accessories
Owing to a decrease in the rand prices of merchandise exports and services rendered by South African entities to non-resident parties, and a simultaneous increase in the unit price of imported goods and services, South Africa’s terms of trade deteriorated in the third quarter of 2015.
20112010 2012 2013 2014 2015
Terms of trade*
Index: 2010 = 100
* Including gold
90
95
100
105
110

Quarterly Bulletin December 201536
The shortfall on the services, income and current transfer account of the balance of payments widened from R138 billion in the second quarter of 2015 to R151 billion in the third quarter mainly due to higher net income payments to the rest of the world. As a percentage of GDP, the deficit on the services, income and current transfer account increased somewhat from 3,5 per cent to 3,8 per cent over the period.
The larger deficit on the income account in the third quarter of 2015 could primarily be attributed to lower gross dividend receipts. However, despite declining in the second and third quarters of 2015, gross dividend receipts in the first three quarters of 2015 were still about 27 per cent higher than in the corresponding period of 2014. Nevertheless, relative to GDP, net foreign dividend payments continued to fluctuate below their long-term quarterly average registered since 2007.
20082007 2009 2010 2011 2012 2013 2014 2015
Net dividend payments
Percentage of gross domestic product
Quarterly average since 2007
0
1
2
3
4
5
Gross travel receipts remained broadly unchanged in the third quarter of 2015, having decreased by about 9 per cent in the preceding quarter. Despite remaining on roughly the same level in the third quarter, travel receipts in the first three quarters of 2015 were about 3 per cent higher than in the corresponding period of 2014 – a steep deceleration when compared to the increase of 14 per cent recorded in 2014 as a whole.
Financial accountGlobal investors remained cautious in the third quarter of 2015 amid volatility in Chinese share prices, the sudden depreciation of the Chinese renminbi in August, ongoing uncertainty in financial markets and dwindling commodity prices. Uncertainty about the timing of the start of US interest rate normalisation and its potential impact on capital flows to and from especially emerging markets also permeated the investor community. Domestically, negative economic growth in the second quarter of 2015 alongside tense wage negotiations in a number of economic sectors shaped the investment outlook of international investors during the third quarter of 2015. This weaker outlook was partly countered by a better-than-expected current-account deficit in the second quarter of 2015.

37Quarterly Bulletin December 2015
Following capital inflows (including reserve assets but excluding unrecorded transactions) of only R4,1 billion in the second quarter of 2015, the inward movement of capital surged to R41,7 billion in the third quarter. On a net basis, other investment flows recorded a sizeable inflow of capital in the third quarter of 2015.
Net financial transactions
R billions
2014 2015
3rd qr 4th qr Year 1st qr 2nd qr 3rd qr
Change in liabilities
Direct investment .............................. 8,3 19,3 62,6 -13,9 6,9 15,9
Portfolio investment .......................... 50,8 -17,2 73,3 39,3 54,8 11,8
Financial derivatives .......................... -39,6 -63,6 -194,8 -72,6 -74,3 -71,0
Other investment .............................. 50,5 55,2 148,1 39,6 -20,6 6,2
Change in assets
Direct investment .............................. -48,1 -14,1 -83,2 -11,3 -4,9 -14,7
Portfolio investment .......................... -3,2 -0,9 -24,2 -5,3 -10,0 -24,2
Financial derivatives .......................... 40,3 68,4 211,3 73,3 70,9 78,3
Other investment ............................... 20,2 -14,4 -26,3 -18,3 -20,0 38,8
Reserve assets .................................. -23,4 -7,9 -16,6 12,3 1,4 0,5
Total identified financial transactions* 55,9 24,8 150,1 43,0 4,1 41,7
As percentage of gross domestic product ............................................. 5,8 2,5 4,0 4,5 0,4 4,1
* Including reserve assets but excluding unrecorded transactions
Foreign-owned assets in South Africa
In the third quarter of 2015 non-resident investors acquired direct investment assets to the value of R15,9 billion in South Africa, compared to an inflow of R6,9 billion in the second quarter. The inflow of capital could mainly be attributed to loans extended by foreign parent companies to domestic subsidiaries.
Inward investment into South African-issued equity and debt securities tapered off notably in the third quarter of 2015. In total, non-resident investors purchased domestic portfolio assets to the value of R11,8 billion in the third quarter of 2015, considerably less than the inflows of R54,8 billion registered in the second quarter. Foreign investors were mainly buyers of South African shares during the third quarter.
Other investment – that is liabilities of South Africa arising from loans, trade finance and bank deposits, including deposits received from unrelated third parties – displayed capital outflows of R20,6 billion in the second quarter of 2015 and inflows of R6,2 billion in the third quarter. The repayment of short-term loans by the banking and non-monetary private sectors in the third quarter of 2015 was more than neutralised by an increase in non-resident deposits with domestic banks during the period.

Quarterly Bulletin December 201538
2011 2012 2013 2014 20152010
Balance of payments: financial account
R billions
Net direct investment
Net portfolio investment
Net other investment
-50-40-30-20-10
0102030
-40
-20
0
20
40
60
-60
-40
-20
0
20
40
60
80
-20
0
20
40
60
80
100Total (including reserve assets, excluding unrecorded transactions)
South African-owned assets abroad
South African companies continued to expand their holdings of foreign direct investment assets throughout the first three quarters of 2015. The outflow of capital, however, picked up pace in the third quarter of 2015, amounting to R14,7 billion compared to an outflow of R4,9 billion in the preceding quarter. Outward direct investment was mainly directed to the healthcare sector as well as the real-estate sector.

39Quarterly Bulletin December 2015
Portfolio investment abroad by South African investors increased notably from R10,0 billion in the second quarter of 2015 to R24,2 billion in the third quarter of 2015 – the highest quarterly acquisition of outward portfolio assets to date. Domestic investors purchased foreign equity and debt securities in almost equal amounts during the quarter.
Other outward investment from South Africa changed from an outflow of R20,0 billion in the second quarter of 2015 to an inflow of R38,8 billion in the third quarter. The repatriation of the domestic banking sector’s foreign-currency deposit holdings held with offshore banks as well as the redemption of loans previously extended by the domestic banking sector to non-resident entities largely accounted for the sizeable inflow of capital during the third quarter.
Foreign debtSouth Africa’s gross external debt decreased further from US$144,4 billion at the end of March 2015 to US$141,7 billion at the end of June, weighed down nearly equally by a decline in rand and foreign currency-denominated debt. Expressed in rand terms, the country’s external debt decreased from R1 762 billion at the end of the first quarter of 2015 to R1 734 billion at the end of the second quarter.
0
20
40
60
80
100
120
140
160
201120102009 2012 2013 2014 2015
Total external debt
US dollar billions
Foreign currency-denominated debt Other rand-denominated debt Rand-denominated bonds
South Africa’s outstanding foreign currency-denominated debt decreased from US$67,0 billion at the end of the first quarter of 2015 to US$65,7 billion at the end of the second quarter, primarily due the repayment of short- and long-term loans by the domestic banking and non-monetary private sector. The country’s short-term foreign currency-denominated debt (i.e. debt with an original maturity of less than one year as well as longer-term foreign currency-denominated debt maturing within the next twelve months) accordingly amounted to 46,1 per cent of total foreign currency-denominated debt at the end of June 2015, slightly less than the ratio of 47,0 per cent registered at the end of March.

Quarterly Bulletin December 201540
Foreign debt of South Africa
US$ billions at end of period
2014 2015
1st qr 2nd qr 3rd qr 4th qr 1st qr 2nd qr
Foreign currency-denominated debt............... 62,9 62,2 64,7 67,5 67,0 65,7
Debt securities ................................................. 22,0 20,1 21,9 22,7 23,6 23,9
Other ................................................................ 40,9 42,2 42,8 44,7 43,3 41,8
Public sector ................................................ 9,1 9,1 8,8 8,2 7,3 7,7
Deposit-taking institutions ............................. 13,5 13,9 14,5 18,4 17,7 16,3
Non-monetary private sector ........................ 18,3 19,1 19,5 18,2 18,3 17,8
Rand-denominated debt ................................. 75,6 79,6 77,6 77,6 77,4 76,0
Debt securities .............................................. 40,1 44,1 41,6 41,1 39,4 38,8
Other ............................................................ 35,5 35,5 36,0 36,4 38,0 37,2
Total foreign debt ............................................ 138,5 141,8 142,3 145,1 144,4 141,7
As percentage of gross domestic product .... 38,9 40,2 40,3 41,4 41,6 41,6
As percentage of total export earnings ......... 116,2 120,3 121,2 124,0 124,9 123,8
Rand-denominated debt, expressed in US dollars, decreased from US$77,4 billion at the end of March 2015 to US$76,0 billion at the end of June. The decrease in rand-denominated debt mainly reflected a decline in the market value of non-resident investors’ bond holdings, amid an increase in South African rand-denominated bond yields during the period. At the same time, non-resident investors substantially reduced their deposits with South African banks. The ratio of rand-denominated debt to total external debt nevertheless remained unchanged at 53,6 per cent at the end of June 2015.
The ratio of external debt to annualised export earnings decreased from 124,9 per cent at the end of the first quarter of 2015 to 123,8 per cent at the end of the second quarter, while the ratio of external debt to annualised GDP remained broadly unchanged at 41,6 per cent over the period.
International reserves and liquidityDespite sustained volatility in global financial markets, South Africa’s international reserves declined by only R0,5 billion in the third quarter of 2015, having declined by R1,4 billion in the preceding quarter. Measured in US dollar, the value of South Africa’s gross gold and other foreign reserves (i.e. the international reserves of the Bank before accounting for reserve-related liabilities) declined from US$46,8 billion at the end of June 2015 to US$46,1 billion at the end of September as the dollar price of gold receded further and the National Treasury withdrew foreign-currency deposits from the Bank. The country’s gross reserves remained broadly unchanged at the end of October 2015. The level of import cover (i.e. the value of gross international reserves relative to the value of imports of goods and services as well as income payments) increased from 4,8 months at the end of June 2015 to 5,2 months at the end of September – the highest level ever recorded.
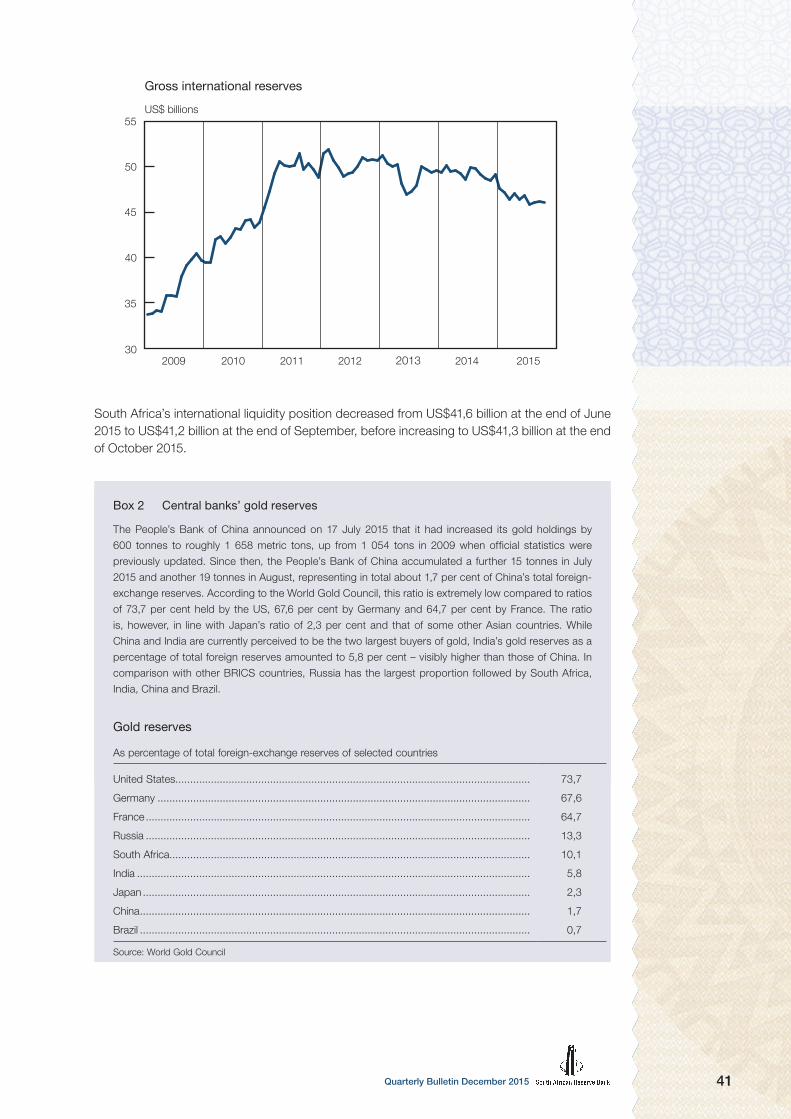
41Quarterly Bulletin December 2015
201120102009 2012 2013 2014 2015
Gross international reserves
US$ billions
30
35
40
45
50
55
South Africa’s international liquidity position decreased from US$41,6 billion at the end of June 2015 to US$41,2 billion at the end of September, before increasing to US$41,3 billion at the end of October 2015.
Box 2 Central banks’ gold reserves
The People’s Bank of China announced on 17 July 2015 that it had increased its gold holdings by 600
tonnes to roughly 1 658 metric tons, up from 1 054 tons in 2009 when official statistics were previously
updated. Since then, the People’s Bank of China accumulated a further 15 tonnes in July 2015 and
another 19 tonnes in August, representing in total about 1,7 per cent of China’s total foreign exchange
reserves. According to the World Gold Council, this ratio is extremely low compared to ratios of 73,7 per
cent held by the US, 67,6 per cent by Germany and 64,7 per cent by France. The ratio is, however, in
line with Japan’s ratio of 2,3 per cent and that of some other Asian countries. While China and India are
currently perceived to be the two largest buyers of gold, India’s gold reserves as a percentage of total
foreign reserves amounted to 5,8 per cent – visibly higher than those of China. In comparison with other
BRICS countries, Russia has the largest proportion followed by South Africa, India, China and Brazil.
Box 2 Central banks’ gold reserves
The People’s Bank of China announced on 17 July 2015 that it had increased its gold holdings by
600 tonnes to roughly 1 658 metric tons, up from 1 054 tons in 2009 when official statistics were
previously updated. Since then, the People’s Bank of China accumulated a further 15 tonnes in July
2015 and another 19 tonnes in August, representing in total about 1,7 per cent of China’s total foreign-
exchange reserves. According to the World Gold Council, this ratio is extremely low compared to ratios
of 73,7 per cent held by the US, 67,6 per cent by Germany and 64,7 per cent by France. The ratio
is, however, in line with Japan’s ratio of 2,3 per cent and that of some other Asian countries. While
China and India are currently perceived to be the two largest buyers of gold, India’s gold reserves as a
percentage of total foreign reserves amounted to 5,8 per cent – visibly higher than those of China. In
comparison with other BRICS countries, Russia has the largest proportion followed by South Africa,
India, China and Brazil.
Gold reserves
As percentage of total foreign-exchange reserves of selected countries
United States........................................................................................................................ 73,7
Germany .............................................................................................................................. 67,6
France .................................................................................................................................. 64,7
Russia .................................................................................................................................. 13,3
South Africa.......................................................................................................................... 10,1
India ..................................................................................................................................... 5,8
Japan ................................................................................................................................... 2,3
China .................................................................................................................................... 1,7
Brazil .................................................................................................................................... 0,7
Source: World Gold Council

Quarterly Bulletin December 201542
Exchange ratesEmerging-market currencies in general depreciated sharply against developed-market currencies in the third quarter of 2015, as sentiment towards emerging markets deteriorated further. The outlook for emerging-market currencies was, in particular, affected by the sell-off in the Chinese stock market in July 2015 and the sudden depreciation of the Chinese renminbi in August. Concerns about economic growth in the US and the state of the Chinese economy possibly contributed to the US Federal Reserve’s decision to postpone monetary policy tightening in the US.
Selected exchange rates againstthe randEffective exchange rates of the rand
Indices: 31 December 2014 = 100
2007 20112009 2013 2015 NovJan SepMar JulMay2015
Brazilian real Chinese yuan Malaysian ringgit
Real
Stronger rand = higher Stronger rand = higher
Nominal
Chilean peso Turkish lira Russian rouble
Indices: 2010 = 100
55
65
75
85
95
105
115
80
90
100
110
120
130
140
Against this background and amplified by the deterioration in the outlook for domestic economic activity, the nominal effective exchange rate of the rand declined, on balance, by 9,0 per cent in the third quarter of 2015 compared to a decline of 1,8 per cent in the second quarter. In October 2015, the South African rand strengthened amid a slight recovery in commodity prices, with the platinum price temporarily recovering to more than US$1 000 per fine ounce over the period. Renewed platinum price weakness and prospects for a possible tightening of monetary policy in the US subsequently contributed to a decline in the exchange value of the rand to R14,41 per US dollar on 1 December 2015; this was the lowest level ever to be recorded against the US dollar.
While the rand depreciated mostly against major currencies, it also lost ground against other emerging-market currencies such as the Chilean peso, Russian rouble and Chinese yuan from the end of 2014. By contrast, the rand appreciated against the Brazilian real, while remaining relatively stable against the Turkish lira and Malaysian ringgit over the same period. Since 19 October the rand has, however, weakened against almost all currencies.

43Quarterly Bulletin December 2015
Exchange rates of the rand
Percentage change
31 Dec 2014to
31 Mar 2015
31 Mar 2015to
30 Jun 2015
30 Jun 2015to
30 Sep 2015
30 Sep 2015to
3 Dec 2015
Weighted average* .............................. -0,2 -1,8 -9,0 -1,5
Euro ..................................................... 7,3 -4,1 -11,8 2,3
US dollar .............................................. -5,2 -0,3 -11,4 -3,6
Chinese yuan........................................ -5,2 -0,3 -9,2 -3,0
British pound ........................................ -0,2 -6,3 -7,9 -2,3
Japanese yen ....................................... -4,8 1,4 -12,9 -0,9
* Against a basket of 20 currencies
The real effective exchange rate of the rand declined by 5,0 per cent from December 2014 to September 2015, extending the gains in competitiveness of local producers in foreign markets as the real external value of the rand has now been below its ten-year average level for more than three years.
Turnover in the South African foreign-exchange marketThe net average daily turnover in foreign-exchange transactions in rand declined by US$1,0 billion from US$17,7 billion in the second quarter of 2015 to US$16,7 billion in the third quarter. The decline was evident in turnover across all market segments. Transactions in the forward market decreased from US$1,9 billion per day in the second quarter of 2015 to US$1,4 billion in the third quarter, while transactions in the spot market decreased from US$3,0 billion to US$2,7 billion per day over the same period. Transactions in the swap market, which accounted for about 75 per cent of transactions in the rand foreign-exchange market, retreated from US$12,8 billion to US$12,6 billion during the period. Declining turnover in US dollar terms was consistent with the lower dollar value of South Africa’s imports and exports in recent quarters, as the corresponding rand values edged higher but the exchange value of the rand depreciated notably.
0
5
10
15
20
25
2013 2014 2015
Net average daily turnover against the rand
US$ billions
Forward market Spot market Swap market
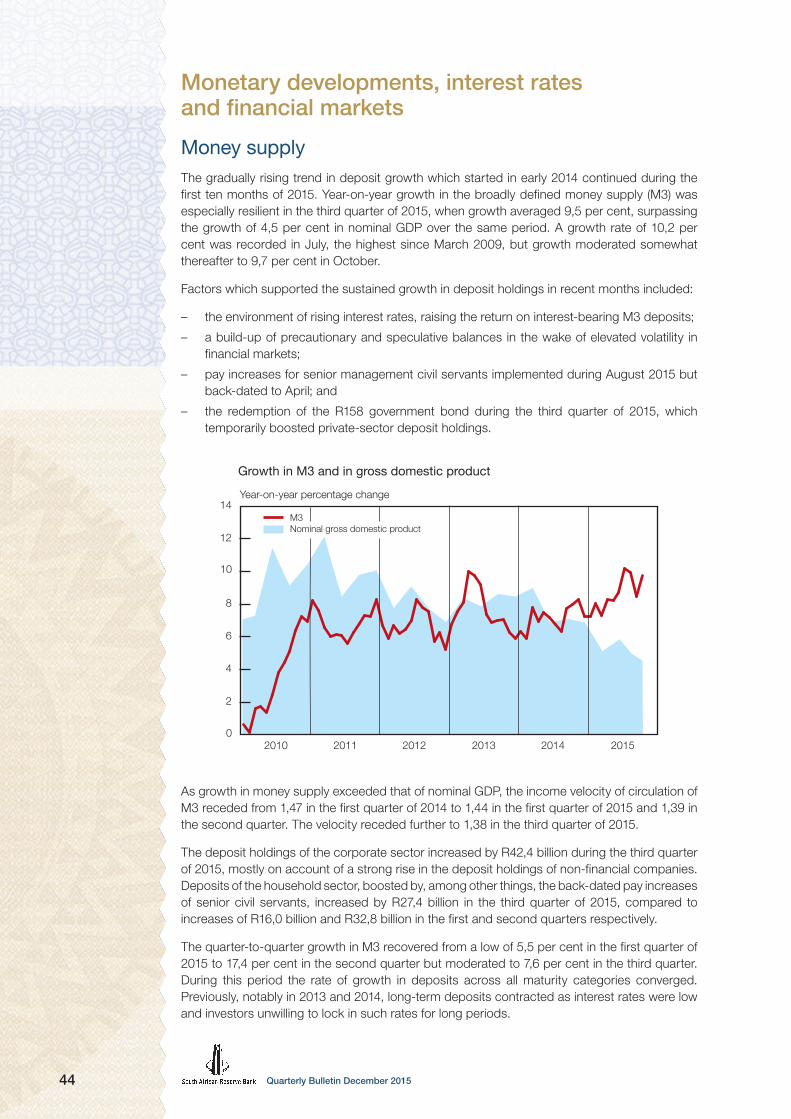
Quarterly Bulletin December 201544
Monetary developments, interest rates and financial markets
Money supplyThe gradually rising trend in deposit growth which started in early 2014 continued during the first ten months of 2015. Year-on-year growth in the broadly defined money supply (M3) was especially resilient in the third quarter of 2015, when growth averaged 9,5 per cent, surpassing the growth of 4,5 per cent in nominal GDP over the same period. A growth rate of 10,2 per cent was recorded in July, the highest since March 2009, but growth moderated somewhat thereafter to 9,7 per cent in October.
Factors which supported the sustained growth in deposit holdings in recent months included:
– the environment of rising interest rates, raising the return on interest-bearing M3 deposits;
– a build-up of precautionary and speculative balances in the wake of elevated volatility in financial markets;
– pay increases for senior management civil servants implemented during August 2015 but back-dated to April; and
– the redemption of the R158 government bond during the third quarter of 2015, which temporarily boosted private-sector deposit holdings.
0
2
4
6
8
10
12
14Year-on-year percentage change
2010 2011 2012 2013 2014 2015
M3 Nominal gross domestic product
Growth in M3 and in gross domestic product
As growth in money supply exceeded that of nominal GDP, the income velocity of circulation of M3 receded from 1,47 in the first quarter of 2014 to 1,44 in the first quarter of 2015 and 1,39 in the second quarter. The velocity receded further to 1,38 in the third quarter of 2015.
The deposit holdings of the corporate sector increased by R42,4 billion during the third quarter of 2015, mostly on account of a strong rise in the deposit holdings of non-financial companies. Deposits of the household sector, boosted by, among other things, the back-dated pay increases of senior civil servants, increased by R27,4 billion in the third quarter of 2015, compared to increases of R16,0 billion and R32,8 billion in the first and second quarters respectively.
The quarter-to-quarter growth in M3 recovered from a low of 5,5 per cent in the first quarter of 2015 to 17,4 per cent in the second quarter but moderated to 7,6 per cent in the third quarter. During this period the rate of growth in deposits across all maturity categories converged. Previously, notably in 2013 and 2014, long-term deposits contracted as interest rates were low and investors unwilling to lock in such rates for long periods.

45Quarterly Bulletin December 2015
Growth in deposits by maturity
Percentage change over twelve months
-15
-10
-5
0
5
10
15
20
201220112010 2013 2014 2015
Long term
Short andmedium term
Cash, cheque andother demand
Corporate deposits maintained a strong upward trajectory during the ten months to October 2015, helped along by, among other things, the redemption of the R158 government bond in September, which temporarily boosted the deposit holdings of both financial and non-financial companies. Year-on-year growth in deposit holdings of the corporate sector accelerated from 5,3 per cent in January 2015 to 8,6 per cent in August, only to recede to 8,0 per cent in October. Deposit growth of non-financial companies accelerated from 6,5 per cent in December 2014 to a post-recession high of 13,1 per cent in October 2015. Twelve-month growth in deposits of financial companies accelerated from a low of 3,7 per cent in December 2014 to 7,5 per cent in August, with some moderation to 4,4 per cent in October 2015.
M3 holdings of households and companies
Change(R billions)
Percentage of total
M3 deposit holdings
2014 2015 2015
Year 1st qr 2nd qr 3rd qr Year to date 3rd qr
Households ........................................ 95,1 16,0 32,8 27,4 76,1 31,3
Companies ......................................... 86,5 70,2 48,9 42,4 161,4 68,7
Of which: Financial ......................... 36,7 29,3 62,0 10,6 101,9 39,0
Non-financial ................... 49,8 40,8 -13,1 31,8 59,6 29,7
Total M3 deposits .............................. 181,6 86,2 81,7 69,7 237,6 100,0
Measured over twelve months, growth in the M3 deposit holdings of the household sector fluctuated higher over the past two years, registering double-digit rates of increase from early 2014 and reaching 14,0 per cent in July 2015. Growth was maintained at a high rate of 13,7 per cent in October 2015.

Quarterly Bulletin December 201546
M3 holdings of households and companies
Percentage change over twelve months
-5
0
5
10
15
20
2010 2011 2012 2013 2014 2015
Households Financial companies Non-financial companies
In a statistical sense, the rise in M3 during the third quarter of 2015 was mainly attributable to an increase in claims on the private sector on account of continued growth in loans and advances to especially the corporate sector. Net foreign assets and net claims on the government sector also increased, while a decline in net other assets moderated the overall increase in money supply. Net claims on the government sector increased when national government accessed short-term loan funding from the Corporation for Public Deposits, while banks also recorded a moderate increase in their holdings of government debt instruments. The increase in net foreign assets occurred alongside a weaker exchange value of the rand, which affected the value of foreign currency-denominated loans and advances as well as foreign-issued derivative assets of the monetary sector. The decrease in net other assets resulted from a rise in other liabilities of banks to domestic counterparties.
Statistical counterparts of change in M3
R billions
2014 2015
4th qr 1st qr 2nd qr 3rd qr
Net foreign assets ........................................................ -27,6 15,8 78,4 48,6
Net claims on the government sector ........................... 6,8 8,0 -3,3 40,9
Claims on the private sector ......................................... 34,3 109,4 23,4 65,7
Net other assets and liabilities ...................................... -22,2 -47,0 -16,9 -85,4
Total change in M3 ...................................................... -8,7 86,2 81,7 69,7
Box 3 Banks’ positions in foreign currency
While the bulk of South African banks’ assets and liabilities are denominated in rand, roughly 15 per cent of the total balance sheet is currently made up of assets and liabilities denominated in foreign currencies. Gross off-balance-sheet positions in foreign currencies are much larger than on-balance- sheet positions, as shown in the table on the next page.
For an individual bank, its net open position in foreign currency indicates the net amount, across that bank’s contractual obligations, that is subject to exchange rate risk – when the exchange rate appreciates or depreciates, that is the underlying amount on which profits or losses will be incurred.

47Quarterly Bulletin December 2015
Foreign-currency exposure of South African banking sector, 30 September 2015
Foreign-currency exposure item US$
billion
Percentage of annual gross
domestic product
Remarks/examples
Outright exposures On balance sheet
Total foreign-currency assets (net of infrastructural investments)
46,6 16
Claims on non-residents 35,5 12 Deposit with a foreign bank
Claims on residents 11,1 4 Advance to a South African company
Total foreign-currency liabilities 40,7 14
Liabilities to non-residents 28,6 10 Deposit received from a foreign bank
Liabilities to residents 12,1 4 Deposit in customer foreign-currency account
Contingent exposures Contingent on a counterpayment
Commitments to purchase foreign currency
253,0 84
Commitments to purchase foreign currency against rand
175,0 58
From residents 24,3 8 Forward cover for South African exporters; 8 per cent of GDP equals 3 months of exports
From non-residents 93,5 31 Forward cover for non-residents buying local bonds for future settlement; 31 per cent of GDP equals 7 months’ non-resident gross purchases of bonds
From other authorised dealers 57,0 19 Setting off exposures through interbank dealing
From South African Reserve Bank 0,3 0
Commitments to purchase foreign currency against foreign currency
78,0 26
Commitments to sell foreign currency 258,9 86
Commitments to sell foreign currency against rand
185,9 62
To residents 41,7 14 Forward cover for South African importers; 14 per cent of GDP equals more than 5 months of imports
To non-residents 86,2 29 Forward cover for non-residents selling local bonds for future settlement; 29 per cent of GDP equals 6,5 months’ non-resident gross sales of bonds
To other authorised dealers 55,8 19
To South African Reserve Bank 2,2 1
Commitments to sell foreign currency against foreign currency
73,0 24
Overall exposure
Effective net open foreign-currency position
0,0 0
Source: Banks’ BA 325 returns
The aggregate net open position for the private banking sector in South Africa is built up from large gross positions. On the balance sheet, outright assets denominated in foreign currencies exceeded outright liabilities at the end of September 2015, as shown in the accompanying table. In this instance, the focus is on the currency in which assets or liabilities are denominated, regardless of whether the counterparty is a resident or a non-resident. This differs from the country’s balance of payments and international investment position, where the focus is on claims on, and liabilities to, non-residents only (and where such claims and liabilities denominated in rand are included in the aggregate position).
The banks’ gross contingent positions in foreign currency were significantly larger than their outright positions at the end of September 2015. This is a reflection of the openness of the economy, the very liquid and active South African financial markets, and the banks’ strong participation in the forward and swap markets for foreign exchange; forward cover is available from very short to very lengthy periods, and is extensively used by market participants.
However, adding up the banks’ long outright position and short contingent position in foreign currency, their open position at the end of September stood at nil. While the Registrar of Banks requires banks individually to keep their net open positions below 10 per cent of capital and reserves, banks tend to use only a fraction of the allowable maximum.

Quarterly Bulletin December 201548
Credit extensionAverage year-on-year growth in bank credit extended to the domestic private sector accelerated from a low of 1,8 per cent in 2010 to 8,4 per cent in 2014. Growth then moderated to reach an average of 7,8 per cent in the first ten months of 2015. Whereas credit extension to the corporate sector registered firm growth over this period, growth in credit extension to the household sector remained relatively subdued. Following a brief decline to 6,9 per cent in June 2015, year-on-year growth in total loans and advances recovered to 7,5 per cent in August and 8,3 per cent in October. The slowdown in June 2015 was brought about by slower growth in credit extension to corporates due to, among other things, a large loan repayment by a securities investment company. Credit to the corporate sector slowed from 15,0 per cent in April 2015 to 10,9 per cent in June, before a pickup to 12,9 per cent in October. While growth in credit extension to households remained subdued in 2015, it accelerated marginally from 3,5 per cent in June to 4,5 per cent in October. The ratio of household debt to disposable income increased marginally in the third quarter of 2015, as growth in debt slightly exceeded that of disposable income over the period. Factors restraining demand for credit included, among other things, high levels of unemployment, weaker domestic economic growth prospects, negative wealth effects stemming from weak growth in property prices and lower share prices, and stricter credit regulations. Notwithstanding a slight recovery in consumer confidence in the third quarter of 2015, consumer optimism generally remained subdued. Low levels of consumer confidence suggest a muted recovery in consumer spending and weak growth in the uptake of credit. In addition, business confidence declined further in the third quarter of 2015 as sales volumes were increasingly supressed by moderating wage inflation, higher tax rates, rising interest rates and high unemployment.
-2
0
2
4
6
8
10
12
14Year-on-year percentage change
2010 2011 2012 2013 2014 2015
Total loans and advances Nominal gross domestic product
Bank loans and advances, and gross domestic product
As growth in nominal GDP trended lower and with total loans and advances fluctuating sideways, the ratio of credit to GDP rose during the second half of 2015. The strength of credit demand relative to GDP probably indicates that corporates in certain sectors remain positive about domestic long-term growth opportunities while also pursuing cross-border investment opportunities.
The increase in loans and advances amounted to R69,4 billion in the third quarter of 2015, up from the R50,8 billion recorded during the same period in 2014 and also significantly higher than the R9,4 billion recorded in the second quarter of 2015. During the second quarter, the weaker expansion in aggregate credit extension was largely the result of a contraction in general loans and bank overdrafts to the corporate sector. In the third quarter there was a revival in corporate credit demand in the form of mortgage advances and term loans. The quarter-to-quarter
7 growth rate in
total loans and advances to the private sector, however, declined from 10,6 per cent in the second quarter of 2015 to 5,9 per cent in the third quarter.
7 The quarter-to-quarter growth rates referred to in this section are based on seasonally adjusted and annualised data.

49Quarterly Bulletin December 2015
Bank loans and advances to the domestic private sector
Percentage change over twelve months
-10
-5
0
5
10
15
20
2010 2011 2012 2013 2014 2015
Companies
Households
Total
Other loans and advances, which consist of general loans, bank overdrafts and credit card advances, maintained the dominant role as driver of credit extension during 2014 and the first ten months of 2015. Growth in the asset-backed credit categories gradually increased during 2014 and the first ten months of 2015, mostly on account of improving growth in mortgage advances, reflecting an ephemeral rise in loans to listed property funds, some of which have been switching away from funding in the bond market while expanding their property portfolios.
The other loans and advances category contracted by R4,5 billion in the second quarter of 2015, as general loans and overdrafts to the corporate sector declined. In the third quarter, other loans and advances rose by R42,2 billion, characterised by credit demand by both financial and non-financial companies. Nonetheless, the year-on-year growth in the category for other loans and advances moderated from a recent high of 16,5 per cent in July 2014 to 10,1 per cent in September 2015 and further to 12,3 per cent in October.
After reaching a lower turning point of 0,2 per cent in July 2014, twelve-month growth in general loans to the household sector gradually accelerated to 6,6 per cent in October 2015. However, these growth rates remained far below the growth rates recorded prior to 2014. Stricter credit regulations, rising interest rates, tighter lending standards and subdued employment restrained the uptake of general loans by households.
Mortgage advances made up around 54 per cent of total loans and advances in 2010, but this share gradually dwindled to 43 per cent in the first ten months of 2015, as it lost ground to the high-growth categories of instalment sale credit and general loans. However, the monthly growth in mortgage advances rebounded from R40,6 billion recorded in the first ten months of 2014 to R61,4 billion during the same period in 2015. The current firmer growth in mortgage advances has been skewed towards commercial property, although growth in mortgage advances on residential property also gained pace, albeit more modestly. Twelve-month growth in mortgage advances gradually edged higher throughout 2014 and 2015, reaching levels last seen in 2009. In the first ten months of 2015, the year-on-year growth averaged 5,1 per cent, up from around 3 per cent over the same time a year ago. In October, growth over twelve months came to 6,0 per cent.
The rate of expansion in instalment sale credit and leasing finance, which mainly represents the financing of vehicles, has been losing momentum since reaching a peak towards the end of 2013. Twelve-month growth deteriorated from a high of 14,2 per cent in October 2013 to 3,7 per cent in October due to the continued weakening in domestic vehicle sales. The decline in instalment sale credit and leasing finance was also exacerbated by a securitisation transaction in June 2015 that reduced the amount outstanding on the balance sheet of the banking sector by R2,3 billion. The declining growth trend will probably continue over the medium term given weak vehicle sales in the present difficult domestic economic environment.

Quarterly Bulletin December 201550
Bank loans and advances by typeExtended to corporate sector
Percentage change over twelve months
2011 2012 2013 2014
Other loans and advances Mortgage advances Instalment sale credit and leasing finance
-10
-5
0
5
10
15
20
25
30
35
-10
-5
0
5
10
15
20
25
30
35
2015 2015
Extended to household sector
Percentage change over twelve months
2011 2012 2013 2014
The corporate sector’s reliance on bank-intermediated funding edged higher in 2014, but moderated somewhat in the second half of 2015, decelerating towards the still lacklustre growth in credit extension to the household sector. Other loans and advances, especially general loans and bank overdrafts, remained the main driver behind growth in credit extension to corporates during the first nine months of 2015. Year-on-year growth in credit extension to the corporate sector accelerated from an average of 8,3 per cent in 2013 to 13,8 per cent in 2014, reaching 12,9 per cent in October 2015. Loans and advances to the corporate sector in the latest quarter were characterised by rising general loans to both financial and non-financial companies, and a decline in overdrafts.
Average year-on-year growth in credit extension to the household sector receded from 4,3 per cent in 2014 to 3,7 per cent in the first ten months of 2015. However, credit extension to households grew by R44,1 billion in the first three quarters of 2015, more than the R33,9 billion recorded in the same period of 2014. During this period the upbeat growth was mainly backed by improving growth in mortgage advances and general loans, while instalment sale credit retracted further.
By economic sector, year-on-year growth in the third quarter of 2015 was dominated by the electricity and real-estate sectors, followed by business services and financial intermediation, as shown in the accompanying table. The electricity sector benefited from the financing of the various phases of the renewable energy projects initiated by government, while the expansion of portfolios by listed property funds probably boosted loans to the real-estate sector. Improving conditions in the property market also resulted in steady growth in credit extension to the construction sector throughout 2014 and the first nine months of 2105. Financial intermediation represents a significant portion of total credit extension, and growth in loans to banks and other financial firms remained healthy in the third quarter of 2015. Credit to the mining sector has been improving following an end to the protracted strike activity in 2014. Due to weak consumer demand, growth in credit to the wholesale and retail trade sector more than halved from 32 per cent in September 2014 to 11 per cent in September 2015, while growth in credit extension to the manufacturing sector displayed early signs of improvement.

51Quarterly Bulletin December 2015
Growth in bank credit by economic sector over the year to September 2015
Sector Percentage change
Percentage of total credit extension
Electricity, gas and water....................................................................... 47 1,5
Real estate ............................................................................................ 44 9,5
Business services .................................................................................. 22 3,5
Finance and insurance .......................................................................... 21 18,5
Agriculture, forestry and fishing .............................................................. 19 2,0
Wholesale and retail trade ..................................................................... 11 5,1
Community, social and personal services .............................................. 11 8,4
Mining and quarrying ............................................................................. 10 2,8
Transport, storage and communication ................................................. 9 2,8
Manufacturing ....................................................................................... 9 4,4
Construction .......................................................................................... 4 1,0
Other ..................................................................................................... 3 5,1
Households ........................................................................................... -4 35,4
Total ...................................................................................................... 9 100,0
Interest rates and yieldsSince the increase of the repurchase rate from 5,75 per cent to 6,0 per cent at the July 2015 Monetary Policy Committee (MPC) meeting, the outlook for domestic economic growth has deteriorated following the surprise contraction in the second quarter of the year. At the same time, the exchange rate of the rand depreciated in response to domestic and global developments, intensifying the upside risks to the inflation outlook. Risks to the global economic outlook increased against the backdrop of heightened global financial market volatility due to a slowing Chinese economy, continued capital outflows from emerging markets and uncertainty related to the timing of the US Federal Reserve’s monetary policy normalisation. While the MPC remained concerned about the upside risks to inflation, the repurchase rate was kept unchanged at 6,0 per cent per annum at the September meeting. However, following a significant further depreciation of the rand in the subsequent two months and a corresponding further amplification of the upside risks to inflation, the MPC announced an increase to 6,25 per cent in the repurchase rate at its November meeting. For the full statements, see pages 82 to 95 of this Quarterly Bulletin.
Money-market interest rates remained closely aligned with the repurchase rate during 2015. Some of the short-term rates fluctuated higher in the second quarter alongside expectations of a resumption in policy normalisation in the US and some further domestic policy tightening over the short to medium term, and were vindicated by the July increase in the South African policy rate. The data-induced delay in resuming policy normalisation by the US Federal Reserve at its September 2015 policy meeting brought some moderation in emerging-market risk indicators and interest rates. For example, the three-month Johannesburg interbank average rate (Jibar), which increased from 6,13 per cent in early June 2015 to 6,30 per cent on 24 July, remained broadly anchored at that level in subsequent months. On 3 December 2015, the rate had increased by 22 basis points to 6,52 per cent.
Alongside a sharp depreciation in the exchange value of the rand, the twelve-month Jibar initially trended higher to reach a recent high of 7,68 per cent on 8 September 2015. Thereafter, the rate levelled out, fluctuating somewhat as it tracked the movements in the exchange value of the rand before shifting higher in alignment with the movement in the policy rate. By 3 December the rate stood at 7,78 per cent.

Quarterly Bulletin December 201552
The tender rate on 91-day Treasury bills fluctuated higher from late in June 2015, rising somewhat further following the MPC’s raising of the repurchase rate in July. Demand for the instrument was subdued, with the bid-to-cover ratio for three-month Treasury bills averaging 1,9 in early September. Sluggish demand for Treasury bills was attributed to low investor appetite for shorter-dated investments on an upward sloping yield curve. The rate on Treasury bills moderated from late September when demand improved, but rose to around 6,48 per cent from late November, consistent with the monetary policy tightening decision.
4
5
6
7
8
Money-market rates
Per cent
2014Sep NovJan Mar May Jul Sep NovJan Mar May Jul
Repurchase rate
12-month Jibar
6-month Jibar
3-month Jibar
91-day Treasurybills
2015
The funding conditions in the interbank lending market remained relatively stable during the third quarter of 2015. The South African benchmark overnight rate (Sabor) increased in line with the repurchase rate increase in July and was relatively stable thereafter, trending sideways around an average rate of 5,90 per cent, 10 basis points below the repurchase rate. By 3 December the rate stood at 6,17 per cent. During the same period the overnight foreign-exchange rate displayed somewhat more volatility, as is usually the case. It decreased by 73 basis points from 6,62 per cent on 30 July 2015 to 5,89 per cent on 17 September 2015, partly as a result of a reduction in speculative long US dollar positions. Thereafter, this rate briefly increased to a recent high of 6,75 per cent on 29 September alongside high month-end liquidity demand, before moderating to a low of 6,07 per cent on 23 October. By early December 2015, the rate had increased to 6,33 per cent.

53Quarterly Bulletin December 2015
2
4
6
8
10
Benchmark overnight rates
Per cent
2012 2013 2014
SaborStanding facilitylower band
Standing facility upper band
Overnight FX rate
2015
Rates on forward rate agreements (FRAs), especially longer-term agreements, moved higher during the second half of 2015, displaying significant volatility following the steep depreciation in the exchange value of the rand that was induced by the negative sentiment towards emerging markets. The twelve-month FRA rate increased by 54 basis points from 6,80 per cent on 17 July to 7,34 per cent on 7 September. The rate then fluctuated lower as it tracked the exchange value of the rand, reaching 7,22 per cent on 3 December. As could be expected, shorter-term rates displayed less volatility than those of their longer-term counterparts.
9x128x117x106x95x84x73x62x51x46,2
6,4
6,6
6,8
7,0
7,2
7,4
Forward rate yield curves
Per cent
Day before November MPC decision
Day after September MPC decision
Day before September MPC decision
Day after November MPC decision
Months
The prime lending rate and the predominant rate on mortgage loans remained unchanged at 9,50 per cent following the unchanged policy decision at the September 2015 meeting of the MPC, rising to 9,75 per cent after the November meeting. Rates on private-sector banks’ deposits and loans in general also increased in response to the movement in the policy rate.

Quarterly Bulletin December 201554
Having fallen considerably in the early weeks of 2015 in the wake of lower oil prices and improved inflation expectations, South African bond yields displayed in general an upward trend from February 2015. Several factors contributed to the upward trend in yields, including:
– the upward cycle in the repurchase rate;– the depreciation in the exchange value of the rand;– the slightly wider budget deficit provided for in the 2015 Medium Term Budget Policy
Statement; – lower export commodity prices and export proceeds;– increased fears regarding an economic slowdown in China; and– emerging-market risk aversion, resulting in the net selling of local bonds by non-residents.
Related to these developments, yield indicators reflected the risk aversion of investors towards debt instruments of emerging markets. The JPMorgan Emerging Markets Bond Index Plus (EMBI+)
8 yield spread above US government bonds widened from an average of 329 basis
points in 2014 to 403 basis points in the eleven months to November 2015. Closer to home, the sovereign risk premium
9 on South African government US dollar-denominated bonds in
the seven-year maturity range trading in international markets widened from an average of 163 basis points in 2014 to 179 basis points in the first eleven months of 2015.
The yield on conventional ten-year South African government bonds increased by 150 basis points from the end of January 2015 to a level of 8,51 per cent on 30 November, while the ten-year US government bond yield increased by a lesser 56 basis points over the same period. From January to November 2015 the currency risk premium
10 on South African government
bonds widened by 87 basis points, with yields on dollar-denominated bonds increasing less notably relative to yields on rand-denominated bonds.
Government bond yieldsPer cent
1
2
3
4
5
6
7
8
9
10
2009 2010 2011 2012
South African bondyield (rand)
2013 2014 2015
South African bondyield (US dollar)
United States bondyield (US dollar)
The monthly average real yield on the R197 inflation-linked government bond displayed, on balance, little movement from January to November 2015. With the nominal yield on the R186 government bond trending higher, the break-even inflation rate, within the eight-to-eleven-year maturity range, fluctuated higher from a low of 5,24 per cent at the end of January 2015 to 6,75 per cent at the end of November. The deterioration in bond market participants’ inflation expectations can, among other things, be attributed to the depreciation in the exchange value of the rand and a worsening of food price projections.
8 EMBI+ measures total returns on US dollar-denominated debt instruments of emerging-market economies.
9 The differential between the yield on South African government US dollar-denominated bonds and that on US dollar-denominated bonds of the US government.
10 The differential between the South African government bond yield on rand-denominated debt issued in the domestic market and the yield on South African government US dollar-denominated bonds issued in the United States, both in the seven-to-ten-year maturity range.

55Quarterly Bulletin December 2015
Money marketThe daily liquidity requirement of the private-sector banks varied between a low of R35,6 billion and a high of R50,0 billion during the third quarter of 2015, higher than the range of between R29,8 billion and R47,9 billion recorded in the second quarter of 2015. The gradual longer-term rise in the daily liquidity requirement of the private-sector banks partly reflected the reforms introduced in recent years to improve the broad alignment of the money-market shortage with underlying conditions in the money market, to ultimately improve the effectiveness of the transmission of monetary policy.
70
80
90
100
110
120
130
140
10
20
30
40
50
60
70
Liquidity requirement
R billions
Estimated weekly liquidity requirementActual daily liquidity requirementNotes and coin in circulation(right-hand scale)
Jan Jul Sep NovMar May Jan Jul Sep NovMar May2014 2015
During the third quarter of 2015, liquidity to the net amount of R9,5 billion was drained from the money market, compared to a net injection of R1,6 billion recorded in the second quarter. The drainage in the third quarter mainly resulted from the net effect of increases in the amount of notes and coin in circulation outside the Bank and banks’ required cash reserve deposits, which contracted money-market liquidity by a combined R9,4 billion. The Bank only partly neutralised the contraction by injecting R0,4 billion on a net basis into the market through its money-market operations, mainly through reverse repurchase transactions and by allowing the South African Reserve Bank debentures (SARB debentures) to mature. This was partly offset by a reduction in call deposits of the Corporation of Public Deposits with the Bank. Spot foreign-exchange transactions entered into by the Bank, amounting to R3,2 billion, had an expansionary impact on money-market liquidity, but this was partly neutralised by the issuance of foreign-exchange swaps of R0,4 billion. In October 2015, liquidity management operations served to drain R2,5 billion from the market, while overall money-market conditions were characterised by a net drainage of R4,0 billion.
Capital redemption payments and scheduled coupon interest payments on various government bonds amounting to R62,0 billion were effected from the government tax and loan accounts from July to September 2015, with only R0,3 billion of this amount accruing to the Bank.
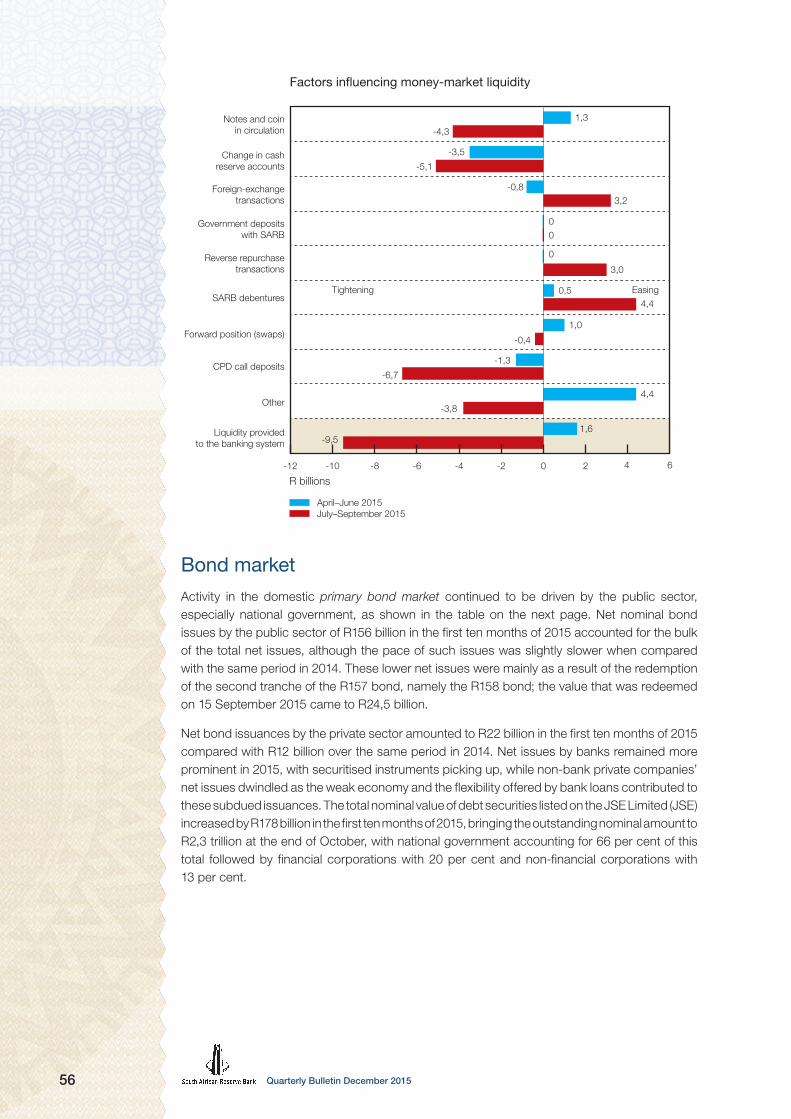
Quarterly Bulletin December 201556
Factors influencing money-market liquidity
R billions
Liquidity providedto the banking system
Other
CPD call deposits
Forward position (swaps)
SARB debentures
Reverse repurchasetransactions
Government depositswith SARB
Foreign-exchangetransactions
Change in cashreserve accounts
Notes and coinin circulation
-12 -10 -8 -6 -4 -2 0 2 4 6
April–June 2015 July–September 2015
Tightening Easing
1,6-9,5
-3,8
-1,3
-6,7
-0,4
-0,83,2
3,0
0
0
0
4,4
4,4
0,5
1,0
-3,5
-5,1
1,3
-4,3
Bond marketActivity in the domestic primary bond market continued to be driven by the public sector, especially national government, as shown in the table on the next page. Net nominal bond issues by the public sector of R156 billion in the first ten months of 2015 accounted for the bulk of the total net issues, although the pace of such issues was slightly slower when compared with the same period in 2014. These lower net issues were mainly as a result of the redemption of the second tranche of the R157 bond, namely the R158 bond; the value that was redeemed on 15 September 2015 came to R24,5 billion.
Net bond issuances by the private sector amounted to R22 billion in the first ten months of 2015 compared with R12 billion over the same period in 2014. Net issues by banks remained more prominent in 2015, with securitised instruments picking up, while non-bank private companies’ net issues dwindled as the weak economy and the flexibility offered by bank loans contributed to these subdued issuances. The total nominal value of debt securities listed on the JSE Limited (JSE) increased by R178 billion in the first ten months of 2015, bringing the outstanding nominal amount to R2,3 trillion at the end of October, with national government accounting for 66 per cent of this total followed by financial corporations with 20 per cent and non-financial corporations with 13 per cent.

57Quarterly Bulletin December 2015
Funding in the primary bond market
R billions
Net issues Net issues
Nominal amount in issue
Jan–Oct 2014 Jan–Oct 2015 31 Oct 2015
National government .......................................................... 143 142 1 500
Public corporations
Financial ........................................................................ 9 1 41
Non-financial ................................................................. 11 12 231
Local governments ............................................................. 2 1 19
Subtotal: Governments ....................................................... 165 157 1 792
Banks ................................................................................. 21 20 292
Non-bank private companies
Financial ........................................................................ 6 -1 49
Non-financial ................................................................. -3 -1 64
Securitisation ...................................................................... -12 4 67
Subtotal: Domestic private sector ....................................... 12 21 471
Non-residents ..................................................................... 1 0 7
Total ................................................................................... 178 178 2 270
Turnover in the secondary bond market continued at a steady pace in the ten months to October 2015, benefiting from higher volumes traded and, in the first few months of the year at least, higher bond prices. The daily average turnover of R96 billion in the first ten months of 2015 was 17 per cent more than in the corresponding period of 2014. As the value of bonds traded increased more pronouncedly, the liquidity ratio
11 in the bond market increased to an annualised
9,2 times per annum in the first ten months of 2015, up from 8,2 times in the year 2014. The R203 bond (due in 2017) was the most liquid government bond traded in the first ten months of 2015, followed by the R186 bond (due in 2025/26/27) and the R204 bond (due in 2018). The All-Bond Index (Albi) recorded a positive return of 4 per cent in the first ten months of 2015.
The size of, and growth in, rand-denominated bond issuance activity in international markets differ across the different markets. As redemptions of rand-denominated bonds in the Japanese Uridashi bond market have generally exceeded new issues since mid-2012, the amount in issue fluctuated lower from R53 billion in July 2012 to R42 billion in October 2015, with net redemptions of R90 million recorded thus far in 2015. The general decline in Uridashi bond market issuances is a progression of the recent policy changes in Japan compelling the national pension fund to adopt a portfolio structure that favours equities rather than bonds. By contrast, issuances of rand-denominated bonds in the European bond markets have exceeded redemptions since 2011. The amount in issue rose briskly to reach R228 billion in October 2015, boosted by increased liquidity emanating from stimulus measures in the euro area. In the first ten months of 2015, total net issues of rand-denominated bonds in both markets amounted to R9,1 billion, bringing the overall amount in issue to R269 billion at the end of October.
11 Measured as the consideration of bonds traded relative to the market capitalisation of bonds listed.
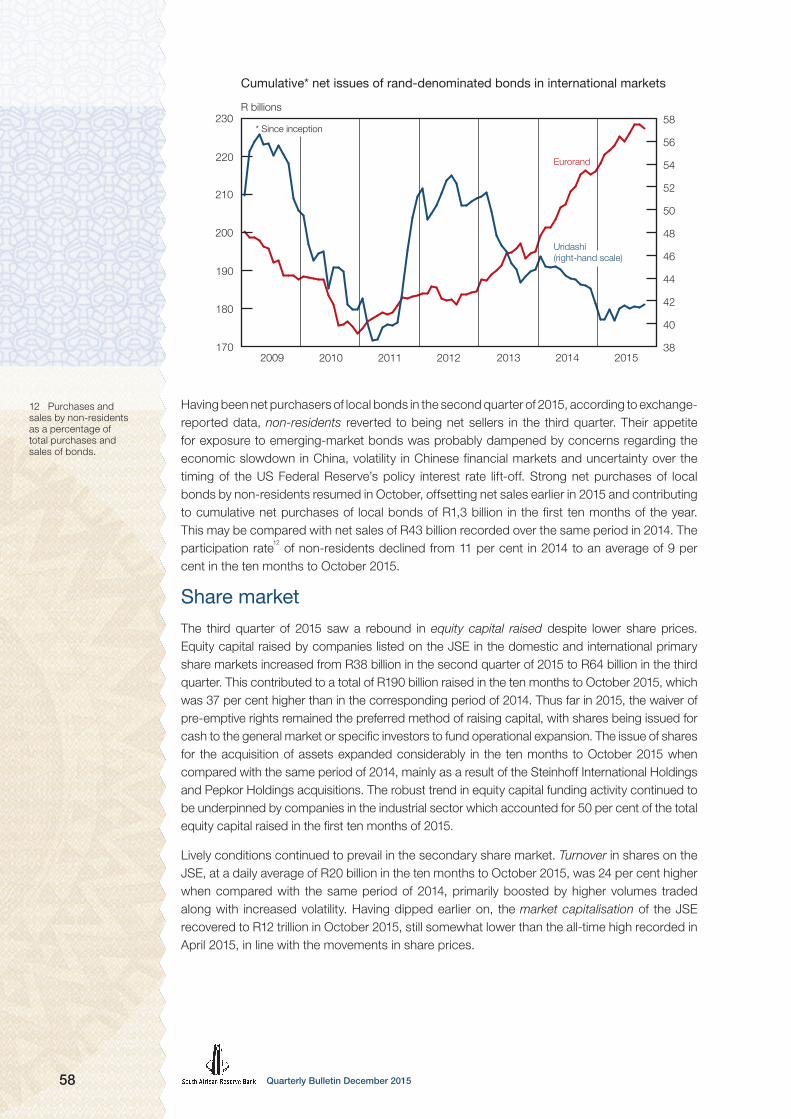
Quarterly Bulletin December 201558
Cumulative* net issues of rand-denominated bonds in international markets
R billions
170
180
190
200
210
220
230
38
40
42
44
46
48
50
52
54
56
58
2009 2010 2011 2012 2013 2014 2015
Eurorand
* Since inception
Uridashi (right-hand scale)
Having been net purchasers of local bonds in the second quarter of 2015, according to exchange-reported data, non-residents reverted to being net sellers in the third quarter. Their appetite for exposure to emerging-market bonds was probably dampened by concerns regarding the economic slowdown in China, volatility in Chinese financial markets and uncertainty over the timing of the US Federal Reserve’s policy interest rate lift-off. Strong net purchases of local bonds by non-residents resumed in October, offsetting net sales earlier in 2015 and contributing to cumulative net purchases of local bonds of R1,3 billion in the first ten months of the year. This may be compared with net sales of R43 billion recorded over the same period in 2014. The participation rate
12 of non-residents declined from 11 per cent in 2014 to an average of 9 per
cent in the ten months to October 2015.
Share marketThe third quarter of 2015 saw a rebound in equity capital raised despite lower share prices. Equity capital raised by companies listed on the JSE in the domestic and international primary share markets increased from R38 billion in the second quarter of 2015 to R64 billion in the third quarter. This contributed to a total of R190 billion raised in the ten months to October 2015, which was 37 per cent higher than in the corresponding period of 2014. Thus far in 2015, the waiver of pre-emptive rights remained the preferred method of raising capital, with shares being issued for cash to the general market or specific investors to fund operational expansion. The issue of shares for the acquisition of assets expanded considerably in the ten months to October 2015 when compared with the same period of 2014, mainly as a result of the Steinhoff International Holdings and Pepkor Holdings acquisitions. The robust trend in equity capital funding activity continued to be underpinned by companies in the industrial sector which accounted for 50 per cent of the total equity capital raised in the first ten months of 2015.
Lively conditions continued to prevail in the secondary share market. Turnover in shares on the JSE, at a daily average of R20 billion in the ten months to October 2015, was 24 per cent higher when compared with the same period of 2014, primarily boosted by higher volumes traded along with increased volatility. Having dipped earlier on, the market capitalisation of the JSE recovered to R12 trillion in October 2015, still somewhat lower than the all-time high recorded in April 2015, in line with the movements in share prices.
12 Purchases and sales by non-residents as a percentage of total purchases and sales of bonds.

59Quarterly Bulletin December 2015
QBPF07B
Acquisitions Rights issues
January–October 2014
5%
31%
42%
22%5%
13%
43%
39%
January–October 2015
Equity capital raised on the JSE by type of corporate action
Waiver of pre-emptive rightsShare incentive schemes
While strong international investor appetite resulted in a R40 billion increase in non-residents’ holdings of local shares in the first eight months of 2015, exchange-reported data showed a reversal in sentiment as non-residents were net sellers of local shares amounting to R4 billion in September and R20 billion in October 2015 – a monthly level last witnessed in October 2008. This brought cumulative net purchases of local shares by non-residents in the first ten months of 2015 to R15 billion, which was 53 per cent lower when compared with the same period of 2014. Non-residents’ participation rate
13 in the share market continued to fluctuate around an
average of approximately 19 per cent in 2014 and in the ten months to October 2015.
Share prices in most emerging-market economies displayed a positive performance in the early months of 2015, reaching all-time high levels in some countries during this period. Subsequently, share prices declined amid higher levels of volatility stirred up by significant losses in China’s share market and, amplified by the depreciation in the Chinese currency, declines in emerging-market currencies and capital outflows. As risk aversion intensified in global financial markets, the FTSE/JSE All-Share Price Index (Alsi) declined by 14 per cent from an all-time high of 55 188 index points on 24 April 2015 to a recent low of 47 631 index points on 24 August.
During September 2015, the US Federal Reserve kept interest rates unchanged as it continued to assess its inflation and economic outlook. This provided some relief to global markets and boosted global share prices. Share prices in emerging economies returned to an upward trajectory, albeit to a lesser extent in Brazil given that country’s sovereign currency rating downgrade. On the JSE, the Alsi increased to 51 608 index points at the end of November, supported by indications of possible further stimulus measures in the euro area and the lowering by China of its interest rates, among other things. The increase in the Alsi was mainly driven by the industrial and financial sectors, while the resources sector continued to record losses, partly due to weaker commodity prices.
13 Purchases and sales by non-residents as a percentage of total purchases and sales of shares.

Quarterly Bulletin December 201560
Share prices in local currencyIndices: 2 January 2009 = 100
50
100
150
200
250
300
350
2009 2010 2011 2012 2013 2014 2015
China
BrazilRussia
India
SouthAfrica
Reflecting weak economic growth and lower commodity prices, total earnings of companies listed on the JSE declined by 8 per cent in the first ten months of 2015. This decline was sharper than the softening in share prices in the latter months of 2015, raising the price-earnings ratio for all classes of shares from 16,8 in January 2015 to 19,3 in October. Dividend payments were more resilient than corporate earnings, allowing the dividend yield for JSE-listed companies to increase from 2,1 per cent in February 2015 to 2,5 per cent in October.
Market for exchange-traded derivativesThe year 2015 was dominated by drought conditions and a marked depreciation in the exchange value of the rand, which saw the domestic prices of a number of agricultural commodities soaring to record highs. Increases in the monthly average price of sunflower seed as well as white and yellow maize varieties ranged between 32 per cent and 49 per cent in the ten months to October 2015. During this period, domestic wheat prices recorded a smaller increase of 8 per cent, following lower international wheat prices due to bumper global crop levels. In continued support of local wheat production, the wheat import tariff was raised to R911 per ton in September 2015 from R511 per ton in August 2015. With domestic grain prices having risen strongly, food production costs are set to rise with subsequent food price increases likely to be passed on to the consumer.
Against the background of volatile commodity prices and uneven climatic conditions, trading activity in commodity futures and options contracts on the Commodity Derivatives Market of the JSE during the first ten months of 2015 was 23 per cent higher than in the corresponding period of 2014.

61Quarterly Bulletin December 2015
South African grain pricesRand per ton
500
1 500
2 500
3 500
4 500
5 500
6 500
7 500
2009 2010 2011 2012 2013 2014 2015
Yellowmaize
White maize
Wheat
Sunflower seed
In August 2015 the JSE launched JSE Eris Interest Rate Swap (IRS) futures, based on the Johannesburg Interbank Agreed Rate (Jibar) and denominated in South African rand. While based on the Eris methodology, the newly launched product follows the standard South African swap market conventions, offering cash flows of interest rate swaps in a capital-efficient futures form.
Trading activity in the interest rate derivatives market was 26 per cent higher in the ten months to October 2015 than in the corresponding period of 2014, while volumes traded in the currency derivatives market of the JSE remained subdued over the same period. Turnover in all derivatives traded on the JSE during the first ten months of 2015 is indicated in the table below.
Derivatives turnover on the JSE, January to October 2015
Type of derivative Value(R billions)
Change over one year(Per cent)
Equity .................................................................................................... 5 430 12
Warrants ................................................................................................ 0,5 -11
Commodity ............................................................................................ 590 42
Interest rate ........................................................................................... 640 25
Currency ................................................................................................ 464 13
Real-estate marketThe year-on-year rate of increase in nominal house prices remained at single-digit levels thus far in 2015, and ranged between 3 per cent and 7 per cent in October 2015 across the different barometers. House price increases were reasonably aligned with consumer price inflation, while interest rate levels remained relatively low in a historical context; this was balanced by lustreless economic activity with slow growth in household disposable income and employment, and sustained risk of gradually rising interest rates. However, the average time that residential properties remained on the market declined from 12,1 weeks in the second quarter of 2015 to 11,1 weeks in the third quarter – the lowest average time on the market since the third quarter of 2007.
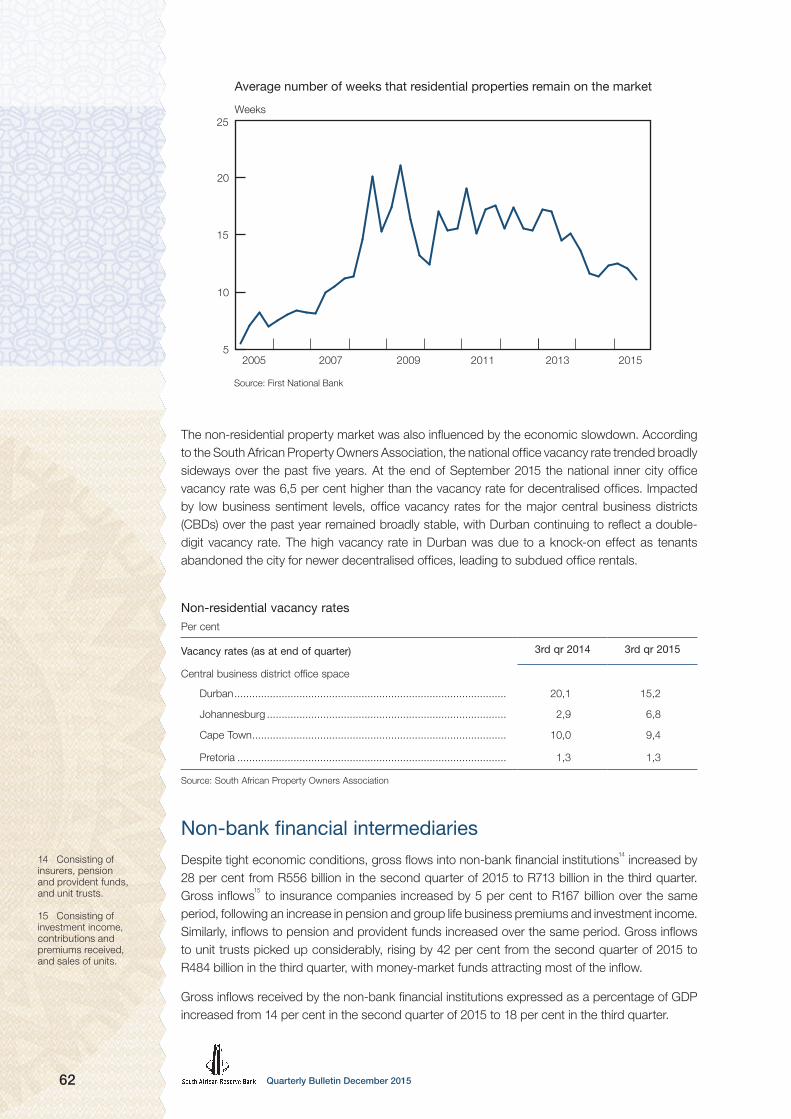
Quarterly Bulletin December 201562
5
10
15
20
25
Average number of weeks that residential properties remain on the marketWeeks
2005 2007 2009 2013 20152011
Source: First National Bank
The non-residential property market was also influenced by the economic slowdown. According to the South African Property Owners Association, the national office vacancy rate trended broadly sideways over the past five years. At the end of September 2015 the national inner city office vacancy rate was 6,5 per cent higher than the vacancy rate for decentralised offices. Impacted by low business sentiment levels, office vacancy rates for the major central business districts (CBDs) over the past year remained broadly stable, with Durban continuing to reflect a double-digit vacancy rate. The high vacancy rate in Durban was due to a knock-on effect as tenants abandoned the city for newer decentralised offices, leading to subdued office rentals.
Non-residential vacancy ratesPer cent
Vacancy rates (as at end of quarter) 3rd qr 2014 3rd qr 2015
Central business district office space
Durban ............................................................................................ 20,1 15,2
Johannesburg ................................................................................. 2,9 6,8
Cape Town ...................................................................................... 10,0 9,4
Pretoria ........................................................................................... 1,3 1,3
Source: South African Property Owners Association
Non-bank financial intermediariesDespite tight economic conditions, gross flows into non-bank financial institutions
14 increased by
28 per cent from R556 billion in the second quarter of 2015 to R713 billion in the third quarter. Gross inflows
15 to insurance companies increased by 5 per cent to R167 billion over the same
period, following an increase in pension and group life business premiums and investment income. Similarly, inflows to pension and provident funds increased over the same period. Gross inflows to unit trusts picked up considerably, rising by 42 per cent from the second quarter of 2015 to R484 billion in the third quarter, with money-market funds attracting most of the inflow.
Gross inflows received by the non-bank financial institutions expressed as a percentage of GDP increased from 14 per cent in the second quarter of 2015 to 18 per cent in the third quarter.
14 Consisting of insurers, pension and provident funds, and unit trusts.
15 Consisting of investment income, contributions and premiums received, and sales of units.
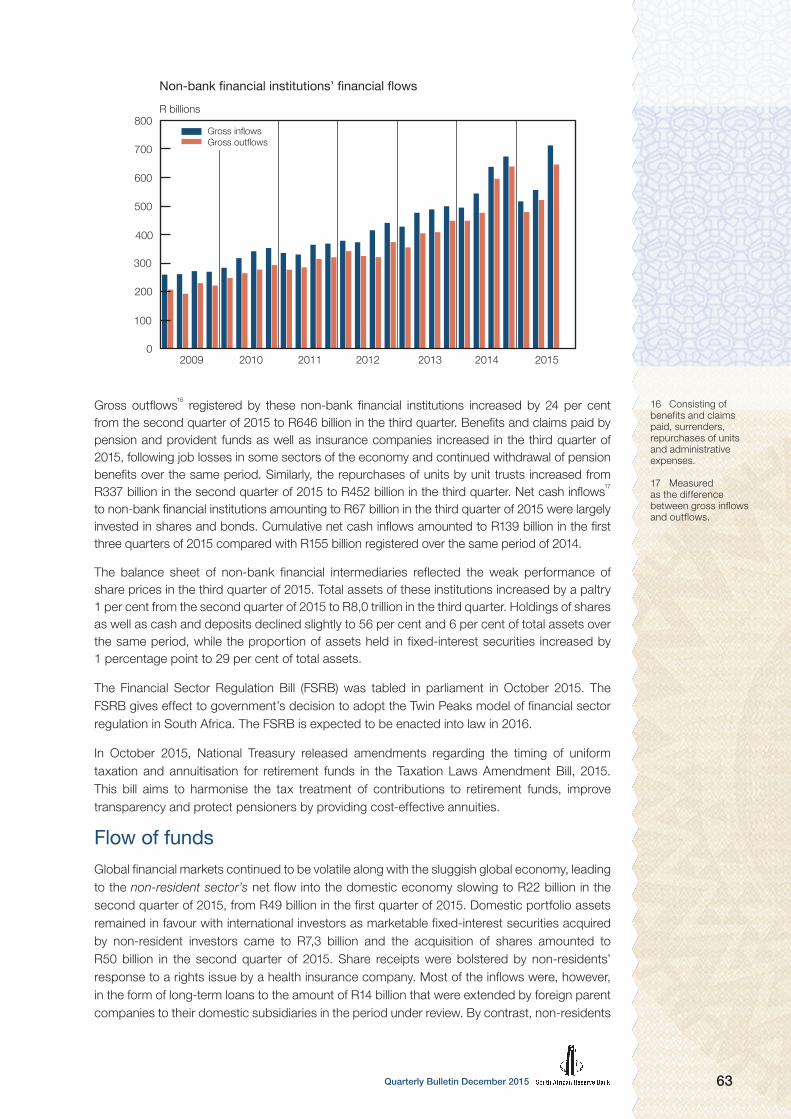
63Quarterly Bulletin December 2015
0
100
200
300
400
500
600
700
800
Non-bank financial institutions’ financial flowsR billions
2009 2010 2011 2012 2014 20152013
Gross inflowsGross outflows
Gross outflows16 registered by these non-bank financial institutions increased by 24 per cent
from the second quarter of 2015 to R646 billion in the third quarter. Benefits and claims paid by pension and provident funds as well as insurance companies increased in the third quarter of 2015, following job losses in some sectors of the economy and continued withdrawal of pension benefits over the same period. Similarly, the repurchases of units by unit trusts increased from R337 billion in the second quarter of 2015 to R452 billion in the third quarter. Net cash inflows
17
to non-bank financial institutions amounting to R67 billion in the third quarter of 2015 were largely invested in shares and bonds. Cumulative net cash inflows amounted to R139 billion in the first three quarters of 2015 compared with R155 billion registered over the same period of 2014.
The balance sheet of non-bank financial intermediaries reflected the weak performance of share prices in the third quarter of 2015. Total assets of these institutions increased by a paltry 1 per cent from the second quarter of 2015 to R8,0 trillion in the third quarter. Holdings of shares as well as cash and deposits declined slightly to 56 per cent and 6 per cent of total assets over the same period, while the proportion of assets held in fixed-interest securities increased by 1 percentage point to 29 per cent of total assets.
The Financial Sector Regulation Bill (FSRB) was tabled in parliament in October 2015. The FSRB gives effect to government’s decision to adopt the Twin Peaks model of financial sector regulation in South Africa. The FSRB is expected to be enacted into law in 2016.
In October 2015, National Treasury released amendments regarding the timing of uniform taxation and annuitisation for retirement funds in the Taxation Laws Amendment Bill, 2015. This bill aims to harmonise the tax treatment of contributions to retirement funds, improve transparency and protect pensioners by providing cost-effective annuities.
Flow of fundsGlobal financial markets continued to be volatile along with the sluggish global economy, leading to the non-resident sector’s net flow into the domestic economy slowing to R22 billion in the second quarter of 2015, from R49 billion in the first quarter of 2015. Domestic portfolio assets remained in favour with international investors as marketable fixed-interest securities acquired by non-resident investors came to R7,3 billion and the acquisition of shares amounted to R50 billion in the second quarter of 2015. Share receipts were bolstered by non-residents’ response to a rights issue by a health insurance company. Most of the inflows were, however, in the form of long-term loans to the amount of R14 billion that were extended by foreign parent companies to their domestic subsidiaries in the period under review. By contrast, non-residents
16 Consisting of benefits and claims paid, surrenders, repurchases of units and administrative expenses.
17 Measured as the difference between gross inflows and outflows.
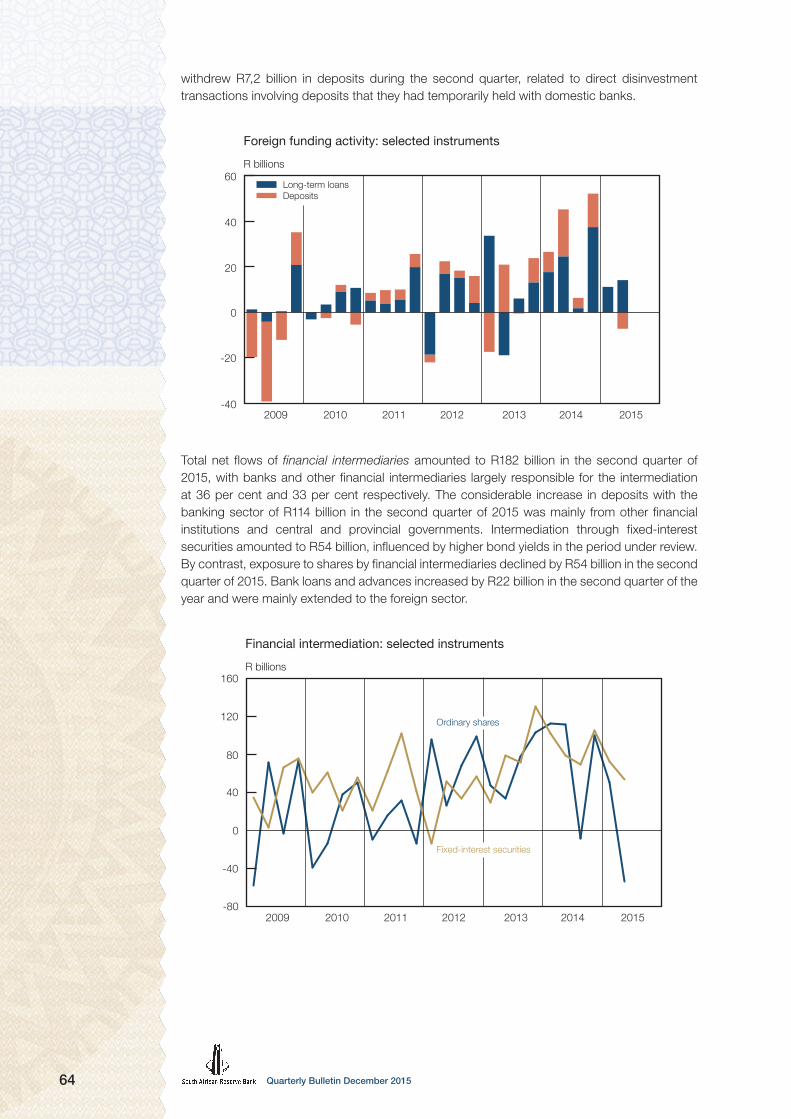
Quarterly Bulletin December 201564
withdrew R7,2 billion in deposits during the second quarter, related to direct disinvestment transactions involving deposits that they had temporarily held with domestic banks.
-40
-20
0
20
40
60
Foreign funding activity: selected instrumentsR billions
2009 2010 2011 2012 2014 20152013
Long-term loansDeposits
Total net flows of financial intermediaries amounted to R182 billion in the second quarter of 2015, with banks and other financial intermediaries largely responsible for the intermediation at 36 per cent and 33 per cent respectively. The considerable increase in deposits with the banking sector of R114 billion in the second quarter of 2015 was mainly from other financial institutions and central and provincial governments. Intermediation through fixed-interest securities amounted to R54 billion, influenced by higher bond yields in the period under review. By contrast, exposure to shares by financial intermediaries declined by R54 billion in the second quarter of 2015. Bank loans and advances increased by R22 billion in the second quarter of the year and were mainly extended to the foreign sector.
-80
-40
0
40
80
120
160
Financial intermediation: selected instrumentsR billions
2009 2010 2011 2012 2014 20152013
Fixed-interest securities
Ordinary shares

65Quarterly Bulletin December 2015
The general government sector’s deficit position resulted in R36 billion in the second quarter of 2015, from the R5,0 billion recorded in the first quarter of 2015. Capital spending by general government amounted to R33 billion in the second quarter of 2015, concentrated mostly in energy, water, transport and education. In the second quarter of 2015, long-term government bonds amounting to R45 billion were issued in the capital market to finance government’s shortfall, which were mostly acquired by insurers and retirement funds.
The non-financial corporate business enterprises recorded a financial deficit of R54 billion in the second quarter of 2015. The pace of capital spending by private non-financial business enterprises, which comprises 57 per cent of total gross capital formation, increased moderately to R122 billion in the second quarter of 2015, consistent with subdued business confidence levels. An important contributor was the commencement of construction of a further renewable energy plant in the second quarter of 2015. Gross capital formation by public non-financial business enterprises amounted to R37 billion in both the first and second quarters of 2015. Eskom and the Umgeni Water Board stepped up their capital expenditure on construction works and on machinery and equipment relating to ongoing projects. This capital expansion for non-financial business enterprises was financed through the incurrence of long-term loans, mortgage loans, and bank loans and advances to an aggregate amount of R43 billion. Over the same period, non-financial business enterprises increased their holdings of cash and deposits by R2,8 billion.
The household sector recorded a surplus position of R33 billion in the second quarter of 2015. Credit extended to household sector remained subdued as the R38 billion in the first quarter of 2015 reverted to net repayments of R16 billion recorded in the second quarter. The slowdown in credit demand reflected caution by households which was exacerbated by recent interest rate increases, relatively tight lending conditions, the lacklustre economy, job losses and high levels of consumer debt. Over the same period households increased their deposit holdings by R37 billion, which was 65 per cent higher than in the first quarter of 2015.

Quarterly Bulletin December 201566
Public finance18
Non-financial public-sector borrowing requirement19
In the July–September quarter of 2015, the non-financial public-sector borrowing requirement amounted to R54,8 billion, bringing the total borrowing requirement to R130 billion in the first half of fiscal 2015/16. This was R5,4 billion higher than the borrowing requirement recorded in the first six months of fiscal 2014/15. The widening of the non-financial public-sector borrowing requirement resulted mainly from higher cash deficits recorded by national government and the non-financial public enterprises and corporations. The higher cash deficit by national government was the result of higher grant transfers to other levels of general government, principally the provincial governments. All other levels of general government recorded cash surpluses during the period under review.
Non-financial public-sector borrowing requirement
R billions
Level of government Apr–Sep 2014* Apr–Sep 2015*
Consolidated general government ......................................................... 92,4 96,1
National government.......................................................................... 109,3 119,9
Extra-budgetary institutions ............................................................... -5,8 -6,5
Social security funds .......................................................................... -7,9 -7,8
Provincial governments ...................................................................... -12,4 -9,1
Local governments ............................................................................ 9,2 -0,4
Non-financial public enterprises and corporations ................................. 32,0 33,7
Total** ................................................................................................... 124,4 ** 129,8 **
As percentage of gross domestic product ......................................... 6,5 6,5
* Deficit + surplus –** Components may not add up to totals due to rounding
As a percentage of GDP, the non-financial public-sector borrowing requirement remained broadly unchanged at 6,5 per cent in the first two quarters of fiscal 2015/16. On a quarterly and seasonally adjusted basis the borrowing requirement narrowed from 7,6 per cent of GDP in April–June 2015 to 5,5 per cent in July–September 2015.
The borrowing requirement of the consolidated general government amounted to R96,1 billion in April–September 2015, or R3,7 billion more than in the same period a year earlier. As a ratio of GDP, the consolidated general government borrowing requirement amounted to 4,8 per cent in the first six months of fiscal 2015/16, compared with 4,9 per cent recorded in the same period of the previous fiscal year.
The non-financial public enterprises and corporations recorded a preliminary cash deficit of R33,7 billion in the first two quarters of fiscal 2015/16 – R1,7 billion higher when compared with the cash deficit recorded in the same period a year earlier. The widening of the cash deficit was on account of higher growth in expenditure relative to revenue. Growth in expenditure was on account of high operational costs recorded by the major state-owned companies, in particular Transnet and Eskom.
18 In this section, unless stated otherwise, year-on-year rates of increase compare fiscal 2015/16 to fiscal 2014/15.
19 Calculated as the cash deficit/surplus of the consolidated central, provincial and local governments, and non-financial public enterprises and corporations.

67Quarterly Bulletin December 2015
Non-financial public-sector borrowing requirement
R billions Per cent
Fiscal years
Consolidated general government Non-financial public enterprises and corporations Percentage of gross domestic product (right-hand scale)
* April–September 2015, annualised
2015/16*2014/152013/142012/132011/122010/110
50
100
150
200
250
300
0
2
4
6
8
10
Preliminary estimates indicated that net investment in non-financial assets by these public enterprises and corporations amounted to R57,9 billion in the first two quarters of fiscal 2015/16. This was R0,4 billion less than the investment spending recorded in the same period a year earlier. The 2015 Medium Term Budget Policy Statement (MTBPS) signalled government’s continued support towards expanding the country’s economic infrastructure network. Cumulative infrastructure-related spending by government has amounted to R651 billion since fiscal 2009/10 and is anticipated to continue growing, but not as rapidly as in the past, with focus shifting to improving value for money in infrastructure delivery and to refurbishing ageing infrastructure.
Finances of non-financial public enterprises and corporations
R billions
Fiscal years
* April–September 2015, annualised
2015/16*2014/152013/142012/132011/122010/110
100
200
300
400
500
Deficit
Net investment in non-financial assets
Expenditure
Revenue
Cash payments for operating activities

Quarterly Bulletin December 201568
Non-financial public enterprises and corporations participated in the bond market and recorded net redemptions of R1,0 billion in the second quarter of fiscal 2015/16, with the South African National Roads Agency Limited (SANRAL) contributing the lion’s share of the redemptions. The total outstanding value of domestic marketable bonds amounted to R233 billion as at the end of September 2015. Eskom, Transnet and SANRAL – the major state-owned companies – remained the largest participants in the parastatal bond market, accounting for 87,1 per cent of the total bonds in issue.
An analysis of national government finance statistics indicated that cash receipts from operating activities amounted to R511 billion in the first two quarters of fiscal 2015/16. This was 10,4 per cent more than in the same period of the previous fiscal year. National government revenue increased due to higher receipts in all the major tax categories alongside a sharp acceleration in non-tax revenue.
Cash payments for operating activities amounted to R623 billion in the first six months of the current fiscal year, representing a year-on-year rate of increase of 10,3 per cent. During the period under review, compensation of employees totalled R65,3 billion – some 9,1 per cent more than a year earlier. Grants to other levels of general government recorded an increase of 8,2 per cent year on year and contributed 54,8 per cent to total expenses.
Net cash flow from national government’s operating activities, along with net investment in non-financial assets, resulted in a cash deficit of R120 billion in April–September 2015. This cash deficit could be compared with a cash deficit of R109 billion recorded in the first half of fiscal 2014/15.
During ApriI–September 2015, provincial governments’ financial activities resulted in a cash surplus of R9,1 billion. This surplus was R3,3 billion lower than the cash surplus recorded in the same period of 2014. The Budget Review 2015 projected that provincial governments would record a cash surplus of R0,2 billion for fiscal 2015/16 as a whole.
Total provincial government cash receipts from operating activities amounted to R244 billion in the first six months of fiscal 2015/16, representing a year-on-year rate of increase of 5,4 per cent. Growth in provincial cash receipts was predominantly buoyed by grants from national government. These grants – equitable share and conditional grants – increased at a year-on-year rate of 5,5 per cent to amount to R237 billion during the period under discussion. In the 2015 MTBPS the equitable share for fiscal 2015/16 was revised upward by R3,8 billion to amount to R387 billion, thereby funding the shortfall in compensation of employees related to the higher-than-budgeted salary increase for public servants.
During the period under review, cash payments for operating activities alongside net investment in non-financial assets totalled R235 billion, or 7,2 per cent more than in April–September 2014. Growth in expenditure was mainly driven by a 5,2 per cent increase in compensation of provincial government employees in the first half of fiscal 2015/16, notwithstanding the transfer of some 37 000 staff members from provincial to national government as reporting lines for a number of training colleges were changed. Personnel spending on educators and health practitioners amounted to R124 billion in the first six months of fiscal 2015/16. These two functional sectors contributed 86,6 per cent of total compensation of employees in the period under discussion.
Provincial governments’ deposits with the Corporation for Public Deposits increased from R21,3 billion at the end of March 2015 to R24,5 billion at the end of September 2015. Their deposits with private banks increased from R10,8 billion to R17,4 billion over the same period, while their overall indebtedness to banks increased slightly from R0,4 billion at the end of March 2015 to R0,5 billion at the end of September 2015.

69Quarterly Bulletin December 2015
Preliminary statistics of local government indicated a cash surplus of R0,4 billion in the first half of fiscal 2015/16 compared with a cash deficit of R9,2 billion in the same period a year earlier. The turnaround resulted from a brisk increase in total revenue which outpaced the increase in total expenditure.
Cash receipts from operating activities amounted to R157 billion in the first two quarters of fiscal 2015/16, recording an increase of 11,8 per cent year on year. Strong increases in inter-governmental transfers and sales of goods and services – the latter being the main source of revenue for municipalities – contributed to the rise in total revenue. Sales of water, electricity and gas increased by 8,7 per cent year on year.
In April–September 2015, cash payments for operating activities rose by 6,6 per cent year on year to amount to R131 billion. Purchases of goods and services, the main component of cash payments, amounted to R86,7 billion – an increase of 7,3 per cent compared with the first half of fiscal 2014/15. In the first two quarters of fiscal 2015/16, net investment in non-financial assets amounted to R26,2 billion – some 3,9 per cent less than in the same period a year earlier.
Preliminary data of total extra-budgetary institutions which includes tertiary education institutions indicated a cash surplus of R6,5 billion in the first two quarters of fiscal 2015/16 – moderately higher than the cash surplus of R5,8 billion recorded in the same period a year earlier. The increase in the cash surplus could be attributed to an increase in the grants of other extra-budgetary institutions received from national government.
Social security funds recorded a preliminary cash surplus of R7,8 billion in the period April–September 2015. This was R0,1 billion lower than the cash surplus recorded in the same period of the previous fiscal year. The Budget Review 2015 projected that this level of government would record a cash surplus of R11,6 billion in fiscal 2015/16 as a whole.
Budget comparable analysis of national government financeThe originally budgeted revenue and expenditure were symmetrically raised in a deficit neutral manner in July 2015 when national government, through the Department of Telecommunications and Postal Services, sold a 13,9 per cent stake in Vodacom to the Public Investment Corporation (PIC), representing the Government Employees Pension Fund (GEPF). The proceeds amounting to R25 billion would, on a one-time basis, increase national revenue (other) during the fiscal year but would also go through expenditure as special transfers: Eskom would receive R23 billion as capital injection, while R2 billion would fund South Africa’s paid-in capital contribution to the New Development Bank, also loosely referred to as the BRICS Bank. Some R12,6 billion of the Vodacom proceeds was received on 31 July, of which some R10 billion was immediately transferred to Eskom on the same day.
In the first half of fiscal 2015/16, national government revenue fell short of budgeted projections, while expenditure met budgeted expectations; the result was a marginally higher cash-book deficit.
National government expenditure amounted to R607 billion in the first six months of fiscal 2015/16, representing a year-on-year rate of increase of 10,0 per cent. As a ratio of GDP, national government expenditure amounted to 30,4 per cent during the period under review, compared with an expenditure ratio of 29 per cent recorded a year earlier. According to the Budget Review 2015 released in February, national government expenditure would increase by 8 per cent year on year to total R1 222 billion in the current fiscal year. In light of the extraordinary capital receipts of R25 billion from the sale of equity in Vodacom, the originally budgeted revenue was subsequently increased. In the 2015 Medium Term Budget Policy Statement (MTBPS), expenditure in 2015/16 was projected to total R1 247 billion, impacted by the capital contributions to Eskom and the New Development Bank referred to above.

Quarterly Bulletin December 201570
National government expenditure in fiscal 2015/16
Expenditure item
Originally budgeted:full 2015/16
Actual:Apr–Sep 2015
R billions Percentage change* R billions Percentage
change
Voted amounts ................................................... 702,5 12,2 339,8 12,3
Current payments ........................................... 194,6 9,2 92,0 9,6
Transfers and subsidies .................................. 464,8 8,5 231,9 9,0
Payments for capital assets ............................ 16,7 4,6 4,7 2,9
Payments for financial assets** ...................... 26,4 647,9 11,1 944,6
Statutory amounts*** .......................................... 542,8 7,3 267,0 7,1
Of which: Interest on debt ............................... 126,3 10,1 62,6 10,8
Total expenditure ............................................... 1 245,3 10,0 606,8 10,0
* Fiscal 2014/15 to fiscal 2015/16. Note that figures might differ from previous editions of the Quarterly Bulletin due to the audited outcome of fiscal 2014/15
** Include capital transfers to Eskom and the New Development Bank*** Include extraordinary payments
As shown in the accompanying table, the increase in voted expenditure in the first half of 2015/16 was closely aligned with the budget for the full year. The significant increase recorded in payments for financial assets was as a result of the transfer to Eskom.
Current payments recorded an increase of 9,6 per cent, slightly above the yearly budgeted projection for this spending category. The Justice, Crime Prevention and Security cluster represented 72,9 per cent of total current payments by national government.
Transfers and subsidies also recorded a robust increase, slightly above the budgeted projection. Higher transfers and subsidies emanated from the departments responsible for the delivery of education, health and social services, mainly via provincial governments. These departments all form part of the Social Services cluster, which contributed 53,1 per cent to total transfers and subsidies. The Department of Higher Education transferred R20,4 billion to tertiary education institutions during April–September 2015. Transfers and subsidies were also elevated through the expenditure of the departments of Transport, Human Settlements, and Cooperative Governance and Traditional Affairs. An equitable share grant of R20,9 billion was transferred to local government in July 2015 by the Department of Cooperative Governance and Traditional Affairs.
Box 4 Financing of tertiary education
Widespread disruptions at tertiary education institutions in the country most recently in support of lower student fees have focused attention on the financing of tertiary education and trends in tertiary education costs.
In terms of the Higher Education Laws Amendment Act 26 of 2010 and individual institutional statutes, the mandate of approving tuition fee increases resides with the Council of a tertiary education institution. In order for a higher education institution to formulate and develop a proposal on fee increases to be submitted to its Council, an appropriate internal consultation process normally takes place. Tuition fee increments should be congruent with the goals and strategic plans of the specific institution towards ensuring financial sustainability.
Tertiary education institutions take into account all relevant internal and external conditions, challenges and cost pressures in arriving at an appropriate tuition fee. Factors which are generally considered in arriving at an appropriate fee may include: total cost of staff employment; maintenance of buildings and equipment with consideration of its replacement cycle; undergraduate and postgraduate financial aid commitments; capital expenditure programmes; the need for support programmes; municipal rates (electricity, sewerage, refuse removal and water); library acquisitions; professional registration requirements; competitor behaviour; cleaning services; campus development plans; teaching ratios; the availability of financial assistance, be it from government grants or private sources; security services costs; and extraordinary expenses.

71Quarterly Bulletin December 2015
Government assistance is an important factor in the financing of tertiary education and therefore in deciding on tuition fees. Of the three financing pillars of tertiary education – government grants, student fees and private sources – government grants constitute the largest single component, as depicted in the accompanying graph.
1
Revenue of tertiary education institutions
R billions
Calendar years
0
10
20
30
40
50
60
70
20142013201220112010
Grants University fees Other revenue
In 2014 government grants to tertiary education institutions amounted to R25 billion, or 5 per cent of total consolidated general government expenditure, and constituted 42 per cent of these institutions’ total revenue. The financial contribution from national government towards tertiary education is divided into a so-called block grant and an earmarked grant. Tertiary education institutions generally have the leeway to allocate block funds as they see fit, while earmarked grants have to be utilised for specific expenditures related to infrastructure, training and the National Students Funding Aid Scheme (NSFAS), among others. The block grant forms the largest part of government’s contribution to tertiary education at around 81 per cent of the total most recently, with the NSFAS component having grown to 14 per cent and other earmarked funds accounting for the remaining 5 per cent.
University fees in 2014 constituted approximately 32 per cent of the total revenue of higher education institutions. With the increase in fees capped, tertiary education institutions would obviously become more reliant on government grants and private sources.
On the expenditure side, higher education institutions spend approximately half of their total outlays on compensation of employees, as shown in the graph on the next page. Purchases of goods and services constituted a further 35 per cent of the total in 2014, and net investment in non-financial assets (capital spending) approximately 10 per cent. Capital spending stagnated from 2011 to 2013, but was stepped up in 2014.
Tertiary education fees carry a weight of 1,23 per cent in the headline consumer price index (CPI) as compiled by Statistics South Africa.
22 The statistics on tertiary education fees are collected in March
each year from state-funded and private tertiary institutions within the CPI collection areas by means of a postal and e-mail collection process, and include the fees attached to the top ten subjects or degrees, based on the frequency of registered students.
1 While these aggregate statistics provide a high-level overview of the finances of the tertiary education institutions, circumstances vary considerably from institution to institution
2 Pre-primary and primary education, secondary education and tertiary education respectively comprise 0,98 per cent, 0,74 per cent and 1,23 per cent of the total index. In addition, the category for university boarding fees with a weight of 0,06 per cent is included under the restaurants and hotels category in the CPI.

Quarterly Bulletin December 201572
Expenditure by tertiary education institutions
R billions
Calendar years
201420132012201120100
10
20
30
40
50
60 Net investment in non-financial assets Purchase of goods and services Compensation of employees
As indicated in the accompanying graph, inflation in tertiary education services costs has far exceeded that in the general level of consumer goods and services prices as measured by the Headline CPI. In fact, tertiary education fees on average have increased by as much as 9,0 per cent per annum over the period from January 2010 to October 2015, whereas overall consumer prices have risen by 5,6 per cent per annum over the same period. The gap between headline CPI inflation and tertiary education services cost inflation became most acute during the past year as tertiary education services cost inflation accelerated further. However, fee increases are likely to be close to zero in 2016.
Headline consumer and tertiary education services price inflation
Percentage change over twelve months
Headline consumer prices
Consumer prices: tertiary education services
2010 2011 2012 2013 2014 20153
4
5
6
7
8
9
10
It is desirable for tertiary education institutions to constantly improve the quality of education services rendered to remain internationally competitive. This drive, however, comes at a cost and impacts on tertiary education fees; difficult trade-offs have to be faced.
In summary, rampant increases in tertiary education costs, as brought to the fore by recent student protests, would remain high on the agenda of policymakers as new and innovative ways would have to be found to contain these cost increases. Additional revenue sources would also need to be developed to continue financing a reputable tertiary education system in the country.

73Quarterly Bulletin December 2015
In the first two quarters of fiscal 2015/16, payments for capital assets recorded a marginal increase. The largest budgeted portion of payments for capital assets relates to the Department of Water and Sanitation and involves bulk water infrastructure projects. These projects are being delayed due to supply chain management constraints, the quality of service providers and municipal backlogs. The Budget Review 2015 forecast that this spending category would increase by 4,6 per cent year on year and amount to R16,7 billion in the current fiscal year.
Payments for financial assets accelerated sharply in April–September 2015 when compared with the first two quarters of the previous fiscal year. This expenditure item consists of the recapitalisation of state-owned companies for balance-sheet strengthening. As indicated previously, the significant increase in this spending item could mostly be attributed to the transfer of R10 billion to Eskom in July 2015 – the first tranche of the R23 billion that government committed to transfer to Eskom in the current fiscal year.
Interest paid on national government debt totalled R63 billion in the first six months of fiscal 2015/16, or 10,8 per cent more than in the preceding fiscal year. Interest expenditure was originally budgeted to increase by 10,1 per cent year on year to total R126 billion in fiscal 2015/16.
During April–September 2015, equitable share transfers to provinces amounted to R191 billion, some 5,6 per cent more than in the first six months of the previous fiscal year. Equitable share transfers were estimated to total R383 billion in fiscal 2015/16. The Budget Review 2015 made provision for R10,7 billion to be paid from the National Revenue Fund to metropolitan municipalities as their share of the general fuel levy. The first payment of R3,6 billion was paid in August 2015, with the second payment expected in December.
After taking into account cash-flow adjustments,20
the cash-flow expenditure of national government equalled R594 billion, representing a year-on-year rate of increase of 9,7 per cent. Cash-flow adjustments consist of surrenders, outstanding transfers, revaluation of inflation-linked bonds and amortised discount.
National government revenue amounted to R483 billion21 in the first half of fiscal 2015/16, or
11,6 per cent more than in April–September 2014. Revenue collections increased on account of higher receipts in all the major tax categories alongside a steep increase recorded in non-tax revenue.
National government revenue in fiscal 2015/16
Revenue source
Originally budgeted: full 2015/16
Actual:Apr–Sep 2015
R billions Percentage change* R billions Percentage
change*
Taxes on income, profits and capital gains ......... 620,9 10,5 280,5 9,7
Income tax on individuals ................................ 394,7 11,5 180,0 14,1
Income tax on companies ............................... 203,7 9,2 88,9 0,7
Payroll taxes ....................................................... 14,7 4,7 7,3 14,7
Taxes on property ............................................... 13,7 9,8 7,2 21,1
Taxes on goods and services ............................. 389,2 9,2 172,9 7,3
Value-added tax (VAT) ..................................... 283,8 8,6 124,8 6,4
Domestic VAT ............................................. 314,0 9,4 145,9 4,0
Import VAT .................................................. 140,0 2,5 64,9 10,2
Taxes on international trade and transactions ..... 42,6 2,7 19,3 11,1
Import duties .................................................. 41,7 2,4 19,0 11,8
Other revenue** .................................................. 42,3 170,9 21,3 77,1
Less: SACU*** payments .................................... 51,0 -1,4 25,9 -0,1
Total revenue ..................................................... 1 072,3 12,9 482,6 11,6
* Fiscal 2014/15 to fiscal 2015/16. Note that figures might differ from previous editions of the Quarterly Bulletin due to the audited outcome for fiscal 2014/15 becoming available
** Including extraordinary receipts, but excluding premiums of R3,0 billion on debt portfolio restructuring and loan transactions
*** Southern African Customs Union
20 Adjustments arising from timing differences between the recording of transactions and bank clearances, along with late departmental requests for funds.
21 In the calculation by the Bank, revenue excludes premiums on debt portfolio restructuring and loan transactions (R3,0 billion in April–September 2015).

Quarterly Bulletin December 201574
According to the Budget Review 2015, national government revenue was expected to increase by 10,5 per cent year on year to total R1 049 billion in fiscal 2015/16. However, the budgeted amount for revenue of national government was revised upwards by R23 billion in July 2015 due to the sale of state-owned financial assets.
National government revenue was thus revised upwards to R1 072 billion in fiscal 2015/16, representing a year-on-year rate of increase of 12,9 per cent. In the 2015 MTBPS, national government revenue was revised slightly downwards to amount to R1 071 billion in the current fiscal year. Relative to GDP, national government revenue reached 24,1 per cent in the first two quarters of fiscal 2015/16 – higher than the 22,8 per cent recorded a year earlier.
Although taxes on income, profits and capital gains increased firmly in the first half of 2015/16, it still fell short of the yearly budgeted rate of increase. The sharp increase in personal income tax and withholding tax on dividends was unsupported by the stagnating growth in corporate income tax receipts. Solid collections in personal income tax resulted from higher pay-as-you-earn receipts. The impact of retrenchments in the mining, manufacturing and retail sectors may however pose a risk to pay-as-you-earn receipts going forward. Corporate income tax collections remained sluggish, owing to lower provisional payments from the mining and manufacturing sectors due to low global demand and contracting of commodity prices, particularly from China. Withholding tax on dividends continued to grow as companies returned their profits to shareholders in an environment of subdued business confidence, which dampened reinvestment activity.
Corporate income tax collections and gross domestic product
Percentage change over one year
Fiscal years
* April–September 2015
Corporate income tax collections
Gross domestic product
2015/16*2014/152013/142012/132011/122010/112009/10-20
-15
-10
-5
0
5
10
15
20
Higher proceeds from taxes on property stemmed from a substantial year-on-year rate of increase of 33,5 per cent recorded in securities transfer tax, together with a solid rise recorded in transfer duties. Buoyant receipts in securities transfer tax mirrored the strong turnover in the capital market.
Taxes on goods and services fell below yearly budgeted expectations, mainly owing to the lustreless performance of value-added tax (VAT). Although domestic VAT collections improved during August–September 2015, it still fell far below the yearly budgeted projections due to a contraction in the manufacturing and the wholesale and retail trade sectors. Weak consumer and business confidence alongside an upward phase in interest rates suggest subdued

75Quarterly Bulletin December 2015
prospects for domestic VAT collections for the remainder of the year. On the upside, the strong increase in import VAT countered the low increase in domestic VAT collections to some extent.
Taxes on international trade and transactions recorded a robust increase of 11,1 per cent year on year, as import duties increased due to the weaker exchange rate, alongside an increase in tariffs on a number of products.
Cumulative deficit of national government
R billions
MFJDNOSAJJMA
2014/15
2015/16
0
40
80
120
160
200
Originally budgeted deficit for fiscal 2015/16 Revised budget deficit, Medium Term Budget Policy Statement, October 2015
R173 billionR176 billion
In April–September 2015, the net result of national government revenue and expenditure was a cash-book deficit of R124 billion – some R5,0 billion more than the cash-book deficit recorded in the previous fiscal year. As a share of GDP, the cash-book deficit reached 6,2 per cent during the period under discussion – slightly lower than the deficit recorded in the preceding fiscal year. The larger cash-book deficit resulted from the higher level of national government expenditure, which surpassed revenue collections.
The Budget Review 2015 projected a cash-book deficit of R173 billion in fiscal 2015/16, equal to 4,1 per cent of GDP. Revenue and expenditure were revised upwards by the same amount of R23,0 billion, thus leaving the cash-book deficit unchanged. However, in the 2015 MTBPS the deficit for the full fiscal year was revised slightly upwards to R176 billion, or 4,3 per cent of GDP.
The primary balance22
reached a deficit of R61,5 billion in April–September 2015, or 3,1 per cent as a proportion of GDP. This can be measured against a primary deficit of R62,7 billion, or 3,3 per cent as a ratio of GDP, recorded in the corresponding period of the previous fiscal year. The primary balance provides an indicator of current fiscal effort, since interest payments are predetermined by the size of previous deficits.
During the first two quarters of fiscal 2015/16, the cash-flow deficit of national government amounted to R105 billion – some R1,8 billion less than the cash-flow deficit recorded in the first six months of fiscal 2014/15. The considerable difference between the cash-book deficit and the cash-flow deficit stemmed from outstanding transfers worth R14,5 billion recorded in the period under discussion. The net borrowing requirement of national government decreased by R6,0 billion to R106 billion in the first two quarters of fiscal 2015/16 as no large cost on revaluation of foreign debt at redemption occurred, as had been the case in June 2014 when it amounted to R4,8 billion.
22 The deficit/surplus recalculated by excluding interest payments from total expenditure.

Quarterly Bulletin December 201576
National government financing in fiscal 2015/16
R billions
Item or instrumentOriginally budgeted:
full 2015/161
Actual:Apr–Sep 2015
Actual:Apr–Sep 2014
Deficit2 ...................................................................... 173,1 105,0
3106,8
3
Plus: Cost/profit on revaluation of foreign debt at redemption4 ............................................................... 1,4 0,6 4,8
Net borrowing requirement ...................................... 174,4 105,6 111,6
Treasury bills .............................................................. 13,0 32,1 28,8
Domestic government bonds .................................... 144,8 52,2 62,1
Foreign bonds and loans ........................................... 9,2 -1,2 15,1
Change in available cash balances5 ........................... 7,4 22,6 5,6
Total net financing6 ................................................... 174,4 105,6 111,6
1. Budget Review 20152. Including extraordinary receipts and payments3. Cash-flow deficit. (This differs substantially from the cash-book deficit)4. Cost + profit –5. Increase – decrease +6. Components may not add up to totals due to rounding
National government planned to raise R13 billion from Treasury bills and R145 billion from domestic long-term government bonds in fiscal 2015/16. Higher issuances of domestic government bonds enabled government to finance the net borrowing requirement. Given South Africa’s deep and liquid capital market, appetite for domestic debt instruments remained satisfactory. Government would also continue to participate in the global capital markets to maintain benchmarks in major currencies and to meet part of its foreign-currency commitments.
In the first six months of fiscal 2015/16, national government raised R29,1 billion from inflation-linked bonds. The outstanding balance on inflation-linked bonds amounted to R388 billion at the end of September 2015, having risen from zero at the time of its inception in March 2000. These bonds now account for 26,2 per cent of total domestic marketable bonds. Net redemptions to the value of R0,3 billion were recorded in RSA Government Retail Savings Bonds in the first half of the current fiscal year. Redemptions of these instruments have surpassed the issuances thereof since August 2012, largely due to scheduled redemptions on retail bonds.
Fixed-income, floating-rate and zero-coupon bonds Domestic short-term loans including Treasury bills
As at 30 September 2010
0,8% 0,5%
17,4%
19,0% 62,7%
14,7%
22,2%62,6%
As at 30 September 2015
Domestic debt
Inflation-linked bonds
Retail bonds and other debt
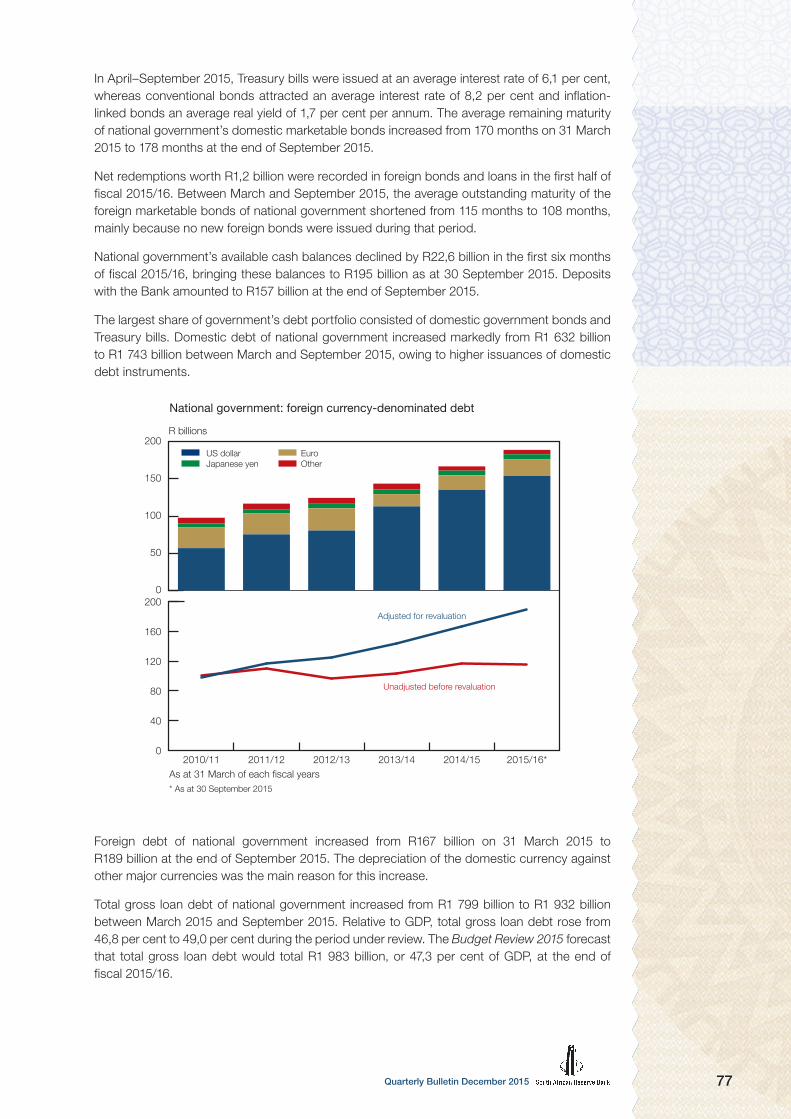
77Quarterly Bulletin December 2015
In April–September 2015, Treasury bills were issued at an average interest rate of 6,1 per cent, whereas conventional bonds attracted an average interest rate of 8,2 per cent and inflation-linked bonds an average real yield of 1,7 per cent per annum. The average remaining maturity of national government’s domestic marketable bonds increased from 170 months on 31 March 2015 to 178 months at the end of September 2015.
Net redemptions worth R1,2 billion were recorded in foreign bonds and loans in the first half of fiscal 2015/16. Between March and September 2015, the average outstanding maturity of the foreign marketable bonds of national government shortened from 115 months to 108 months, mainly because no new foreign bonds were issued during that period.
National government’s available cash balances declined by R22,6 billion in the first six months of fiscal 2015/16, bringing these balances to R195 billion as at 30 September 2015. Deposits with the Bank amounted to R157 billion at the end of September 2015.
The largest share of government’s debt portfolio consisted of domestic government bonds and Treasury bills. Domestic debt of national government increased markedly from R1 632 billion to R1 743 billion between March and September 2015, owing to higher issuances of domestic debt instruments.
R billions
National government: foreign currency-denominated debt
0
50
100
150
200
0
40
80
120
160
200
2015/16*2014/152013/142012/132011/122010/11
Adjusted for revaluation
Unadjusted before revaluation
As at 31 March of each fiscal years* As at 30 September 2015
US dollar Japanese yen
EuroOther
Foreign debt of national government increased from R167 billion on 31 March 2015 to R189 billion at the end of September 2015. The depreciation of the domestic currency against other major currencies was the main reason for this increase.
Total gross loan debt of national government increased from R1 799 billion to R1 932 billion between March 2015 and September 2015. Relative to GDP, total gross loan debt rose from 46,8 per cent to 49,0 per cent during the period under review. The Budget Review 2015 forecast that total gross loan debt would total R1 983 billion, or 47,3 per cent of GDP, at the end of fiscal 2015/16.

Quarterly Bulletin December 201578
The 2015 Medium Term Budget Policy Statement
Fiscal policy stance
The Minister of Finance presented his second MTBPS to Parliament on 21 October 2015, building on the previous year’s MTBPS which signalled a shift in fiscal policy to safeguard sustainability. Spending limits were reduced and tax rates adjusted to stabilise the growth of public debt. The 2015 MTBPS continues with the commitments made in 2014 to stabilise debt levels and improve the effectiveness of spending.
The world economy is experiencing a lengthy period of low growth marked by slower global trade, volatile capital flows, weak commodity prices and heightened geopolitical tensions. All developing countries face this difficult environment with their own unique circumstances. The South African government has taken two crucial steps to adapt to this low-growth world. Firstly, it has identified the broad structural reforms needed to put the economy on a much higher growth path and secondly, it has also reduced the country’s vulnerability by implementing fiscal policy measures to maintain the health of the public finances.
South Africa remains a society marked by high levels of long-term unemployment, widespread poverty and extreme inequality. To address these, creating work and improving education to eliminate poverty and build a more equitable society are at the heart of the long-term reforms set out in the National Development Plan (NDP).
A large commitment of resources to support social progress and economic change has been prioritised over the medium-term period. Although there was little room for new spending priorities over the medium-term period, government nevertheless proposed to allocate additional resources to core areas of need, including projects that address urgent social priorities. Of concern is that the quantity of public expenditure is frequently let down by the quality of spending. Government was intensifying its efforts to improve value received for money spent. All South Africans could support this goal by highlighting waste, inefficiency and corruption wherever these arise.
Given the global and domestic outlook, the fiscal resources required to sustain development would become increasingly strained unless government and the private sector work together to restore the momentum of economic growth. Government is acting to alleviate the most binding constraint to growth – inadequate electricity supply – and has set out a series of urgent economic reforms to build a more competitive economy. These include:
– continuing to invest in economic infrastructure, especially in the transport, logistics and energy sectors;
– reforming the governance of state-owned entities, rationalising state holdings and encouraging private-sector participation;
– effecting labour-market reforms that can help avoid protracted strikes;
– expanding the independent power producer programme;
– encouraging affordable, reliable and accessible broadband;
– promoting black ownership of productive industrial assets;
– finalising amendments to the Mineral and Petroleum Resources Development Act, 2002, and continuing dialogue with the industry; and
– reviewing business incentive programmes in all economic sectors to ensure that resources support labour-intensive, job-creating outcomes.
The macroeconomic approach of the NDP includes sustaining high levels of public investment, increasing private investment and reducing consumption.
Changes to the macroeconomic outlook contained in the MTBPS 2015 are summarised in the accompanying table. Real GDP was projected to grow by 1,5 per cent in 2015, lower than

79Quarterly Bulletin December 2015
the 2,0 per cent estimated in the February 2015 Budget, with growth picking up to reach 2,8 per cent in 2018. Electricity supply would remain a binding constraint through 2016, limiting output and dampening business and consumer confidence. Easing electricity, transport and telecommunications infrastructure constraints, alongside improved confidence and higher demand from major trading partners, were expected to boost GDP growth by 2018.
Macroeconomic projections
Percentage change
Variable2015 2016 2017 2018
Feb* Oct** Feb* Oct** Feb* Oct** Feb* Oct**
Real gross domestic product 2,0 1,5 2,4 1,7 3,0 2,6 … 2,8
Consumer prices .................. 4,3 4,8 5,9 6,2 5,7 5,9 … 5,8
* Budget Review 2015** Medium Term Budget Policy Statement, October 2015
Consumer price inflation has been moderately higher than the 2015 Budget forecasts. Upward pressure on food prices, additional exchange rate depreciation and electricity price increases could, inter alia, pose upside risks to the inflation outlook.
Fiscal projections
Percentage of gross domestic product
Component2015/16 2016/17 2017/18 2018/19
Feb* Oct** Feb* Oct** Feb* Oct** Feb* Oct**
National government
Revenue ........................... 25,0 26,1 25,7 25,9 25,7 25,9 ... 26,0
Expenditure ...................... 29,2 30,4 28,9 29,6 28,8 29,6 ... 29,5
Budget balance*** ............ -4,1 -4,3 -3,2 -3,7 -3,2 -3,7 ... -3,5
Gross loan debt .................... 47,3 49,0 47,5 48,6 47,6 49,0 ... 49,4
Net loan debt ....................... 42,5 43,5 43,1 43,9 43,7 44,7 ... 45,4
* Budget Review 2015** Medium Term Budget Policy Statement, October 2015*** Deficit – surplus +
National government gross tax revenue was revised downwards by R7,6 billion to amount to R1 074 billion in fiscal 2015/16. Projected receipts from corporate income tax and VAT underperformed in the first half of the current fiscal year and had therefore been revised downwards. The under-collection of corporate income tax in the current year was mainly due to headwinds faced by the mining and manufacturing sectors on the back of poor global demand, lower commodity prices and domestic electricity constraints. VAT revenue was held back mainly by collections of domestic VAT. Final household consumption, which is the proxy tax base for VAT, indicated that households remain under pressure, weighted down by subdued real disposable income, weak credit growth and higher food inflation. By contrast, personal income tax receipts remained buoyant, supported by above-inflation wage settlements alongside a higher marginal tax rate.
Government maintained the fiscal stance announced in 2014, which was to maintain spending limits to ensure that public finances would not be unduly burdened by higher debt and interest payments. Within these limits, funds were shifted to accommodate the three-year public-sector wage agreement reached earlier in 2015. While the public-sector wage increase was well above inflation, raising the government’s wage bill, debt-service costs remained the fastest-growing

Quarterly Bulletin December 201580
spending category. The fiscal framework for the main budget allowed for moderate growth in non-interest expenditure over the next three years, averaging 7,6 per cent per annum in nominal terms. In real terms the growth was therefore constrained to an average of around 2 per cent per annum over the medium term, as shown in the graph on the next page.
National government non-interest expenditure
Percentage change over one year
Fiscal years
*Medium Term Budget Policy Statement, October 2015
2018/19*2015/16*2013/142011/122009/100
3
6
9
12
15
Nominal increase Real increase
Government’s medium-term borrowing strategy would continue to take into account debt levels, the main budget balance, funding instruments, cash-flow requirements, investor needs, developments in the domestic and global markets, as well as the risks and costs of alternative strategies.
Debt management was focused on mitigating the risks presented by the sharp increase in loan payments over the medium term and beyond. To meet these repayments, government would continue its bond-switching programme, through which short-dated bonds would be exchanged for longer-dated paper.
2018/19*2015/16*2013/142011/122009/100
400
800
1 200
1 600
2 000
2 400
2 800
Total gross loan debt of national government
R billions Percentage of gross domestic product
As at 31 March of each fiscal year* Medium Term Budget Policy Statement, October 2015
Domestic debt Foreign debt Total gross loan debt (right-hand scale)
0
10
20
30
40
50
60

81Quarterly Bulletin December 2015
The downward revision to GDP, shortfalls in revenue and the weaker exchange rate had led to an upward revision of the debt-to-GDP ratio. However, the debt-ratio trend would stabilise in the years ahead as a result of continued restraint in expenditure growth and improvements in the budget balance.
Impacted by revaluation effects arising from the depreciation of the exchange rate, the projected total gross loan debt of national government was revised upwards by R25,9 billion to amount to R2 009 billion at the end of March 2016. Over the medium term, gross debt stock was projected to increase by R583 billion, bringing the total debt to R2 592 billion at the end of March 2019. Between fiscal 2015/16 and 2018/19, gross loan debt as a proportion of GDP was however projected to level off, increasing only marginally from 49,0 per cent to 49,4 per cent as depicted in the graph on the previous page.

Quarterly Bulletin December 201582
Statement of the Monetary Policy Committee23 September 2015
Issued by Lesetja Kganyago, Governor of the South African Reserve Bank, at a meeting of the Monetary Policy Committee in Pretoria
Since the previous meeting of the Monetary Policy Committee (MPC), risks to the global economic outlook have increased against the backdrop of a slowing Chinese economy. These risks, in conjunction with continued capital outflows from emerging markets, have resulted in heightened global financial market volatility and have contributed to the decision by the United States Federal Reserve (the Fed) to maintain its current monetary policy stance. This delay has added uncertainty to an already volatile global setting.
The domestic economic outlook has deteriorated following the surprise contraction in the second quarter of the year. At the same time, the rand experienced a further significant depreciation in response to domestic and global developments, intensifying the upside risks to the inflation outlook. The combination of sharply slowing growth and rising inflation compounds the dilemma facing monetary policy.
The year-on-year inflation rate, as measured by the consumer price index (CPI) for all urban areas measured 5,0 per cent and 4,6 per cent in July and August respectively.
The decrease in the inflation in August was mainly the result of changes in the housing and utilities as well as transport indices. Having reached a recent high of 5,8 per cent in both January and February, the Bank’s measure of core inflation – which excludes food, fuel and electricity – amounted to 5,3 per cent in August, down from 5,4 per cent in July.
Producer price inflation (PPI) for final manufactured goods increased from 3,3 per cent in July to 3,4 per cent in August, down from 3,7 per cent in June. The upward trend is expected to continue in the coming months as the impact of higher agricultural crop and food prices becomes more apparent.
The inflation forecast of the Bank has changed marginally, with a near-term improvement and a slight medium-term deterioration. Inflation is now expected to average 4,7 per cent in 2015, from 5,0 per cent previously, and then to breach the upper end of the target range in the first quarter of 2016, with a peak of 6,7 per cent (previously 6,9 per cent). Inflation is then expected to settle at around the top end of the target range, with a further temporary breach of 6,2 per cent in the final quarter. This breach is mainly due to the base effects from the lower starting point for the petrol price in the fourth quarter of this year. The forecast for 2017 follows a slow downward trend, with inflation measuring 5,7 per cent in the final quarter. The changes in this trajectory are mainly due to the more depreciated starting point for the real effective exchange rate, which is offset to some extent by a lower international oil price assumption.
The forecast for core inflation is marginally higher in the later quarters, but with an unchanged expected average of 5,4 per cent in 2016 and slightly higher at 5,3 per cent in 2017, up from 5,2 per cent.
Inflation expectations, as measured by the survey conducted in the third quarter by the Bureau for Economic Research, are more or less unchanged; they remain at the upper end of the target range. Average inflation expectations for 2016 are unchanged at 6,1 per cent and reverted to 5,9 per cent for 2017, following the decline to 5,8 per cent in the previous quarter. As before, there were marked differences between the different categories of respondents, with the 2017 expectations averaging 5,4 per cent for financial analysts, 6,5 per cent for business people and 5,9 per cent for trade unionists. Average five-year inflation expectations declined from 6,0 per cent to 5,9 per cent, but those of business people reverted to their 2014 level of 6,5 per cent, from 6,3 per cent previously.
Median annual inflation expectations of market analysts, as reflected in the Reuters Econometer survey, are almost identical to those of the Bank’s forecast and more or less unchanged since

83Quarterly Bulletin December 2015
the previous survey. The break-even inflation rates derived from the inflation-linked bonds have increased moderately since the previous meeting and have remained above the upper end of the target range across all maturities.
The global economic outlook has become more uncertain since the previous meeting of the MPC, driven in part by the strong financial market reactions to the deteriorating outlook for the Chinese economy. Although growth prospects in the United States (US) remain positive, they have been clouded by growing concerns about possible spillbacks from a slowdown in emerging markets, particularly in China, as well as from the impact of the strong dollar. Euro area growth moderated in the second quarter and remains relatively subdued, while real output in Japan declined.
Growing concerns about the risk of an abrupt slowdown in the Chinese economy have been fuelled by excess capacity in the real-estate market and in the industrial sectors of the economy. The recent equity market correction, the surprise devaluation of the renminbi as well as the uncertain policy responses have added to these concerns. While, to date, the actual slowdown has been relatively moderate, a hard landing could have a severe impact on global markets and on commodity prices in particular.
These developments have had an adverse effect on the outlook for commodity producers, particularly emerging-market economies, but Asian economies with close trade links with China have also been affected. The deteriorating terms of trade have compounded the impact of continued capital flows from emerging markets in anticipation of US monetary policy normalisation. Consensus growth forecasts for most Latin American and Asian economies have accordingly been revised downwards.
Lower commodity prices have contributed to a more benign global inflation environment, although some emerging markets are experiencing inflationary pressures through depreciating currencies. In the US, concerns about the possible restraining effect of the appreciating dollar on domestic economic activity and inflation, coupled with global financial market volatility and the risk of a sharp slowdown in emerging markets, were key factors in the decision to delay the commencement of monetary policy normalisation. The European Central Bank has indicated that further monetary easing is being contemplated, while developments in Japan suggest that monetary policies will remain highly accommodative for some time.
Domestic financial markets, including bond and equity markets, have not been immune to the turmoil in global markets. Although the rand has been one of the more volatile currencies, having fluctuated in a range of between around R12,60 and just over R14,00 against the US dollar since the previous MPC meeting, its trend depreciation over the year has not been significantly different to those of other commodity currencies and a number of other peer emerging economies. Since the previous meeting of the MPC, the rand has depreciated by about 9 per cent against the US dollar, by about 10 per cent against the euro, and by about 8 per cent on a trade-weighted basis.
The rand was negatively affected by developments in China, continued speculation regarding the timing of US policy ‘take-off’, and the weaker-than-expected gross domestic product (GDP) growth outcome. The rand reacted positively to the US decision to maintain its policy stance as well as to the narrowing deficit on the current account of the balance of payments.
The rand exchange rate remains an upside risk to the inflation outlook. As noted in previous statements, a key uncertainty for the MPC is the extent to which the US policy normalisation is already priced into the currency. The fact that the rand appreciated in response to the Fed’s decision suggests that some depreciation is likely when US rates are increased. However, the extent is uncertain, with the possibility of a temporary overshoot in a highly volatile environment.
A further uncertainty relates to the sustainability of the contraction in the current account of the balance of payments in the second quarter when a deficit of 3,1 per cent of GDP was recorded. While this narrowing is attributed in part to temporary factors, there appears to be some evidence that both export and import volumes are responding to the depreciation of the rand and the weaker economy. However, the Bank expects this process of adjustment to

Quarterly Bulletin December 201584
remain slow, with the export response inhibited by a number of factors, including headwinds from the slowing global economy, electricity supply constraints and declining tourism receipts.
The domestic economic growth outlook has deteriorated compared with the previous forecast. This follows the surprise annualised contraction of 1,3 per cent in the second quarter of this year. While the MPC is of the view that a further contraction is unlikely in the third quarter, the outlook remains relatively weak amid declining business and consumer confidence. The Bank’s forecast for growth has been revised down by half a percentage point in each year of the forecast period, to 1,5 per cent in 2015 and to 1,6 per cent and 2,1 per cent respectively in the subsequent two years. The Bank’s estimate of potential output for 2015 has also been revised down to 1,8 per cent. The risks to the growth outlook are now seen to be more or less balanced. This weak outlook is consistent with the Bank’s leading indicator of economic activity, which has exhibited a more pronounced downward trend in recent months.
The growth disappointment was particularly evident in the goods-producing sectors of the economy, with contractions in agriculture, mining and manufacturing, although growth in the services sectors also moderated. The agricultural sector remains constrained by the continuing drought, and although mining output increased in July, prospects are being negatively affected by weak commodity prices, lower global demand and the risk of industrial action in parts of the sector. Manufacturing output also increased marginally in July, but the decline in the Barclays Purchasing Managers’ Index (PMI) to below the neutral 50 level in August and a further decline in capacity utilisation suggest a challenging outlook.
Growth in gross fixed capital formation moderated to 1,0 per cent in the second quarter, with general government providing the only notable increase. The weak contribution from the private sector is reflected in the further sharp decline in the Rand Merchant Bank/Bureau for Economic Research (RMB/BER) Business Confidence Index to its lowest level since 2011. The only area where private-sector investment increased markedly was with respect to energy-generation projects. This disappointing scenario does not bode well for employment growth, despite the decline in the official unemployment rate to 25,0 per cent in the second quarter, mainly due to growth in informal sector employment.
Growth in the consumption expenditure by households also reflects the subdued demand conditions in the economy, with a moderation in growth to 1,2 per cent in the second quarter, with some resilience only evident in semi-durable goods consumption. Retail sales grew only marginally in July, amid a sharp decline in the business confidence of retailers. The weakness in durable goods sales is evident in the lower new vehicle sales in August, particularly commercial vehicles.
Consumers are expected to remain constrained against the backdrop of slow employment growth, declining disposable income growth and rising inflation. Furthermore, the pace of credit extension to households, which remains negative in real terms, is expected to be affected further by the tighter affordability criteria following the implementation of amendments to the National Credit Regulations. At the same time, household deleveraging has continued, with the debt-to-disposable-income ratio moderating further to 77,8 per cent in the second quarter of 2015, its lowest level since 2006. Credit extension to the corporate sector, by contrast, has been buoyant, particularly with respect to general loans and mortgage advances.
No new data concerning wage and unit labour cost developments have become available since the previous meeting of the MPC, but trends are expected to be relatively unchanged, with average nominal wage growth in excess of inflation contributing to the persistence of inflation at higher levels.
Although food price developments have been relatively benign, they remain a concern to the MPC, with the expectation of an acceleration in the coming months as the impact of the drought feeds through to consumer prices. This is despite the favourable impact of falling prices at the global level. Domestic food price inflation at the consumer level appears to have reached a low point of 4,3 per cent in June, increasing marginally to 4,4 per cent in July and August.

85Quarterly Bulletin December 2015
The pressures are expected to come from the drought-induced increases in agricultural price inflation for cereals and crops which increased at a year-on-year rate of 38,7 per cent in July.
The recent decline in international oil prices has provided some respite to inflation pressures, with the price of Brent crude oil currently trading at around US$10 per barrel lower than at the time of the previous MPC meeting. The current global oversupply of crude oil, coupled with the slowdown in China, is expected to keep oil prices contained in the short to medium term. The MPC has revised down its oil price assumption by between US$3 and US$4 per barrel in each of the coming years. However, the MPC assesses the risk to the oil price assumption to be on the downside, particularly in the short term. The domestic petrol price declined by a cumulative R1,20 per litre in August and September, and current trends suggest that no significant change is likely in October, with the weaker rand offsetting the impact of the falling dollar price of oil.
The inflation outlook remains a concern for the MPC, with the risks to the forecast assessed to be on the upside. Although two breaches of the target are now expected – in the first and fourth quarters of next year – they are expected to be temporary and primarily the result of base effects from lower petrol prices four quarters previously.
Nevertheless, the MPC is concerned that the longer-term inflation trajectory remains uncomfortably close to the upper end of the target range, and given the upside risks to inflation, the probability of a more extended breach than currently forecast is relatively high. A sustained breach of the target range brings with it the danger of impacting negatively on inflation expectations, which are currently sticky at the upper end of the target range.
The MPC is also concerned about domestic growth prospects, with the economy contracting in the second quarter. Growth is expected to remain constrained by global developments and associated uncertainty and volatility, low business and consumer confidence, and electricity supply shortages. Domestic inflation is not driven by demand factors, and the outlook for household consumption expenditure has deteriorated. However, we have to be mindful of the second-round effects of supply-side shocks on inflation.
There are a number of upside risks to the inflation outlook, the primary one being the exchange rate which has already depreciated significantly against the advanced economy currencies in response to global developments, and is still likely to react further to the commencement of US monetary policy tightening. A further risk emanates from possible higher multi-year increases in electricity tariffs from the middle of next year.
Downside risks to the inflation outlook include international oil prices, should they be sustained at current levels. In addition, weak domestic demand may continue to constrain pricing power in the economy. The Committee nevertheless assesses the overall risks to the inflation outlook to be on the upside.
As noted in previous statements, the MPC has to achieve a fine balance between realising its core mandate and not undermining short-term growth unduly. The MPC has unanimously decided to keep the repurchase rate unchanged for now at 6,0 per cent per annum.
The MPC remains on a gradual policy normalisation path. It will continue to monitor developments closely, and will not hesitate to act appropriately should the risks to the inflation outlook deteriorate materially. As before, any future moves remain highly data-dependent.

Quarterly Bulletin December 201586
Annexure
Summary of assumptions: Monetary Policy Commitee meeting on 23 September 2015*
1. Foreign-sector assumptions
Percentage changes (unless otherwise indicated) Actual Forecast
2013 2014 2015 2016 2017
1. Real GDP growth in South Africa’s major trading partner countries ..... 3,0% 3,1% 2,8% 3,3% 3,3%
(3,1%) (3,1%) (3,0%) (3,3%) (3,3%)
2. International commodity prices in US$ (excluding oil) ..................... -6,4% -9,8% -17,9% -5,0% 0,0%
(-17,0%) (0,0%) (5,0%)
3. Brent crude (US$/barrel) ................................................................. 108,8 99,2 57,1 61,5 65,5
(60,2) (65,0) (68,1)
4. World food prices (US$)................................................................... -1,6% -3,8% -16,2% 1,6% 2,5%
(-14,0%) (1,5%) (2,5%)
5. International wholesale prices ......................................................... 0,3% -0,1% -3,0% 0,5% 1,0%
(-2,2%) (0,8%) (1,3%)
6. Real effective exchange rate of the rand (index 2010 = 100) ........... 81,91 79,17 81,41 80,50 80,50
(81,29) (80,50) (80,50)
7. Real effective exchange rate of the rand.......................................... -10,1% -3,3% 2,8% -1,1% 0,0%
(2,7%) (-1,0%) (0,0%)
2. Domestic-sector assumptionsPercentage changes (unless otherwise indicated) Actual Forecast
2013 2014 2015 2016 2017
1. Real government consumption expenditure ............................ 3,3% 1,9% 0,5% 1,5% 1,5%
(1,0%) (1,5%) (1,5%)
2. Administered prices ................................................................. 8,7% 6,7% 2,0% 9,9% 8,5%
(2,8%) (9,6%) (8,4%)
– Petrol price .......................................................................... 11,8% 7,2% -9,8% 12,9% 6,6%
(-7,2%) (11,7%) (6,4%)
– Electricity price .................................................................... 8,7% 7,2% 9,4% 12,2% 13,0%
(9,7%) (12,5%) (13,0%)
3. Potential growth ....................................................................... 2,1% 1,9% 1,8% 1,9% 2,1%
(2,2%) (2,1%) (2,1%) (2,2%) (2,3%)
4. Repurchase rate (per cent) ....................................................... 5,00 5,57 5,86 6,00 6,00
(5,75) (5,75) (5,75)
The figures in brackets represent the previous assumption of the MPC. * For an explanation of foreign-sector assumptions and domestic-sector assumptions, see pages 94 and 95.
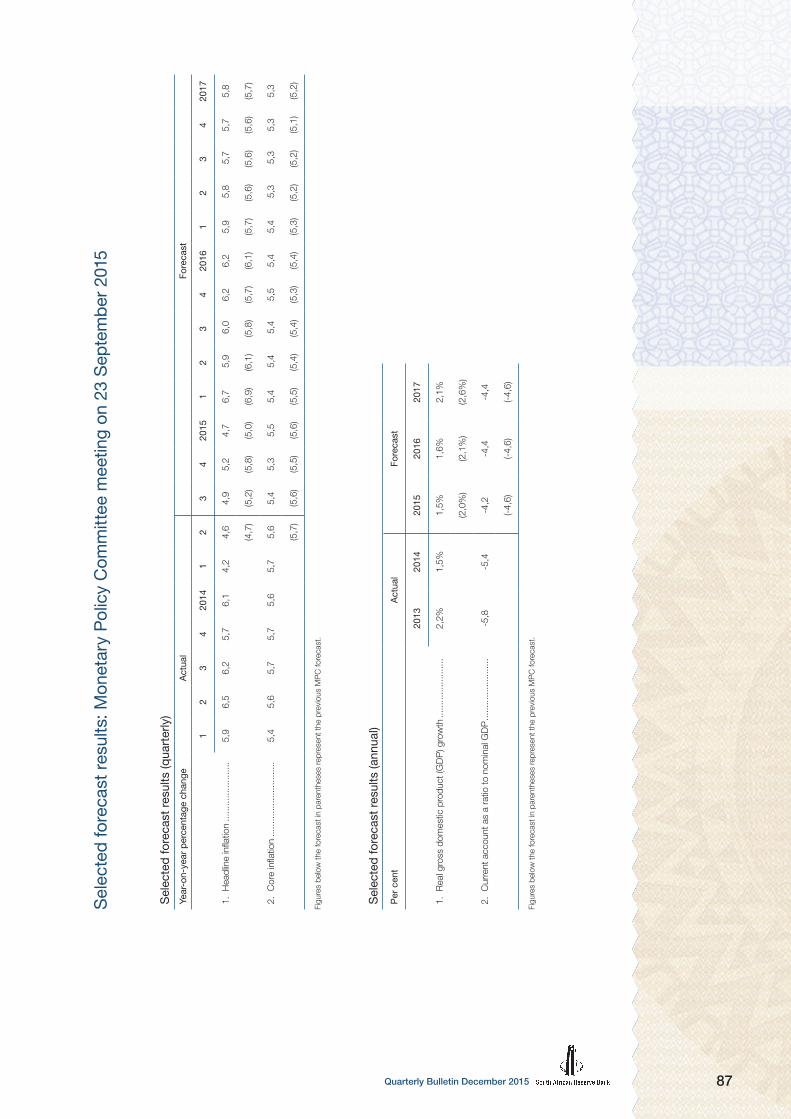
87Quarterly Bulletin December 2015
Sel
ecte
d fo
reca
st r
esul
ts: M
onet
ary
Pol
icy
Com
mitt
ee m
eetin
g on
23
Sep
tem
ber
2015
Sel
ecte
d fo
reca
st re
sults
(ann
ual)
Per
cen
tA
ctua
lFo
reca
st
2013
2014
2015
2016
2017
1. R
eal g
ross
dom
estic
pro
duct
(GD
P) g
row
th ..
......
......
......
...2,
2%
1,5%
1,5%
1,
6%
2,1%
(2,0
%)
(2,1
%)
(2,6
%)
2. C
urre
nt a
ccou
nt a
s a
ratio
to n
omin
al G
DP
.....
......
......
......
.-5
,8
-5,4
-4,2
-4
,4
-4,4
(-4,
6)(-
4,6)
(-4,
6)
Figu
res
belo
w th
e fo
reca
st in
par
enth
eses
repr
esen
t the
pre
viou
s M
PC
fore
cast
.
Sel
ecte
d fo
reca
st re
sults
(qua
rter
ly)
Year
-on-
year
per
cent
age
chan
geA
ctua
lFo
reca
st
12
34
2014
12
34
2015
12
34
2016
12
34
2017
1. H
eadl
ine
infla
tion
......
......
......
.....
5,9
6,5
6,2
5,7
6,1
4,2
4,6
4,9
5,2
4,7
6,7
5,9
6,0
6,2
6,2
5,9
5,8
5,7
5,7
5,8
(4,7
)(5
,2)
(5,8
)(5
,0)
(6,9
)(6
,1)
(5,8
)(5
,7)
(6,1
)(5
,7)
(5,6
)(5
,6)
(5,6
)(5
,7)
2. C
ore
infla
tion
......
......
......
......
.....
5,4
5,6
5,7
5,7
5,6
5,7
5,6
5,4
5,3
5,5
5,4
5,4
5,4
5,5
5,4
5,4
5,3
5,3
5,3
5,3
(5,7
)(5
,6)
(5,5
)(5
,6)
(5,5
)(5
,4)
(5,4
)(5
,3)
(5,4
)(5
,3)
(5,2
)(5
,2)
(5,1
)(5
,2)
Figu
res
belo
w th
e fo
reca
st in
par
enth
eses
repr
esen
t the
pre
viou
s M
PC
fore
cast
.

Quarterly Bulletin December 201588
Statement of the Monetary Policy Committee19 November 2015
Issued by Lesetja Kganyago, Governor of the South African Reserve Bank, at a meeting of the Monetary Policy Committee in Pretoria
Since the previous meeting of the Monetary Policy Committee (MPC), the inflation forecast has remained relatively unchanged but the risks to the forecast have increased. The key risks are a marked depreciation of the rand; worsening drought conditions and their likely impact on food prices; and the possibility of additional electricity tariff adjustments. At the same time the economy remains weak despite an improved performance in the manufacturing sector, but both the mining and agricultural sectors appear to have contracted further in the third quarter.
Although global financial markets have stabilised somewhat since the previous meeting, the outlook for emerging markets in particular remains challenging. The United States Federal Reserve (the Fed) is likely to raise its policy rate in December, and further volatility in financial markets can be expected in the lead-up to this.
The year-on-year inflation rate, as measured by the consumer price index (CPI) for all urban areas, measured 4,7 per cent in October, following two consecutive months at 4,6 per cent. Food and non-alcoholic beverages inflation surprised again on the downside at 4,8 per cent, with a contribution of 0,7 percentage points to the overall CPI outcome. Services price inflation remained unchanged at 5,6 per cent, while goods price inflation increased to 3,7 per cent from 3,6 per cent previously. The Bank’s measure of core inflation – which excludes food, fuel and electricity – amounted to 5,2 per cent, down from 5,3 per cent in the previous two months.
Producer price inflation for final manufactured goods increased from 3,4 per cent in August to 3,6 per cent in September. The main pressure came from the category of food, beverages and tobacco products, which contributed 2,0 percentage points to the outcome. Food and agricultural crop price developments are expected to sustain the upward trend in producer price inflation in the coming months.
The latest inflation forecast of the Bank shows a slight near-term improvement while the medium-term forecast is marginally higher. Inflation is now expected to average 4,6 per cent in 2015, and 6,0 per cent and 5,8 per cent in the next two years. The anticipated breach of the upper end of the target range in the first quarter of 2016 is now expected to average 6,4 per cent, compared with 6,7 per cent forecast previously. The trajectory for the rest of the year is also slightly lower than previously forecast, with a temporary breach in the fourth quarter of 6,1 per cent. The forecast for 2017 follows a slow downward trend, with inflation still expected to measure 5,7 per cent in the final quarter. The changes in the forecast are due to a lower starting point for the forecast, lower international oil price assumptions, and an adjustment to fees for higher education which are more or less offset by a more depreciated starting point for the real effective exchange rate.
The forecast for core inflation is marginally higher, with an expected average of 5,5 per cent in 2016 and 5,4 per cent in 2017, mainly due to the more depreciated exchange rate assumption.
The inflation expectations survey of the Bureau for Economic Research (BER) is only due for release in December. The median inflation forecast of analysts polled in the latest Reuters Econometer survey is similar to that of the Bank, and has also declined marginally since the previous survey. The break-even inflation rates, while having improved since the previous meeting, remain above the upper end of the target range.
Divergent global developments continue to create a challenging environment for monetary policy. Although the United States (US) recovery appears to be sustained, with further improvements in the labour market, the strong dollar poses downside risks to both growth and inflation. The United Kingdom (UK) economy also remains on its recovery path. By contrast, the recovery in

89Quarterly Bulletin December 2015
the euro area is much weaker, although the outlook is more favourable than it was earlier in the year. The Japanese economy has contracted for two consecutive quarters, with positive but slow growth expected in the coming quarters.
The Chinese economy shows signs of stabilising, aided by policy stimulus, but the medium-term outlook remains a concern. There is still some uncertainty regarding the extent to which services output and consumption have compensated for the decline in industrial output and investment. The tail risk of a hard landing remains, which could have a significant impact on countries with direct trade linkages, particularly those in Asia, as well as on commodity prices.
Brazil and Russia remain in recession, while the strong performance of the Indian economy has been sustained following a number of structural reforms. The outlook for sub-Saharan Africa, while still positive, has deteriorated in the wake of lower commodity prices, and further weakening could create greater headwinds for South African manufactured exports to this region.
Global inflation trends are benign, with concerns about deflation abating in most advanced economies. Despite significant currency depreciations in commodity-producing economies in particular, inflation pressures have generally been surprisingly contained, with a few exceptions. Emerging markets have had differing experiences: a number of countries in Latin America, particularly commodity producers, have tightened policy in recent months in response to incipient inflationary pressures, while those with low inflation, particularly in Asia, have loosened policy further.
In the advanced economies, monetary policy divergence is expected to continue. Monetary policy is set to remain accommodative in the euro area and Japan, with the possibility of further quantitative easing, against a backdrop of slow growth and benign inflation pressures. In the US, inflation and labour market dynamics as well as communication from the Fed suggest that, in the absence of any major surprises or shocks, an increase in the policy rate can be expected in December. Market expectations are for monetary policy tightening in the UK to commence sometime in the second half of 2016, later than previously expected.
Although volatility in global asset markets has moderated amid improving risk sentiment, emerging-market foreign-exchange markets have been relatively volatile and vulnerable to capital outflows. In the past three months, South Africa has also seen net portfolio outflows: since the end of August, according to JSE Limited data, non-resident sales of equities amounted to R25,9 billion while net bond sales amounted to R5,9 billion.
The rand exchange rate has been particularly volatile, even compared to its peers, as domestic factors also impacted on the currency. Since the previous meeting of the MPC, the rand has appreciated by about 1,0 per cent against the euro but has depreciated by around 3,0 per cent against the dollar and by 1,5 per cent on a trade-weighted basis. As before, the extent to which Fed tightening has been priced into the exchange rate remains uncertain. Nevertheless, a high degree of volatility and overshooting of the exchange rate may be expected in the lead-up to, and in the immediate aftermath of, the start of the US interest rate cycle. Fed communication of future moves will be key. To date, indications are that a moderate policy hiking cycle will be pursued.
Domestic economic growth prospects remain subdued amid weak business confidence, but a further contraction in the third quarter is not expected. The Bank’s forecast for gross domestic product (GDP) growth has been revised down marginally for 2015 and 2016 – to 1,4 per cent and 1,5 per cent respectively – but remains unchanged at 2,1 per cent for 2017. The estimate of short-term potential output remains unchanged at 1,8 per cent for this year, rising to 2,1 per cent in 2017. The Bank’s composite leading business cycle indicator declined further in August, consistent with the fragile outlook.
The manufacturing sector recovered somewhat in the third quarter, mainly due to a surprisingly strong performance in September, and is expected to have contributed positively to GDP growth.
Quarterly Bulletin December 201590
However, the Barclays Purchasing Managers’ Index (PMI) declined further in October, and has been below the neutral level of 50 for three consecutive months, suggesting a constrained outlook for the sector. The mining sector is expected to subtract from GDP growth following a further contraction in the third quarter, while the continuing drought points to a third successive quarterly contraction for the agricultural sector. The outlook for the construction sector is constrained following significant declines in new building plans passed, reflected in a 9-point drop in the First National Bank (FNB)/BER Building Confidence Index.
Against this backdrop, formal sector employment trends remain disappointing. According to the Quarterly Employment Statistics survey of Statistics South Africa (Stats SA), employment in the formal non-agricultural sector declined in the second quarter of 2015, as the private sector continued to shed jobs. Although the Quarterly Labour Force Survey indicates an increase in the number of persons employed in the third quarter, the number of unemployed persons rose sharply in the quarter as the number of new entrants increased. Consequently, the official unemployment rate increased to 25,5 per cent in the third quarter.
There are minimal demand-side pressures in the economy. Consumption expenditure by households continues to be inhibited by, inter alia, low consumer confidence, declining disposable income growth and slow employment growth. The latest retail trade sales data suggest that household expenditure may have lost further momentum in the third quarter. Durable goods sales remain under pressure, as indicated in the intensification of the downward trend in motor vehicle sales in recent months.
Consumption expenditure is also constrained by the continued slow growth in credit extension to households by banks. Unsecured lending remains subdued and is likely to be affected further by the recently announced caps on interest rates by the Department of Trade and Industry, while the decline in growth in instalment sale credit and leasing finance is indicative of the softer motor vehicle sales.
Credit extension to corporates remains robust, particularly commercial mortgage finance, which reflects in part a switch away from funding in the bond market by property funds.
The recent Medium-Term Budget Policy Statement (MTBPS) signalled government’s continued commitment to fiscal consolidation, although at a slower pace. Most of the expanded deficit is attributable to lower-than-expected tax revenues in response to the weaker growth outlook.
Trends in wage growth remain a concern and contribute to the persistence of inflation at elevated levels. Year-on-year growth in salaries and wages per worker accelerated to 8,7 per cent in the second quarter of 2015; after adjusting for labour productivity increases, total unit labour costs increased from 4,3 per cent to 5,1 per cent. By contrast, the average wage settlement rate in collective bargaining agreements recorded by Andrew Levy Employment Publications recorded a moderation to 7,7 per cent in the first three quarters of the year, compared with 8,1 per cent in 2014.
Apart from the exchange rate, the main upside risks to inflation come from possible electricity tariff and food price increases. Eskom’s application for a Regulatory Clearing Account (RCA) to the National Energy Regulator (NERSA) to claw back excess expenditure of R22,8 billion is likely to lead to a further tariff increase, although the quantum and timing is uncertain. This is in addition to the 12,2 per cent tariff increase already built into the inflation forecast for next year. No provision is made for the RCA application in the forecast at this stage, but it is regarded as an upside risk.
A higher food price trajectory has been incorporated in the forecast for some time, but food price inflation has surprised on the downside in recent months despite sharp increases in maize and cereals prices earlier in the year. However, the increased intensity of the drought (which has led to downward revisions of the domestic maize crop estimate) as well as the incipient pressures evident in both the PPI and the CPI suggest that an acceleration in food price inflation is likely, adding to the upside risk to the inflation outlook.

91Quarterly Bulletin December 2015
By contrast, international oil price developments are expected to remain benign, with current spot prices below US$45 per barrel, somewhat lower than those assumed over the forecast period. Although petrol prices have contributed to a succession of downside inflation surprises in recent months, the beneficial impact of lower international oil prices on domestic petrol prices has been offset to some extent by the depreciation of the rand. The latest data suggest that, should current trends continue, a small drop in the petrol price can be expected next month despite the further depreciation of the currency.
Although the inflation forecast is relatively unchanged since the previous meeting, the upside risks to the inflation outlook are more pronounced. As noted, these risks relate to the persistent exchange rate depreciation, electricity tariffs and food prices, and are assessed to outweigh possible downside risks from lower international oil prices and subdued exchange rate pass-through. While these factors cannot be dealt with directly through monetary policy, the MPC is concerned that failure to act could cause inflation expectations to become unanchored and generate second-round effects and more generalised inflation. Although core inflation has remained steady and inflation expectations to date have been relatively anchored, they remain at uncomfortably elevated levels.
The general approach of the MPC is to attempt to see through exogenous shocks and react to second-round effects. However, shocks of a persistent nature – for example extended periods of currency depreciation or drought, or multi-year increases in electricity prices – make it more difficult to disentangle these first- and second-round effects.
In the absence of demand pressures, the MPC had to decide whether to act now or later. On the one hand, given the relative stability in the underlying core inflation, delaying the adjustment could give the MPC room to re-assess these unfolding developments at the next meeting and avoid possible additional headwinds to the weak growth outlook. On the other hand, delaying the adjustment further could lead to second-round effects and require an even stronger monetary policy response in future, with more severe consequences for short-term growth.
Complicating the decision was the deteriorating economic growth outlook. Although the change to the growth forecast was marginal, risks to the outlook – which were more or less balanced at the previous meeting – are now assessed to be on the downside.
Against this difficult backdrop, the MPC has decided to increase the repurchase rate by 25 basis points to 6,25 per cent per annum effective from 20 November 2015. Four members preferred an increase while two members favoured an unchanged stance.
Despite the increase, the MPC still views the monetary policy stance as being accommodative. The continuing challenge is for monetary policy to achieve a fine balance between achieving the Bank’s core mandate of price stability and not undermining short-term growth unduly. Monetary policy actions will continue to focus on anchoring inflation within the target range while remaining sensitive, to the extent possible, to the fragile state of the economy. As before, any future moves will therefore be highly data-dependent.

Quarterly Bulletin December 201592
Annexure
Summary of assumptions: Monetary Policy Commitee meeting on 19 November 2015*
1. Foreign-sector assumptions
Percentage changes (unless otherwise indicated) Actual Forecast
2013 2014 2015 2016 2017
1. Real GDP growth in South Africa’s major trading partner countries ... 3,0% 3,1% 2,8% 3,1% 3,3%
(2,8%) (3,3%) (3,3%)
2. International commodity prices in US$ (excluding oil) ...................... -6,4% -9,8% -18,2% -7,0% -0,5%
(-17,9%) (-5,0%) (0,0%)
3. Brent crude (US$/barrel) .................................................................. 108,8 99,2 54,9 56,0 60,0
(57,1) (61,5) (65,5)
4. World food prices (US$).................................................................... -1,6% -3,8% -18,0% -2,8% 2,7%
(-16,2%) (1,6%) (2,5%)
5. International wholesale prices .......................................................... 0,3% -0,1% -3,2% 0,2% 0,8%
(-3,0%) (0,5%) (1,0%)
6. Real effective exchange rate of the rand (index 2010 = 100) ............ 81,91 79,17 80,41 77,00 77,00
(81,41) (80,50) (80,50)
7. Real effective exchange rate of the rand........................................... -10,1% -3,3% 1,6% -4,2% 0,0%
(2,8%) (-1,1%) (0,0%)
2. Domestic-sector assumptionsPercentage changes (unless otherwise indicated) Actual Forecast
2013 2014 2015 2016 2017
1. Real government consumption expenditure .................................... 3,3% 1,9% 0,5% 1,5% 1,5%
(0,5%) (1,5%) (1,5%)
2. Administered prices ......................................................................... 8,7% 6,7% 1,7% 7,7% 8,1%
(2,0%) (9,9%) (8,5%)
– Petrol price.................................................................................. 11,8% 7,2% -10,6% 7,2% 6,4%
(-9.8%) (12,9%) (6,6%)
– Electricity price ........................................................................... 8,7% 7,2% 9,4% 12,2% 13,0%
(9,4%) (12,2%) (13,0%)
3. Potential growth ............................................................................... 2,1% 1,9% 1,8% 1,9% 2,1%
(1,8%) (1,9%) (2,1%)
4. Repurchase rate (per cent) .............................................................. 5,00 5,57 5,86 6,00 6,00
(5,86) (6,00) (6,00)
The figures in brackets represent the previous assumption of the MPC * For an explanation of foreign-sector assumptions and domestic-sector assumptions, see pages 94 and 95.

93Quarterly Bulletin December 2015
Sel
ecte
d fo
reca
st re
sults
(ann
ual)
Per
cen
tA
ctua
lFo
reca
st
2013
2014
2015
2016
2017
1. R
eal g
ross
dom
estic
pro
duct
(GD
P) g
row
th ..
.2,
2%
1,5%
1,4%
1,
5%
2,1%
(1,5
%)
(1,6
%)
(2,1
%)
2. C
urre
nt a
ccou
nt a
s a
ratio
to n
omin
al G
DP
....
-5,8
-5
,4-4
,2
-4,6
-4
,6
(-4,
2)(-
4,4)
(-4,
4)
Figu
res
belo
w th
e fo
reca
st in
par
enth
eses
repr
esen
t the
pre
viou
s M
PC
fore
cast
.
Sel
ecte
d fo
reca
st re
sults
(qua
rter
ly)
Year
-on-
year
per
cent
age
chan
geA
ctua
lFo
reca
st
12
34
2014
12
34
2015
12
34
2016
12
34
2017
1. H
eadl
ine
infla
tion
......
......
......
....
5,9
6,5
6,2
5,7
6,1
4,2
4,6
4,7
5,0
4,6
6,4
5,6
5,7
6,1
6,0
5,9
5,8
5,8
5,7
5,8
(4,6
)(4
,9)
(5,2
)(4
,7)
(6,7
)(5
,9)
(6,0
)(6
,2)
(6,2
)(5
,9)
(5,8
)(5
,7)
(5,7
)(5
,8)
2. C
ore
infla
tion
......
......
......
......
....
5,4
5,6
5,7
5,7
5,6
5,7
5,6
5,3
5,3
5,5
5,5
5,5
5,5
5,6
5,5
5,4
5,4
5,3
5,3
5,4
(5,6
)(5
,4)
(5,3
)(5
,5)
(5,4
)(5
,4)
(5,4
)(5
,5)
(5,4
)(5
,4)
(5,3
)(5
,3)
(5,3
)(5
,3)
Figu
res
belo
w th
e fo
reca
st in
par
enth
eses
repr
esen
t the
pre
viou
s M
PC
fore
cast
.
Sel
ecte
d fo
reca
st r
esul
ts: M
onet
ary
Pol
icy
Com
mitt
ee m
eetin
g on
19
Nov
embe
r 20
15

Quarterly Bulletin December 201594
Foreign-sector assumptions1. Trading partner gross domestic product (GDP) growth is determined broadly using the
Global Projection Model (GPM) of the International Monetary Fund (IMF), which is then adjusted to aggregate the GDP growth rates of South Africa’s major trading partners on a trade-weighted basis. Individual projections are done for the four largest trading partners: the euro area, China, the United States (US) and Japan. The remaining trading partners are grouped into three regions: Emerging Asia (excluding China), Latin America and the Rest of Countries bloc. The assumption takes account of country-specific ‘consensus’ forecasts as well as IMF regional growth prospects.
2. The commodity price index is a weighted aggregate price index of the major South African export commodities based on 2010 prices. The composite index represents the total of the individual commodity prices multiplied by their smoothed export weights. Commodity price prospects generally remain commensurate with global liquidity as well as commodity supply/demand pressures as reflected by the pace of growth in the trading partner countries.
3. The Brent crude oil price is expressed in US dollar per barrel. The assumption incorporates an analysis of the factors of supply, demand (using global growth expectations) and inventories of oil (of all grades) as well as the expectations of the US Energy Information Administration (EIA), Organization of the Petroleum Exporting Countries (OPEC) and Reuters.
4. World food prices uses the composite food price index of the Food and Agriculture Organization of the United Nations (FAO) in US dollar. The index is weighted using average export shares and represents the monthly change in the international prices of a basket of five food commodity price indices (cereals, vegetable oil, dairy, meat and sugar). World food price prospects incorporate selected global institution forecasts for food prices as well as imbalances from the anticipated trend in international food supplies relative to expected food demand pressures.
5. International wholesale prices refers to a weighted aggregate of the producer price indices (PPIs) of South Africa’s major trading partners, as per the official real effective exchange rate calculation of the South African Reserve Bank (the Bank). Although individual country consumer price inflation (CPI) forecasts provide a good indication for international wholesale price pressures, the key drivers of the assumed trend in global wholesale inflation are oil and food prices as well as expected demand pressures emanating from the trends in the output gaps of the major trading partner countries. Other institutional forecasts for international wholesale prices are also considered.
6. The real effective exchange rate is the nominal effective exchange rate of the rand deflated by the producer price differential between South Africa and an aggregate of its trading partner countries (as reflected in the Quarterly Bulletin published by the Bank). Although the nominal rate is a weighted average of South Africa’s 20 largest trading partners, particular focus is placed on the rand outlook against the US dollar, the euro, the Chinese yuan, the British pound and the Japanese yen. The assumed trend in the real effective exchange rate remains constant from the latest available quarterly average over the projection period. However, due to the time delay in the calculation of the real effective exchange rate, the most recent trend in the nominal effective exchange rate is adjusted with the assumed trend for the domestic and foreign price differential for the current quarter. This may result in a technical annual adjustment over the current and next forecast year that differs from zero.

95Quarterly Bulletin December 2015
Domestic-sector assumptions1. Government consumption expenditure (real) is broadly based on the most recent National
Treasury budget projections. However, since these projections take place twice a year, the most recent actual data points also play a significant role in the assumptions process.
2. Administered prices represent the total of regulated and non-regulated administered prices as reflected by Statistics South Africa (Stats SA). Their weight in the consumer price index basket is 18,48 per cent and the assumed trend over the forecast period is largely determined by the expected pace of growth in petrol prices, electricity tariffs, school fees as well as water and other municipal assessment rates.
The petrol price is an administered price and comprises 5,68 per cent of the overall basket. The basic fuel price (which currently accounts for roughly half of the petrol price) is determined by the exchange rate and the price of petrol quoted in US dollars at refined petroleum centres in the Mediterranean, the Arab Gulf and Singapore. The remainder of the petrol price is made up of wholesale and retail margins as well as the fuel levy and contributions to the Road Accident Fund (RAF). Since most taxes and retail margins are changed once a year, the assumed trajectory of the petrol price largely reflects the anticipated trend in oil prices and the exchange rate.
The electricity price is an administered price measured at the municipal level with a weight of 4,13 per cent in the CPI basket. Electricity price adjustments generally take place in July and August of each year, and the assumed pace of increase over the forecast period reflects the multi-year price determination (MYPD) by the National Energy Regulator in respect of Eskom, with a slight adjustment for measurement at municipal level.
3. The pace of potential growth is derived from the Bank’s semi-structural potential output model. The measurement accounts for the impact of the financial cycle on real economic activity and introduces economic structure via the relationship between potential output and capacity utilisation in the manufacturing sector (See South African Reserve Bank Working Paper Series WP/14/08).
4. The repurchase rate, or the ‘repo rate’, is the official monetary policy instrument and represents the interest rate at which banks borrow money from the Bank. Although the rate is held constant over the forecast period, this assumption is relaxed in alternative scenarios where, for instance, the policy rate responds to deviations of output from its potential and the gap between future inflation and the inflation target, in other words, via a stylised ‘Taylor rule’, one that is based on market expectations of the future path of the policy rate, and other paths (as requested).

Quarterly Bulletin December 201596
Notes to tables
Capital market interest rates and yields – Table S–29
In light of the diminishing number of participation bond schemes in the industry, the relevance of the predominant deposit (2010M) and borrowing (2012M) rates has declined to the point where the series have now been removed from the table.
The Other Bond Index (Othi) (2018M) was added under ‘yields and price indices for bonds traded on the stock exchange’. This index contains the remainder of the All-Bond Index (Albi) bonds that are not in the Government Bond Index (Govi), and therefore includes bonds of public corporations and government bonds that fall just below the top ones in terms of liquidity and market capitalisation.
The weighted average interest rate on fixed bank deposits with a maturity of more than five years (2026M) was added under ‘deposit and investment rates’.