quarterly business review (qbr) - bpa.gov 2016 quarterly business review quarterly business review...
TRANSCRIPT

B O N N E V I L L E P O W E R A D M I N I S T R A T I O N
APRIL 2016 QUARTERLY BUSINESS REVIEW
Quarterly Business Review (QBR)
May 3rd, 2016
09:30 am – 12:00 pmRates Hearing Room
To participate by phone that does not charge long distance, please dial: 1-517-966-2124
If you are calling long distance, please dial1-866-506-1995
When prompted, enter access code: 2448045 #
Live Meeting: https://www.livemeeting.com/cc/bpa/join
Meeting ID: HHSRC8Entry Code: 68P(\/*Qh
Here at BPA we take safety very seriously. Our motto is “No job is so important and no service so urgent that we cannot take time to perform our work safely.” In the event that the alarm sounds during this meeting, please calmly file out the exit nearest you and meet in Holladay Park for further instructions.
1
B O N N E V I L L E P O W E R A D M I N I S T R A T I O N
APRIL 2016 QUARTERLY BUSINESS REVIEW
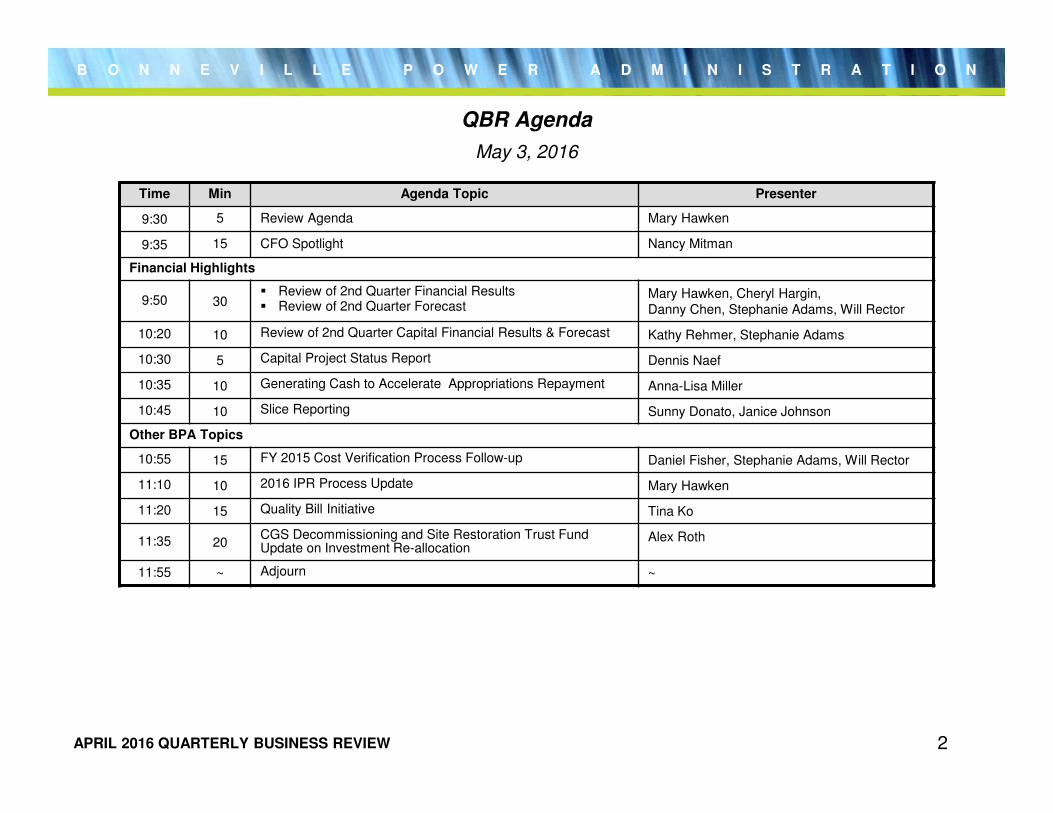
QBR Agenda
May 3, 2016
Time Min Agenda Topic Presenter
9:30 5 Review Agenda Mary Hawken
9:35 15 CFO Spotlight Nancy Mitman
Financial Highlights
9:50 30� Review of 2nd Quarter Financial Results� Review of 2nd Quarter Forecast
Mary Hawken, Cheryl Hargin, Danny Chen, Stephanie Adams, Will Rector
10:20 10 Review of 2nd Quarter Capital Financial Results & Forecast Kathy Rehmer, Stephanie Adams
10:30 5 Capital Project Status Report Dennis Naef
10:35 10 Generating Cash to Accelerate Appropriations Repayment Anna-Lisa Miller
10:45 10 Slice Reporting Sunny Donato, Janice Johnson
Other BPA Topics
10:55 15 FY 2015 Cost Verification Process Follow-up Daniel Fisher, Stephanie Adams, Will Rector
11:10 10 2016 IPR Process Update Mary Hawken
11:20 15 Quality Bill Initiative Tina Ko
11:35 20CGS Decommissioning and Site Restoration Trust Fund Update on Investment Re-allocation
Alex Roth
11:55 ~ Adjourn ~
2

B O N N E V I L L E P O W E R A D M I N I S T R A T I O N
APRIL 2016 QUARTERLY BUSINESS REVIEW
Financial Highlights
3This information has been made publicly available by BPA on April 29, 2016 and contains BPA-approved Financial Information.
B O N N E V I L L E P O W E R A D M I N I S T R A T I O N
APRIL 2016 QUARTERLY BUSINESS REVIEW
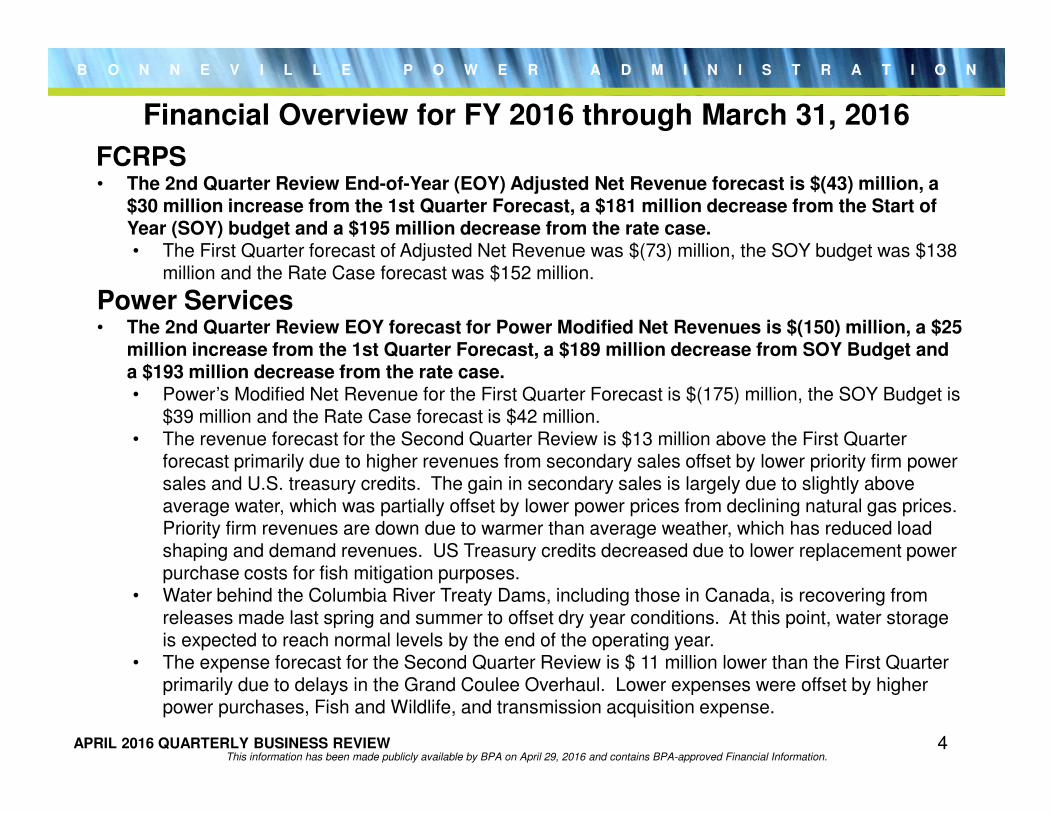
Financial Overview for FY 2016 through March 31, 2016
4This information has been made publicly available by BPA on April 29, 2016 and contains BPA-approved Financial Information.
FCRPS• The 2nd Quarter Review End-of-Year (EOY) Adjusted Net Revenue forecast is $(43) million, a
$30 million increase from the 1st Quarter Forecast, a $181 million decrease from the Start of Year (SOY) budget and a $195 million decrease from the rate case. • The First Quarter forecast of Adjusted Net Revenue was $(73) million, the SOY budget was $138
million and the Rate Case forecast was $152 million.
Power Services• The 2nd Quarter Review EOY forecast for Power Modified Net Revenues is $(150) million, a $25
million increase from the 1st Quarter Forecast, a $189 million decrease from SOY Budget and a $193 million decrease from the rate case. • Power’s Modified Net Revenue for the First Quarter Forecast is $(175) million, the SOY Budget is
$39 million and the Rate Case forecast is $42 million. • The revenue forecast for the Second Quarter Review is $13 million above the First Quarter
forecast primarily due to higher revenues from secondary sales offset by lower priority firm power sales and U.S. treasury credits. The gain in secondary sales is largely due to slightly above average water, which was partially offset by lower power prices from declining natural gas prices. Priority firm revenues are down due to warmer than average weather, which has reduced load shaping and demand revenues. US Treasury credits decreased due to lower replacement power purchase costs for fish mitigation purposes.
• Water behind the Columbia River Treaty Dams, including those in Canada, is recovering from releases made last spring and summer to offset dry year conditions. At this point, water storage is expected to reach normal levels by the end of the operating year.
• The expense forecast for the Second Quarter Review is $ 11 million lower than the First Quarter primarily due to delays in the Grand Coulee Overhaul. Lower expenses were offset by higher power purchases, Fish and Wildlife, and transmission acquisition expense.
B O N N E V I L L E P O W E R A D M I N I S T R A T I O N
APRIL 2016 QUARTERLY BUSINESS REVIEW
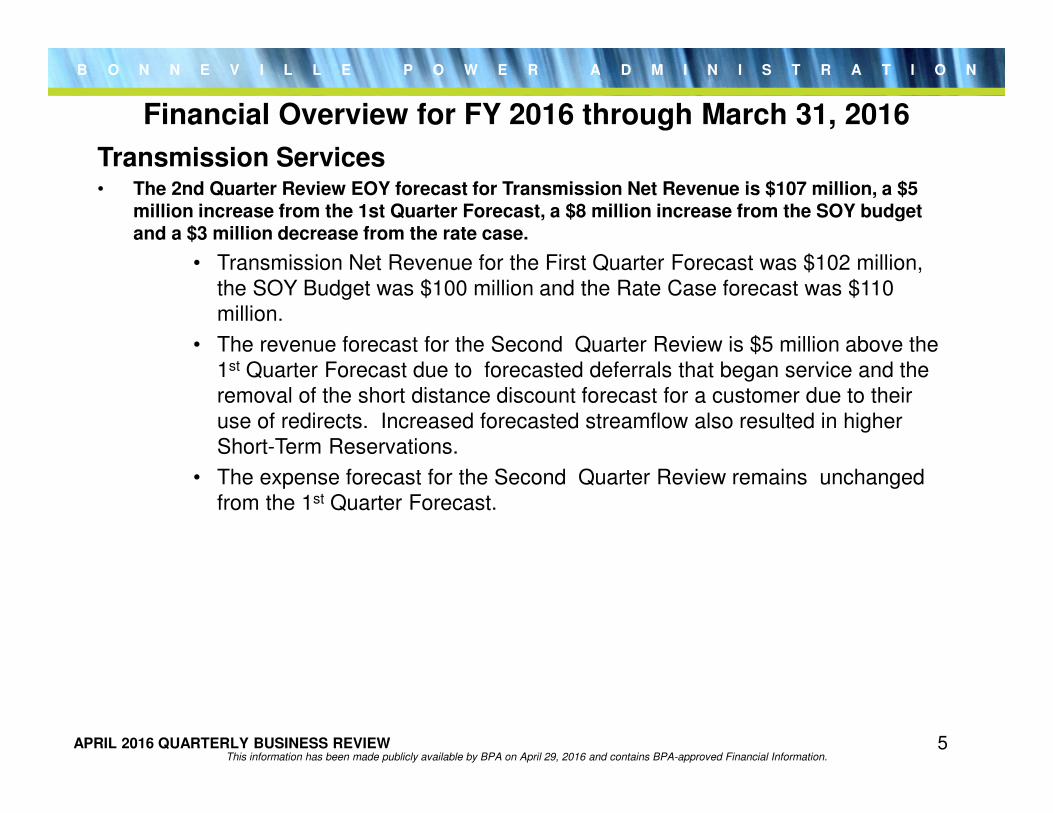
Financial Overview for FY 2016 through March 31, 2016
5This information has been made publicly available by BPA on April 29, 2016 and contains BPA-approved Financial Information.
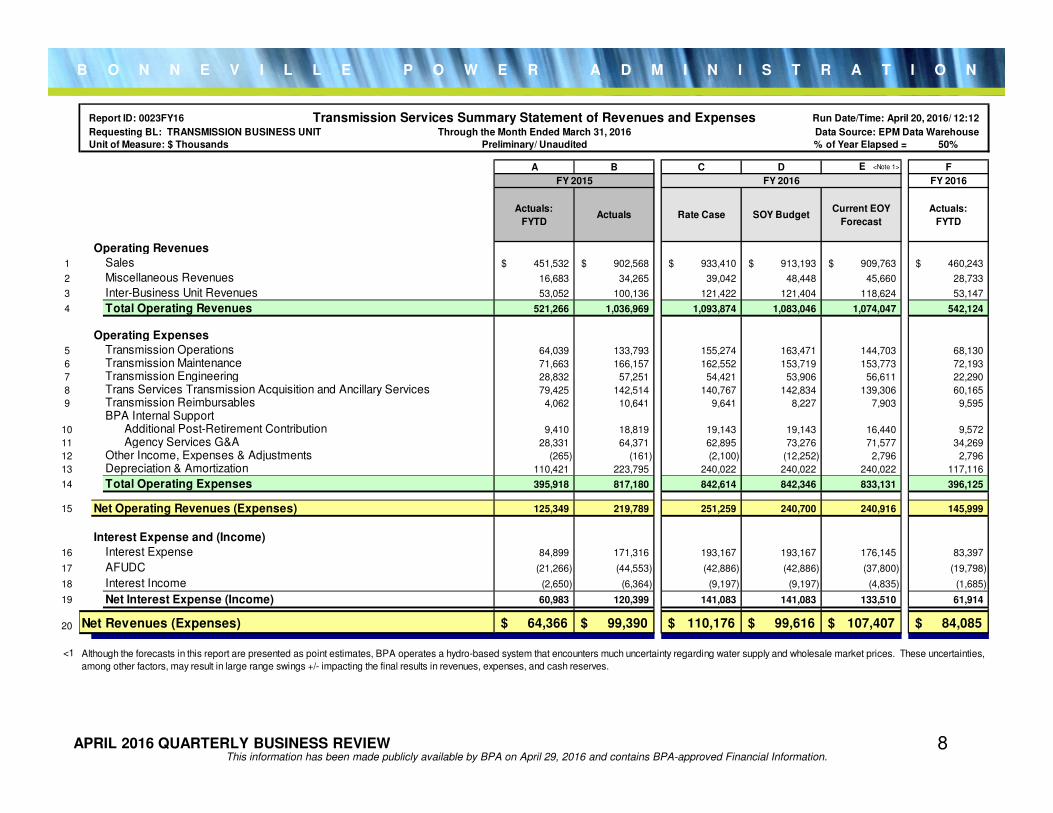
Transmission Services • The 2nd Quarter Review EOY forecast for Transmission Net Revenue is $107 million, a $5
million increase from the 1st Quarter Forecast, a $8 million increase from the SOY budget and a $3 million decrease from the rate case.
• Transmission Net Revenue for the First Quarter Forecast was $102 million, the SOY Budget was $100 million and the Rate Case forecast was $110 million.
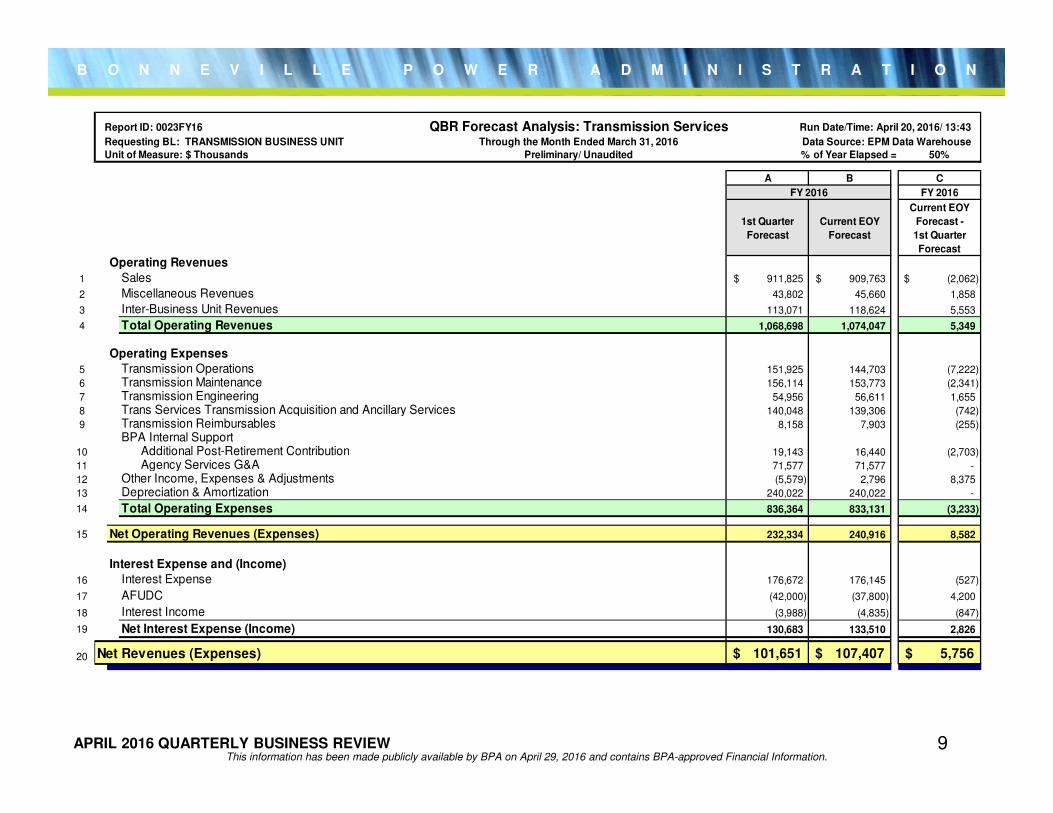
• The revenue forecast for the Second Quarter Review is $5 million above the 1st Quarter Forecast due to forecasted deferrals that began service and the removal of the short distance discount forecast for a customer due to their use of redirects. Increased forecasted streamflow also resulted in higher Short-Term Reservations.
• The expense forecast for the Second Quarter Review remains unchanged from the 1st Quarter Forecast.
B O N N E V I L L E P O W E R A D M I N I S T R A T I O N
APRIL 2016 QUARTERLY BUSINESS REVIEW 6This information has been made publicly available by BPA on April 29, 2016 and contains BPA-approved Financial Information.
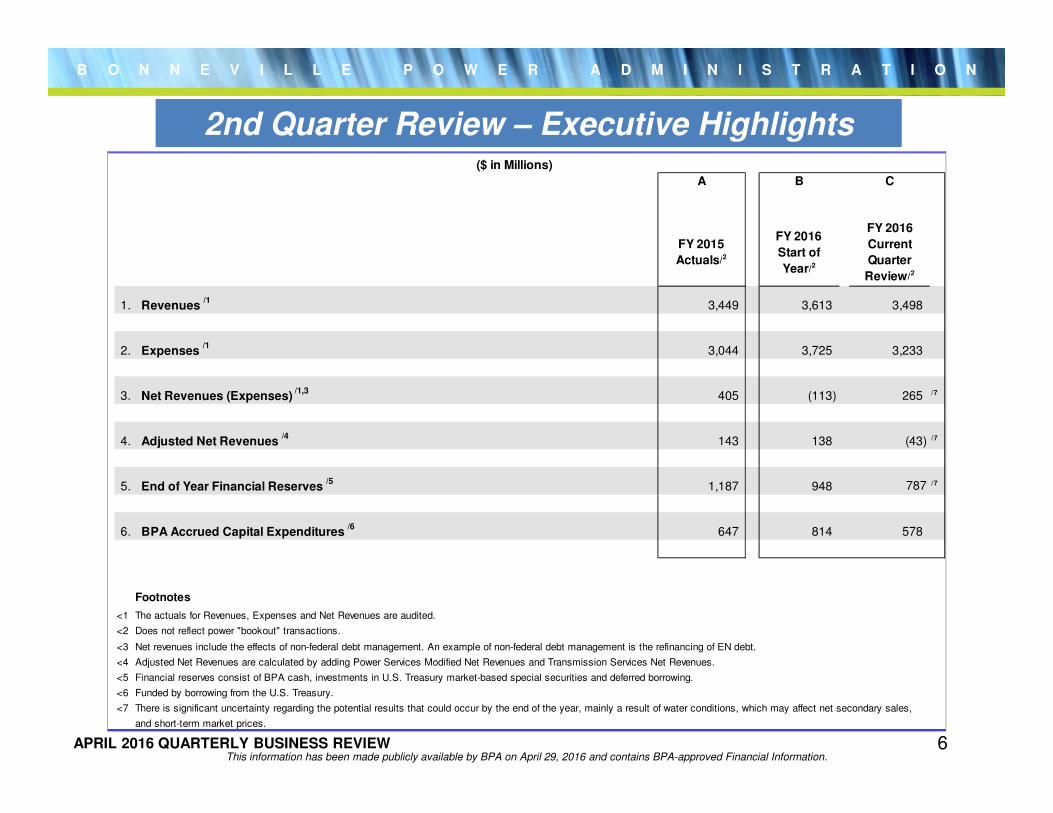
2nd Quarter Review – Executive Highlights($ in Millions)
A B C
FY 2015
Actuals/2
FY 2016
Start of
Year/2
FY 2016
Current
Quarter
Review/2
1. Revenues /1
3,449 3,613 3,498
2. Expenses /1
3,044 3,725 3,233
3. Net Revenues (Expenses) /1,3
405 (113) 265 /7
4. Adjusted Net Revenues /4
143 138 (43) /7
5. End of Year Financial Reserves /5
1,187 948 787 /7
6. BPA Accrued Capital Expenditures /6
647 814 578
Footnotes
<1 The actuals for Revenues, Expenses and Net Revenues are audited.
<2 Does not reflect power "bookout" transactions.
<3 Net revenues include the effects of non-federal debt management. An example of non-federal debt management is the refinancing of EN debt.
<4 Adjusted Net Revenues are calculated by adding Power Services Modified Net Revenues and Transmission Services Net Revenues.
<5 Financial reserves consist of BPA cash, investments in U.S. Treasury market-based special securities and deferred borrowing.
<6 Funded by borrowing from the U.S. Treasury.
<7 There is significant uncertainty regarding the potential results that could occur by the end of the year, mainly a result of water conditions, which may affect net secondary sales,
and short-term market prices.

B O N N E V I L L E P O W E R A D M I N I S T R A T I O N
APRIL 2016 QUARTERLY BUSINESS REVIEW
FY 2016 Second Quarter Financial Results & Second Quarter Forecast
7This information has been made publicly available by BPA on April 29, 2016 and contains BPA-approved Financial Information.
B O N N E V I L L E P O W E R A D M I N I S T R A T I O N
APRIL 2016 QUARTERLY BUSINESS REVIEW 8This information has been made publicly available by BPA on April 29, 2016 and contains BPA-approved Financial Information.
Report ID: 0023FY16 Transmission Services Summary Statement of Revenues and Expenses Run Date/Time: April 20, 2016/ 12:12
Requesting BL: TRANSMISSION BUSINESS UNIT Through the Month Ended March 31, 2016 Data Source: EPM Data Warehouse
Unit of Measure: $ Thousands Preliminary/ Unaudited % of Year Elapsed = 50%
A B C D E <Note 1> F
FY 2016
Actuals:
FYTDActuals Rate Case SOY Budget
Current EOY
Forecast
Actuals:
FYTD
Operating Revenues
1 Sales 451,532$ 902,568$ 933,410$ 913,193$ 909,763$ 460,243$
2 Miscellaneous Revenues 16,683 34,265 39,042 48,448 45,660 28,733
3 Inter-Business Unit Revenues 53,052 100,136 121,422 121,404 118,624 53,147
4 Total Operating Revenues 521,266 1,036,969 1,093,874 1,083,046 1,074,047 542,124
Operating Expenses
5 Transmission Operations 64,039 133,793 155,274 163,471 144,703 68,130
6 Transmission Maintenance 71,663 166,157 162,552 153,719 153,773 72,193
7 Transmission Engineering 28,832 57,251 54,421 53,906 56,611 22,290
8 Trans Services Transmission Acquisition and Ancillary Services 79,425 142,514 140,767 142,834 139,306 60,165
9 Transmission Reimbursables 4,062 10,641 9,641 8,227 7,903 9,595
BPA Internal Support10 Additional Post-Retirement Contribution 9,410 18,819 19,143 19,143 16,440 9,572
11 Agency Services G&A 28,331 64,371 62,895 73,276 71,577 34,269
12 Other Income, Expenses & Adjustments (265) (161) (2,100) (12,252) 2,796 2,796
13 Depreciation & Amortization 110,421 223,795 240,022 240,022 240,022 117,116
14 Total Operating Expenses 395,918 817,180 842,614 842,346 833,131 396,125
15 Net Operating Revenues (Expenses) 125,349 219,789 251,259 240,700 240,916 145,999
Interest Expense and (Income)
16 Interest Expense 84,899 171,316 193,167 193,167 176,145 83,397
17 AFUDC (21,266) (44,553) (42,886) (42,886) (37,800) (19,798)
18 Interest Income (2,650) (6,364) (9,197) (9,197) (4,835) (1,685)
19 Net Interest Expense (Income) 60,983 120,399 141,083 141,083 133,510 61,914
20 Net Revenues (Expenses) 64,366$ 99,390$ 110,176$ 99,616$ 107,407$ 84,085$
<1 Although the forecasts in this report are presented as point estimates, BPA operates a hydro-based system that encounters much uncertainty regarding water supply and wholesale market prices. These uncertainties,
among other factors, may result in large range swings +/- impacting the final results in revenues, expenses, and cash reserves.
FY 2015 FY 2016
B O N N E V I L L E P O W E R A D M I N I S T R A T I O N
APRIL 2016 QUARTERLY BUSINESS REVIEW 9This information has been made publicly available by BPA on April 29, 2016 and contains BPA-approved Financial Information.
Report ID: 0023FY16 QBR Forecast Analysis: Transmission Services Run Date/Time: April 20, 2016/ 13:43
Requesting BL: TRANSMISSION BUSINESS UNIT Through the Month Ended March 31, 2016 Data Source: EPM Data Warehouse
Unit of Measure: $ Thousands Preliminary/ Unaudited % of Year Elapsed = 50%
A B C
FY 2016
1st Quarter
Forecast
Current EOY
Forecast
Current EOY
Forecast -
1st Quarter
Forecast
Operating Revenues
1 Sales 911,825$ 909,763$ (2,062)$
2 Miscellaneous Revenues 43,802 45,660 1,858
3 Inter-Business Unit Revenues 113,071 118,624 5,553
4 Total Operating Revenues 1,068,698 1,074,047 5,349
Operating Expenses
5 Transmission Operations 151,925 144,703 (7,222)
6 Transmission Maintenance 156,114 153,773 (2,341)
7 Transmission Engineering 54,956 56,611 1,655
8 Trans Services Transmission Acquisition and Ancillary Services 140,048 139,306 (742)
9 Transmission Reimbursables 8,158 7,903 (255)
BPA Internal Support10 Additional Post-Retirement Contribution 19,143 16,440 (2,703)
11 Agency Services G&A 71,577 71,577 -
12 Other Income, Expenses & Adjustments (5,579) 2,796 8,375
13 Depreciation & Amortization 240,022 240,022 -
14 Total Operating Expenses 836,364 833,131 (3,233)
15 Net Operating Revenues (Expenses) 232,334 240,916 8,582
Interest Expense and (Income)
16 Interest Expense 176,672 176,145 (527)
17 AFUDC (42,000) (37,800) 4,200
18 Interest Income (3,988) (4,835) (847)
19 Net Interest Expense (Income) 130,683 133,510 2,826
20 Net Revenues (Expenses) 101,651$ 107,407$ 5,756$
FY 2016
B O N N E V I L L E P O W E R A D M I N I S T R A T I O N
APRIL 2016 QUARTERLY BUSINESS REVIEW 10This information has been made publicly available by BPA on April 29, 2016 and contains BPA-approved Financial Information.
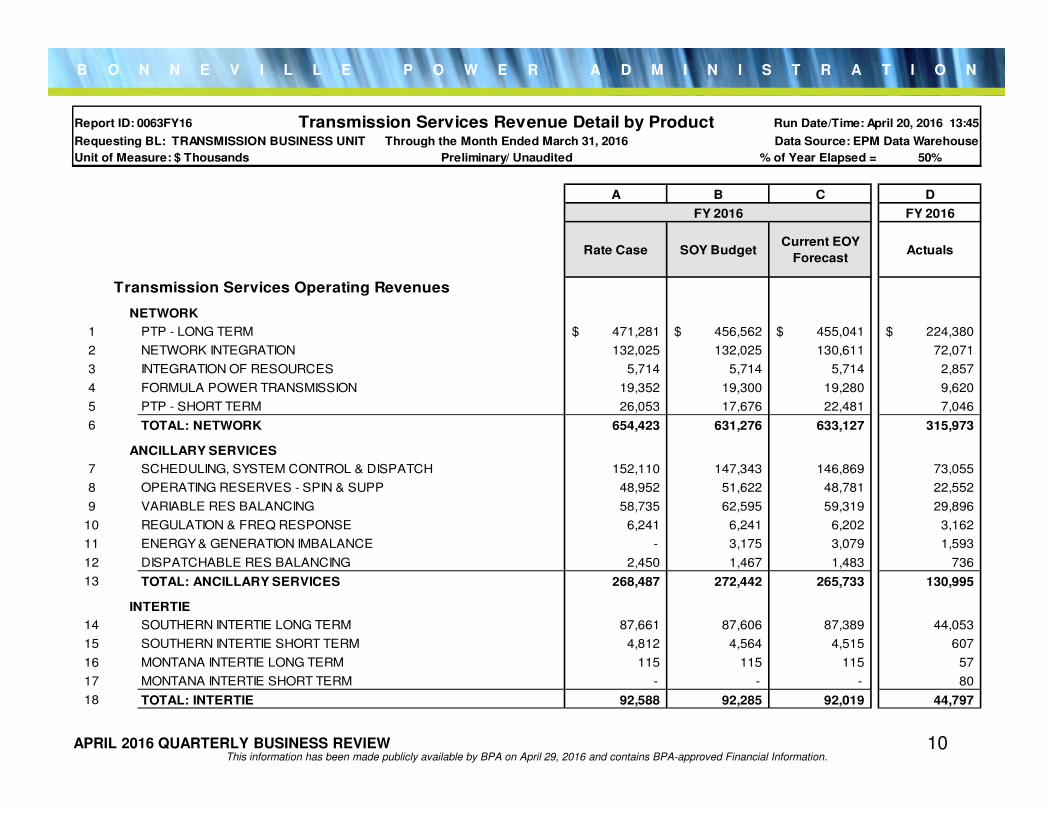
Report ID: 0063FY16 Transmission Services Revenue Detail by Product Run Date/Time: April 20, 2016 13:45
Requesting BL: TRANSMISSION BUSINESS UNIT Through the Month Ended March 31, 2016 Data Source: EPM Data Warehouse
Unit of Measure: $ Thousands Preliminary/ Unaudited % of Year Elapsed = 50%
A B C D
Rate Case SOY BudgetCurrent EOY
ForecastActuals
Transmission Services Operating Revenues
NETWORK
1 PTP - LONG TERM 471,281$ 456,562$ 455,041$ 224,380$
2 NETWORK INTEGRATION 132,025 132,025 130,611 72,071
3 INTEGRATION OF RESOURCES 5,714 5,714 5,714 2,857
4 FORMULA POWER TRANSMISSION 19,352 19,300 19,280 9,620
5 PTP - SHORT TERM 26,053 17,676 22,481 7,046
6 TOTAL: NETWORK 654,423 631,276 633,127 315,973
ANCILLARY SERVICES
7 SCHEDULING, SYSTEM CONTROL & DISPATCH 152,110 147,343 146,869 73,055
8 OPERATING RESERVES - SPIN & SUPP 48,952 51,622 48,781 22,552
9 VARIABLE RES BALANCING 58,735 62,595 59,319 29,896
10 REGULATION & FREQ RESPONSE 6,241 6,241 6,202 3,162
11 ENERGY & GENERATION IMBALANCE - 3,175 3,079 1,593
12 DISPATCHABLE RES BALANCING 2,450 1,467 1,483 736
13 TOTAL: ANCILLARY SERVICES 268,487 272,442 265,733 130,995
INTERTIE
14 SOUTHERN INTERTIE LONG TERM 87,661 87,606 87,389 44,053
15 SOUTHERN INTERTIE SHORT TERM 4,812 4,564 4,515 607
16 MONTANA INTERTIE LONG TERM 115 115 115 57
17 MONTANA INTERTIE SHORT TERM - - - 80
18 TOTAL: INTERTIE 92,588 92,285 92,019 44,797
FY 2016 FY 2016
B O N N E V I L L E P O W E R A D M I N I S T R A T I O N
APRIL 2016 QUARTERLY BUSINESS REVIEW 11This information has been made publicly available by BPA on April 29, 2016 and contains BPA-approved Financial Information.
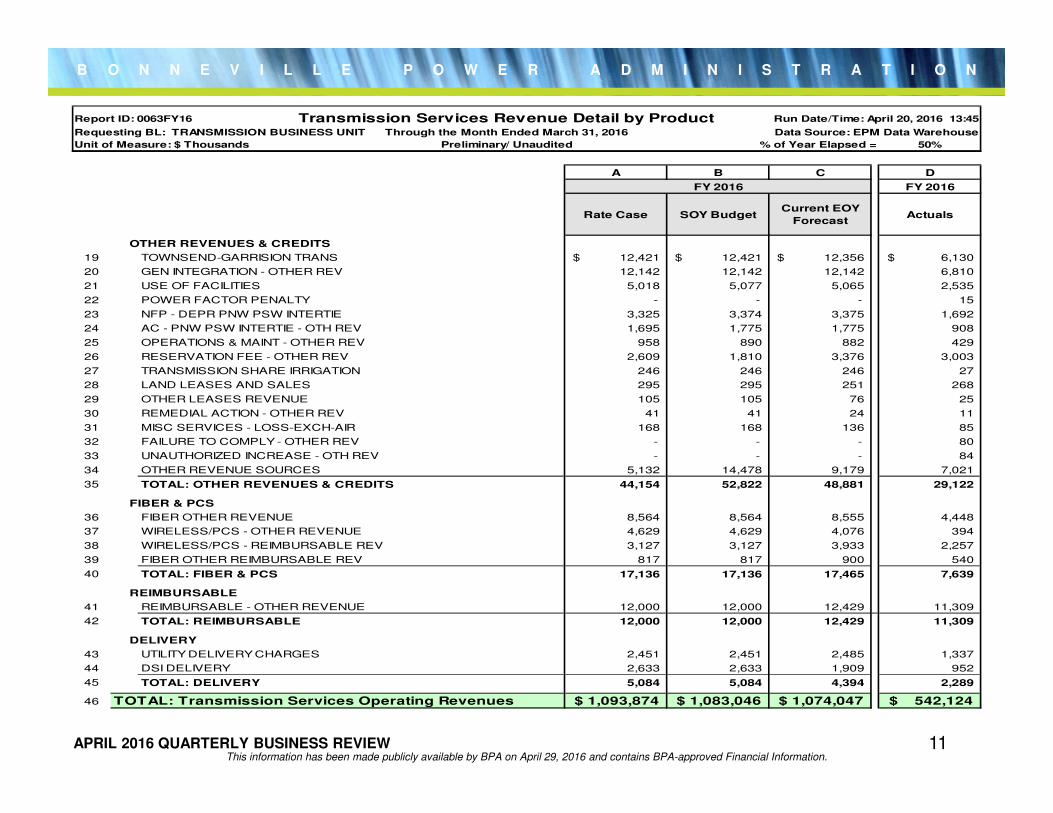
Report ID: 0063FY16 Transmission Services Revenue Detail by Product Run Date/Time: April 20, 2016 13:45
Requesting BL: TRANSMISSION BUSINESS UNIT Through the Month Ended March 31, 2016 Data Source: EPM Data Warehouse
Unit of Measure: $ Thousands Preliminary/ Unaudited % of Year Elapsed = 50%
A B C D
Rate Case SOY BudgetCurrent EOY
ForecastActuals
OTHER REVENUES & CREDITS
19 TOWNSEND-GARRISION TRANS 12,421$ 12,421$ 12,356$ 6,130$
20 GEN INTEGRATION - OTHER REV 12,142 12,142 12,142 6,810
21 USE OF FACILITIES 5,018 5,077 5,065 2,535
22 POWER FACTOR PENALTY - - - 15
23 NFP - DEPR PNW PSW INTERTIE 3,325 3,374 3,375 1,692
24 AC - PNW PSW INTERTIE - OTH REV 1,695 1,775 1,775 908
25 OPERATIONS & MAINT - OTHER REV 958 890 882 429
26 RESERVATION FEE - OTHER REV 2,609 1,810 3,376 3,003
27 TRANSMISSION SHARE IRRIGATION 246 246 246 27
28 LAND LEASES AND SALES 295 295 251 268
29 OTHER LEASES REVENUE 105 105 76 25
30 REMEDIAL ACTION - OTHER REV 41 41 24 11
31 MISC SERVICES - LOSS-EXCH-AIR 168 168 136 85
32 FAILURE TO COMPLY - OTHER REV - - - 80
33 UNAUTHORIZED INCREASE - OTH REV - - - 84
34 OTHER REVENUE SOURCES 5,132 14,478 9,179 7,021
35 TOTAL: OTHER REVENUES & CREDITS 44,154 52,822 48,881 29,122
FIBER & PCS
36 FIBER OTHER REVENUE 8,564 8,564 8,555 4,448
37 WIRELESS/PCS - OTHER REVENUE 4,629 4,629 4,076 394
38 WIRELESS/PCS - REIMBURSABLE REV 3,127 3,127 3,933 2,257
39 FIBER OTHER REIMBURSABLE REV 817 817 900 540
40 TOTAL: FIBER & PCS 17,136 17,136 17,465 7,639
REIMBURSABLE
41 REIMBURSABLE - OTHER REVENUE 12,000 12,000 12,429 11,309
42 TOTAL: REIMBURSABLE 12,000 12,000 12,429 11,309
DELIVERY
43 UTILITY DELIVERY CHARGES 2,451 2,451 2,485 1,337
44 DSI DELIVERY 2,633 2,633 1,909 952
45 TOTAL: DELIVERY 5,084 5,084 4,394 2,289
46 TOTAL: Transmission Services Operating Revenues 1,093,874$ 1,083,046$ 1,074,047$ 542,124$
FY 2016 FY 2016
B O N N E V I L L E P O W E R A D M I N I S T R A T I O N
APRIL 2016 QUARTERLY BUSINESS REVIEW 12This information has been made publicly available by BPA on April 29, 2016 and contains BPA-approved Financial Information.
Report ID: 0021FY16 Power Services Summary Statement of Revenues and Expenses Run Date/Time: April 20, 2016 13:42
Requesting BL: POWER BUSINESS UNIT Through the Month Ended March 31, 2016 Data Source: EPM Data Warehouse
Unit of measure: $ Thousands Preliminary/ Unaudited % of Year Elapsed = 50%
A B C D E <Note 1 F
FY 2016
Actuals:
FYTDActuals Rate Case SOY Budget
Current EOY
Forecast
Actuals:
FYTD
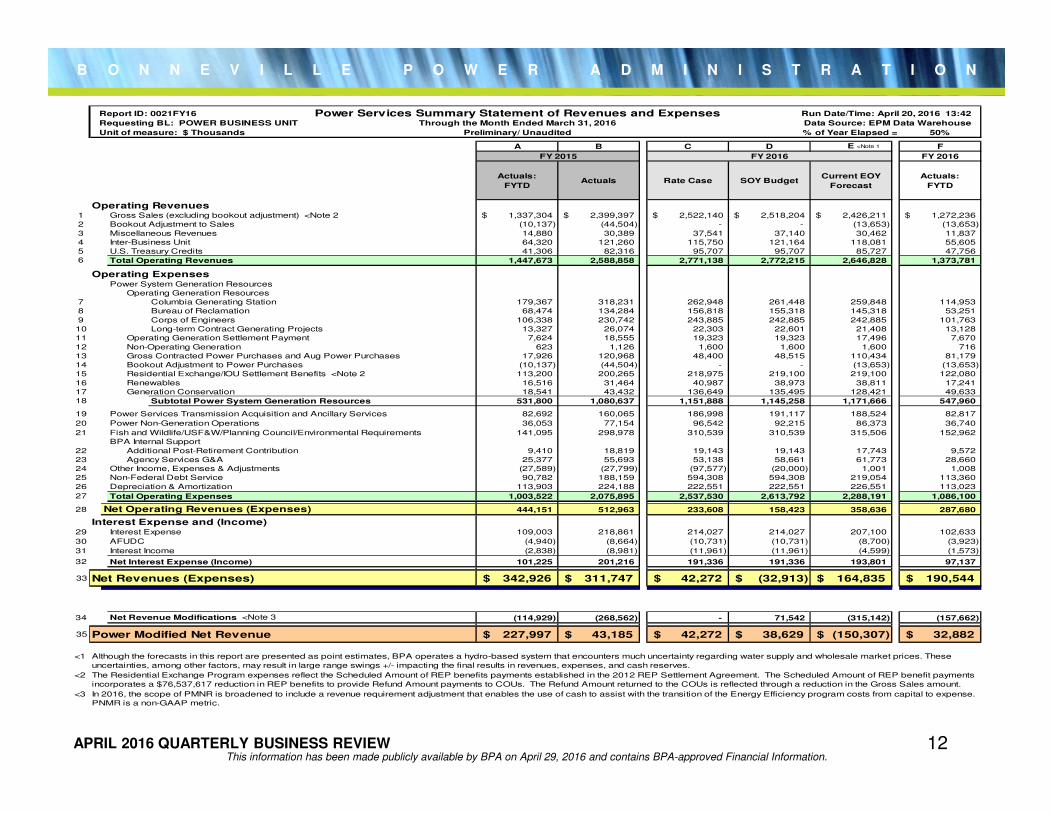
Operating Revenues1 Gross Sales (excluding bookout adjustment) <Note 2 1,337,304$ 2,399,397$ 2,522,140$ 2,518,204$ 2,426,211$ 1,272,236$
2 Bookout Adjustment to Sales (10,137) (44,504) - - (13,653) (13,653)
3 Miscellaneous Revenues 14,880 30,389 37,541 37,140 30,462 11,837
4 Inter-Business Unit 64,320 121,260 115,750 121,164 118,081 55,605
5 U.S. Treasury Credits 41,306 82,316 95,707 95,707 85,727 47,756
6 Total Operating Revenues 1,447,673 2,588,858 2,771,138 2,772,215 2,646,828 1,373,781
Operating ExpensesPower System Generation Resources
Operating Generation Resources
7 Columbia Generating Station 179,367 318,231 262,948 261,448 259,848 114,953
8 Bureau of Reclamation 68,474 134,284 156,818 155,318 145,318 53,251
9 Corps of Engineers 106,338 230,742 243,885 242,885 242,885 101,763
10 Long-term Contract Generating Projects 13,327 26,074 22,303 22,601 21,408 13,128
11 Operating Generation Settlement Payment 7,624 18,555 19,323 19,323 17,496 7,670
12 Non-Operating Generation 623 1,126 1,600 1,600 1,600 716
13 Gross Contracted Power Purchases and Aug Power Purchases 17,926 120,968 48,400 48,515 110,434 81,179
14 Bookout Adjustment to Power Purchases (10,137) (44,504) - - (13,653) (13,653)
15 Residential Exchange/IOU Settlement Benefits <Note 2 113,200 200,265 218,975 219,100 219,100 122,080
16 Renewables 16,516 31,464 40,987 38,973 38,811 17,241
17 Generation Conservation 18,541 43,432 136,649 135,495 128,421 49,633
18 Subtotal Power System Generation Resources 531,800 1,080,637 1,151,888 1,145,258 1,171,666 547,960
19 Power Services Transmission Acquisition and Ancillary Services 82,692 160,065 186,998 191,117 188,524 82,817
20 Power Non-Generation Operations 36,053 77,154 96,542 92,215 86,373 36,740
21 Fish and Wildlife/USF&W/Planning Council/Environmental Requirements 141,095 298,978 310,539 310,539 315,506 152,962
BPA Internal Support
22 Additional Post-Retirement Contribution 9,410 18,819 19,143 19,143 17,743 9,572
23 Agency Services G&A 25,377 55,693 53,138 58,661 61,773 28,660
24 Other Income, Expenses & Adjustments (27,589) (27,799) (97,577) (20,000) 1,001 1,008
25 Non-Federal Debt Service 90,782 188,159 594,308 594,308 219,054 113,360
26 Depreciation & Amortization 113,903 224,188 222,551 222,551 226,551 113,023
27 Total Operating Expenses 1,003,522 2,075,895 2,537,530 2,613,792 2,288,191 1,086,100
28 Net Operating Revenues (Expenses) 444,151 512,963 233,608 158,423 358,636 287,680
Interest Expense and (Income)29 Interest Expense 109,003 218,861 214,027 214,027 207,100 102,633
30 AFUDC (4,940) (8,664) (10,731) (10,731) (8,700) (3,923)
31 Interest Income (2,838) (8,981) (11,961) (11,961) (4,599) (1,573)
32 Net Interest Expense (Income) 101,225 201,216 191,336 191,336 193,801 97,137
33 Net Revenues (Expenses) 342,926$ 311,747$ 42,272$ (32,913)$ 164,835$ 190,544$
34 Net Revenue Modifications <Note 3 (114,929) (268,562) - 71,542 (315,142) (157,662)
35 Power Modified Net Revenue 227,997$ 43,185$ 42,272$ 38,629$ (150,307)$ 32,882$
<1
<2
<3 In 2016, the scope of PMNR is broadened to include a revenue requirement adjustment that enables the use of cash to assist with the transition of the Energy Efficiency program costs from capital to expense.
PNMR is a non-GAAP metric.
Although the forecasts in this report are presented as point estimates, BPA operates a hydro-based system that encounters much uncertainty regarding water supply and wholesale market prices. These
uncertainties, among other factors, may result in large range swings +/- impacting the final results in revenues, expenses, and cash reserves.
The Residential Exchange Program expenses reflect the Scheduled Amount of REP benefits payments established in the 2012 REP Settlement Agreement. The Scheduled Amount of REP benefit payments
incorporates a $76,537,617 reduction in REP benefits to provide Refund Amount payments to COUs. The Refund Amount returned to the COUs is reflected through a reduction in the Gross Sales amount.
FY 2015 FY 2016
B O N N E V I L L E P O W E R A D M I N I S T R A T I O N
APRIL 2016 QUARTERLY BUSINESS REVIEW 13This information has been made publicly available by BPA on April 29, 2016 and contains BPA-approved Financial Information.
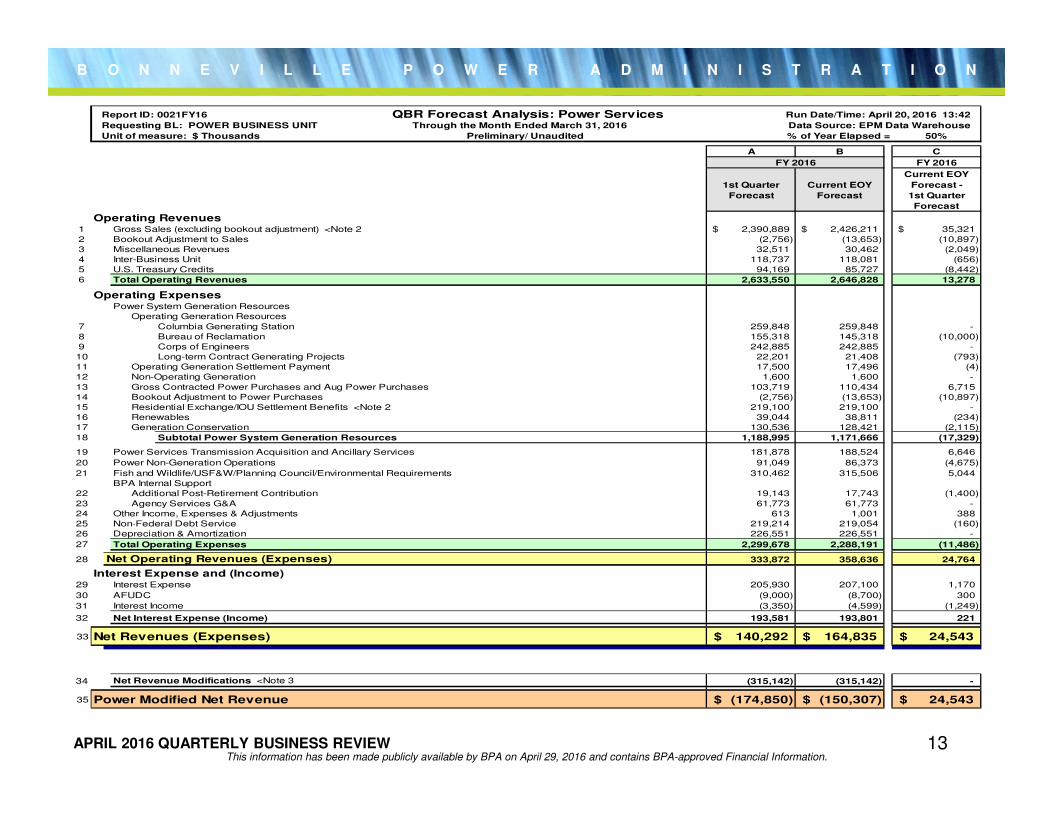
Report ID: 0021FY16 QBR Forecast Analysis: Power Services Run Date/Time: April 20, 2016 13:42
Requesting BL: POWER BUSINESS UNIT Through the Month Ended March 31, 2016 Data Source: EPM Data Warehouse
Unit of measure: $ Thousands Preliminary/ Unaudited % of Year Elapsed = 50%
A B C
FY 2016
1st Quarter
Forecast
Current EOY
Forecast
Current EOY
Forecast -
1st Quarter
Forecast
Operating Revenues1 Gross Sales (excluding bookout adjustment) <Note 2 2,390,889$ 2,426,211$ 35,321$
2 Bookout Adjustment to Sales (2,756) (13,653) (10,897)
3 Miscellaneous Revenues 32,511 30,462 (2,049)
4 Inter-Business Unit 118,737 118,081 (656)
5 U.S. Treasury Credits 94,169 85,727 (8,442)
6 Total Operating Revenues 2,633,550 2,646,828 13,278
Operating ExpensesPower System Generation Resources
Operating Generation Resources
7 Columbia Generating Station 259,848 259,848 -
8 Bureau of Reclamation 155,318 145,318 (10,000)
9 Corps of Engineers 242,885 242,885 -
10 Long-term Contract Generating Projects 22,201 21,408 (793)
11 Operating Generation Settlement Payment 17,500 17,496 (4)
12 Non-Operating Generation 1,600 1,600 -
13 Gross Contracted Power Purchases and Aug Power Purchases 103,719 110,434 6,715
14 Bookout Adjustment to Power Purchases (2,756) (13,653) (10,897)
15 Residential Exchange/IOU Settlement Benefits <Note 2 219,100 219,100 -
16 Renewables 39,044 38,811 (234)
17 Generation Conservation 130,536 128,421 (2,115)
18 Subtotal Power System Generation Resources 1,188,995 1,171,666 (17,329)
19 Power Services Transmission Acquisition and Ancillary Services 181,878 188,524 6,646
20 Power Non-Generation Operations 91,049 86,373 (4,675)
21 Fish and Wildlife/USF&W/Planning Council/Environmental Requirements 310,462 315,506 5,044
BPA Internal Support
22 Additional Post-Retirement Contribution 19,143 17,743 (1,400)
23 Agency Services G&A 61,773 61,773 -
24 Other Income, Expenses & Adjustments 613 1,001 388
25 Non-Federal Debt Service 219,214 219,054 (160)
26 Depreciation & Amortization 226,551 226,551 -
27 Total Operating Expenses 2,299,678 2,288,191 (11,486)
28 Net Operating Revenues (Expenses) 333,872 358,636 24,764- - -
Interest Expense and (Income)29 Interest Expense 205,930 207,100 1,170
30 AFUDC (9,000) (8,700) 300
31 Interest Income (3,350) (4,599) (1,249)
32 Net Interest Expense (Income) 193,581 193,801 221
33 Net Revenues (Expenses) 140,292$ 164,835$ 24,543$
34 Net Revenue Modifications <Note 3 (315,142) (315,142) -
35 Power Modified Net Revenue (174,850)$ (150,307)$ 24,543$
FY 2016
B O N N E V I L L E P O W E R A D M I N I S T R A T I O N
APRIL 2016 QUARTERLY BUSINESS REVIEW 14This information has been made publicly available by BPA on April 29, 2016 and contains BPA-approved Financial Information.
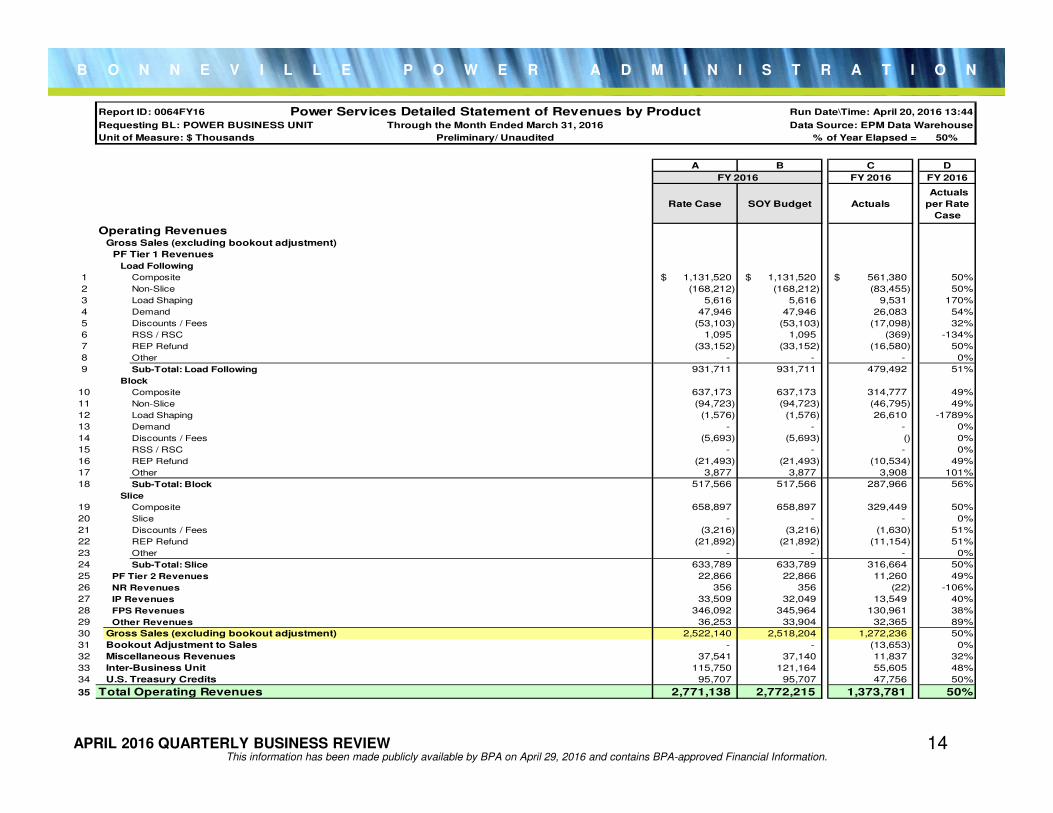
Report ID: 0064FY16 Power Services Detailed Statement of Revenues by Product Run Date\Time: April 20, 2016 13:44
Requesting BL: POWER BUSINESS UNIT Through the Month Ended March 31, 2016 Data Source: EPM Data Warehouse
Unit of Measure: $ Thousands Preliminary/ Unaudited % of Year Elapsed = 50%
A B C D
FY 2016 FY 2016
Rate Case SOY Budget Actuals
Actuals
per Rate
Case
Operating RevenuesGross Sales (excluding bookout adjustment)
PF Tier 1 Revenues
Load Following
1 Composite 1,131,520$ 1,131,520$ 561,380$ 50%
2 Non-Slice (168,212) (168,212) (83,455) 50%
3 Load Shaping 5,616 5,616 9,531 170%
4 Demand 47,946 47,946 26,083 54%
5 Discounts / Fees (53,103) (53,103) (17,098) 32%
6 RSS / RSC 1,095 1,095 (369) -134%
7 REP Refund (33,152) (33,152) (16,580) 50%
8 Other - - - 0%
9 Sub-Total: Load Following 931,711 931,711 479,492 51%
Block
10 Composite 637,173 637,173 314,777 49%
11 Non-Slice (94,723) (94,723) (46,795) 49%
12 Load Shaping (1,576) (1,576) 26,610 -1789%
13 Demand - - - 0%
14 Discounts / Fees (5,693) (5,693) () 0%
15 RSS / RSC - - - 0%
16 REP Refund (21,493) (21,493) (10,534) 49%
17 Other 3,877 3,877 3,908 101%
18 Sub-Total: Block 517,566 517,566 287,966 56%
Slice
19 Composite 658,897 658,897 329,449 50%
20 Slice - - - 0%
21 Discounts / Fees (3,216) (3,216) (1,630) 51%
22 REP Refund (21,892) (21,892) (11,154) 51%
23 Other - - - 0%
24 Sub-Total: Slice 633,789 633,789 316,664 50%
25 PF Tier 2 Revenues 22,866 22,866 11,260 49%
26 NR Revenues 356 356 (22) -106%
27 IP Revenues 33,509 32,049 13,549 40%
28 FPS Revenues 346,092 345,964 130,961 38%
29 Other Revenues 36,253 33,904 32,365 89%
30 Gross Sales (excluding bookout adjustment) 2,522,140 2,518,204 1,272,236 50%
31 Bookout Adjustment to Sales - - (13,653) 0%
32 Miscellaneous Revenues 37,541 37,140 11,837 32%
33 Inter-Business Unit 115,750 121,164 55,605 48%
34 U.S. Treasury Credits 95,707 95,707 47,756 50%
35 Total Operating Revenues 2,771,138 2,772,215 1,373,781 50%
FY 2016
B O N N E V I L L E P O W E R A D M I N I S T R A T I O N
APRIL 2016 QUARTERLY BUSINESS REVIEW
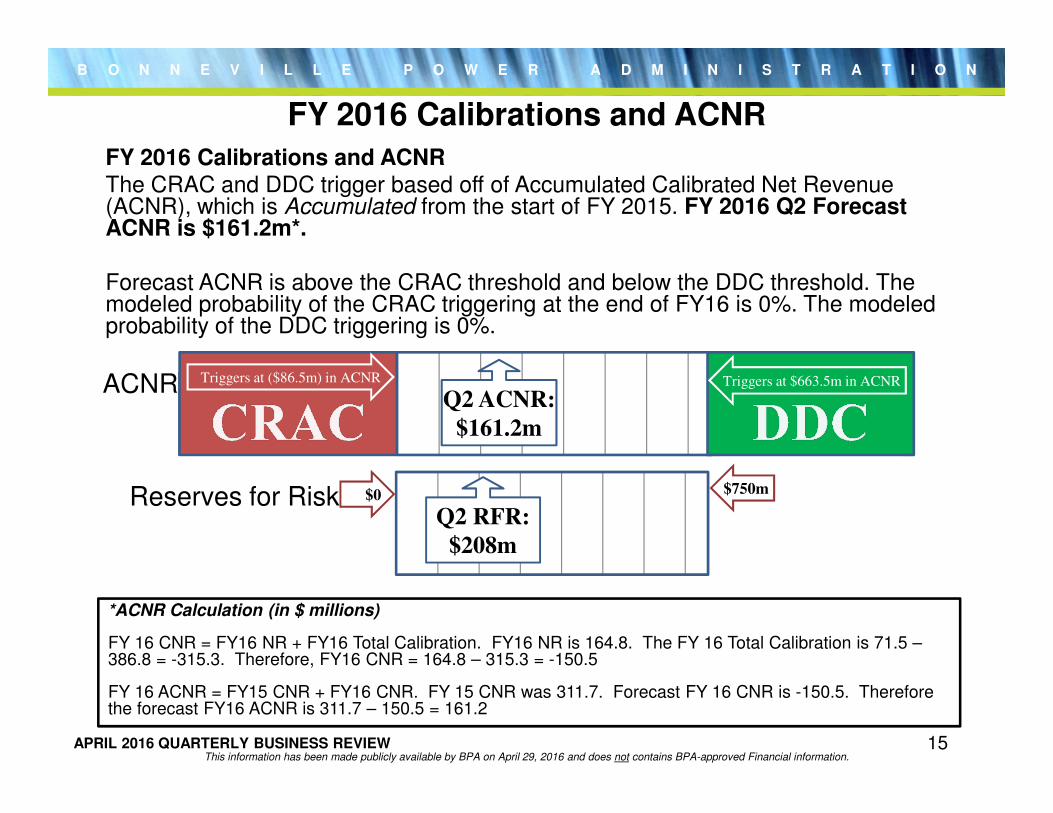
FY 2016 Calibrations and ACNRThe CRAC and DDC trigger based off of Accumulated Calibrated Net Revenue (ACNR), which is Accumulated from the start of FY 2015. FY 2016 Q2 Forecast ACNR is $161.2m*.
Forecast ACNR is above the CRAC threshold and below the DDC threshold. The modeled probability of the CRAC triggering at the end of FY16 is 0%. The modeled probability of the DDC triggering is 0%.
FY 2016 Calibrations and ACNR
Triggers at ($86.5m) in ACNR Triggers at $663.5m in ACNR
Q2 ACNR:
$161.2m
ACNR
Q2 RFR:
$208m
Reserves for Risk $0 $750m
*ACNR Calculation (in $ millions)
FY 16 CNR = FY16 NR + FY16 Total Calibration. FY16 NR is 164.8. The FY 16 Total Calibration is 71.5 –386.8 = -315.3. Therefore, FY16 CNR = 164.8 – 315.3 = -150.5
FY 16 ACNR = FY15 CNR + FY16 CNR. FY 15 CNR was 311.7. Forecast FY 16 CNR is -150.5. Therefore the forecast FY16 ACNR is 311.7 – 150.5 = 161.2
This information has been made publicly available by BPA on April 29, 2016 and does not contains BPA-approved Financial information.15
B O N N E V I L L E P O W E R A D M I N I S T R A T I O N
APRIL 2016 QUARTERLY BUSINESS REVIEW
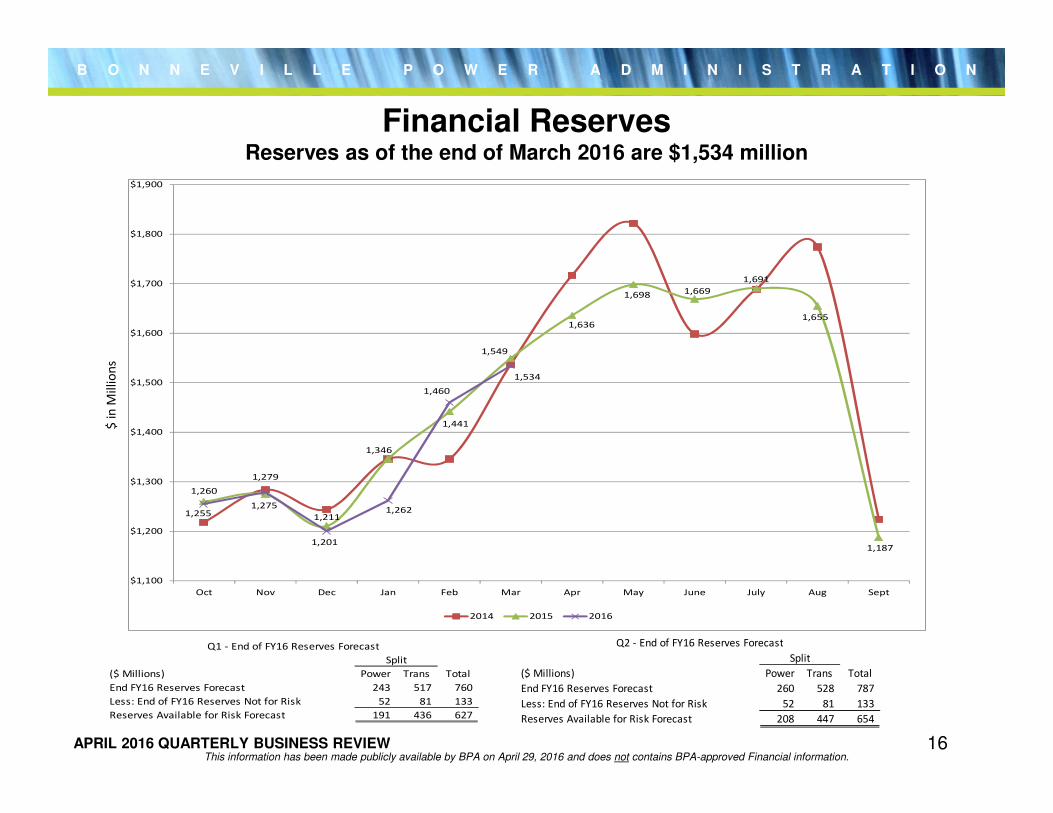
Financial ReservesReserves as of the end of March 2016 are $1,534 million
$ in
Mill
ion
s
16
($ Millions) Power Trans Total
End FY16 Reserves Forecast 243 517 760
Less: End of FY16 Reserves Not for Risk 52 81 133
Reserves Available for Risk Forecast 191 436 627
Q1 - End of FY16 Reserves Forecast
Split
This information has been made publicly available by BPA on April 29, 2016 and does not contains BPA-approved Financial information.
1,260
1,275
1,211
1,346
1,441
1,549
1,636
1,698 1,669
1,691
1,655
1,187
1,255
1,279
1,201
1,262
1,460
1,534
$1,100
$1,200
$1,300
$1,400
$1,500
$1,600
$1,700
$1,800
$1,900
Oct Nov Dec Jan Feb Mar Apr May June July Aug Sept
2014 2015 2016
($ Millions) Power Trans Total
End FY16 Reserves Forecast 260 528 787
Less: End of FY16 Reserves Not for Risk 52 81 133
Reserves Available for Risk Forecast 208 447 654
Q2 - End of FY16 Reserves Forecast
Split
B O N N E V I L L E P O W E R A D M I N I S T R A T I O N
APRIL 2016 QUARTERLY BUSINESS REVIEW
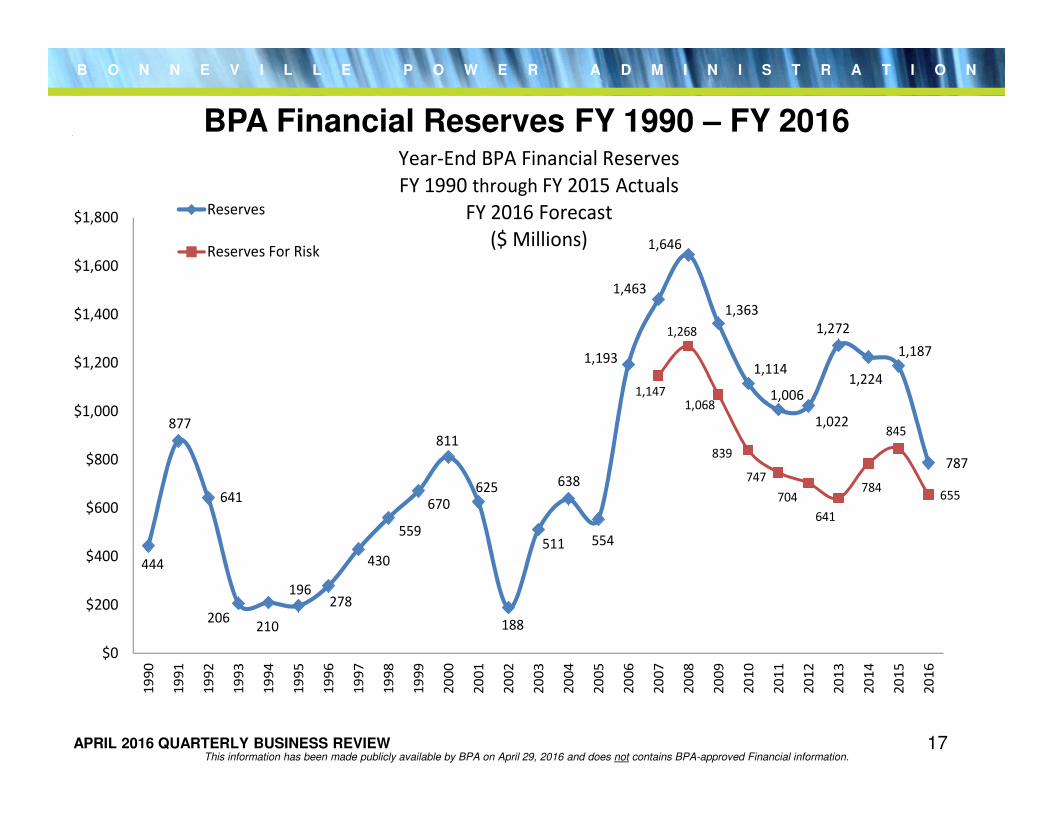
BPA Financial Reserves FY 1990 – FY 2016
17This information has been made publicly available by BPA on April 29, 2016 and does not contains BPA-approved Financial information.
444
877
641
206 210
196 278
430
559
670
811
625
188
511
638
554
1,193
1,463
1,646
1,363
1,114
1,006
1,022
1,224
1,272
1,187
787
1,147
1,268
1,068
839
747
704
641
784
845
655
$0
$200
$400
$600
$800
$1,000
$1,200
$1,400
$1,600
$1,800
19
90
19
91
19
92
19
93
19
94
19
95
19
96
19
97
19
98
19
99
20
00
20
01
20
02
20
03
20
04
20
05
20
06
20
07
20
08
20
09
20
10
20
11
20
12
20
13
20
14
20
15
20
16
Reserves
Reserves For Risk
Year-End BPA Financial Reserves
FY 1990 through FY 2015 Actuals
FY 2016 Forecast
($ Millions)

B O N N E V I L L E P O W E R A D M I N I S T R A T I O N
APRIL 2016 QUARTERLY BUSINESS REVIEW
FY 2016 Second Quarter Capital Financial Results & First Quarter Forecast
18This information has been made publicly available by BPA on April 29, 2016 and contains BPA-approved Financial Information.
B O N N E V I L L E P O W E R A D M I N I S T R A T I O N
APRIL 2016 QUARTERLY BUSINESS REVIEWThis information has been made publicly available by BPA on April 29, 2016 and contains BPA-approved Financial Information.
19
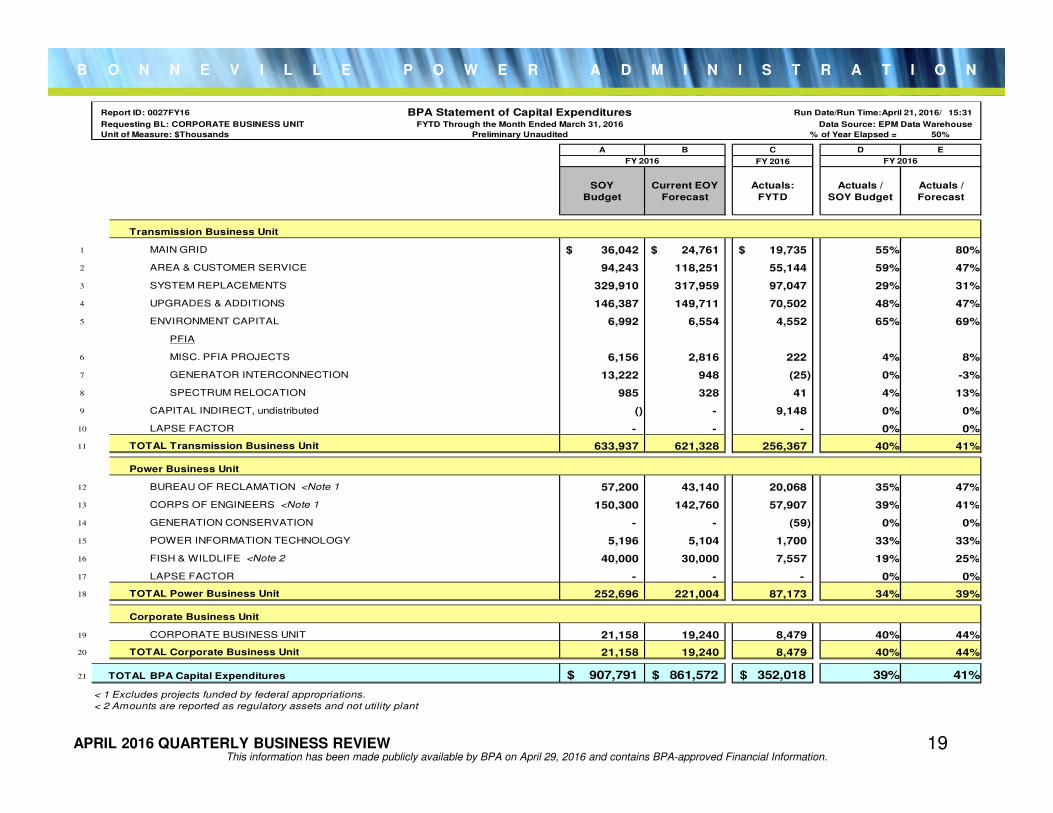
Report ID: 0027FY16 BPA Statement of Capital Expenditures Run Date/Run Time:April 21, 2016/ 15:31
Requesting BL: CORPORATE BUSINESS UNIT FYTD Through the Month Ended March 31, 2016 Data Source: EPM Data Warehouse
Unit of Measure: $Thousands Preliminary Unaudited % of Year Elapsed = 50%
A B C D E
FY 2016
SOY
Budget
Current EOY
Forecast
Actuals:
FYTD
Actuals /
SOY Budget
Actuals /
Forecast
Transmission Business Unit
1 MAIN GRID 36,042$ 24,761$ 19,735$ 55% 80%
2 AREA & CUSTOMER SERVICE 94,243 118,251 55,144 59% 47%
3 SYSTEM REPLACEMENTS 329,910 317,959 97,047 29% 31%
4 UPGRADES & ADDITIONS 146,387 149,711 70,502 48% 47%
5 ENVIRONMENT CAPITAL 6,992 6,554 4,552 65% 69%
PFIA
6 MISC. PFIA PROJECTSMISC. PFIA PROJECTS 6,156 2,816 222 4% 8%
7 GENERATOR INTERCONNECTIONGENERATOR INTERCONNECTION 13,222 948 (25) 0% -3%
8 SPECTRUM RELOCATION 985 328 41 4% 13%
9 CAPITAL INDIRECT, undistributed () - 9,148 0% 0%
10 LAPSE FACTOR - - - 0% 0%
11 TOTAL Transmission Business Unit 633,937 621,328 256,367 40% 41%
Power Business Unit
12 BUREAU OF RECLAMATION <Note 1 57,200 43,140 20,068 35% 47%
13 CORPS OF ENGINEERS <Note 1 150,300 142,760 57,907 39% 41%
14 GENERATION CONSERVATION - - (59) 0% 0%
15 POWER INFORMATION TECHNOLOGY 5,196 5,104 1,700 33% 33%
16 FISH & WILDLIFE <Note 2 40,000 30,000 7,557 19% 25%
17 LAPSE FACTOR - - - 0% 0%
18 TOTAL Power Business Unit 252,696 221,004 87,173 34% 39%
Corporate Business Unit
19 CORPORATE BUSINESS UNIT 21,158 19,240 8,479 40% 44%
20 TOTAL Corporate Business Unit 21,158 19,240 8,479 40% 44%
21 TOTAL BPA Capital Expenditures 907,791$ 861,572$ 352,018$ 39% 41%
< 1 Excludes projects funded by federal appropriations.
< 2 Amounts are reported as regulatory assets and not utility plant
FY 2016FY 2016
B O N N E V I L L E P O W E R A D M I N I S T R A T I O N
APRIL 2016 QUARTERLY BUSINESS REVIEWThis information has been made publicly available by BPA on April 29, 2016 and contains BPA-approved Financial Information.
20
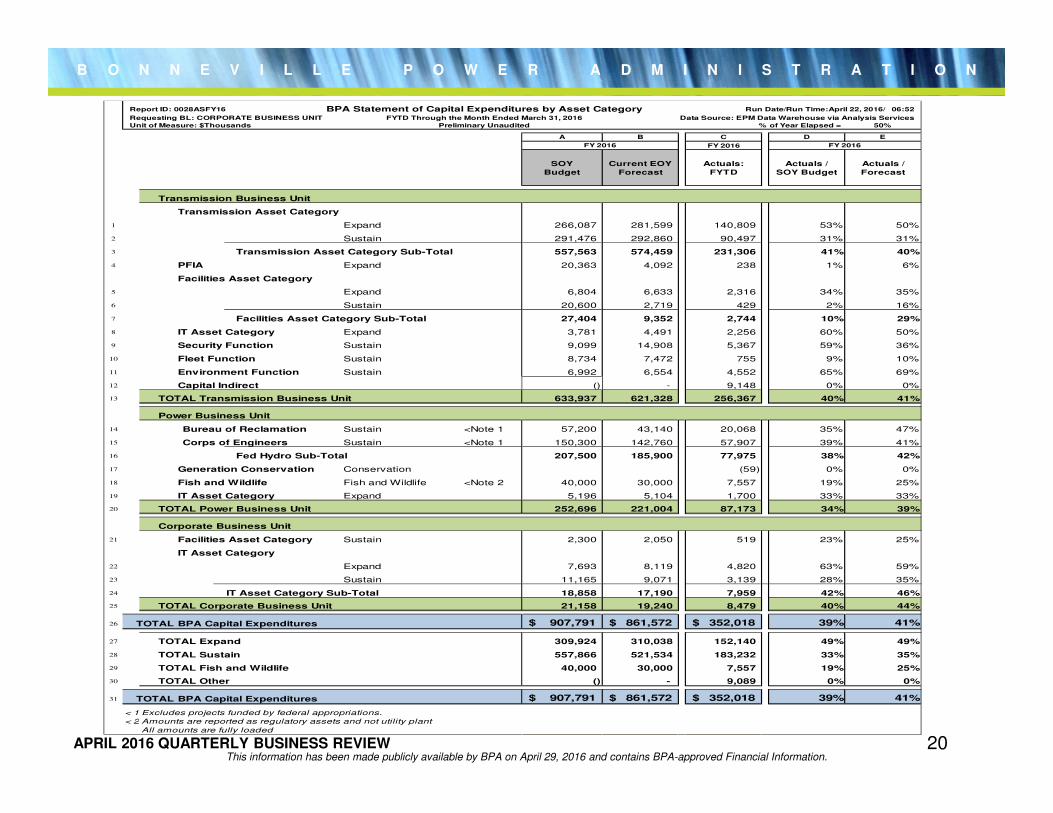
Report ID: 0028ASFY16 BPA Statement of Capital Expenditures by Asset Category Run Date/Run Time:April 22, 2016/ 06:52
Requesting BL: CORPORATE BUSINESS UNIT FYTD Through the Month Ended March 31, 2016 Data Source: EPM Data Warehouse via Analysis Services
Unit of Measure: $Thousands Preliminary Unaudited % of Year Elapsed = 50%
A B C D E
FY 2016
SOY
Budget
Current EOY
Forecast
Actuals:
FYTD
Actuals /
SOY Budget
Actuals /
Forecast
Transmission Business Unit
Transmission Asset Category
1 Expand 266,087 281,599 140,809 53% 50%
2 Sustain 291,476 292,860 90,497 31% 31%
3 Transmission Asset Category Sub-Total 557,563 574,459 231,306 41% 40%
4 PFIA Expand 20,363 4,092 238 1% 6%
Facilities Asset Category
5 Expand 6,804 6,633 2,316 34% 35%
6 Sustain 20,600 2,719 429 2% 16%
7 Facilities Asset Category Sub-Total 27,404 9,352 2,744 10% 29%
8 IT Asset Category Expand 3,781 4,491 2,256 60% 50%
9 Security Function Sustain 9,099 14,908 5,367 59% 36%
10 Fleet Function Sustain 8,734 7,472 755 9% 10%
11 Environment Function Sustain 6,992 6,554 4,552 65% 69%
12 Capital Indirect () - 9,148 0% 0%
13 TOTAL Transmission Business Unit 633,937 621,328 256,367 40% 41%
Power Business Unit
14 Bureau of Reclamation Sustain <Note 1 57,200 43,140 20,068 35% 47%
15 Corps of Engineers Sustain <Note 1 150,300 142,760 57,907 39% 41%
16 Fed Hydro Sub-Total 207,500 185,900 77,975 38% 42%
17 Generation Conservation Conservation (59) 0% 0%
18 Fish and Wildlife Fish and Wildlife <Note 2 40,000 30,000 7,557 19% 25%
19 IT Asset Category Expand 5,196 5,104 1,700 33% 33%
20 TOTAL Power Business Unit 252,696 221,004 87,173 34% 39%
Corporate Business Unit
21 Facilities Asset Category Sustain 2,300 2,050 519 23% 25%
IT Asset Category
22 Expand 7,693 8,119 4,820 63% 59%
23 Sustain 11,165 9,071 3,139 28% 35%
24 IT Asset Category Sub-Total 18,858 17,190 7,959 42% 46%
25 TOTAL Corporate Business Unit 21,158 19,240 8,479 40% 44%
26 TOTAL BPA Capital Expenditures 907,791$ 861,572$ 352,018$ 39% 41%
27 TOTAL Expand 309,924 310,038 152,140 49% 49%
28 TOTAL Sustain 557,866 521,534 183,232 33% 35%
29 TOTAL Fish and Wildlife 40,000 30,000 7,557 19% 25%
30 TOTAL Other () - 9,089 0% 0%
31 TOTAL BPA Capital Expenditures 907,791$ 861,572$ 352,018$ 39% 41%
< 1 Excludes projects funded by federal appropriations.
< 2 Amounts are reported as regulatory assets and not utility plant
All amounts are fully loaded
FY 2016 FY 2016
B O N N E V I L L E P O W E R A D M I N I S T R A T I O N
APRIL 2016 QUARTERLY BUSINESS REVIEWThis information has been made publicly available by BPA on April 29, 2016 and contains BPA-approved Financial Information.
21
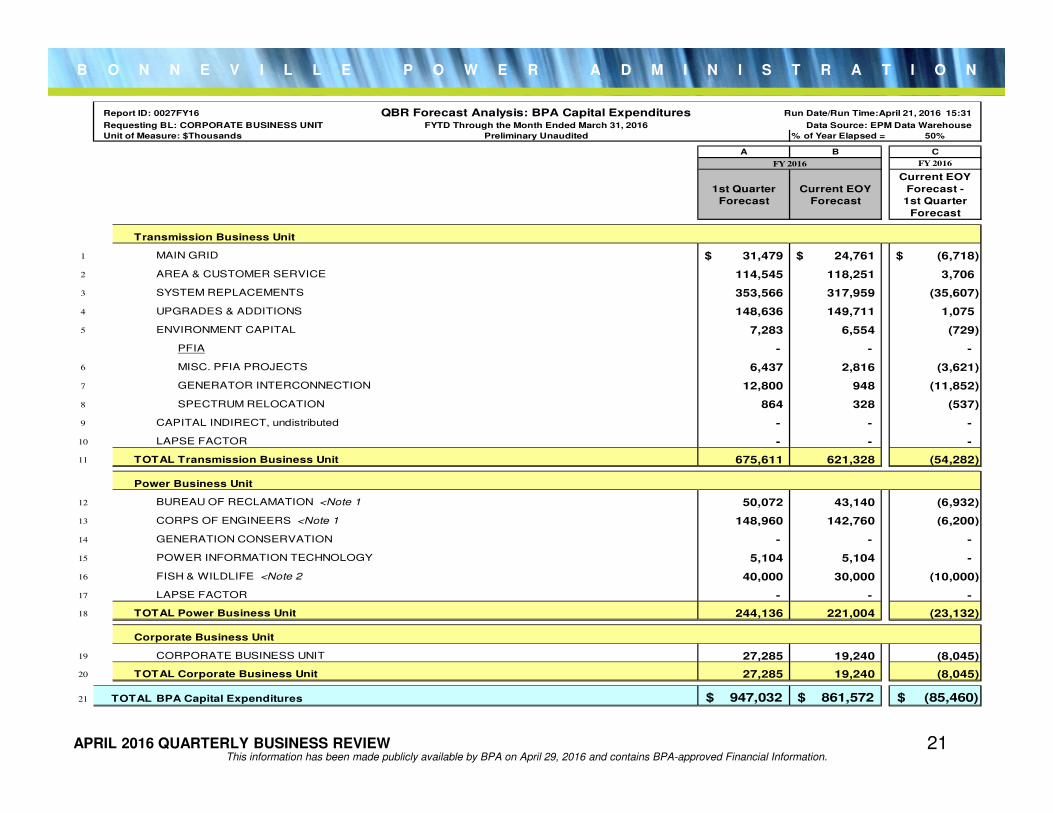
Report ID: 0027FY16 QBR Forecast Analysis: BPA Capital Expenditures Run Date/Run Time:April 21, 2016 15:31
Requesting BL: CORPORATE BUSINESS UNIT FYTD Through the Month Ended March 31, 2016 Data Source: EPM Data Warehouse
Unit of Measure: $Thousands Preliminary Unaudited % of Year Elapsed = 50%
A B C
FY 2016
1st Quarter
Forecast
Current EOY
Forecast
Current EOY
Forecast -
1st Quarter
Forecast
Transmission Business Unit
1 MAIN GRID 31,479$ 24,761$ (6,718)$
2 AREA & CUSTOMER SERVICE 114,545 118,251 3,706
3 SYSTEM REPLACEMENTS 353,566 317,959 (35,607)
4 UPGRADES & ADDITIONS 148,636 149,711 1,075
5 ENVIRONMENT CAPITAL 7,283 6,554 (729)
PFIA - - -
6 MISC. PFIA PROJECTSMISC. PFIA PROJECTS 6,437 2,816 (3,621)
7 GENERATOR INTERCONNECTIONGENERATOR INTERCONNECTION 12,800 948 (11,852)
8 SPECTRUM RELOCATION 864 328 (537)
9 CAPITAL INDIRECT, undistributed - - -
10 LAPSE FACTOR - - -
11 TOTAL Transmission Business Unit 675,611 621,328 (54,282)
Power Business Unit
12 BUREAU OF RECLAMATION <Note 1 50,072 43,140 (6,932)
13 CORPS OF ENGINEERS <Note 1 148,960 142,760 (6,200)
14 GENERATION CONSERVATION - - -
15 POWER INFORMATION TECHNOLOGY 5,104 5,104 -
16 FISH & WILDLIFE <Note 2 40,000 30,000 (10,000)
17 LAPSE FACTOR - - -
18 TOTAL Power Business Unit 244,136 221,004 (23,132)
Corporate Business Unit
19 CORPORATE BUSINESS UNIT 27,285 19,240 (8,045)
20 TOTAL Corporate Business Unit 27,285 19,240 (8,045)
21 TOTAL BPA Capital Expenditures 947,032$ 861,572$ (85,460)$
FY 2016
B O N N E V I L L E P O W E R A D M I N I S T R A T I O N
APRIL 2016 QUARTERLY BUSINESS REVIEW
Capital Project Status Report
Dennis NaefAsset Strategist
22This information has been made publicly available by BPA on April 29, 2016 and does not contains BPA-approved Financial information.
B O N N E V I L L E P O W E R A D M I N I S T R A T I O N
APRIL 2016 QUARTERLY BUSINESS REVIEW
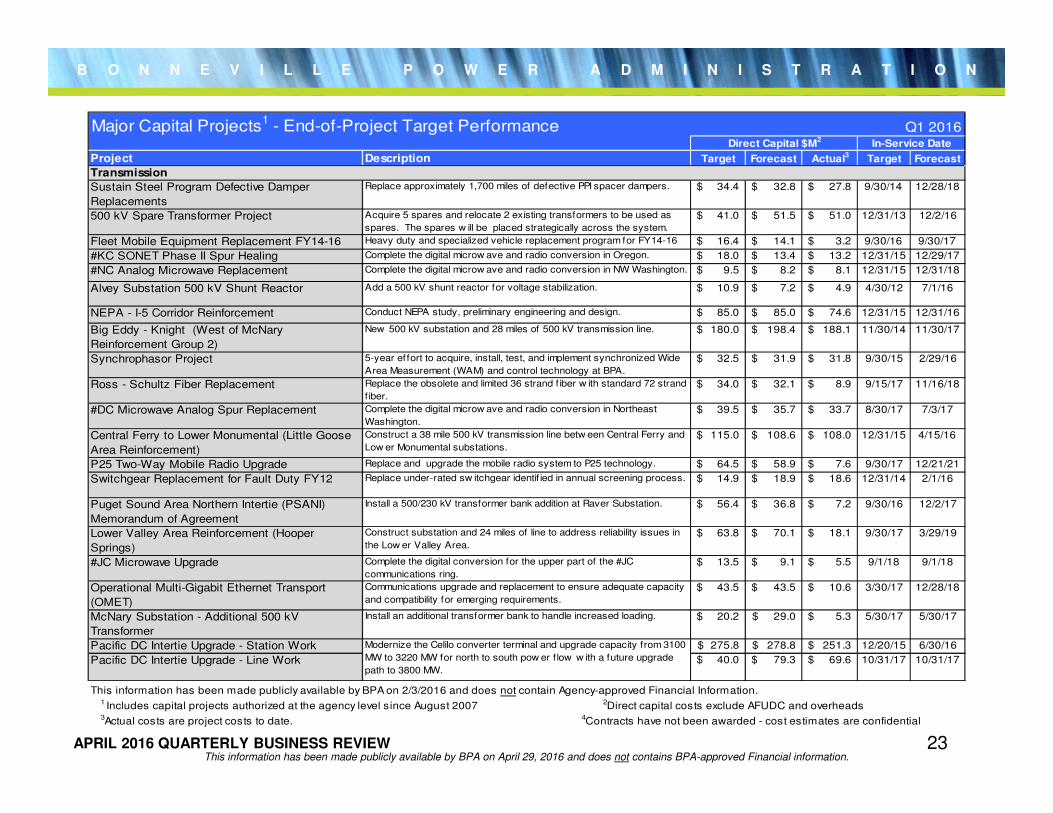
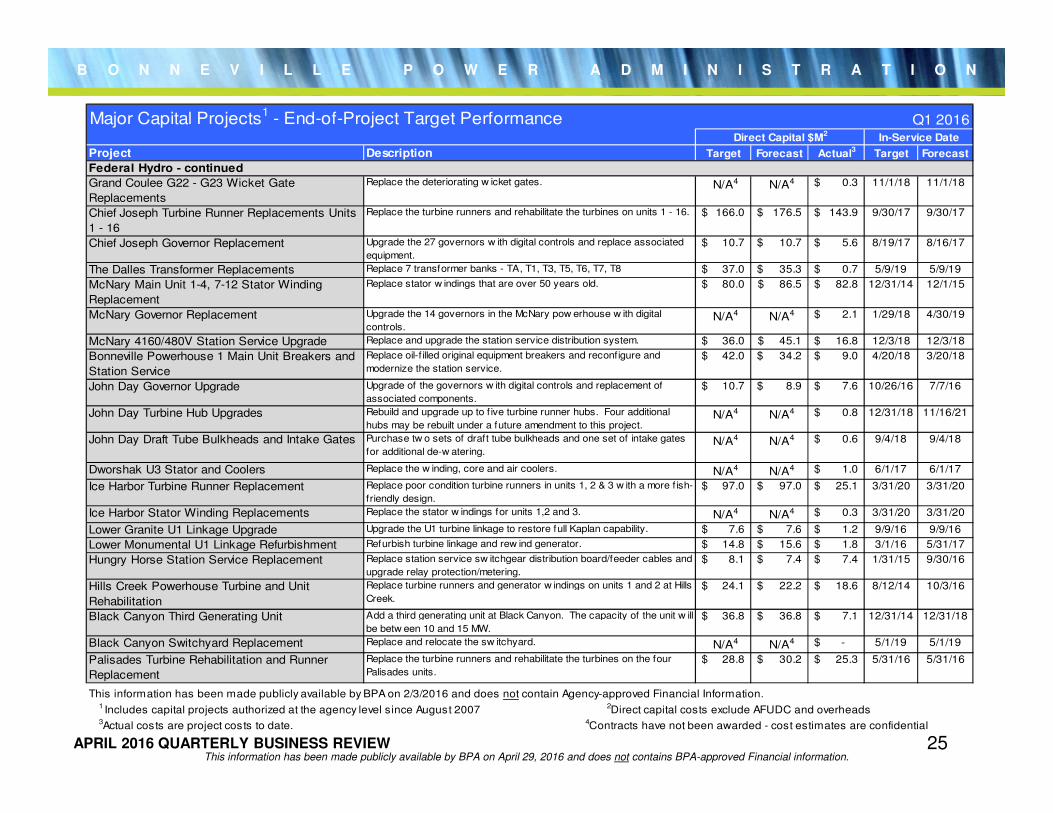
Major Capital Projects1 - End-of-Project Target Performance
Project Description Target Forecast Actual3 Target Forecast
Transmission
Sustain Steel Program Defective Damper
Replacements
Replace approximately 1,700 miles of defective PPI spacer dampers. 34.4$ 32.8$ 27.8$ 9/30/14 12/28/18
500 kV Spare Transformer Project Acquire 5 spares and relocate 2 existing transformers to be used as
spares. The spares w ill be placed strategically across the system.
41.0$ 51.5$ 51.0$ 12/31/13 12/2/16
Fleet Mobile Equipment Replacement FY14-16 Heavy duty and specialized vehicle replacement program for FY14-16 16.4$ 14.1$ 3.2$ 9/30/16 9/30/17
#KC SONET Phase II Spur Healing Complete the digital microw ave and radio conversion in Oregon. 18.0$ 13.4$ 13.2$ 12/31/15 12/29/17
#NC Analog Microwave Replacement Complete the digital microw ave and radio conversion in NW Washington. 9.5$ 8.2$ 8.1$ 12/31/15 12/31/18
Alvey Substation 500 kV Shunt Reactor Add a 500 kV shunt reactor for voltage stabilization. 10.9$ 7.2$ 4.9$ 4/30/12 7/1/16
NEPA - I-5 Corridor Reinforcement Conduct NEPA study, preliminary engineering and design. 85.0$ 85.0$ 74.6$ 12/31/15 12/31/16
Big Eddy - Knight (West of McNary
Reinforcement Group 2)
New 500 kV substation and 28 miles of 500 kV transmission line. 180.0$ 198.4$ 188.1$ 11/30/14 11/30/17
Synchrophasor Project 5-year ef fort to acquire, install, test, and implement synchronized Wide
Area Measurement (WAM) and control technology at BPA.
32.5$ 31.9$ 31.8$ 9/30/15 2/29/16
Ross - Schultz Fiber Replacement Replace the obsolete and limited 36 strand f iber w ith standard 72 strand
fiber.
34.0$ 32.1$ 8.9$ 9/15/17 11/16/18
#DC Microwave Analog Spur Replacement Complete the digital microw ave and radio conversion in Northeast
Washington.
39.5$ 35.7$ 33.7$ 8/30/17 7/3/17
Central Ferry to Lower Monumental (Little Goose
Area Reinforcement)
Construct a 38 mile 500 kV transmission line betw een Central Ferry and
Low er Monumental substations.
115.0$ 108.6$ 108.0$ 12/31/15 4/15/16
P25 Two-Way Mobile Radio Upgrade Replace and upgrade the mobile radio system to P25 technology. 64.5$ 58.9$ 7.6$ 9/30/17 12/21/21
Switchgear Replacement for Fault Duty FY12 Replace under-rated sw itchgear identif ied in annual screening process. 14.9$ 18.9$ 18.6$ 12/31/14 2/1/16
Puget Sound Area Northern Intertie (PSANI)
Memorandum of Agreement
Install a 500/230 kV transformer bank addition at Raver Substation. 56.4$ 36.8$ 7.2$ 9/30/16 12/2/17
Lower Valley Area Reinforcement (Hooper
Springs)
Construct substation and 24 miles of line to address reliability issues in
the Low er Valley Area.
63.8$ 70.1$ 18.1$ 9/30/17 3/29/19
#JC Microwave Upgrade Complete the digital conversion for the upper part of the #JC
communications ring.
13.5$ 9.1$ 5.5$ 9/1/18 9/1/18
Operational Multi-Gigabit Ethernet Transport
(OMET)
Communications upgrade and replacement to ensure adequate capacity
and compatibility for emerging requirements.
43.5$ 43.5$ 10.6$ 3/30/17 12/28/18
McNary Substation - Additional 500 kV
Transformer
Install an additional transformer bank to handle increased loading. 20.2$ 29.0$ 5.3$ 5/30/17 5/30/17
Pacific DC Intertie Upgrade - Station Work 275.8$ 278.8$ 251.3$ 12/20/15 6/30/16
Pacific DC Intertie Upgrade - Line Work 40.0$ 79.3$ 69.6$ 10/31/17 10/31/17
This information has been made publicly available by BPA on 2/3/2016 and does not contain Agency-approved Financial Information.1 Includes capital projects authorized at the agency level since August 2007 2Direct capital costs exclude AFUDC and overheads3Actual costs are project costs to date. 4Contracts have not been awarded - cost estimates are confidential
In-Service DateDirect Capital $M2
Q1 2016
Modernize the Celilo converter terminal and upgrade capacity from 3100
MW to 3220 MW for north to south pow er flow w ith a future upgrade
path to 3800 MW.
This information has been made publicly available by BPA on April 29, 2016 and does not contains BPA-approved Financial information.23
B O N N E V I L L E P O W E R A D M I N I S T R A T I O N
APRIL 2016 QUARTERLY BUSINESS REVIEW
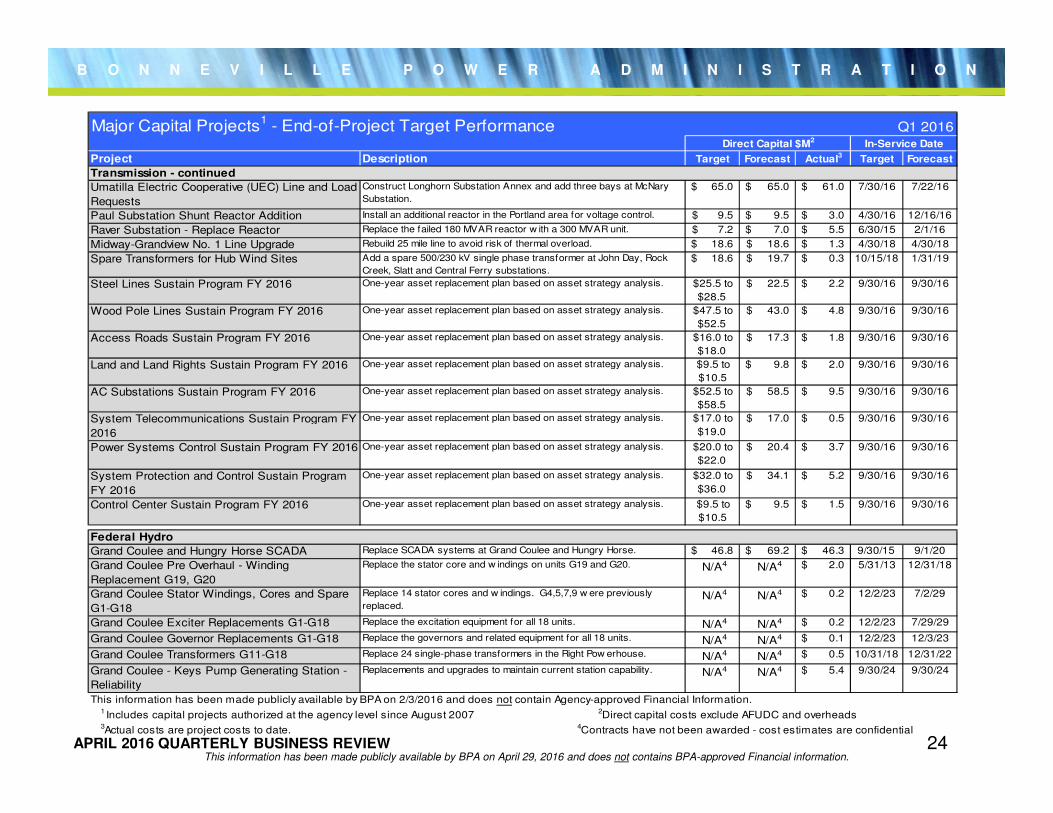
Major Capital Projects1 - End-of-Project Target Performance
Project Description Target Forecast Actual3 Target Forecast
Transmission - continued
Umatilla Electric Cooperative (UEC) Line and Load
Requests
Construct Longhorn Substation Annex and add three bays at McNary
Substation.
65.0$ 65.0$ 61.0$ 7/30/16 7/22/16
Paul Substation Shunt Reactor Addition Install an additional reactor in the Portland area for voltage control. 9.5$ 9.5$ 3.0$ 4/30/16 12/16/16
Raver Substation - Replace Reactor Replace the failed 180 MVAR reactor w ith a 300 MVAR unit. 7.2$ 7.0$ 5.5$ 6/30/15 2/1/16
Midway-Grandview No. 1 Line Upgrade Rebuild 25 mile line to avoid risk of thermal overload. 18.6$ 18.6$ 1.3$ 4/30/18 4/30/18
Spare Transformers for Hub Wind Sites Add a spare 500/230 kV single phase transformer at John Day, Rock
Creek, Slatt and Central Ferry substations.
18.6$ 19.7$ 0.3$ 10/15/18 1/31/19
Steel Lines Sustain Program FY 2016 One-year asset replacement plan based on asset strategy analysis. $25.5 to
$28.5
22.5$ 2.2$ 9/30/16 9/30/16
Wood Pole Lines Sustain Program FY 2016 One-year asset replacement plan based on asset strategy analysis. $47.5 to
$52.5
43.0$ 4.8$ 9/30/16 9/30/16
Access Roads Sustain Program FY 2016 One-year asset replacement plan based on asset strategy analysis. $16.0 to
$18.0
17.3$ 1.8$ 9/30/16 9/30/16
Land and Land Rights Sustain Program FY 2016 One-year asset replacement plan based on asset strategy analysis. $9.5 to
$10.5
9.8$ 2.0$ 9/30/16 9/30/16
AC Substations Sustain Program FY 2016 One-year asset replacement plan based on asset strategy analysis. $52.5 to
$58.5
58.5$ 9.5$ 9/30/16 9/30/16
System Telecommunications Sustain Program FY
2016
One-year asset replacement plan based on asset strategy analysis. $17.0 to
$19.0
17.0$ 0.5$ 9/30/16 9/30/16
Power Systems Control Sustain Program FY 2016 One-year asset replacement plan based on asset strategy analysis. $20.0 to
$22.0
20.4$ 3.7$ 9/30/16 9/30/16
System Protection and Control Sustain Program
FY 2016
One-year asset replacement plan based on asset strategy analysis. $32.0 to
$36.0
34.1$ 5.2$ 9/30/16 9/30/16
Control Center Sustain Program FY 2016 One-year asset replacement plan based on asset strategy analysis. $9.5 to
$10.5
9.5$ 1.5$ 9/30/16 9/30/16
Federal Hydro
Grand Coulee and Hungry Horse SCADA Replace SCADA systems at Grand Coulee and Hungry Horse. 46.8$ 69.2$ 46.3$ 9/30/15 9/1/20
Grand Coulee Pre Overhaul - Winding
Replacement G19, G20
Replace the stator core and w indings on units G19 and G20. N/A4 N/A4 2.0$ 5/31/13 12/31/18
Grand Coulee Stator Windings, Cores and Spare
G1-G18
Replace 14 stator cores and w indings. G4,5,7,9 w ere previously
replaced. N/A4 N/A4 0.2$ 12/2/23 7/2/29
Grand Coulee Exciter Replacements G1-G18 Replace the excitation equipment for all 18 units. N/A4 N/A4 0.2$ 12/2/23 7/29/29
Grand Coulee Governor Replacements G1-G18 Replace the governors and related equipment for all 18 units. N/A4 N/A4 0.1$ 12/2/23 12/3/23
Grand Coulee Transformers G11-G18 Replace 24 single-phase transformers in the Right Pow erhouse. N/A4 N/A4 0.5$ 10/31/18 12/31/22
Grand Coulee - Keys Pump Generating Station -
Reliability
Replacements and upgrades to maintain current station capability. N/A4 N/A4 5.4$ 9/30/24 9/30/24
This information has been made publicly available by BPA on 2/3/2016 and does not contain Agency-approved Financial Information.1 Includes capital projects authorized at the agency level since August 2007 2Direct capital costs exclude AFUDC and overheads3Actual costs are project costs to date. 4Contracts have not been awarded - cost estimates are confidential
Q1 2016Direct Capital $M2 In-Service Date
This information has been made publicly available by BPA on April 29, 2016 and does not contains BPA-approved Financial information.24
B O N N E V I L L E P O W E R A D M I N I S T R A T I O N
APRIL 2016 QUARTERLY BUSINESS REVIEW
Major Capital Projects1 - End-of-Project Target Performance
Project Description Target Forecast Actual3
Target Forecast
Federal Hydro - continued
Grand Coulee G22 - G23 Wicket Gate
Replacements
Replace the deteriorating w icket gates. N/A4 N/A4 0.3$ 11/1/18 11/1/18
Chief Joseph Turbine Runner Replacements Units
1 - 16
Replace the turbine runners and rehabilitate the turbines on units 1 - 16. 166.0$ 176.5$ 143.9$ 9/30/17 9/30/17
Chief Joseph Governor Replacement Upgrade the 27 governors w ith digital controls and replace associated
equipment.
10.7$ 10.7$ 5.6$ 8/19/17 8/16/17
The Dalles Transformer Replacements Replace 7 transformer banks - TA, T1, T3, T5, T6, T7, T8 37.0$ 35.3$ 0.7$ 5/9/19 5/9/19
McNary Main Unit 1-4, 7-12 Stator Winding
Replacement
Replace stator w indings that are over 50 years old. 80.0$ 86.5$ 82.8$ 12/31/14 12/1/15
McNary Governor Replacement Upgrade the 14 governors in the McNary pow erhouse w ith digital
controls. N/A4 N/A4 2.1$ 1/29/18 4/30/19
McNary 4160/480V Station Service Upgrade Replace and upgrade the station service distribution system. 36.0$ 45.1$ 16.8$ 12/3/18 12/3/18
Bonneville Powerhouse 1 Main Unit Breakers and
Station Service
Replace oil-filled original equipment breakers and reconfigure and
modernize the station service.
42.0$ 34.2$ 9.0$ 4/20/18 3/20/18
John Day Governor Upgrade Upgrade of the governors w ith digital controls and replacement of
associated components.
10.7$ 8.9$ 7.6$ 10/26/16 7/7/16
John Day Turbine Hub Upgrades Rebuild and upgrade up to f ive turbine runner hubs. Four additional
hubs may be rebuilt under a future amendment to this project. N/A4 N/A4 0.8$ 12/31/18 11/16/21
John Day Draft Tube Bulkheads and Intake Gates Purchase tw o sets of draft tube bulkheads and one set of intake gates
for additional de-w atering. N/A4 N/A4 0.6$ 9/4/18 9/4/18
Dworshak U3 Stator and Coolers Replace the w inding, core and air coolers. N/A4 N/A4 1.0$ 6/1/17 6/1/17
Ice Harbor Turbine Runner Replacement Replace poor condition turbine runners in units 1, 2 & 3 w ith a more f ish-
friendly design.
97.0$ 97.0$ 25.1$ 3/31/20 3/31/20
Ice Harbor Stator Winding Replacements Replace the stator w indings for units 1,2 and 3. N/A4 N/A4 0.3$ 3/31/20 3/31/20
Lower Granite U1 Linkage Upgrade Upgrade the U1 turbine linkage to restore full Kaplan capability. 7.6$ 7.6$ 1.2$ 9/9/16 9/9/16
Lower Monumental U1 Linkage Refurbishment Refurbish turbine linkage and rew ind generator. 14.8$ 15.6$ 1.8$ 3/1/16 5/31/17
Hungry Horse Station Service Replacement Replace station service sw itchgear distribution board/feeder cables and
upgrade relay protection/metering.
8.1$ 7.4$ 7.4$ 1/31/15 9/30/16
Hills Creek Powerhouse Turbine and Unit
Rehabilitation
Replace turbine runners and generator w indings on units 1 and 2 at Hills
Creek.
24.1$ 22.2$ 18.6$ 8/12/14 10/3/16
Black Canyon Third Generating Unit Add a third generating unit at Black Canyon. The capacity of the unit w ill
be betw een 10 and 15 MW.
36.8$ 36.8$ 7.1$ 12/31/14 12/31/18
Black Canyon Switchyard Replacement Replace and relocate the sw itchyard. N/A4 N/A4 -$ 5/1/19 5/1/19
Palisades Turbine Rehabilitation and Runner
Replacement
Replace the turbine runners and rehabilitate the turbines on the four
Palisades units.
28.8$ 30.2$ 25.3$ 5/31/16 5/31/16
This information has been made publicly available by BPA on 2/3/2016 and does not contain Agency-approved Financial Information.1 Includes capital projects authorized at the agency level since August 2007 2Direct capital costs exclude AFUDC and overheads3Actual costs are project costs to date. 4Contracts have not been awarded - cost estimates are confidential
Q1 2016Direct Capital $M
2In-Service Date
This information has been made publicly available by BPA on April 29, 2016 and does not contains BPA-approved Financial information.25
B O N N E V I L L E P O W E R A D M I N I S T R A T I O N
APRIL 2016 QUARTERLY BUSINESS REVIEW
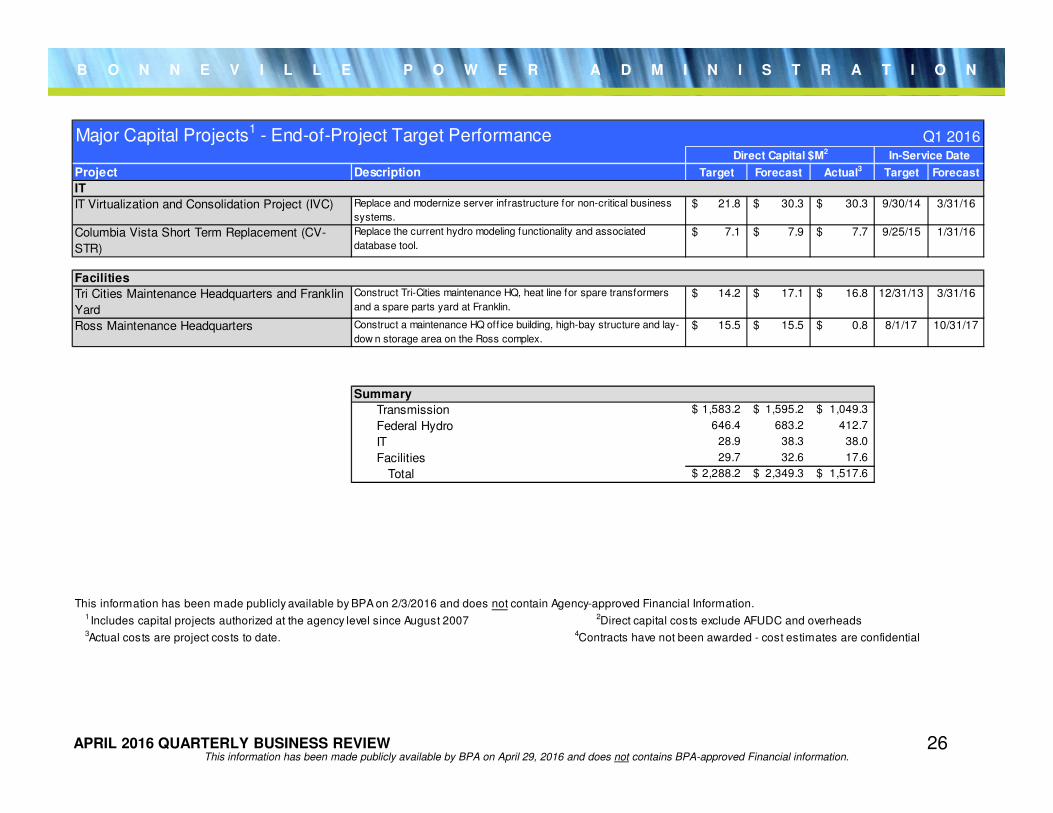
Major Capital Projects1 - End-of-Project Target Performance
Project Description Target Forecast Actual3 Target Forecast
IT
IT Virtualization and Consolidation Project (IVC) Replace and modernize server infrastructure for non-critical business
systems.
21.8$ 30.3$ 30.3$ 9/30/14 3/31/16
Columbia Vista Short Term Replacement (CV-
STR)
Replace the current hydro modeling functionality and associated
database tool.
7.1$ 7.9$ 7.7$ 9/25/15 1/31/16
Facilities
Tri Cities Maintenance Headquarters and Franklin
Yard
Construct Tri-Cities maintenance HQ, heat line for spare transformers
and a spare parts yard at Franklin.
14.2$ 17.1$ 16.8$ 12/31/13 3/31/16
Ross Maintenance Headquarters Construct a maintenance HQ off ice building, high-bay structure and lay-
dow n storage area on the Ross complex.
15.5$ 15.5$ 0.8$ 8/1/17 10/31/17
Summary
Transmission 1,583.2$ 1,595.2$ 1,049.3$
Federal Hydro 646.4 683.2 412.7
IT 28.9 38.3 38.0
Facilities 29.7 32.6 17.6
Total 2,288.2$ 2,349.3$ 1,517.6$
This information has been made publicly available by BPA on 2/3/2016 and does not contain Agency-approved Financial Information.1 Includes capital projects authorized at the agency level since August 2007 2Direct capital costs exclude AFUDC and overheads3Actual costs are project costs to date. 4Contracts have not been awarded - cost estimates are confidential
Q1 2016Direct Capital $M2 In-Service Date
This information has been made publicly available by BPA on April 29, 2016 and does not contains BPA-approved Financial information.26
B O N N E V I L L E P O W E R A D M I N I S T R A T I O N
APRIL 2016 QUARTERLY BUSINESS REVIEW
Generating Cash to Accelerate Appropriations Repayment
Anna-Lisa MillerFinancial Analyst
This information has been made publicly available by BPA on April 29, 2016 and does not contains BPA-approved Financial information.27
B O N N E V I L L E P O W E R A D M I N I S T R A T I O N
APRIL 2016 QUARTERLY BUSINESS REVIEW
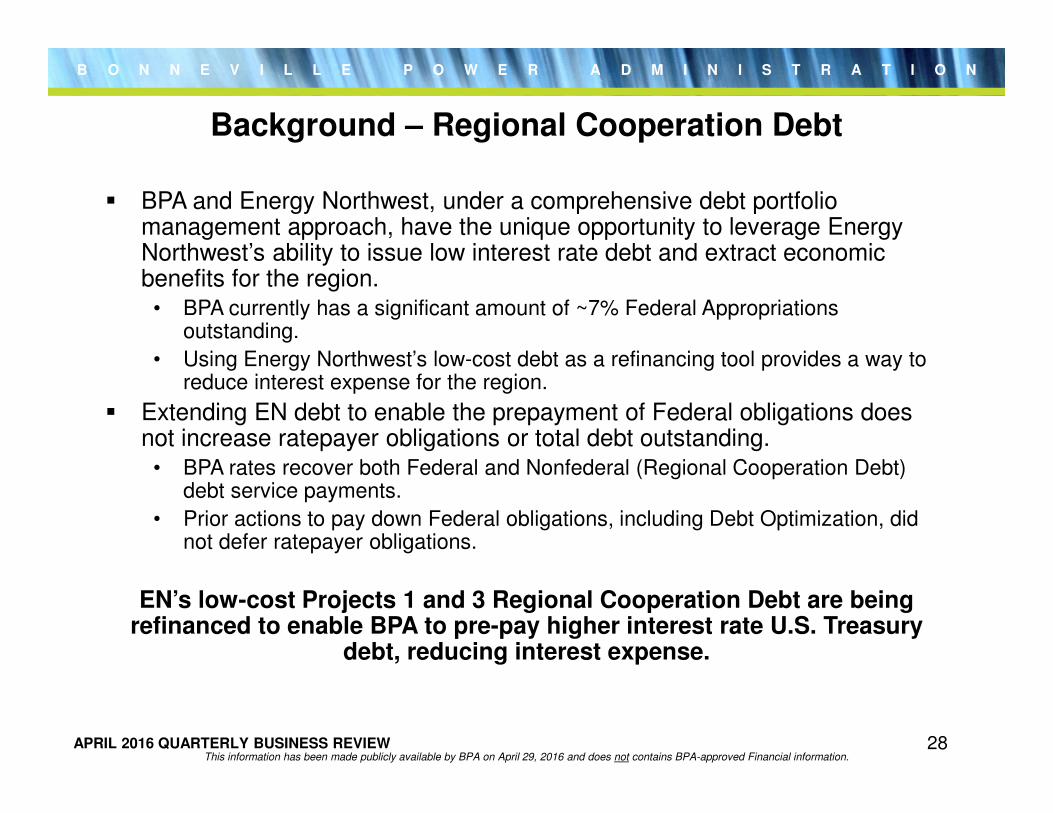
Background – Regional Cooperation Debt
� BPA and Energy Northwest, under a comprehensive debt portfolio management approach, have the unique opportunity to leverage Energy Northwest’s ability to issue low interest rate debt and extract economic benefits for the region.
• BPA currently has a significant amount of ~7% Federal Appropriations outstanding.
• Using Energy Northwest’s low-cost debt as a refinancing tool provides a way to reduce interest expense for the region.
� Extending EN debt to enable the prepayment of Federal obligations does not increase ratepayer obligations or total debt outstanding.
• BPA rates recover both Federal and Nonfederal (Regional Cooperation Debt) debt service payments.
• Prior actions to pay down Federal obligations, including Debt Optimization, did not defer ratepayer obligations.
EN’s low-cost Projects 1 and 3 Regional Cooperation Debt are being refinanced to enable BPA to pre-pay higher interest rate U.S. Treasury
debt, reducing interest expense.
This information has been made publicly available by BPA on April 29, 2016 and does not contains BPA-approved Financial information.28
B O N N E V I L L E P O W E R A D M I N I S T R A T I O N
APRIL 2016 QUARTERLY BUSINESS REVIEW
Background
� Ideally, BPA would pay off the $2.9 billion of higher interest rate federal debt related to the Regional Cooperation Debt program immediately. Unfortunately, amounts which can be paid early each year are restricted to the amount of Energy Northwest debt maturing in any given year.
� Since 2014, BPA has already extended $680 million of Regional Cooperation Debt, producing over $288 million in gross interest savings (over $200 million present value savings) through 2044.
� Energy Northwest and BPA staff have developed a proposal to accelerate federal payments associated with the Regional Cooperation Debt program by one year.
� Acceleration is made feasible through freed up cash from:• Using the remaining funds generated from the 2013 Power Prepayment Program.• Using an EN line of credit to fund O&M and Interest payments.
� This acceleration would reduce next years Power interest expense on any amounts accelerated.
• BPA and EN currently estimate the interest rate for a short-term line of credit could be ~1%.• BPA would be accelerating federal payments with interest rates up to 7%.
� Funds raised in BPA FY2016 would be used to accelerate a portion of the federal power appropriations repayment planned in BPA FY2017 as part of the Regional Cooperation Debt program.
• Currently, EN has supported extension of all of the eligible regional cooperation debt maturing in 2017.
This information has been made publicly available by BPA on April 29, 2016 and does not contains BPA-approved Financial information.29
B O N N E V I L L E P O W E R A D M I N I S T R A T I O N
APRIL 2016 QUARTERLY BUSINESS REVIEW
Prepay Funds Remaining
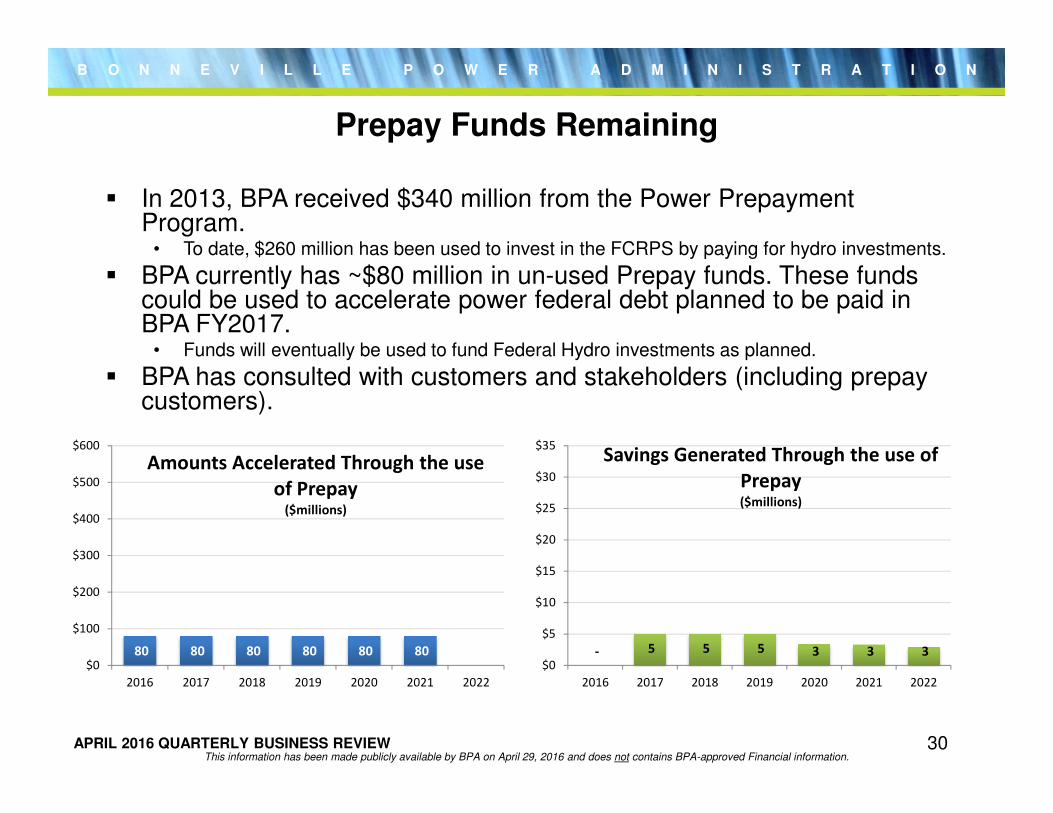
� In 2013, BPA received $340 million from the Power Prepayment Program.
• To date, $260 million has been used to invest in the FCRPS by paying for hydro investments.
� BPA currently has ~$80 million in un-used Prepay funds. These funds could be used to accelerate power federal debt planned to be paid in BPA FY2017.
• Funds will eventually be used to fund Federal Hydro investments as planned.
� BPA has consulted with customers and stakeholders (including prepay customers).
80 80 80 80 80 80 -$0
$100
$200
$300
$400
$500
$600
2016 2017 2018 2019 2020 2021 2022
Amounts Accelerated Through the use
of Prepay($millions)
- 5 5 5 3 3 3 $0
$5
$10
$15
$20
$25
$30
$35
2016 2017 2018 2019 2020 2021 2022
Savings Generated Through the use of
Prepay($millions)
This information has been made publicly available by BPA on April 29, 2016 and does not contains BPA-approved Financial information.30
B O N N E V I L L E P O W E R A D M I N I S T R A T I O N
APRIL 2016 QUARTERLY BUSINESS REVIEW
EN Line of Credit: O&M + Interest
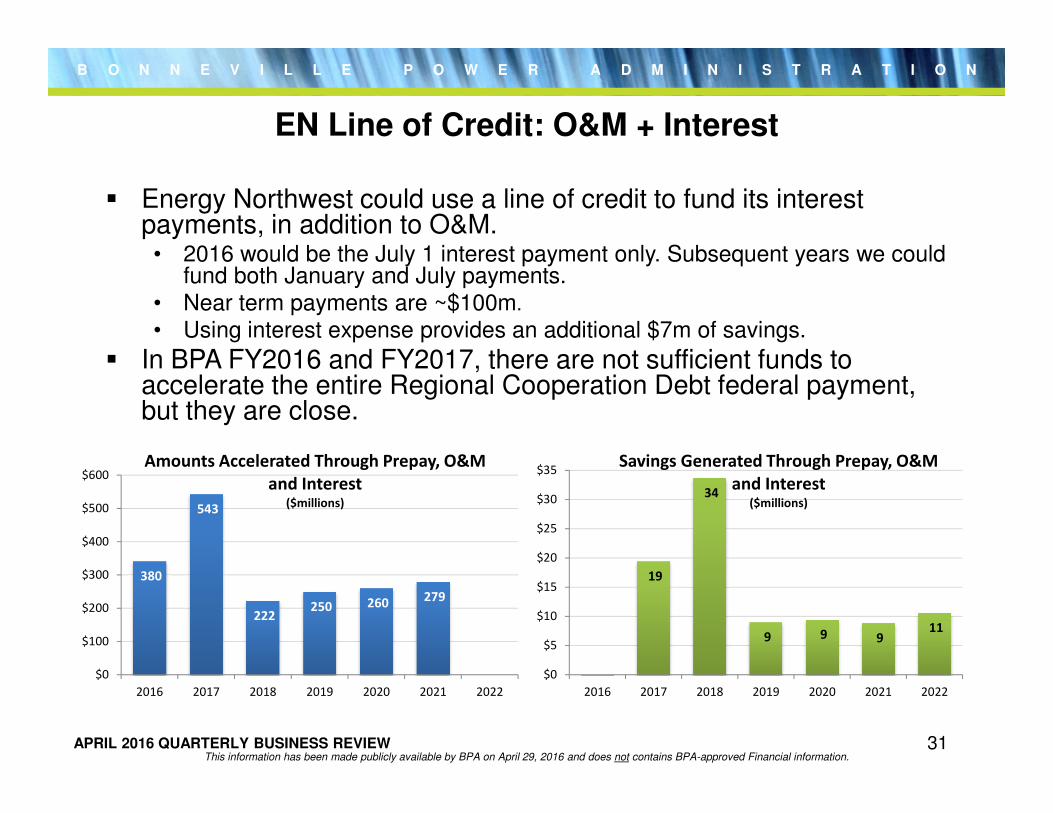
� Energy Northwest could use a line of credit to fund its interest payments, in addition to O&M.• 2016 would be the July 1 interest payment only. Subsequent years we could
fund both January and July payments.• Near term payments are ~$100m.
• Using interest expense provides an additional $7m of savings.
� In BPA FY2016 and FY2017, there are not sufficient funds to accelerate the entire Regional Cooperation Debt federal payment, but they are close.
380
543
222 250 260 279
-$0
$100
$200
$300
$400
$500
$600
2016 2017 2018 2019 2020 2021 2022
Amounts Accelerated Through Prepay, O&M
and Interest($millions)
19
34
9 9 9 11
$0
$5
$10
$15
$20
$25
$30
$35
2016 2017 2018 2019 2020 2021 2022
Savings Generated Through Prepay, O&M
and Interest($millions)
This information has been made publicly available by BPA on April 29, 2016 and does not contains BPA-approved Financial information.31
B O N N E V I L L E P O W E R A D M I N I S T R A T I O N
APRIL 2016 QUARTERLY BUSINESS REVIEW
Process
1. Energy Northwest gets a line of credit, and uses that line of credit to pay CGS O&M costs from February 2016-September 2016.
2. BPA continues to collect in rates the money that used to be used to pay CGS O&M costs, lets the money accumulate over the course of the year, and uses that money to accelerate the appropriations repayment in September 2016.
3. Energy Northwest does its planned annual bond refinancing transaction in the spring of 2017. BPA continues to collect in rates the money that used to be used to pay Energy Northwest bonds.
4. Instead of using the proceeds freed up in rates from the annual Energy Northwest bond refinancing transaction to accelerate repayment of appropriated debt, BPA uses these proceeds to pay down the line of credit no later than June 30, 2017 (likely earlier).
Net effects:1. Energy Northwest does its planned annual bond refinancing transaction just as it
would previously.
2. BPA accelerates repayment of appropriated debt as it would previously, except that the line of credit allows BPA to move the accelerated repayment up by a year, saving a year’s worth of interest.
This information has been made publicly available by BPA on April 29, 2016 and does not contains BPA-approved Financial information.32

B O N N E V I L L E P O W E R A D M I N I S T R A T I O N
APRIL 2016 QUARTERLY BUSINESS REVIEW
Slice ReportingComposite Cost Pool Review
Forecast of Annual Slice True-Up Adjustment
Sunny DonatoPublic Utilities Specialist
Janice JohnsonAccountant
This information has been made publicly available by BPA on April 29, 2016 and contains BPA-approved Financial Information.33
B O N N E V I L L E P O W E R A D M I N I S T R A T I O N
APRIL 2016 QUARTERLY BUSINESS REVIEW
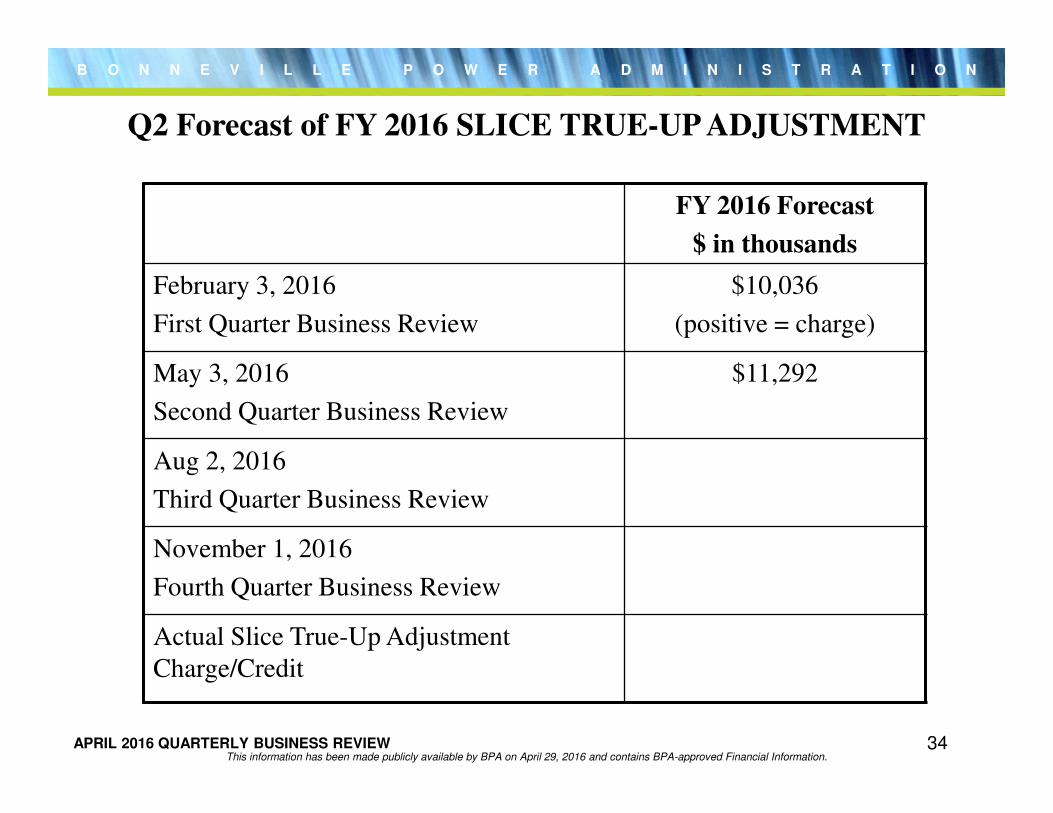
Q2 Forecast of FY 2016 SLICE TRUE-UP ADJUSTMENT
FY 2016 Forecast
$ in thousands
February 3, 2016
First Quarter Business Review
$10,036
(positive = charge)
May 3, 2016
Second Quarter Business Review
$11,292
Aug 2, 2016
Third Quarter Business Review
November 1, 2016
Fourth Quarter Business Review
Actual Slice True-Up Adjustment
Charge/Credit
This information has been made publicly available by BPA on April 29, 2016 and contains BPA-approved Financial Information.34
B O N N E V I L L E P O W E R A D M I N I S T R A T I O N
APRIL 2016 QUARTERLY BUSINESS REVIEW
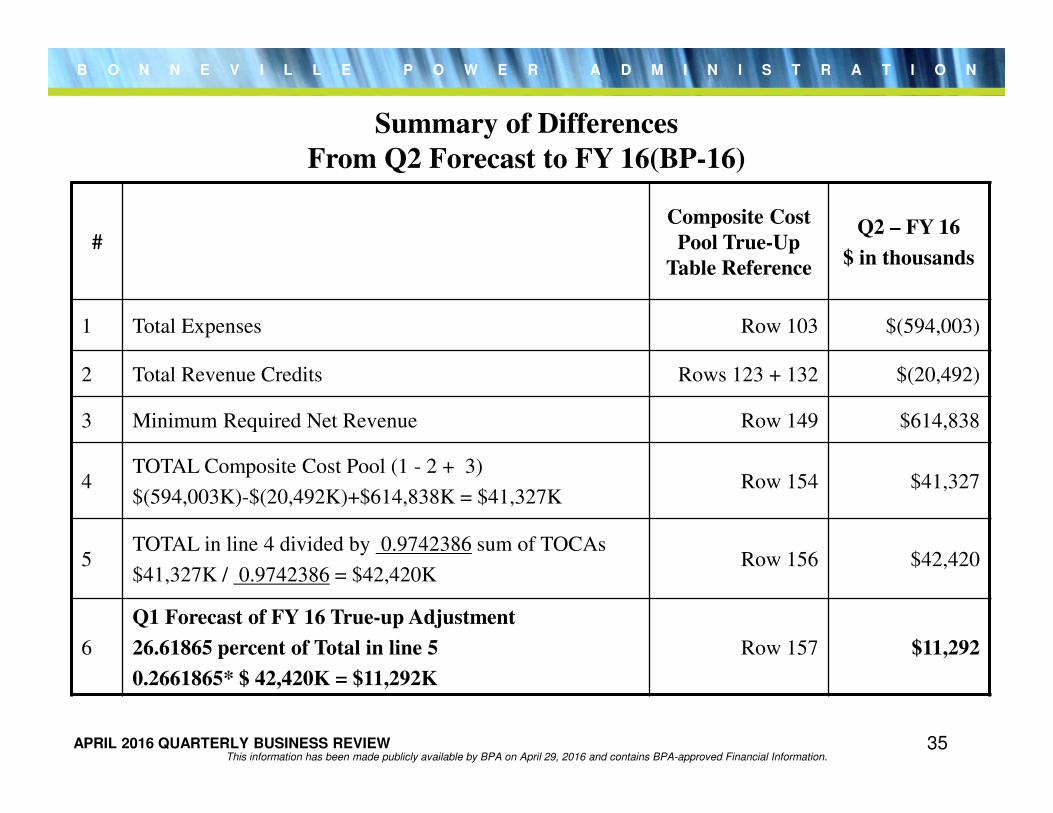
Summary of Differences
From Q2 Forecast to FY 16(BP-16)
#
Composite Cost
Pool True-Up
Table Reference
Q2 – FY 16
$ in thousands
1 Total Expenses Row 103 $(594,003)
2 Total Revenue Credits Rows 123 + 132 $(20,492)
3 Minimum Required Net Revenue Row 149 $614,838
4TOTAL Composite Cost Pool (1 - 2 + 3)
$(594,003K)-$(20,492K)+$614,838K = $41,327KRow 154 $41,327
5TOTAL in line 4 divided by 0.9742386 sum of TOCAs
$41,327K / 0.9742386 = $42,420KRow 156 $42,420
6
Q1 Forecast of FY 16 True-up Adjustment
26.61865 percent of Total in line 5
0.2661865* $ 42,420K = $11,292K
Row 157 $11,292
This information has been made publicly available by BPA on April 29, 2016 and contains BPA-approved Financial Information.35

B O N N E V I L L E P O W E R A D M I N I S T R A T I O N
APRIL 2016 QUARTERLY BUSINESS REVIEW
Lower Level Differences
From Q2 Forecast to FY 16 (BP-16)
# Line Item of Values Changed Over $4.0 MComposite Cost Pool
True-Up Table
Reference
Q2 – FY 2016
Rate Case ($ in
thousands)
1 Principal Payment of Fed Debt for Power Row 135 $ 983,278
2 Non-Cash Expenses Row 141 $ 282,829
3 Customer Proceeds Row 142 $ 81,611
4 Other Income, Expenses, Adjustments Row 79 $ 25,896
5 Agency Services G&A Row 76 $ 8,635
6OTHER POWER PURCHASES (omit, except
Designated Obligations or Purchases) Row 19 $ 8,527
7 STRATEGY, FINANCE & RISK MGMT Row 56 $ (8,540)
8 4(h)(10)(c) credit Row 108 $ (9,980)
9 BUREAU OF RECLAMATION Row 5 $ (11,500)
10 WNP-3 DEBT SVC Row 85 $ (157,467)
11 WNP-1 DEBT SVC Row 84 $ (215,917)
12 Expense Offset Row 80 $ (231,973)
This information has been made publicly available by BPA on April 29, 2016 and contains BPA-approved Financial Information.36
B O N N E V I L L E P O W E R A D M I N I S T R A T I O N
APRIL 2016 QUARTERLY BUSINESS REVIEW
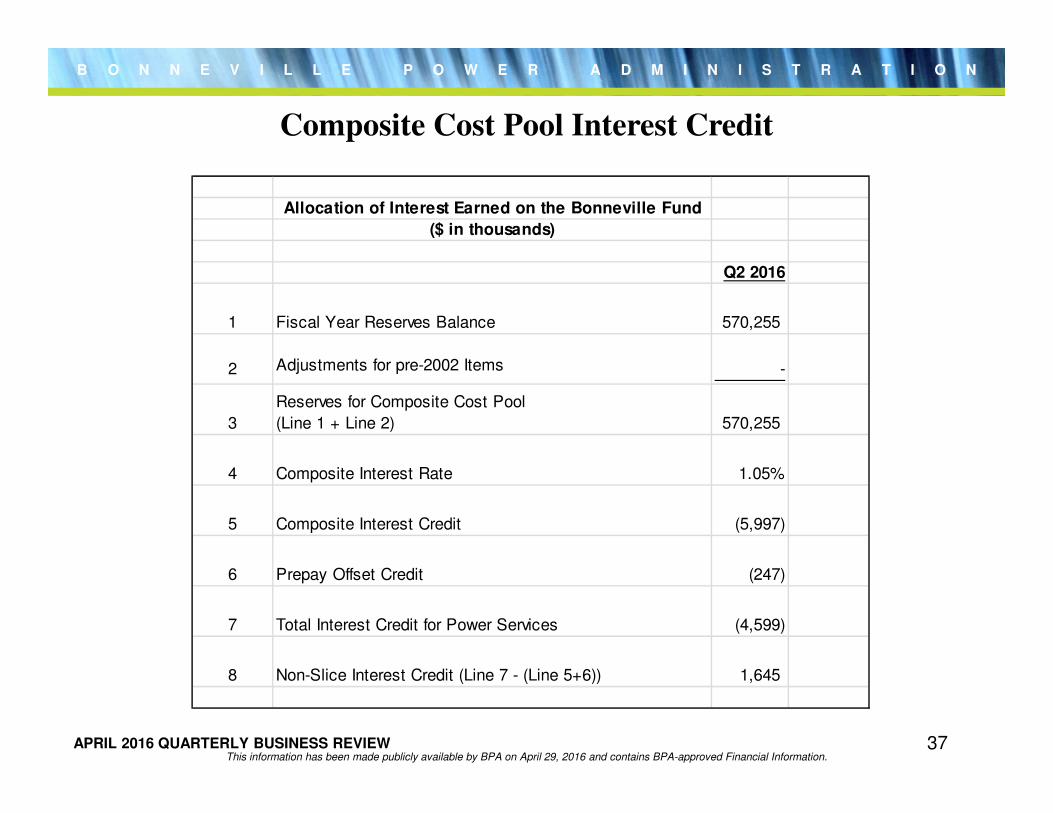
Composite Cost Pool Interest Credit
Allocation of Interest Earned on the Bonneville Fund
($ in thousands)
Q2 2016
1 Fiscal Year Reserves Balance 570,255
2 Adjustments for pre-2002 Items -
3
Reserves for Composite Cost Pool
(Line 1 + Line 2) 570,255
4 Composite Interest Rate 1.05%
5 Composite Interest Credit (5,997)
6 Prepay Offset Credit (247)
7 Total Interest Credit for Power Services (4,599)
8 Non-Slice Interest Credit (Line 7 - (Line 5+6)) 1,645
This information has been made publicly available by BPA on April 29, 2016 and contains BPA-approved Financial Information.37
B O N N E V I L L E P O W E R A D M I N I S T R A T I O N
APRIL 2016 QUARTERLY BUSINESS REVIEW
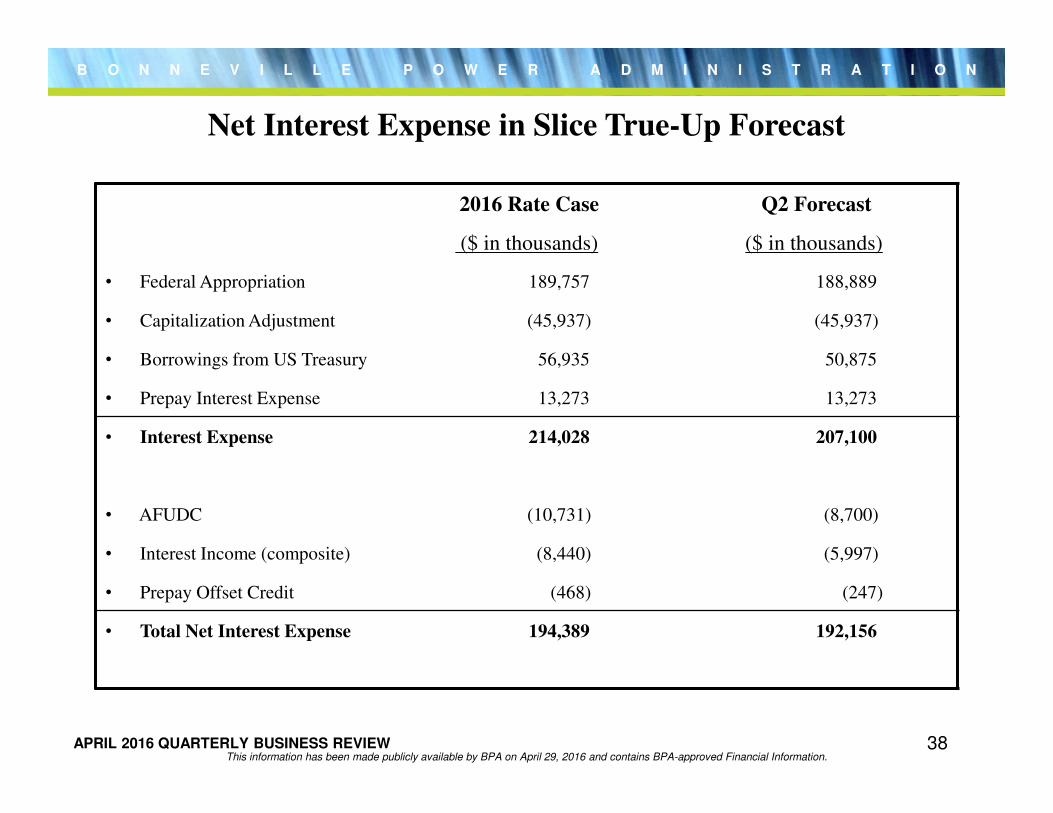
2016 Rate Case Q2 Forecast
($ in thousands) ($ in thousands)
• Federal Appropriation 189,757 188,889
• Capitalization Adjustment (45,937) (45,937)
• Borrowings from US Treasury 56,935 50,875
• Prepay Interest Expense 13,273 13,273
• Interest Expense 214,028 207,100
• AFUDC (10,731) (8,700)
• Interest Income (composite) (8,440) (5,997)
• Prepay Offset Credit (468) (247)
• Total Net Interest Expense 194,389 192,156
Net Interest Expense in Slice True-Up Forecast
This information has been made publicly available by BPA on April 29, 2016 and contains BPA-approved Financial Information.38
B O N N E V I L L E P O W E R A D M I N I S T R A T I O N
APRIL 2016 QUARTERLY BUSINESS REVIEW
Accelerating Appropriations and Slice True-Up
� Accelerating the repayment of appropriations using cash freed up by an EN line of credit and from prepay requires changes to the FY 2016 Slice True-Up.
� The Slice True-Up table is not equipped to show the funds made available to offset the higher appropriations payment. It is also not equipped to show the repayment of the EN line of credit. However, the Slice True-Up will show the higher appropriations payment. Without modification, Slice customers would be responsible for their share of the higher appropriations payment.
� We propose two additional lines in the calculation of minimum required net revenues for the FY 2016 Slice True-Up.
• Non-Cash Expenses: This will equal the portion of EN’s annual budget that is covered by the line of credit which allows BPA to accelerate repayment of appropriations.
• Customer proceeds: This will equal the amount of prepay funds committed to accelerate repayment of appropriations.
� For the FY 2017 Slice True-Up, we will propose an additional line that reflects the repayment of the EN line of credit obtained in FY 2016. If this line were not added to the Slice True-Up, Slice customers would receive a credit based on the lower EN debt service even though the cash freed up by the transaction would be used to repay the line of credit.
� These changes will be subject to review in the BP-18 rate proposal as described in Section 2.7.3 of the Tiered Rate Methodology.
This information has been made publicly available by BPA on April 29, 2016 and contains BPA-approved Financial Information.39
B O N N E V I L L E P O W E R A D M I N I S T R A T I O N
APRIL 2016 QUARTERLY BUSINESS REVIEW
New Lines in the Slice True-Up
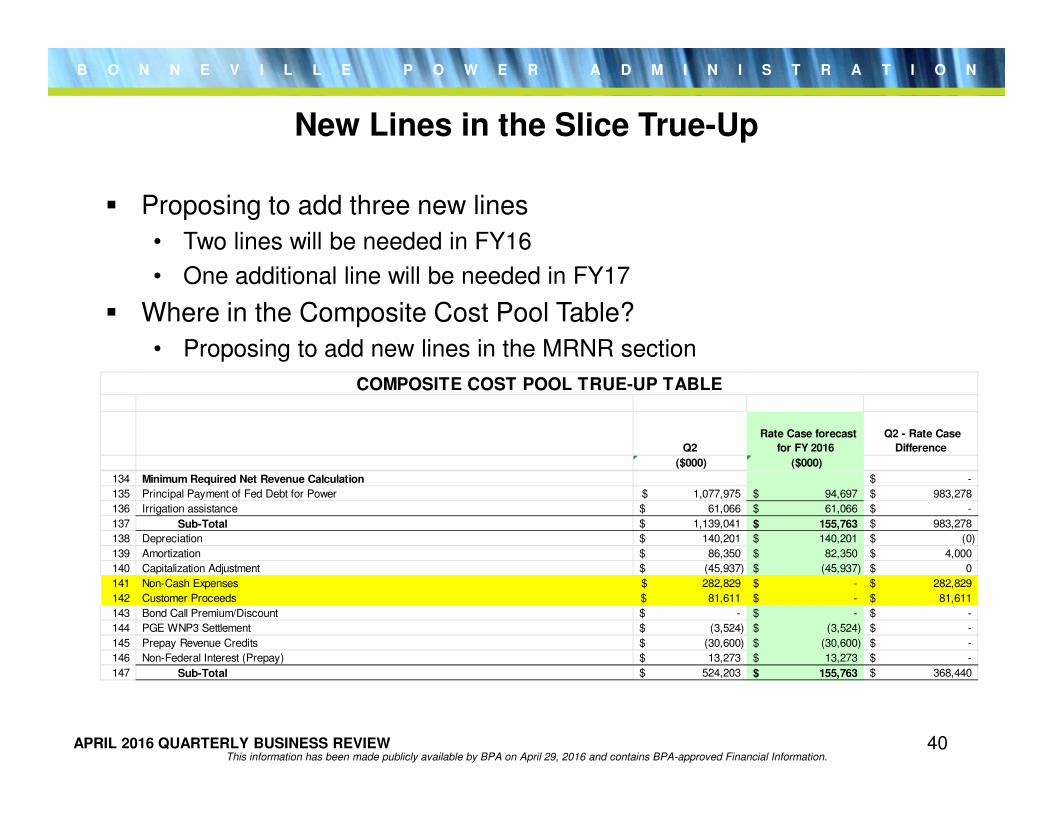
� Proposing to add three new lines
• Two lines will be needed in FY16
• One additional line will be needed in FY17
� Where in the Composite Cost Pool Table?
• Proposing to add new lines in the MRNR section
Q2
Rate Case forecast
for FY 2016
Q2 - Rate Case
Difference
($000) ($000)
COMPOSITE COST POOL TRUE-UP TABLE
134 Minimum Required Net Revenue Calculation -$
135 Principal Payment of Fed Debt for Power 1,077,975$ 94,697$ 983,278$
136 Irrigation assistance 61,066$ 61,066$ -$
137 Sub-Total 1,139,041$ 155,763$ 983,278$
138 Depreciation 140,201$ 140,201$ (0)$
139 Amortization 86,350$ 82,350$ 4,000$
140 Capitalization Adjustment (45,937)$ (45,937)$ 0$
141 Non-Cash Expenses 282,829$ -$ 282,829$
142 Customer Proceeds 81,611$ -$ 81,611$
143 Bond Call Premium/Discount -$ -$ -$
144 PGE WNP3 Settlement (3,524)$ (3,524)$ -$
145 Prepay Revenue Credits (30,600)$ (30,600)$ -$
146 Non-Federal Interest (Prepay) 13,273$ 13,273$ -$
147 Sub-Total 524,203$ 155,763$ 368,440$
This information has been made publicly available by BPA on April 29, 2016 and contains BPA-approved Financial Information.40
B O N N E V I L L E P O W E R A D M I N I S T R A T I O N
APRIL 2016 QUARTERLY BUSINESS REVIEW
Effects of Accelerating Appropriations in the Slice True-Up
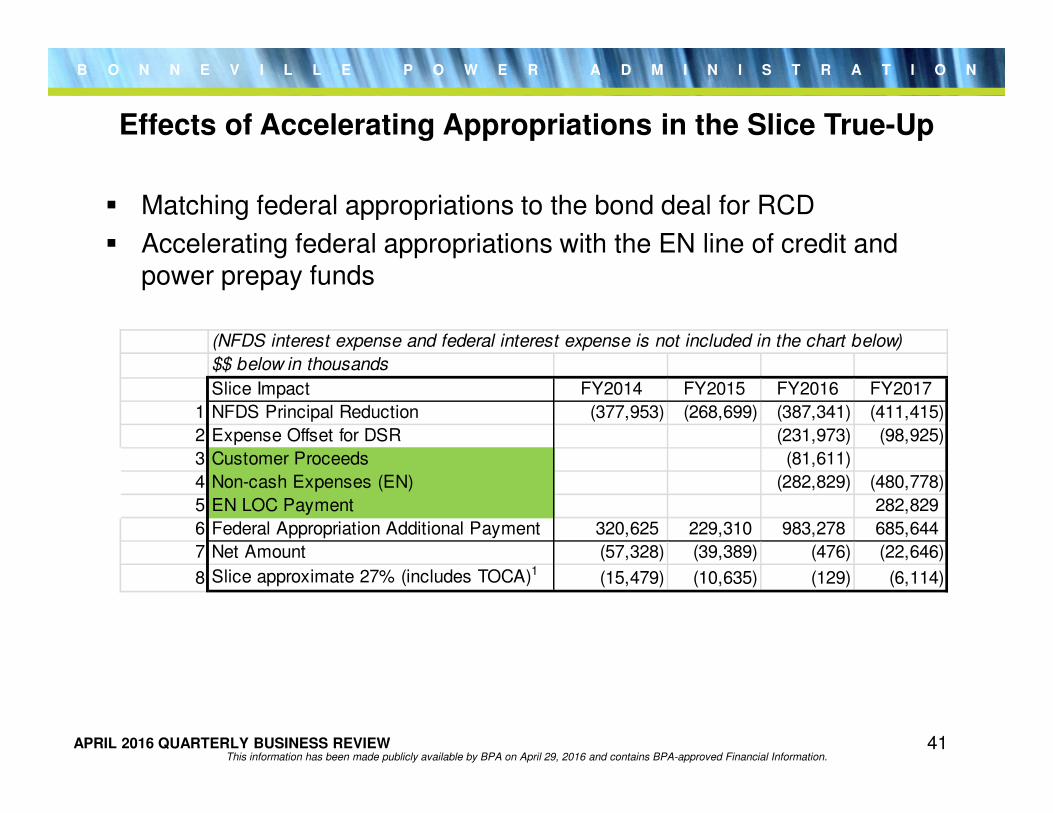
� Matching federal appropriations to the bond deal for RCD
� Accelerating federal appropriations with the EN line of credit and power prepay funds
(NFDS interest expense and federal interest expense is not included in the chart below)
$$ below in thousands
Slice Impact FY2014 FY2015 FY2016 FY2017
1 NFDS Principal Reduction (377,953) (268,699) (387,341) (411,415)
2 Expense Offset for DSR (231,973) (98,925)
3 Customer Proceeds (81,611)
4 Non-cash Expenses (EN) (282,829) (480,778)
5 EN LOC Payment 282,829
6 Federal Appropriation Additional Payment 320,625 229,310 983,278 685,644
7 Net Amount (57,328) (39,389) (476) (22,646)
8 Slice approximate 27% (includes TOCA)1 (15,479) (10,635) (129) (6,114)
This information has been made publicly available by BPA on April 29, 2016 and contains BPA-approved Financial Information.41
B O N N E V I L L E P O W E R A D M I N I S T R A T I O N
APRIL 2016 QUARTERLY BUSINESS REVIEW
FY 2015 Cost Verification Process Follow-up
Daniel FisherPublic Utilities Specialist
42This information has been made publicly available by BPA on April 29, 2016 and does not contains BPA-approved Financial information.
B O N N E V I L L E P O W E R A D M I N I S T R A T I O N
APRIL 2016 QUARTERLY BUSINESS REVIEW
Unused RHWM Credit
� The purpose is to share the full value of Unused Rate Period High Water Mark (RHWM) with all PF public customers.
� The existence of Unused RHWM can:
• Reduce System Augmentation.
o System Augmentation costs are allocated to the Composite cost pool and is thereby shared with Slice and Non-Slice power sales.
• Change Balancing Purchase costs and BPA’s share of Secondary revenue because the shape of System Augmentation is not the same as the shape of Unused RHWM.
o Balancing Purchase costs and BPA’s share of Secondary revenue are allocated to the Non-slice cost pool and thereby only impacts Non-Slice power sales.
• Create firm surplus.
o BPA’s share of surplus revenue, Secondary and firm, is credited to the Non-Slice cost pool and thereby only impacts Non-Slice power sales.
This information has been made publicly available by BPA on April 29, 2016 and does not contains BPA-approved Financial information.43
B O N N E V I L L E P O W E R A D M I N I S T R A T I O N
APRIL 2016 QUARTERLY BUSINESS REVIEW
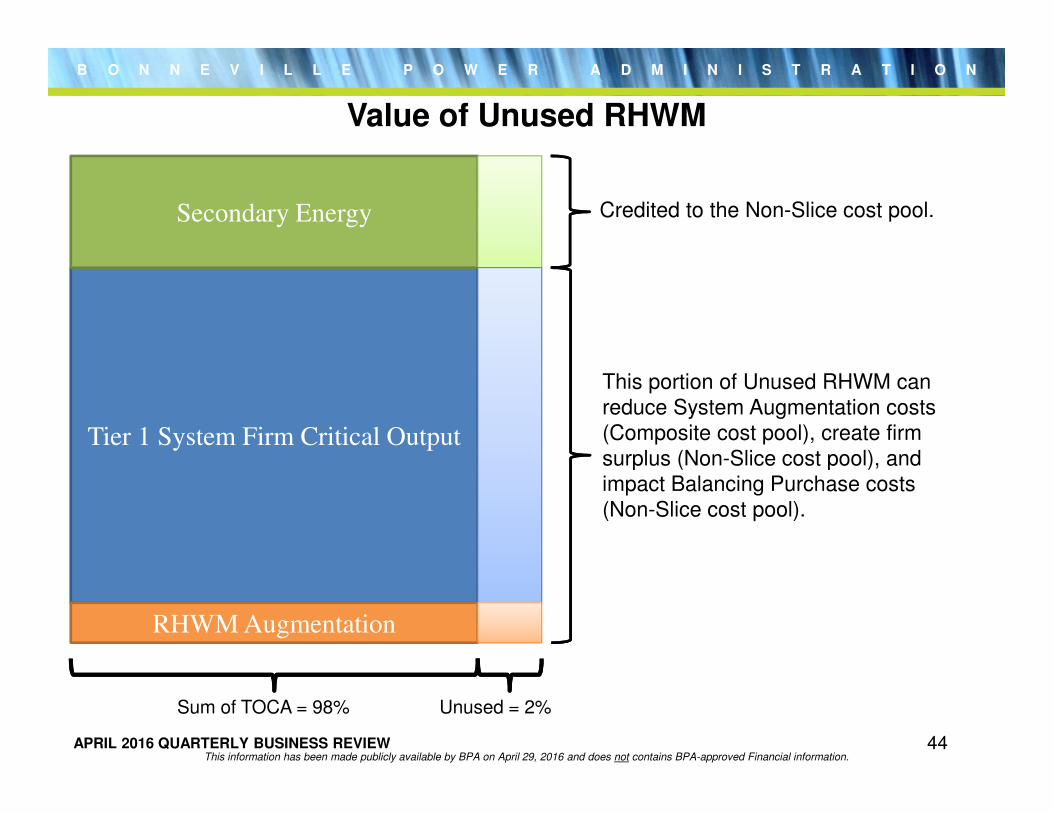
Value of Unused RHWM
Tier 1 System Firm Critical Output
RHWM Augmentation
Secondary Energy
Sum of TOCA = 98% Unused = 2%
Credited to the Non-Slice cost pool.
This portion of Unused RHWM can reduce System Augmentation costs (Composite cost pool), create firm surplus (Non-Slice cost pool), and impact Balancing Purchase costs (Non-Slice cost pool).
This information has been made publicly available by BPA on April 29, 2016 and does not contains BPA-approved Financial information.44
B O N N E V I L L E P O W E R A D M I N I S T R A T I O N
APRIL 2016 QUARTERLY BUSINESS REVIEW
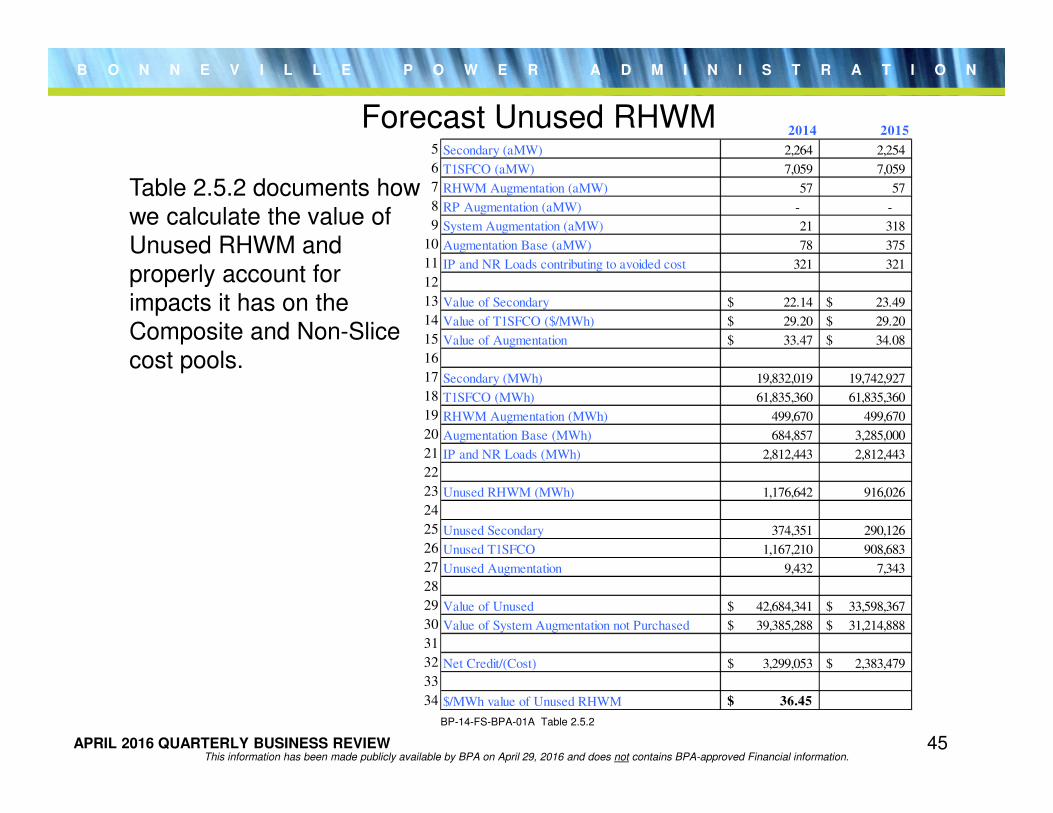
BP-14-FS-BPA-01A Table 2.5.2
2014 2015
5 Secondary (aMW) 2,264 2,254
6 T1SFCO (aMW) 7,059 7,059
7 RHWM Augmentation (aMW) 57 57
8 RP Augmentation (aMW) - -
9 System Augmentation (aMW) 21 318
10 Augmentation Base (aMW) 78 375
11 IP and NR Loads contributing to avoided cost 321 321
12
13 Value of Secondary 22.14$ 23.49$
14 Value of T1SFCO ($/MWh) 29.20$ 29.20$
15 Value of Augmentation 33.47$ 34.08$
16
17 Secondary (MWh) 19,832,019 19,742,927
18 T1SFCO (MWh) 61,835,360 61,835,360
19 RHWM Augmentation (MWh) 499,670 499,670
20 Augmentation Base (MWh) 684,857 3,285,000
21 IP and NR Loads (MWh) 2,812,443 2,812,443
22
23 Unused RHWM (MWh) 1,176,642 916,026
24
25 Unused Secondary 374,351 290,126
26 Unused T1SFCO 1,167,210 908,683
27 Unused Augmentation 9,432 7,343
28
29 Value of Unused 42,684,341$ 33,598,367$
30 Value of System Augmentation not Purchased 39,385,288$ 31,214,888$
31
32 Net Credit/(Cost) 3,299,053$ 2,383,479$
33
34 $/MWh value of Unused RHWM 36.45$
Forecast Unused RHWM
Table 2.5.2 documents how we calculate the value of Unused RHWM and properly account for impacts it has on the Composite and Non-Slice cost pools.
This information has been made publicly available by BPA on April 29, 2016 and does not contains BPA-approved Financial information.45
B O N N E V I L L E P O W E R A D M I N I S T R A T I O N
APRIL 2016 QUARTERLY BUSINESS REVIEW
Actual Unused RHWM
� Actual Unused RHWM can be different than forecast due to:
• A change in a customer’s Tier One Cost Allocator (TOCA).
o TOCAs for Slice/Block and Block customers can change in the Annual Net Requirement process.
o TOCAs for Load Following customers can change if there is substantial reason to believe that the customer’s actual load will differ substantially from its forecast load.
• A change in actual load of a Load Following customer as captured through the Load Shaping Charge True-Up.
o The Load Shaping Charge True-Up is used to avoid charging or crediting the market-based Load Shaping Rates for energy within the customer’s RHWM. Application of the Load Shaping Charge True-Up has the same financial impact as changing the customer’s TOCA at the end of the fiscal year.
This information has been made publicly available by BPA on April 29, 2016 and does not contains BPA-approved Financial information.46
B O N N E V I L L E P O W E R A D M I N I S T R A T I O N
APRIL 2016 QUARTERLY BUSINESS REVIEW
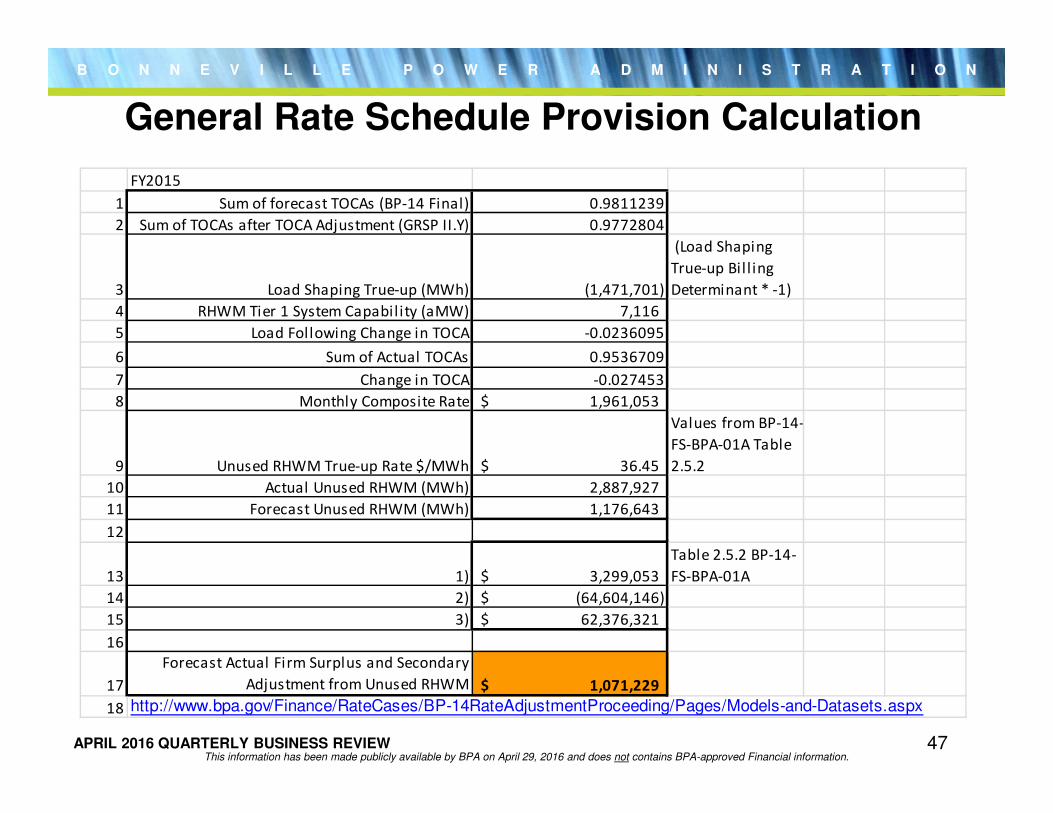
General Rate Schedule Provision Calculation
FY2015
1 Sum of forecast TOCAs (BP-14 Final) 0.9811239
2 Sum of TOCAs after TOCA Adjustment (GRSP II.Y) 0.9772804
3 Load Shaping True-up (MWh) (1,471,701)
(Load Shaping
True-up Bil l ing
Determinant * -1)
4 RHWM Tier 1 System Capabil ity (aMW) 7,116
5 Load Following Change in TOCA -0.0236095
6 Sum of Actual TOCAs 0.9536709
7 Change in TOCA -0.027453
8 Monthly Composite Rate 1,961,053$
9 Unused RHWM True-up Rate $/MWh 36.45$
Values from BP-14-
FS-BPA-01A Table
2.5.2
10 Actual Unused RHWM (MWh) 2,887,927
11 Forecast Unused RHWM (MWh) 1,176,643
12
13 1) 3,299,053$
Table 2.5.2 BP-14-
FS-BPA-01A
14 2) (64,604,146)$
15 3) 62,376,321$
16
17
Forecast Actual Firm Surplus and Secondary
Adjustment from Unused RHWM 1,071,229$
18 http://www.bpa.gov/Finance/RateCases/BP-14RateAdjustmentProceeding/Pages/Models-and-Datasets.aspx
47This information has been made publicly available by BPA on April 29, 2016 and does not contains BPA-approved Financial information.
B O N N E V I L L E P O W E R A D M I N I S T R A T I O N
APRIL 2016 QUARTERLY BUSINESS REVIEW
2016 IPR Process Update
Mary HawkenManager Analysis and Requirements
48This information has been made publicly available by BPA on April 29, 2016 and does not contains BPA-approved Financial information.

B O N N E V I L L E P O W E R A D M I N I S T R A T I O N
APRIL 2016 QUARTERLY BUSINESS REVIEW
Save the Dates
� Kick-off Meeting: June 16th
• 9:00 am - 12:30 pm
� Workshops: June 20-24• June 20th:
o Afternoon: CAO Organization
o Afternoon: Information Technology
• June 21st:o Morning: Fed Hydro
o Afternoon: Columbia Generating Station
• June 22nd:o Morning: Fish & Wildlife
o Afternoon: Energy Efficiency
• June 23rd:o Morning: Transmission
o Afternoon: Open for Additional Topics
• June 24th:o Morning: Debt Management
This information has been made publicly available by BPA on April 29, 2016 and does not contains BPA-approved Financial information.49
B O N N E V I L L E P O W E R A D M I N I S T R A T I O N
APRIL 2016 QUARTERLY BUSINESS REVIEW
Quality Bill Initiative
Tina KoTransmission Internal Operations
This information has been made publicly available by BPA on April 29, 2016 and does not contains BPA-approved Financial information.50
B O N N E V I L L E P O W E R A D M I N I S T R A T I O N
APRIL 2016 QUARTERLY BUSINESS REVIEW
BPA Revenue Billing Overview
� ~300 Power and Transmission customers
• Collecting over $3 billion in revenue/year
• Translates to ~500 bills/month
� Customer bills are prepared by Revenue Analysts in the Customer Billing organization
• Historically, Customer Billing has had 2 metrics:
o 98% of monthly bills are accurate (based on Revenue Analyst Oversight errors)
o 99% of monthly bills are timely (processed by priority due date)
This information has been made publicly available by BPA on April 29, 2016 and does not contains BPA-approved Financial information.51
B O N N E V I L L E P O W E R A D M I N I S T R A T I O N
APRIL 2016 QUARTERLY BUSINESS REVIEW
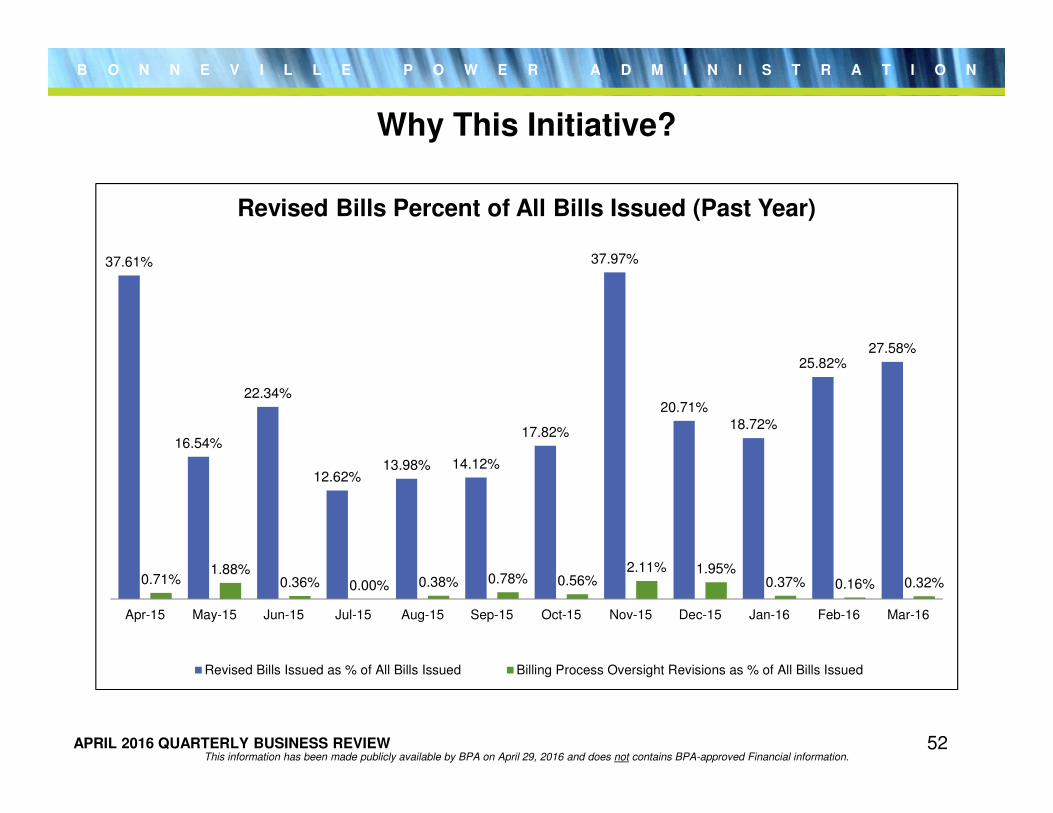
Why This Initiative?
37.61%
16.54%
22.34%
12.62%13.98% 14.12%
17.82%
37.97%
20.71%18.72%
25.82%27.58%
0.71%1.88%
0.36% 0.00% 0.38% 0.78% 0.56%2.11% 1.95%
0.37% 0.16% 0.32%
Apr-15 May-15 Jun-15 Jul-15 Aug-15 Sep-15 Oct-15 Nov-15 Dec-15 Jan-16 Feb-16 Mar-16
Revised Bills Percent of All Bills Issued (Past Year)
Revised Bills Issued as % of All Bills Issued Billing Process Oversight Revisions as % of All Bills Issued
This information has been made publicly available by BPA on April 29, 2016 and does not contains BPA-approved Financial information.52
B O N N E V I L L E P O W E R A D M I N I S T R A T I O N
APRIL 2016 QUARTERLY BUSINESS REVIEW
Process Summary
� DEFINE what it means to have a quality bill • Right product, right rate, right amount, invoiced the 1st time
� CONDUCT as-is assessment as to the agency’s performance against this quality vision and what is causing bill revisions
� RESEARCH what other utilities do (we looked at Tennessee Valley Authority)
� ADOPT appropriate metrics, business processes (including controls) for items within Customer Support Services’ control
� IMPLEMENT (began with FY16)
� REQUEST others in the agency that have touchpoints into the billing process to assist in achieving quality bills at BPA
� MONITOR & ADJUST (continuous)
This information has been made publicly available by BPA on April 29, 2016 and does not contains BPA-approved Financial information.53
B O N N E V I L L E P O W E R A D M I N I S T R A T I O N
APRIL 2016 QUARTERLY BUSINESS REVIEW
Measuring Progress
62.39 %
83.46 %
77.66 %
87.38 % 86.02 % 85.88 %
82.18 %
62.03 %
79.29 %81.28 %
74.18 % 72.42 %
APR MAY JUN JUL AUG SEP OCT NOV DEC JAN FEB MAR
Q3 Q4 Q1 Q2
2015 2016
Number of Revisions Accuracy Rate
Accuracy Rate Target - 78.54% 12-Month Rolling Average YTD Accuracy Rate
This information has been made publicly available by BPA on April 29, 2016 and does not contains BPA-approved Financial information.54
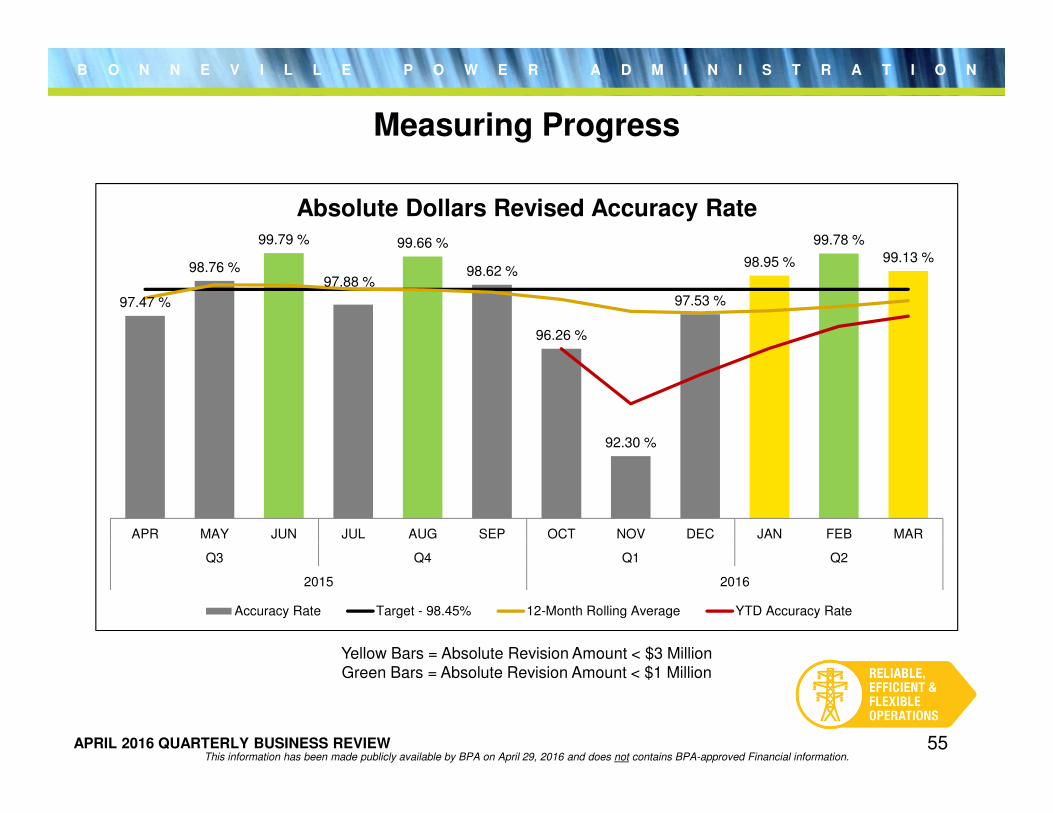
B O N N E V I L L E P O W E R A D M I N I S T R A T I O N
APRIL 2016 QUARTERLY BUSINESS REVIEW
Measuring Progress
Yellow Bars = Absolute Revision Amount < $3 MillionGreen Bars = Absolute Revision Amount < $1 Million
97.47 %
98.76 %
99.79 %
97.88 %
99.66 %
98.62 %
96.26 %
92.30 %
97.53 %
98.95 %
99.78 %
99.13 %
APR MAY JUN JUL AUG SEP OCT NOV DEC JAN FEB MAR
Q3 Q4 Q1 Q2
2015 2016
Absolute Dollars Revised Accuracy Rate
Accuracy Rate Target - 98.45% 12-Month Rolling Average YTD Accuracy Rate
This information has been made publicly available by BPA on April 29, 2016 and does not contains BPA-approved Financial information.55
B O N N E V I L L E P O W E R A D M I N I S T R A T I O N
APRIL 2016 QUARTERLY BUSINESS REVIEW
CGS Decommissioning and Site Restoration Trust Fund
Update on Investment Re-allocation
Alex RothSenior Financial Analyst
56This information has been made publicly available by BPA on April 29, 2016 and does not contains BPA-approved Financial information.
B O N N E V I L L E P O W E R A D M I N I S T R A T I O N
APRIL 2016 QUARTERLY BUSINESS REVIEW
Background
� The sponsor of each U.S. nuclear reactor is required to provide for the funding of its eventual decommissioning under rules set by the Nuclear Regulatory Commission (NRC).
� The CGS Fund was originally managed by Energy Northwest (EN). Because Washington State law restricts the types of assets EN can invest in, BPA and EN agreed in 1996 that BPA would assume and manage the Fund.
� The decommissioning account has a market value of $228 million (as of 3/31/16). Estimated Decommissioning Liability is about $1.6 billion, to be available when CGS’ license expires in December 2043.
� BPA also has a separate trust account to fund the site restoration of CGS after radioactive materials are removed or contained. Its balance is $37 million (as of 3/31/16).
� BPA makes ongoing contributions to the CGS Decommissioning and Site Restoration Funds, totaling $3+ million per year.
57This information has been made publicly available by BPA on April 29, 2016 and does not contains BPA-approved Financial information.
B O N N E V I L L E P O W E R A D M I N I S T R A T I O N
APRIL 2016 QUARTERLY BUSINESS REVIEW
Investments
� Fund investments are set by a committee of Bonneville managers and senior staff under the sponsorship of Bonneville’s CFO.
� Assets include domestic and international equities, corporate and government fixed-income securities, and a real estate investment trust.
� Assets are held in trust by a bank and are invested in broad institutional index funds with extremely low expense ratios.
� Both the CGS Decommissioning Fund and the CGS Site Restoration Fund have the same target investment allocations.
� Investments are re-assessed periodically and monitored continually, but are generally invested according to a long-term, buy-and-hold strategy.
58This information has been made publicly available by BPA on April 29, 2016 and does not contains BPA-approved Financial information.
B O N N E V I L L E P O W E R A D M I N I S T R A T I O N
APRIL 2016 QUARTERLY BUSINESS REVIEW
Allocation Changes
� Bonneville periodically engages expert investment consultants to advise on Fund allocations. In 2014 Bonneville hired an independent consultant to provide an updated asset allocation study for the Funds.
� The Previous target allocation was about 41.4% investment in equities and 58.6% in fixed income. This allocation strategy was adopted in 2010, before re-licensing extended the target date of the Fund from 2023 to 2043.
� BPA’s financial consultant recommended an increase in the equity allocation of investments to 80%, in light of updated financial market data CGS’ 20-year license extension.
� Despite the changes, no new asset classes are expected to be added to the portfolios.
59This information has been made publicly available by BPA on April 29, 2016 and does not contains BPA-approved Financial information.
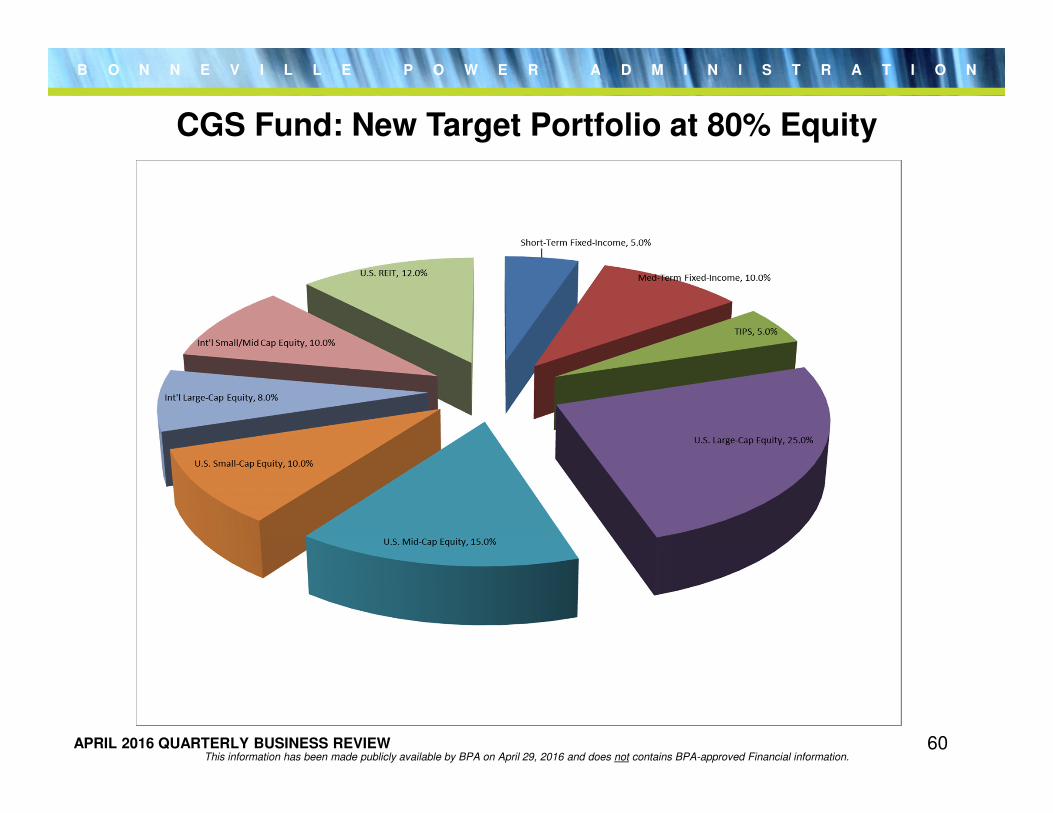
B O N N E V I L L E P O W E R A D M I N I S T R A T I O N
APRIL 2016 QUARTERLY BUSINESS REVIEW
CGS Fund: New Target Portfolio at 80% Equity
60This information has been made publicly available by BPA on April 29, 2016 and does not contains BPA-approved Financial information.
B O N N E V I L L E P O W E R A D M I N I S T R A T I O N
APRIL 2016 QUARTERLY BUSINESS REVIEW
Risks and Benefits of Allocation Changes
� Greater exposure to equity volatility could cause the NRC to view the Trust as under-funded in the event of a market downturn. BPA views this risk as quite low based on the NRC’s regulatory practice.
� Benchmarking studies show a great variety of different equity levels among nuclear decommissioning trusts (NDTs) nationally. Most are substantially lower than 80%. But equity levels are based on each power plant’s individual circumstances. Tennessee Valley Authority (TVA) has 6 nuclear plants and maintains a large NDT with a 90% equity target.
� A higher equity percentage would lead to greater long-term expected returns. This would make it less likely that BPA would have to increase future contributions, or that the Trust would be under-funded.
� The long time horizon of the fund mitigates some of the volatility of equity markets.
61This information has been made publicly available by BPA on April 29, 2016 and does not contains BPA-approved Financial information.
B O N N E V I L L E P O W E R A D M I N I S T R A T I O N
APRIL 2016 QUARTERLY BUSINESS REVIEW
Implementation of Changes
� The transition of the portfolio to the new allocation is being made in stages to minimize risks associated with market timing and to allow for broader discussion of new Fund allocations and equity levels.
� The first stage was implemented in May 2015, bringing the Fund’s equity allocation from 42.5%* (as of March 31, 2015) to 51.8%, with the remainder held in fixed-income investments.
� Subject to careful consideration of any further feedback from regional stakeholders this spring, Bonneville expects to proceed to the next stage of implementation of the new equity allocation in the summer of 2016.
� Questions?*Equity % was slightly above target levels due to appreciation of equity assets.
62This information has been made publicly available by BPA on April 29, 2016 and does not contains BPA-approved Financial information.

B O N N E V I L L E P O W E R A D M I N I S T R A T I O N
APRIL 2016 QUARTERLY BUSINESS REVIEW
Appendix
63
B O N N E V I L L E P O W E R A D M I N I S T R A T I O N
APRIL 2016 QUARTERLY BUSINESS REVIEW
Planned Network Additions Associated With Interconnection Requests
The following are planned* Network additions associated with requested line/load and generation interconnections that were recently approved:
L0346_Airport Substation:
BPA will design and construct a 115kV dead-end steel structure with a load-break disconnect switch inside the new Consumer’s Power Airport Substation, and another 115kV dead-end steel structure outside the Airport substation with a line-drop disconnect switch in order to make the final connections to BPA’s Albany – Lebanon No. 1 115kV line.
*Construction is contingent upon the requestor signing a construction agreement.
Please direct inquiries to Jana Jusupovic in Customer Service Engineering at [email protected]
64This information has been made publicly available by BPA on April 29, 2016 and does not contains BPA-approved Financial information.
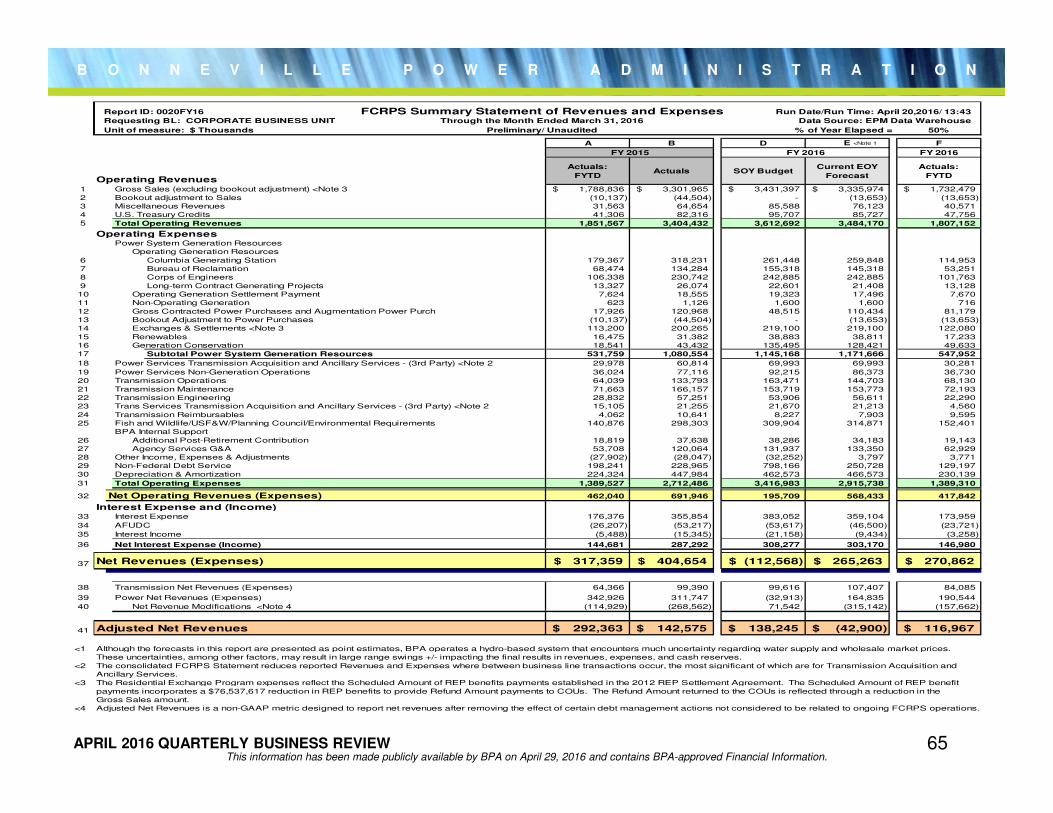
B O N N E V I L L E P O W E R A D M I N I S T R A T I O N
APRIL 2016 QUARTERLY BUSINESS REVIEWThis information has been made publicly available by BPA on April 29, 2016 and contains BPA-approved Financial Information.
65
Report ID: 0020FY16 FCRPS Summary Statement of Revenues and Expenses Run Date/Run Time: April 20,2016/ 13:43
Requesting BL: CORPORATE BUSINESS UNIT Through the Month Ended March 31, 2016 Data Source: EPM Data Warehouse
Unit of measure: $ Thousands Preliminary/ Unaudited % of Year Elapsed = 50%
A B D E <Note 1 F
FY 2016
Operating Revenues
Actuals:
FYTDActuals SOY Budget
Current EOY
Forecast
Actuals:
FYTD
1 Gross Sales (excluding bookout adjustment) <Note 3 1,788,836$ 3,301,965$ 3,431,397$ 3,335,974$ 1,732,479$
2 Bookout adjustment to Sales (10,137) (44,504) - (13,653) (13,653)
3 Miscellaneous Revenues 31,563 64,654 85,588 76,123 40,571
4 U.S. Treasury Credits 41,306 82,316 95,707 85,727 47,756
5 Total Operating Revenues 1,851,567 3,404,432 3,612,692 3,484,170 1,807,152
Operating ExpensesPower System Generation Resources
Operating Generation Resources
6 Columbia Generating Station 179,367 318,231 261,448 259,848 114,953
7 Bureau of Reclamation 68,474 134,284 155,318 145,318 53,251
8 Corps of Engineers 106,338 230,742 242,885 242,885 101,763
9 Long-term Contract Generating Projects 13,327 26,074 22,601 21,408 13,128
10 Operating Generation Settlement Payment 7,624 18,555 19,323 17,496 7,670
11 Non-Operating Generation 623 1,126 1,600 1,600 716
12 Gross Contracted Power Purchases and Augmentation Power Purch 17,926 120,968 48,515 110,434 81,179
13 Bookout Adjustment to Power Purchases (10,137) (44,504) - (13,653) (13,653)
14 Exchanges & Settlements <Note 3 113,200 200,265 219,100 219,100 122,080
15 Renewables 16,475 31,382 38,883 38,811 17,233
16 Generation Conservation 18,541 43,432 135,495 128,421 49,633
17 Subtotal Power System Generation Resources 531,759 1,080,554 1,145,168 1,171,666 547,952
18 Power Services Transmission Acquisition and Ancillary Services - (3rd Party) <Note 2 29,978 60,814 69,993 69,993 30,281
19 Power Services Non-Generation Operations 36,024 77,116 92,215 86,373 36,730
20 Transmission Operations 64,039 133,793 163,471 144,703 68,130
21 Transmission Maintenance 71,663 166,157 153,719 153,773 72,193
22 Transmission Engineering 28,832 57,251 53,906 56,611 22,290
23 Trans Services Transmission Acquisition and Ancillary Services - (3rd Party) <Note 2 15,105 21,255 21,670 21,213 4,560
24 Transmission Reimbursables 4,062 10,641 8,227 7,903 9,595
25 Fish and Wildlife/USF&W/Planning Council/Environmental Requirements 140,876 298,303 309,904 314,871 152,401
BPA Internal Support
26 Additional Post-Retirement Contribution 18,819 37,638 38,286 34,183 19,143
27 Agency Services G&A 53,708 120,064 131,937 133,350 62,929
28 Other Income, Expenses & Adjustments (27,902) (28,047) (32,252) 3,797 3,771
29 Non-Federal Debt Service 198,241 228,965 798,166 250,728 129,197
30 Depreciation & Amortization 224,324 447,984 462,573 466,573 230,139
31 Total Operating Expenses 1,389,527 2,712,486 3,416,983 2,915,738 1,389,310
32 Net Operating Revenues (Expenses) 462,040 691,946 195,709 568,433 417,842
Interest Expense and (Income)33 Interest Expense 176,376 355,854 383,052 359,104 173,959
34 AFUDC (26,207) (53,217) (53,617) (46,500) (23,721)
35 Interest Income (5,488) (15,345) (21,158) (9,434) (3,258)
36 Net Interest Expense (Income) 144,681 287,292 308,277 303,170 146,980- -
37 Net Revenues (Expenses) 317,359$ 404,654$ (112,568)$ 265,263$ 270,862$
38 Transmission Net Revenues (Expenses) 64,366 99,390 99,616 107,407 84,085
39 Power Net Revenues (Expenses) 342,926 311,747 (32,913) 164,835 190,544
40 Net Revenue Modifications <Note 4 (114,929) (268,562) 71,542 (315,142) (157,662)
41 Adjusted Net Revenues 292,363$ 142,575$ 138,245$ (42,900)$ 116,967$
<1
These uncertainties, among other factors, may result in large range swings +/- impacting the final results in revenues, expenses, and cash reserves.
<2
Ancillary Services.
<3
payments incorporates a $76,537,617 reduction in REP benefits to provide Refund Amount payments to COUs. The Refund Amount returned to the COUs is reflected through a reduction in the
Gross Sales amount.
<4 Adjusted Net Revenues is a non-GAAP metric designed to report net revenues after removing the effect of certain debt management actions not considered to be related to ongoing FCRPS operations.
FY 2015 FY 2016
The Residential Exchange Program expenses reflect the Scheduled Amount of REP benefits payments established in the 2012 REP Settlement Agreement. The Scheduled Amount of REP benefit
Although the forecasts in this report are presented as point estimates, BPA operates a hydro-based system that encounters much uncertainty regarding water supply and wholesale market prices.
The consolidated FCRPS Statement reduces reported Revenues and Expenses where between business line transactions occur, the most significant of which are for Transmission Acquisition and
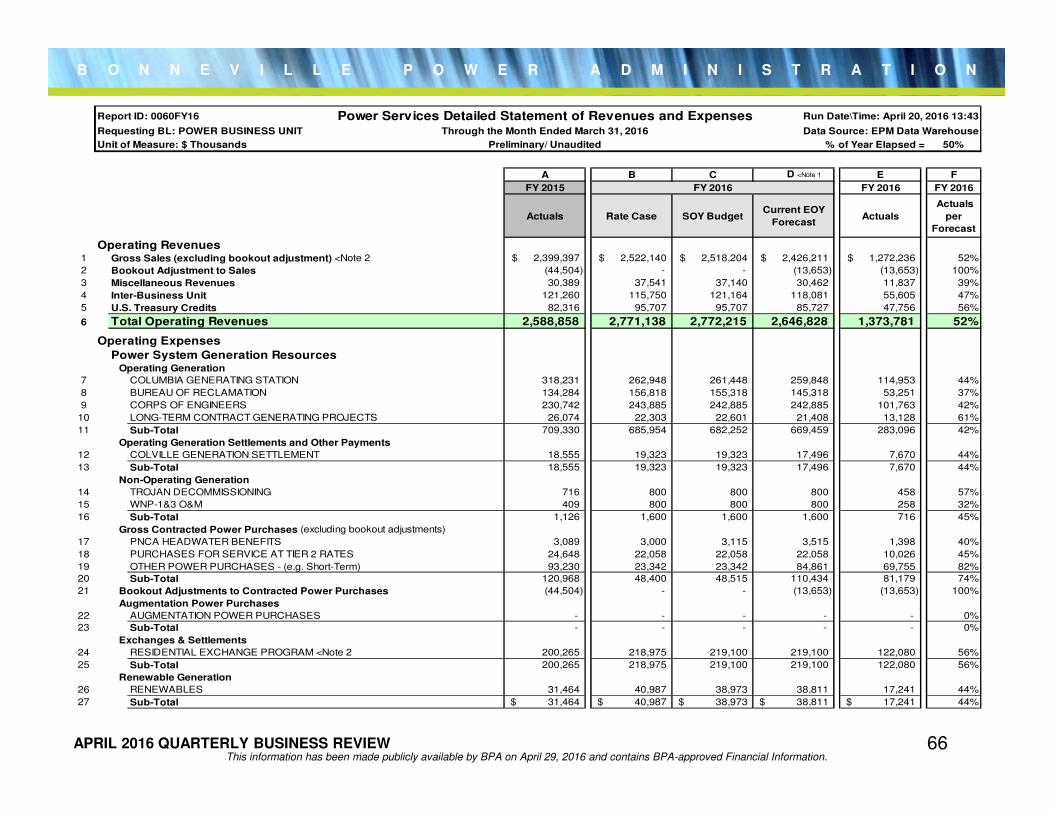
B O N N E V I L L E P O W E R A D M I N I S T R A T I O N
APRIL 2016 QUARTERLY BUSINESS REVIEWThis information has been made publicly available by BPA on April 29, 2016 and contains BPA-approved Financial Information.
66
Report ID: 0060FY16 Power Services Detailed Statement of Revenues and Expenses Run Date\Time: April 20, 2016 13:43
Requesting BL: POWER BUSINESS UNIT Through the Month Ended March 31, 2016 Data Source: EPM Data Warehouse
Unit of Measure: $ Thousands Preliminary/ Unaudited % of Year Elapsed = 50%
A B C D <Note 1 E F
FY 2015 FY 2016 FY 2016
Actuals Rate Case SOY BudgetCurrent EOY
ForecastActuals
Actuals
per
Forecast
Operating Revenues1 Gross Sales (excluding bookout adjustment) <Note 2 2,399,397$ 2,522,140$ 2,518,204$ 2,426,211$ 1,272,236$ 52%
2 Bookout Adjustment to Sales (44,504) - - (13,653) (13,653) 100%
3 Miscellaneous Revenues 30,389 37,541 37,140 30,462 11,837 39%
4 Inter-Business Unit 121,260 115,750 121,164 118,081 55,605 47%
5 U.S. Treasury Credits 82,316 95,707 95,707 85,727 47,756 56%
6 Total Operating Revenues 2,588,858 2,771,138 2,772,215 2,646,828 1,373,781 52%
Operating Expenses
Power System Generation ResourcesOperating Generation
7 COLUMBIA GENERATING STATION 318,231 262,948 261,448 259,848 114,953 44%
8 BUREAU OF RECLAMATION 134,284 156,818 155,318 145,318 53,251 37%
9 CORPS OF ENGINEERS 230,742 243,885 242,885 242,885 101,763 42%
10 LONG-TERM CONTRACT GENERATING PROJECTS 26,074 22,303 22,601 21,408 13,128 61%
11 Sub-Total 709,330 685,954 682,252 669,459 283,096 42%
Operating Generation Settlements and Other Payments
12 COLVILLE GENERATION SETTLEMENT 18,555 19,323 19,323 17,496 7,670 44%
13 Sub-Total 18,555 19,323 19,323 17,496 7,670 44%
Non-Operating Generation
14 TROJAN DECOMMISSIONING 716 800 800 800 458 57%
15 WNP-1&3 O&M 409 800 800 800 258 32%
16 Sub-Total 1,126 1,600 1,600 1,600 716 45%
Gross Contracted Power Purchases (excluding bookout adjustments)
17 PNCA HEADWATER BENEFITS 3,089 3,000 3,115 3,515 1,398 40%
18 PURCHASES FOR SERVICE AT TIER 2 RATES 24,648 22,058 22,058 22,058 10,026 45%
19 OTHER POWER PURCHASES - (e.g. Short-Term) 93,230 23,342 23,342 84,861 69,755 82%
20 Sub-Total 120,968 48,400 48,515 110,434 81,179 74%
21 Bookout Adjustments to Contracted Power Purchases (44,504) - - (13,653) (13,653) 100%
Augmentation Power Purchases
22 AUGMENTATION POWER PURCHASES - - - - - 0%
23 Sub-Total - - - - - 0%
Exchanges & Settlements
24 RESIDENTIAL EXCHANGE PROGRAM <Note 2 200,265 218,975 219,100 219,100 122,080 56%
25 Sub-Total 200,265 218,975 219,100 219,100 122,080 56%
Renewable Generation
26 RENEWABLES 31,464 40,987 38,973 38,811 17,241 44%
27 Sub-Total 31,464$ 40,987$ 38,973$ 38,811$ 17,241$ 44%
FY 2016
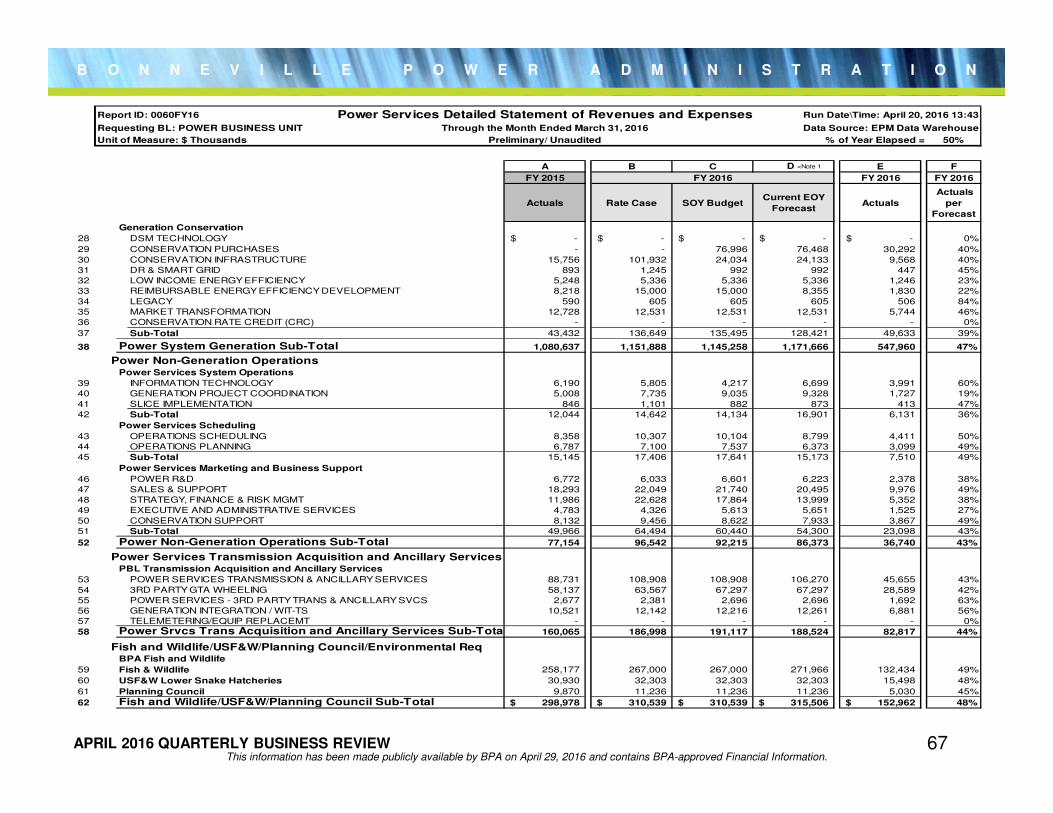
B O N N E V I L L E P O W E R A D M I N I S T R A T I O N
APRIL 2016 QUARTERLY BUSINESS REVIEWThis information has been made publicly available by BPA on April 29, 2016 and contains BPA-approved Financial Information.
67
Report ID: 0060FY16 Power Services Detailed Statement of Revenues and Expenses Run Date\Time: April 20, 2016 13:43
Requesting BL: POWER BUSINESS UNIT Through the Month Ended March 31, 2016 Data Source: EPM Data Warehouse
Unit of Measure: $ Thousands Preliminary/ Unaudited % of Year Elapsed = 50%
A B C D <Note 1 E F
FY 2015 FY 2016 FY 2016
Actuals Rate Case SOY BudgetCurrent EOY
ForecastActuals
Actuals
per
Forecast
Generation Conservation
28 DSM TECHNOLOGY - $ - $ - $ - $ - $ 0%
29 CONSERVATION PURCHASES - - 76,996 76,468 30,292 40%
30 CONSERVATION INFRASTRUCTURE 15,756 101,932 24,034 24,133 9,568 40%
31 DR & SMART GRID 893 1,245 992 992 447 45%
32 LOW INCOME ENERGY EFFICIENCY 5,248 5,336 5,336 5,336 1,246 23%
33 REIMBURSABLE ENERGY EFFICIENCY DEVELOPMENT 8,218 15,000 15,000 8,355 1,830 22%
34 LEGACY 590 605 605 605 506 84%
35 MARKET TRANSFORMATION 12,728 12,531 12,531 12,531 5,744 46%
36 CONSERVATION RATE CREDIT (CRC) - - - - - 0%
37 Sub-Total 43,432 136,649 135,495 128,421 49,633 39%
38 Power System Generation Sub-Total 1,080,637 1,151,888 1,145,258 1,171,666 547,960 47%
Power Non-Generation OperationsPower Services System Operations
39 INFORMATION TECHNOLOGY 6,190 5,805 4,217 6,699 3,991 60%
40 GENERATION PROJECT COORDINATION 5,008 7,735 9,035 9,328 1,727 19%
41 SLICE IMPLEMENTATION 846 1,101 882 873 413 47%
42 Sub-Total 12,044 14,642 14,134 16,901 6,131 36%
Power Services Scheduling
43 OPERATIONS SCHEDULING 8,358 10,307 10,104 8,799 4,411 50%
44 OPERATIONS PLANNING 6,787 7,100 7,537 6,373 3,099 49%
45 Sub-Total 15,145 17,406 17,641 15,173 7,510 49%
Power Services Marketing and Business Support
46 POWER R&D 6,772 6,033 6,601 6,223 2,378 38%
47 SALES & SUPPORT 18,293 22,049 21,740 20,495 9,976 49%
48 STRATEGY, FINANCE & RISK MGMT 11,986 22,628 17,864 13,999 5,352 38%
49 EXECUTIVE AND ADMINISTRATIVE SERVICES 4,783 4,326 5,613 5,651 1,525 27%
50 CONSERVATION SUPPORT 8,132 9,456 8,622 7,933 3,867 49%
51 Sub-Total 49,966 64,494 60,440 54,300 23,098 43%
52 Power Non-Generation Operations Sub-Total 77,154 96,542 92,215 86,373 36,740 43%
Power Services Transmission Acquisition and Ancillary ServicesPBL Transmission Acquisition and Ancillary Services
53 POWER SERVICES TRANSMISSION & ANCILLARY SERVICES 88,731 108,908 108,908 106,270 45,655 43%
54 3RD PARTY GTA WHEELING 58,137 63,567 67,297 67,297 28,589 42%
55 POWER SERVICES - 3RD PARTY TRANS & ANCILLARY SVCS 2,677 2,381 2,696 2,696 1,692 63%
56 GENERATION INTEGRATION / WIT-TS 10,521 12,142 12,216 12,261 6,881 56%
57 TELEMETERING/EQUIP REPLACEMT - - - - - 0%
58 Power Srvcs Trans Acquisition and Ancillary Services Sub-Total 160,065 186,998 191,117 188,524 82,817 44%
Fish and Wildlife/USF&W/Planning Council/Environmental ReqBPA Fish and Wildlife
59 Fish & Wildlife 258,177 267,000 267,000 271,966 132,434 49%
60 USF&W Lower Snake Hatcheries 30,930 32,303 32,303 32,303 15,498 48%
61 Planning Council 9,870 11,236 11,236 11,236 5,030 45%
62 Fish and Wildlife/USF&W/Planning Council Sub-Total 298,978$ 310,539$ 310,539$ 315,506$ 152,962$ 48%
FY 2016
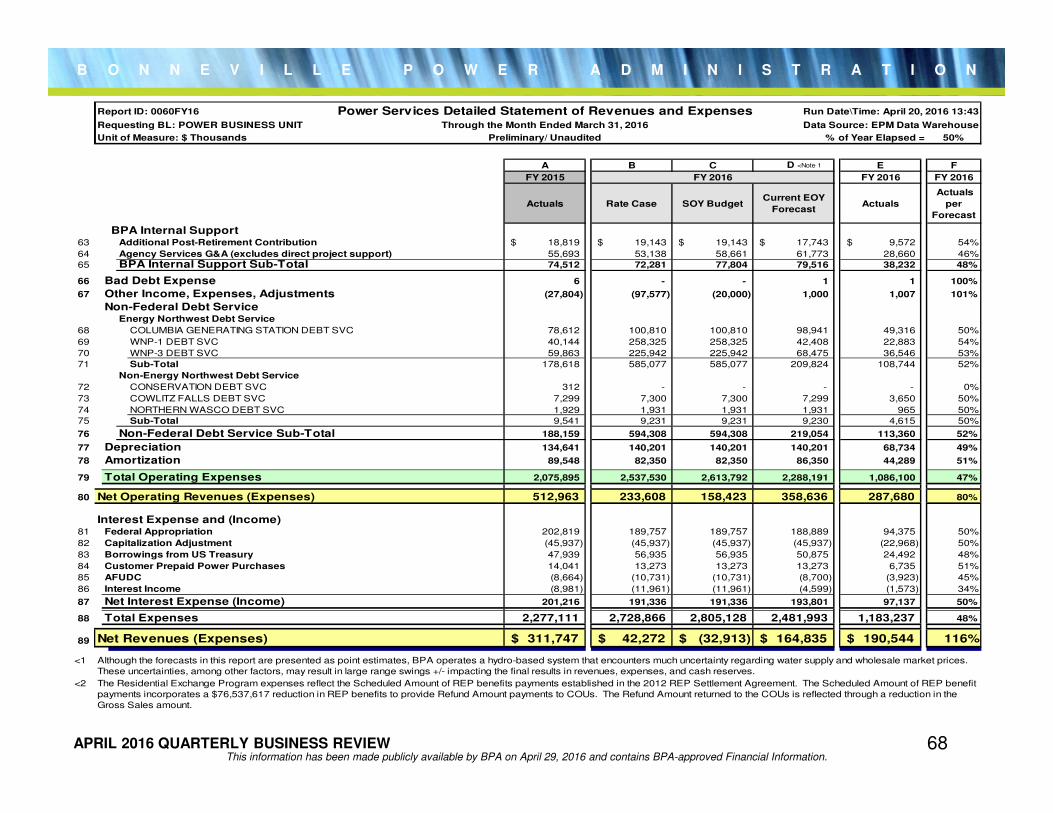
B O N N E V I L L E P O W E R A D M I N I S T R A T I O N
APRIL 2016 QUARTERLY BUSINESS REVIEWThis information has been made publicly available by BPA on April 29, 2016 and contains BPA-approved Financial Information.
68
Report ID: 0060FY16 Power Services Detailed Statement of Revenues and Expenses Run Date\Time: April 20, 2016 13:43
Requesting BL: POWER BUSINESS UNIT Through the Month Ended March 31, 2016 Data Source: EPM Data Warehouse
Unit of Measure: $ Thousands Preliminary/ Unaudited % of Year Elapsed = 50%
A B C D <Note 1 E F
FY 2015 FY 2016 FY 2016
Actuals Rate Case SOY BudgetCurrent EOY
ForecastActuals
Actuals
per
Forecast
BPA Internal Support63 Additional Post-Retirement Contribution 18,819$ 19,143$ 19,143$ 17,743$ 9,572$ 54%
64 Agency Services G&A (excludes direct project support) 55,693 53,138 58,661 61,773 28,660 46%
65 BPA Internal Support Sub-Total 74,512 72,281 77,804 79,516 38,232 48%
66 Bad Debt Expense 6 - - 1 1 100%
67 Other Income, Expenses, Adjustments (27,804) (97,577) (20,000) 1,000 1,007 101%
Non-Federal Debt ServiceEnergy Northwest Debt Service
68 COLUMBIA GENERATING STATION DEBT SVC 78,612 100,810 100,810 98,941 49,316 50%
69 WNP-1 DEBT SVC 40,144 258,325 258,325 42,408 22,883 54%
70 WNP-3 DEBT SVC 59,863 225,942 225,942 68,475 36,546 53%
71 Sub-Total 178,618 585,077 585,077 209,824 108,744 52%
Non-Energy Northwest Debt Service
72 CONSERVATION DEBT SVC 312 - - - - 0%
73 COWLITZ FALLS DEBT SVC 7,299 7,300 7,300 7,299 3,650 50%
74 NORTHERN WASCO DEBT SVC 1,929 1,931 1,931 1,931 965 50%
75 Sub-Total 9,541 9,231 9,231 9,230 4,615 50%
76 Non-Federal Debt Service Sub-Total 188,159 594,308 594,308 219,054 113,360 52%
77 Depreciation 134,641 140,201 140,201 140,201 68,734 49%
78 Amortization 89,548 82,350 82,350 86,350 44,289 51%
79 Total Operating Expenses 2,075,895 2,537,530 2,613,792 2,288,191 1,086,100 47%
80 Net Operating Revenues (Expenses) 512,963 233,608 158,423 358,636 287,680 80%
Interest Expense and (Income)81 Federal Appropriation 202,819 189,757 189,757 188,889 94,375 50%
82 Capitalization Adjustment (45,937) (45,937) (45,937) (45,937) (22,968) 50%
83 Borrowings from US Treasury 47,939 56,935 56,935 50,875 24,492 48%
84 Customer Prepaid Power Purchases 14,041 13,273 13,273 13,273 6,735 51%
85 AFUDC (8,664) (10,731) (10,731) (8,700) (3,923) 45%
86 Interest Income (8,981) (11,961) (11,961) (4,599) (1,573) 34%
87 Net Interest Expense (Income) 201,216 191,336 191,336 193,801 97,137 50%
88 Total Expenses 2,277,111 2,728,866 2,805,128 2,481,993 1,183,237 48%
89 Net Revenues (Expenses) 311,747$ 42,272$ (32,913)$ 164,835$ 190,544$ 116%
<1
<2
Although the forecasts in this report are presented as point estimates, BPA operates a hydro-based system that encounters much uncertainty regarding water supply and wholesale market prices.
These uncertainties, among other factors, may result in large range swings +/- impacting the final results in revenues, expenses, and cash reserves.
The Residential Exchange Program expenses reflect the Scheduled Amount of REP benefits payments established in the 2012 REP Settlement Agreement. The Scheduled Amount of REP benefit
payments incorporates a $76,537,617 reduction in REP benefits to provide Refund Amount payments to COUs. The Refund Amount returned to the COUs is reflected through a reduction in the
Gross Sales amount.
FY 2016
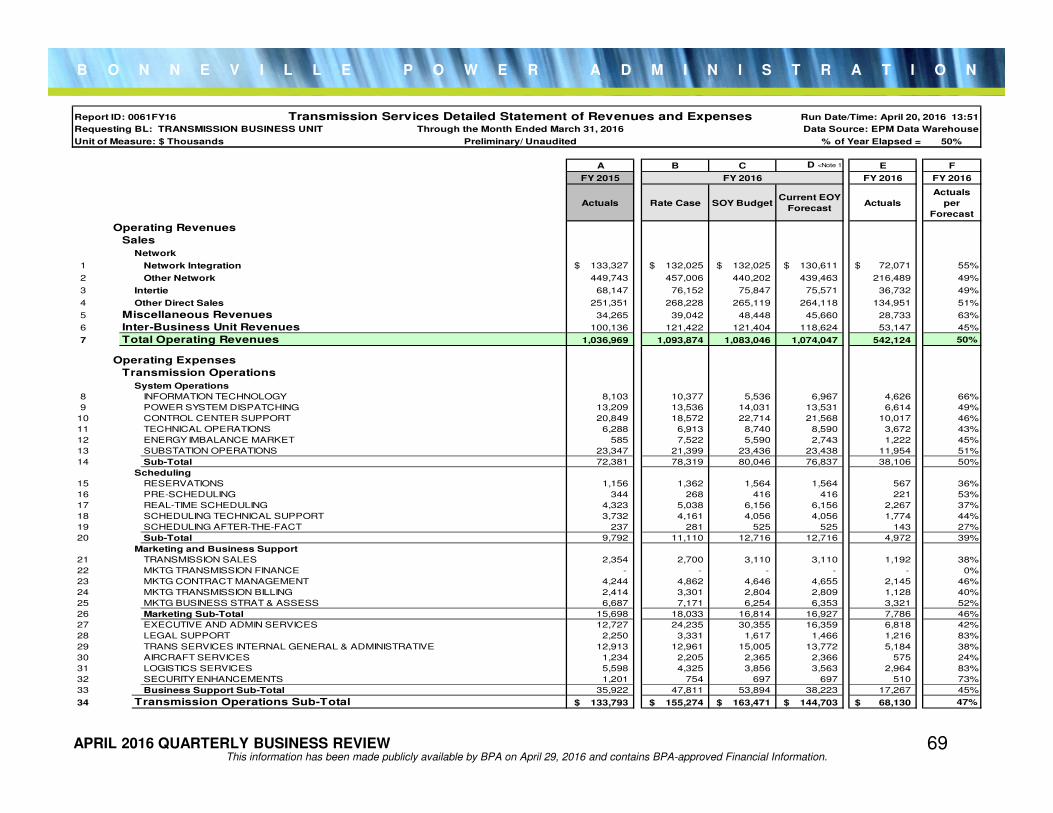
B O N N E V I L L E P O W E R A D M I N I S T R A T I O N
APRIL 2016 QUARTERLY BUSINESS REVIEWThis information has been made publicly available by BPA on April 29, 2016 and contains BPA-approved Financial Information.
69
Report ID: 0061FY16 Transmission Services Detailed Statement of Revenues and Expenses Run Date/Time: April 20, 2016 13:51
Requesting BL: TRANSMISSION BUSINESS UNIT Through the Month Ended March 31, 2016 Data Source: EPM Data Warehouse
Unit of Measure: $ Thousands Preliminary/ Unaudited % of Year Elapsed = 50%
A B C D <Note 1 E F
FY 2015
Actuals Rate Case SOY BudgetCurrent EOY
ForecastActuals
Actuals
per
Forecast
Operating Revenues
Sales 933,410$ 913,193$ 909,763$
Network
1 Network Integration 133,327$ 132,025$ 132,025$ 130,611$ 72,071$ 55%
2 Other Network 449,743 457,006 440,202 439,463 216,489 49%
3 Intertie 68,147 76,152 75,847 75,571 36,732 49%
4 Other Direct Sales 251,351 268,228 265,119 264,118 134,951 51%
5 Miscellaneous Revenues 34,265 39,042 48,448 45,660 28,733 63%
6 Inter-Business Unit Revenues 100,136 121,422 121,404 118,624 53,147 45%
7 Total Operating Revenues 1,036,969 1,093,874 1,083,046 1,074,047 542,124 50%
Operating Expenses
Transmission Operations
System Operations
8 INFORMATION TECHNOLOGY 8,103 10,377 5,536 6,967 4,626 66%
9 POWER SYSTEM DISPATCHING 13,209 13,536 14,031 13,531 6,614 49%
10 CONTROL CENTER SUPPORT 20,849 18,572 22,714 21,568 10,017 46%
11 TECHNICAL OPERATIONS 6,288 6,913 8,740 8,590 3,672 43%
12 ENERGY IMBALANCE MARKET 585 7,522 5,590 2,743 1,222 45%
13 SUBSTATION OPERATIONS 23,347 21,399 23,436 23,438 11,954 51%
14 Sub-Total 72,381 78,319 80,046 76,837 38,106 50%
Scheduling
15 RESERVATIONS 1,156 1,362 1,564 1,564 567 36%
16 PRE-SCHEDULING 344 268 416 416 221 53%
17 REAL-TIME SCHEDULING 4,323 5,038 6,156 6,156 2,267 37%
18 SCHEDULING TECHNICAL SUPPORT 3,732 4,161 4,056 4,056 1,774 44%
19 SCHEDULING AFTER-THE-FACT 237 281 525 525 143 27%
20 Sub-Total 9,792 11,110 12,716 12,716 4,972 39%
Marketing and Business Support
21 TRANSMISSION SALES 2,354 2,700 3,110 3,110 1,192 38%
22 MKTG TRANSMISSION FINANCE - - - - - 0%
23 MKTG CONTRACT MANAGEMENT 4,244 4,862 4,646 4,655 2,145 46%
24 MKTG TRANSMISSION BILLING 2,414 3,301 2,804 2,809 1,128 40%
25 MKTG BUSINESS STRAT & ASSESS 6,687 7,171 6,254 6,353 3,321 52%
26 Marketing Sub-Total 15,698 18,033 16,814 16,927 7,786 46%
27 EXECUTIVE AND ADMIN SERVICES 12,727 24,235 30,355 16,359 6,818 42%
28 LEGAL SUPPORT 2,250 3,331 1,617 1,466 1,216 83%
29 TRANS SERVICES INTERNAL GENERAL & ADMINISTRATIVE 12,913 12,961 15,005 13,772 5,184 38%
30 AIRCRAFT SERVICES 1,234 2,205 2,365 2,366 575 24%
31 LOGISTICS SERVICES 5,598 4,325 3,856 3,563 2,964 83%
32 SECURITY ENHANCEMENTS 1,201 754 697 697 510 73%
33 Business Support Sub-Total 35,922 47,811 53,894 38,223 17,267 45%
34 Transmission Operations Sub-Total 133,793$ 155,274$ 163,471$ 144,703$ 68,130$ 47%
FY 2016 FY 2016 FY 2016
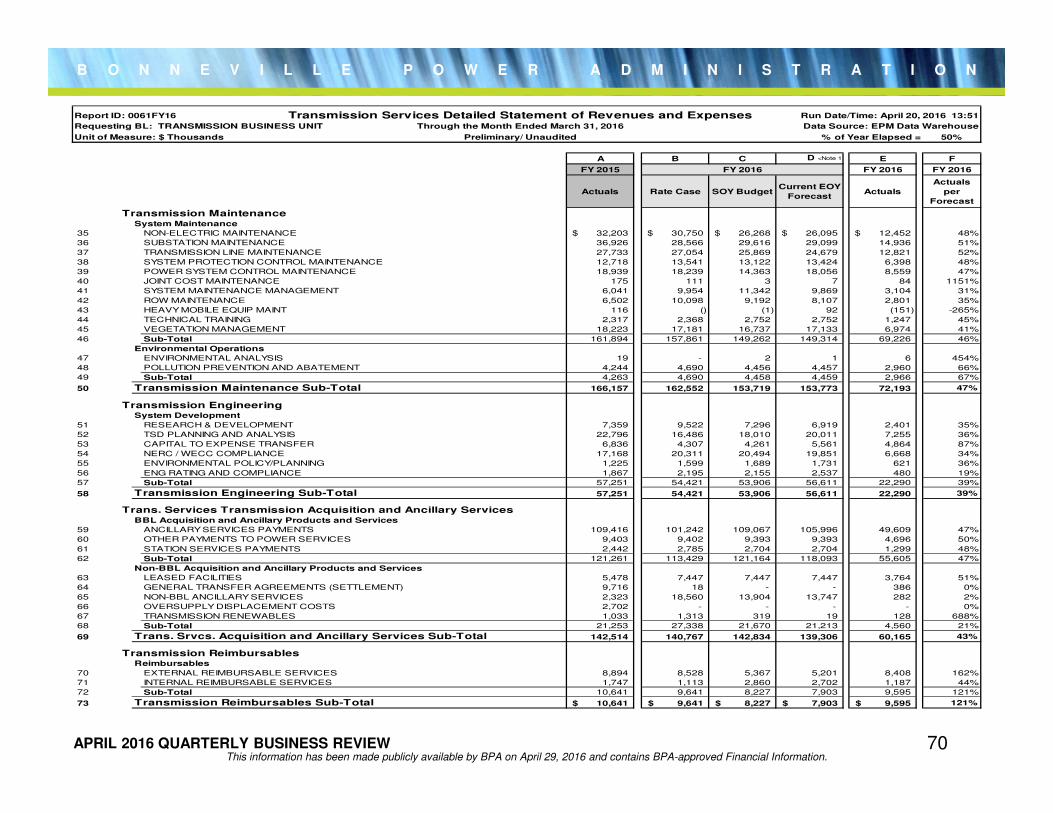
B O N N E V I L L E P O W E R A D M I N I S T R A T I O N
APRIL 2016 QUARTERLY BUSINESS REVIEWThis information has been made publicly available by BPA on April 29, 2016 and contains BPA-approved Financial Information.
70
Report ID: 0061FY16 Transmission Services Detailed Statement of Revenues and Expenses Run Date/Time: April 20, 2016 13:51
Requesting BL: TRANSMISSION BUSINESS UNIT Through the Month Ended March 31, 2016 Data Source: EPM Data Warehouse
Unit of Measure: $ Thousands Preliminary/ Unaudited % of Year Elapsed = 50%
A B C D <Note 1 E F
FY 2015
Actuals Rate Case SOY BudgetCurrent EOY
ForecastActuals
Actuals
per
Forecast
Transmission MaintenanceSystem Maintenance
35 NON-ELECTRIC MAINTENANCE 32,203$ 30,750$ 26,268$ 26,095$ 12,452$ 48%
36 SUBSTATION MAINTENANCE 36,926 28,566 29,616 29,099 14,936 51%
37 TRANSMISSION LINE MAINTENANCE 27,733 27,054 25,869 24,679 12,821 52%
38 SYSTEM PROTECTION CONTROL MAINTENANCE 12,718 13,541 13,122 13,424 6,398 48%
39 POWER SYSTEM CONTROL MAINTENANCE 18,939 18,239 14,363 18,056 8,559 47%
40 JOINT COST MAINTENANCE 175 111 3 7 84 1151%
41 SYSTEM MAINTENANCE MANAGEMENT 6,041 9,954 11,342 9,869 3,104 31%
42 ROW MAINTENANCE 6,502 10,098 9,192 8,107 2,801 35%
43 HEAVY MOBILE EQUIP MAINT 116 () (1) 92 (151) -265%
44 TECHNICAL TRAINING 2,317 2,368 2,752 2,752 1,247 45%
45 VEGETATION MANAGEMENT 18,223 17,181 16,737 17,133 6,974 41%
46 Sub-Total 161,894 157,861 149,262 149,314 69,226 46%
Environmental Operations
47 ENVIRONMENTAL ANALYSIS 19 - 2 1 6 454%
48 POLLUTION PREVENTION AND ABATEMENT 4,244 4,690 4,456 4,457 2,960 66%
49 Sub-Total 4,263 4,690 4,458 4,459 2,966 67%
50 Transmission Maintenance Sub-Total 166,157 162,552 153,719 153,773 72,193 47%
Transmission EngineeringSystem Development
51 RESEARCH & DEVELOPMENT 7,359 9,522 7,296 6,919 2,401 35%
52 TSD PLANNING AND ANALYSIS 22,796 16,486 18,010 20,011 7,255 36%
53 CAPITAL TO EXPENSE TRANSFER 6,836 4,307 4,261 5,561 4,864 87%
54 NERC / WECC COMPLIANCE 17,168 20,311 20,494 19,851 6,668 34%
55 ENVIRONMENTAL POLICY/PLANNING 1,225 1,599 1,689 1,731 621 36%
56 ENG RATING AND COMPLIANCE 1,867 2,195 2,155 2,537 480 19%
57 Sub-Total 57,251 54,421 53,906 56,611 22,290 39%
58 Transmission Engineering Sub-Total 57,251 54,421 53,906 56,611 22,290 39%
Trans. Services Transmission Acquisition and Ancillary ServicesBBL Acquisition and Ancillary Products and Services
59 ANCILLARY SERVICES PAYMENTS 109,416 101,242 109,067 105,996 49,609 47%
60 OTHER PAYMENTS TO POWER SERVICES 9,403 9,402 9,393 9,393 4,696 50%
61 STATION SERVICES PAYMENTS 2,442 2,785 2,704 2,704 1,299 48%
62 Sub-Total 121,261 113,429 121,164 118,093 55,605 47%
Non-BBL Acquisition and Ancillary Products and Services
63 LEASED FACILITIES 5,478 7,447 7,447 7,447 3,764 51%
64 GENERAL TRANSFER AGREEMENTS (SETTLEMENT) 9,716 18 - - 386 0%
65 NON-BBL ANCILLARY SERVICES 2,323 18,560 13,904 13,747 282 2%
66 OVERSUPPLY DISPLACEMENT COSTS 2,702 - - - - 0%
67 TRANSMISSION RENEWABLES 1,033 1,313 319 19 128 688%
68 Sub-Total 21,253 27,338 21,670 21,213 4,560 21%
69 Trans. Srvcs. Acquisition and Ancillary Services Sub-Total 142,514 140,767 142,834 139,306 60,165 43%
Transmission ReimbursablesReimbursables
70 EXTERNAL REIMBURSABLE SERVICES 8,894 8,528 5,367 5,201 8,408 162%
71 INTERNAL REIMBURSABLE SERVICES 1,747 1,113 2,860 2,702 1,187 44%
72 Sub-Total 10,641 9,641 8,227 7,903 9,595 121%
73 Transmission Reimbursables Sub-Total 10,641$ 9,641$ 8,227$ 7,903$ 9,595$ 121%
FY 2016 FY 2016 FY 2016
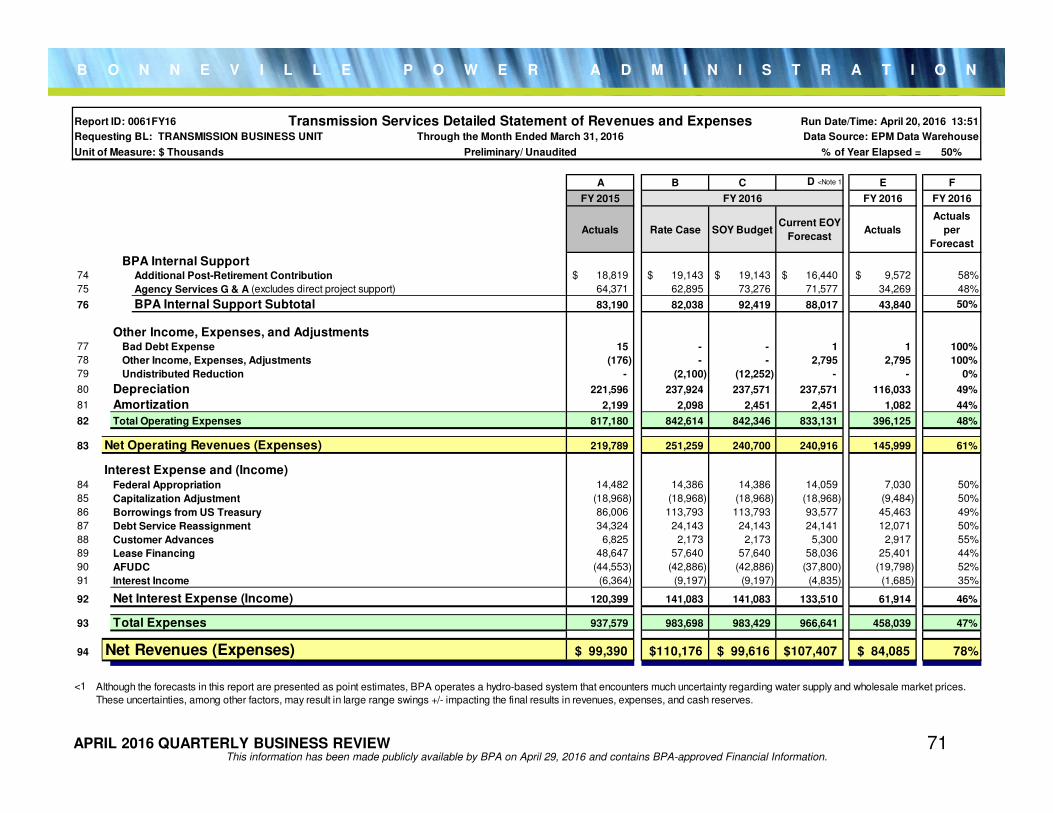
B O N N E V I L L E P O W E R A D M I N I S T R A T I O N
APRIL 2016 QUARTERLY BUSINESS REVIEWThis information has been made publicly available by BPA on April 29, 2016 and contains BPA-approved Financial Information.
71
Report ID: 0061FY16 Transmission Services Detailed Statement of Revenues and Expenses Run Date/Time: April 20, 2016 13:51
Requesting BL: TRANSMISSION BUSINESS UNIT Through the Month Ended March 31, 2016 Data Source: EPM Data Warehouse
Unit of Measure: $ Thousands Preliminary/ Unaudited % of Year Elapsed = 50%
A B C D <Note 1 E F
FY 2015
Actuals Rate Case SOY BudgetCurrent EOY
ForecastActuals
Actuals
per
Forecast
BPA Internal Support74 Additional Post-Retirement Contribution 18,819$ 19,143$ 19,143$ 16,440$ 9,572$ 58%
75 Agency Services G & A (excludes direct project support) 64,371 62,895 73,276 71,577 34,269 48%
76 BPA Internal Support Subtotal 83,190 82,038 92,419 88,017 43,840 50%
Other Income, Expenses, and Adjustments77 Bad Debt Expense 15 - - 1 1 100%
78 Other Income, Expenses, Adjustments (176) - - 2,795 2,795 100%
79 Undistributed Reduction - (2,100) (12,252) - - 0%
80 Depreciation 221,596 237,924 237,571 237,571 116,033 49%
81 Amortization 2,199 2,098 2,451 2,451 1,082 44%
82 Total Operating Expenses 817,180 842,614 842,346 833,131 396,125 48%
83 Net Operating Revenues (Expenses) 219,789 251,259 240,700 240,916 145,999 61%
Interest Expense and (Income)84 Federal Appropriation 14,482 14,386 14,386 14,059 7,030 50%
85 Capitalization Adjustment (18,968) (18,968) (18,968) (18,968) (9,484) 50%
86 Borrowings from US Treasury 86,006 113,793 113,793 93,577 45,463 49%
87 Debt Service Reassignment 34,324 24,143 24,143 24,141 12,071 50%
88 Customer Advances 6,825 2,173 2,173 5,300 2,917 55%
89 Lease Financing 48,647 57,640 57,640 58,036 25,401 44%
90 AFUDC (44,553) (42,886) (42,886) (37,800) (19,798) 52%
91 Interest Income (6,364) (9,197) (9,197) (4,835) (1,685) 35%
92 Net Interest Expense (Income) 120,399 141,083 141,083 133,510 61,914 46%
93 Total Expenses 937,579 983,698 983,429 966,641 458,039 47%
94 Net Revenues (Expenses) 99,390$ 110,176$ 99,616$ 107,407$ 84,085$ 78%
<1 Although the forecasts in this report are presented as point estimates, BPA operates a hydro-based system that encounters much uncertainty regarding water supply and wholesale market prices.
These uncertainties, among other factors, may result in large range swings +/- impacting the final results in revenues, expenses, and cash reserves.
FY 2016 FY 2016 FY 2016
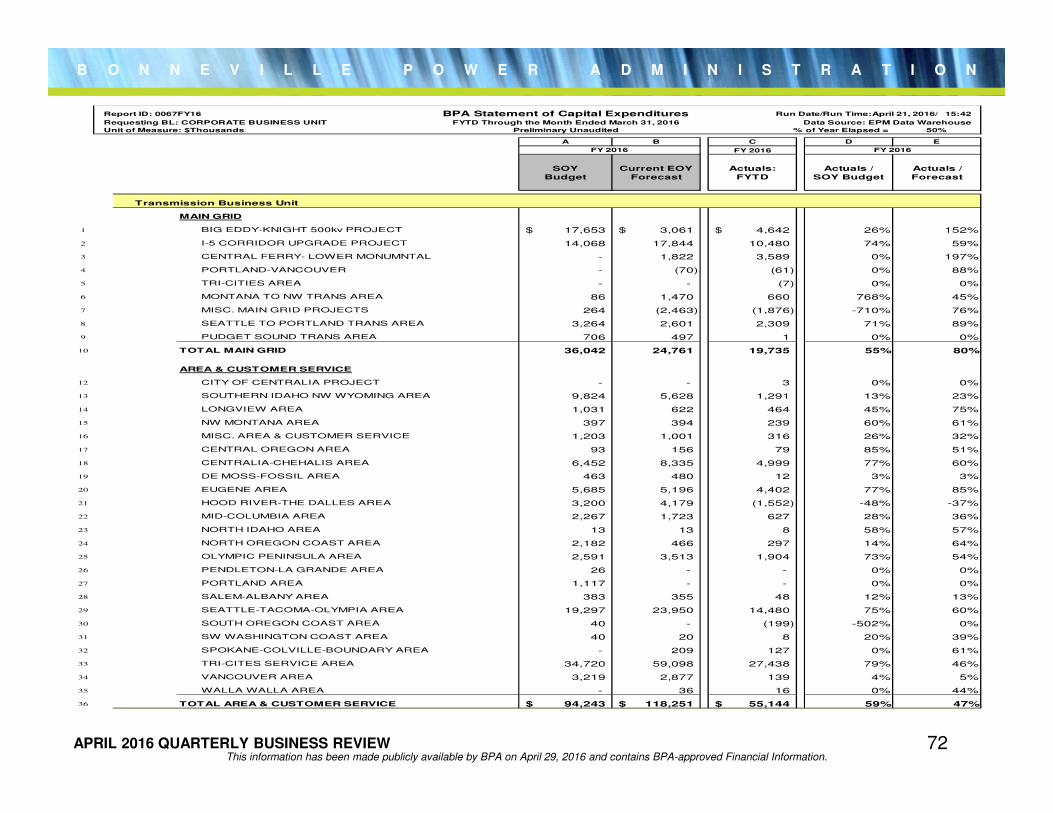
B O N N E V I L L E P O W E R A D M I N I S T R A T I O N
APRIL 2016 QUARTERLY BUSINESS REVIEWThis information has been made publicly available by BPA on April 29, 2016 and contains BPA-approved Financial Information.
72
Report ID: 0067FY16 BPA Statement of Capital Expenditures Run Date/Run Time:April 21, 2016/ 15:42
Requesting BL: CORPORATE BUSINESS UNIT FYTD Through the Month Ended March 31, 2016 Data Source: EPM Data Warehouse
Unit of Measure: $Thousands Preliminary Unaudited % of Year Elapsed = 50%
A B C D E
FY 2016
SOY
Budget
Current EOY
Forecast
Actuals:
FYTD
Actuals /
SOY Budget
Actuals /
Forecast
Transmission Business Unit
MAIN GRID
1 BIG EDDY-KNIGHT 500kv PROJECTBIG EDDY-KNIGHT 500kv PROJECT 17,653$ 3,061$ 4,642$ 26% 152%
2 I-5 CORRIDOR UPGRADE PROJECTI-5 CORRIDOR UPGRADE PROJECT 14,068 17,844 10,480 74% 59%
3 CENTRAL FERRY- LOWER MONUMNTALCENTRAL FERRY- LOWER MONUMNTAL - 1,822 3,589 0% 197%
4 PORTLAND-VANCOUVERPORTLAND-VANCOUVER - (70) (61) 0% 88%
5 TRI-CITIES AREATRI-CITIES AREA - - (7) 0% 0%
6 MONTANA TO NW TRANS AREAMONTANA TO NW TRANS AREA 86 1,470 660 768% 45%
7 MISC. MAIN GRID PROJECTSMISC. MAIN GRID PROJECTS 264 (2,463) (1,876) -710% 76%
8 SEATTLE TO PORTLAND TRANS AREASEATTLE TO PORTLAND TRANS AREA 3,264 2,601 2,309 71% 89%
9 PUDGET SOUND TRANS AREAPUDGET SOUND TRANS AREA 706 497 1 0% 0%
10 MAIN GRIDTOTAL MAIN GRID 36,042 24,761 19,735 55% 80%
AREA & CUSTOMER SERVICE
12 CITY OF CENTRALIA PROJECTCITY OF CENTRALIA PROJECT - - 3 0% 0%
13 SOUTHERN IDAHO NW WYOMING AREASOUTHERN IDAHO NW WYOMING AREA 9,824 5,628 1,291 13% 23%
14 LONGVIEW AREALONGVIEW AREA 1,031 622 464 45% 75%
15 NW MONTANA AREANW MONTANA AREA 397 394 239 60% 61%
16 MISC. AREA & CUSTOMER SERVICEMISC. AREA & CUSTOMER SERVICE 1,203 1,001 316 26% 32%
17 CENTRAL OREGON AREACENTRAL OREGON AREA 93 156 79 85% 51%
18 CENTRALIA-CHEHALIS AREACENTRALIA-CHEHALIS AREA 6,452 8,335 4,999 77% 60%
19 DE MOSS-FOSSIL AREADE MOSS-FOSSIL AREA 463 480 12 3% 3%
20 EUGENE AREAEUGENE AREA 5,685 5,196 4,402 77% 85%
21 HOOD RIVER-THE DALLES AREAHOOD RIVER-THE DALLES AREA 3,200 4,179 (1,552) -48% -37%
22 MID-COLUMBIA AREAMID-COLUMBIA AREA 2,267 1,723 627 28% 36%
23 NORTH IDAHO AREANORTH IDAHO AREA 13 13 8 58% 57%
24 NORTH OREGON COAST AREANORTH OREGON COAST AREA 2,182 466 297 14% 64%
25 OLYMPIC PENINSULA AREAOLYMPIC PENINSULA AREA 2,591 3,513 1,904 73% 54%
26 PENDLETON-LA GRANDE AREAPENDLETON-LA GRANDE AREA 26 - - 0% 0%
27 PORTLAND AREAPORTLAND AREA 1,117 - - 0% 0%
28 SALEM-ALBANY AREASALEM-ALBANY AREA 383 355 48 12% 13%
29 SEATTLE-TACOMA-OLYMPIA AREASEATTLE-TACOMA-OLYMPIA AREA 19,297 23,950 14,480 75% 60%
30 SOUTH OREGON COAST AREASOUTH OREGON COAST AREA 40 - (199) -502% 0%
31 SW WASHINGTON COAST AREASW WASHINGTON COAST AREA 40 20 8 20% 39%
32 SPOKANE-COLVILLE-BOUNDARY AREASPOKANE-COLVILLE-BOUNDARY AREA - 209 127 0% 61%
33 TRI-CITES SERVICE AREATRI-CITES SERVICE AREA 34,720 59,098 27,438 79% 46%
34 VANCOUVER AREAVANCOUVER AREA 3,219 2,877 139 4% 5%
35 WALLA WALLA AREAWALLA WALLA AREA - 36 16 0% 44%
36 AREA & CUSTOMER SERVICETOTAL AREA & CUSTOMER SERVICE 94,243$ 118,251$ 55,144$ 59% 47%
FY 2016FY 2016
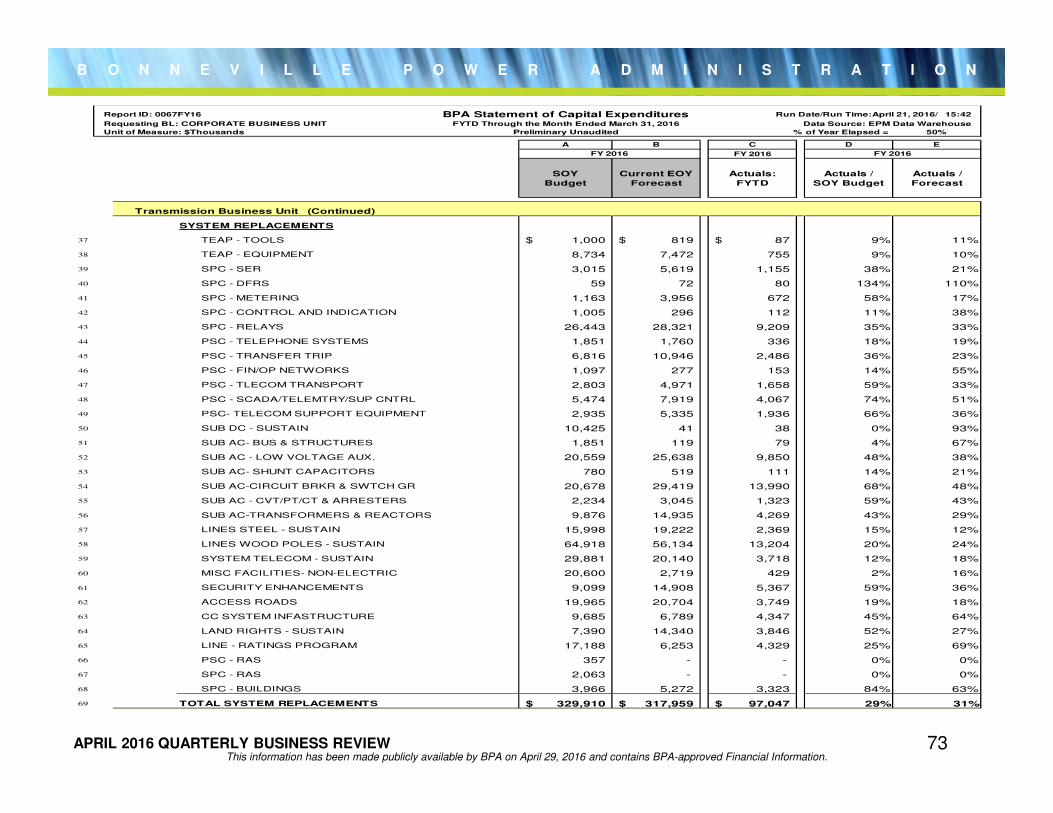
B O N N E V I L L E P O W E R A D M I N I S T R A T I O N
APRIL 2016 QUARTERLY BUSINESS REVIEWThis information has been made publicly available by BPA on April 29, 2016 and contains BPA-approved Financial Information.
73
Report ID: 0067FY16 BPA Statement of Capital Expenditures Run Date/Run Time:April 21, 2016/ 15:42
Requesting BL: CORPORATE BUSINESS UNIT FYTD Through the Month Ended March 31, 2016 Data Source: EPM Data Warehouse
Unit of Measure: $Thousands Preliminary Unaudited % of Year Elapsed = 50%
A B C D E
FY 2016
SOY
Budget
Current EOY
Forecast
Actuals:
FYTD
Actuals /
SOY Budget
Actuals /
Forecast
Transmission Business Unit (Continued)
SYSTEM REPLACEMENTS
37 TEAP - TOOLSTEAP - TOOLS 1,000$ 819$ 87$ 9% 11%
38 TEAP - EQUIPMENTTEAP - EQUIPMENT 8,734 7,472 755 9% 10%
39 SPC - SERSPC - SER 3,015 5,619 1,155 38% 21%
40 SPC - DFRSSPC - DFRS 59 72 80 134% 110%
41 SPC - METERINGSPC - METERING 1,163 3,956 672 58% 17%
42 SPC - CONTROL AND INDICATIONSPC - CONTROL AND INDICATION 1,005 296 112 11% 38%
43 SPC - RELAYSSPC - RELAYS 26,443 28,321 9,209 35% 33%
44 PSC - TELEPHONE SYSTEMSPSC - TELEPHONE SYSTEMS 1,851 1,760 336 18% 19%
45 PSC - TRANSFER TRIPPSC - TRANSFER TRIP 6,816 10,946 2,486 36% 23%
46 PSC - FIN/OP NETWORKSPSC - FIN/OP NETWORKS 1,097 277 153 14% 55%
47 PSC - TLECOM TRANSPORTPSC - TLECOM TRANSPORT 2,803 4,971 1,658 59% 33%
48 PSC - SCADA/TELEMTRY/SUP CNTRLPSC - SCADA/TELEMTRY/SUP CNTRL 5,474 7,919 4,067 74% 51%
49 PSC- TELECOM SUPPORT EQUIPMENTPSC- TELECOM SUPPORT EQUIPMENT 2,935 5,335 1,936 66% 36%
50 SUB DC - SUSTAINSUB DC - SUSTAIN 10,425 41 38 0% 93%
51 SUB AC- BUS & STRUCTURESSUB AC- BUS & STRUCTURES 1,851 119 79 4% 67%
52 SUB AC - LOW VOLTAGE AUX.SUB AC - LOW VOLTAGE AUX. 20,559 25,638 9,850 48% 38%
53 SUB AC- SHUNT CAPACITORSSUB AC- SHUNT CAPACITORS 780 519 111 14% 21%
54 SUB AC-CIRCUIT BRKR & SWTCH GRSUB AC-CIRCUIT BRKR & SWTCH GR 20,678 29,419 13,990 68% 48%
55 SUB AC - CVT/PT/CT & ARRESTERSSUB AC - CVT/PT/CT & ARRESTERS 2,234 3,045 1,323 59% 43%
56 SUB AC-TRANSFORMERS & REACTORSSUB AC-TRANSFORMERS & REACTORS 9,876 14,935 4,269 43% 29%
57 LINES STEEL - SUSTAINLINES STEEL - SUSTAIN 15,998 19,222 2,369 15% 12%
58 LINES WOOD POLES - SUSTAINLINES WOOD POLES - SUSTAIN 64,918 56,134 13,204 20% 24%
59 SYSTEM TELECOM - SUSTAINSYSTEM TELECOM - SUSTAIN 29,881 20,140 3,718 12% 18%
60 MISC FACILITIES- NON-ELECTRICMISC FACILITIES- NON-ELECTRIC 20,600 2,719 429 2% 16%
61 SECURITY ENHANCEMENTSSECURITY ENHANCEMENTS 9,099 14,908 5,367 59% 36%
62 ACCESS ROADSACCESS ROADS 19,965 20,704 3,749 19% 18%
63 CC SYSTEM INFASTRUCTURECC SYSTEM INFASTRUCTURE 9,685 6,789 4,347 45% 64%
64 LAND RIGHTS - SUSTAINLAND RIGHTS - SUSTAIN 7,390 14,340 3,846 52% 27%
65 LINE - RATINGS PROGRAMLINE - RATINGS PROGRAM 17,188 6,253 4,329 25% 69%
66 PSC - RASPSC - RAS 357 - - 0% 0%
67 SPC - RASSPC - RAS 2,063 - - 0% 0%
68 SPC - BUILDINGSSPC - BUILDINGS 3,966 5,272 3,323 84% 63%
69 SYSTEM REPLACEMENTSTOTAL SYSTEM REPLACEMENTS 329,910$ 317,959$ 97,047$ 29% 31%
FY 2016FY 2016
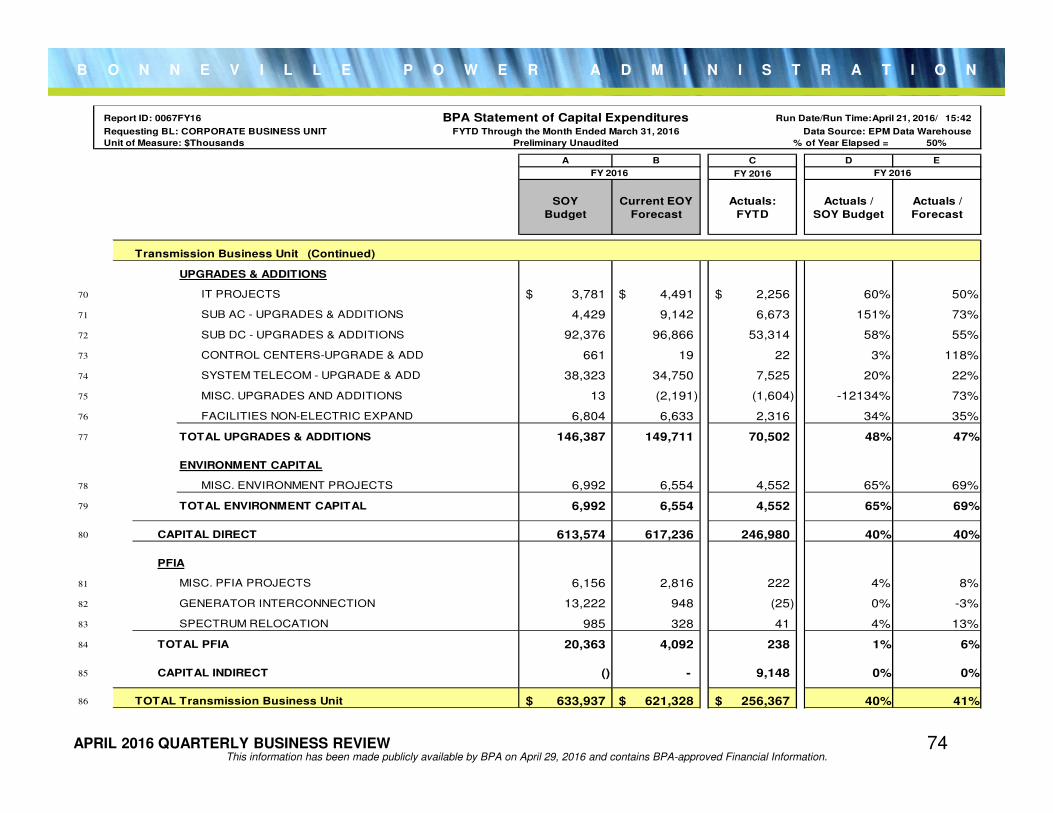
B O N N E V I L L E P O W E R A D M I N I S T R A T I O N
APRIL 2016 QUARTERLY BUSINESS REVIEWThis information has been made publicly available by BPA on April 29, 2016 and contains BPA-approved Financial Information.
74
Report ID: 0067FY16 BPA Statement of Capital Expenditures Run Date/Run Time:April 21, 2016/ 15:42
Requesting BL: CORPORATE BUSINESS UNIT FYTD Through the Month Ended March 31, 2016 Data Source: EPM Data Warehouse
Unit of Measure: $Thousands Preliminary Unaudited % of Year Elapsed = 50%
A B C D E
FY 2016
SOY
Budget
Current EOY
Forecast
Actuals:
FYTD
Actuals /
SOY Budget
Actuals /
Forecast
Transmission Business Unit (Continued)
UPGRADES & ADDITIONS
70 IT PROJECTSIT PROJECTS 3,781$ 4,491$ 2,256$ 60% 50%
71 SUB AC - UPGRADES & ADDITIONSSUB AC - UPGRADES & ADDITIONS 4,429 9,142 6,673 151% 73%
72 SUB DC - UPGRADES & ADDITIONSSUB DC - UPGRADES & ADDITIONS 92,376 96,866 53,314 58% 55%
73 CONTROL CENTERS-UPGRADE & ADDCONTROL CENTERS-UPGRADE & ADD 661 19 22 3% 118%
74 SYSTEM TELECOM - UPGRADE & ADDSYSTEM TELECOM - UPGRADE & ADD 38,323 34,750 7,525 20% 22%
75 MISC. UPGRADES AND ADDITIONSMISC. UPGRADES AND ADDITIONS 13 (2,191) (1,604) -12134% 73%
76 FACILITIES NON-ELECTRIC EXPANDFACILITIES NON-ELECTRIC EXPAND 6,804 6,633 2,316 34% 35%
77 UPGRADES & ADDITIONSTOTAL UPGRADES & ADDITIONS 146,387 149,711 70,502 48% 47%
ENVIRONMENT CAPITAL
78 MISC. ENVIRONMENT PROJECTSMISC. ENVIRONMENT PROJECTS 6,992 6,554 4,552 65% 69%
79 ENVIRONMENT CAPITALTOTAL ENVIRONMENT CAPITAL 6,992 6,554 4,552 65% 69%
80 CAPITAL DIRECT 613,574 617,236 246,980 40% 40%
PFIA
81 MISC. PFIA PROJECTSMISC. PFIA PROJECTS 6,156 2,816 222 4% 8%
82 GENERATOR INTERCONNECTIONGENERATOR INTERCONNECTION 13,222 948 (25) 0% -3%
83 SPECTRUM RELOCATION 985 328 41 4% 13%
84 TOTAL PFIA 20,363 4,092 238 1% 6%
85 CAPITAL INDIRECT () - 9,148 0% 0%
86 TOTAL Transmission Business Unit 633,937$ 621,328$ 256,367$ 40% 41%
FY 2016FY 2016
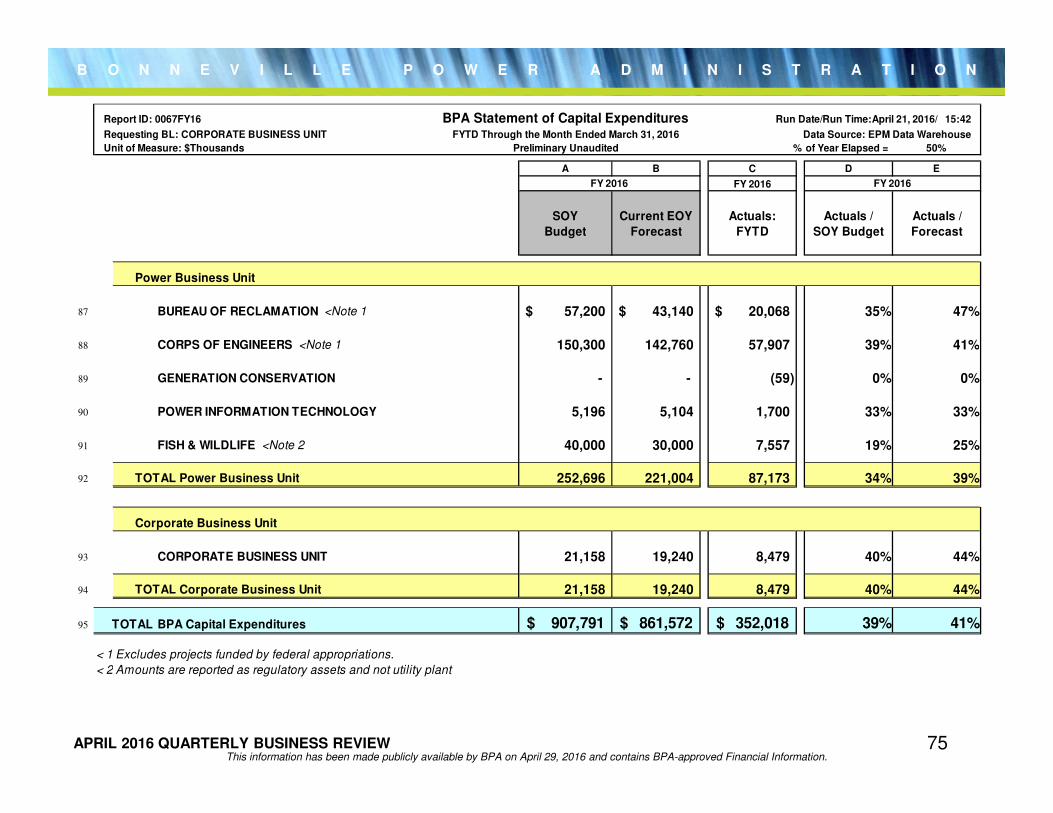
B O N N E V I L L E P O W E R A D M I N I S T R A T I O N
APRIL 2016 QUARTERLY BUSINESS REVIEWThis information has been made publicly available by BPA on April 29, 2016 and contains BPA-approved Financial Information.
75
Report ID: 0067FY16 BPA Statement of Capital Expenditures Run Date/Run Time:April 21, 2016/ 15:42
Requesting BL: CORPORATE BUSINESS UNIT FYTD Through the Month Ended March 31, 2016 Data Source: EPM Data Warehouse
Unit of Measure: $Thousands Preliminary Unaudited % of Year Elapsed = 50%
A B C D E
FY 2016
SOY
Budget
Current EOY
Forecast
Actuals:
FYTD
Actuals /
SOY Budget
Actuals /
Forecast
Power Business Unit
87 BUREAU OF RECLAMATION <Note 1 57,200$ 43,140$ 20,068$ 35% 47%
88 CORPS OF ENGINEERS <Note 1 150,300 142,760 57,907 39% 41%
89 GENERATION CONSERVATION - - (59) 0% 0%
90 POWER INFORMATION TECHNOLOGY 5,196 5,104 1,700 33% 33%
91 FISH & WILDLIFE <Note 2 40,000 30,000 7,557 19% 25%
92 TOTAL Power Business Unit 252,696 221,004 87,173 34% 39%
Corporate Business Unit
93 CORPORATE BUSINESS UNIT 21,158 19,240 8,479 40% 44%
94 TOTAL Corporate Business Unit 21,158 19,240 8,479 40% 44%
95 TOTAL BPA Capital Expenditures 907,791$ 861,572$ 352,018$ 39% 41%
< 1 Excludes projects funded by federal appropriations.
< 2 Amounts are reported as regulatory assets and not utility plant
FY 2016FY 2016
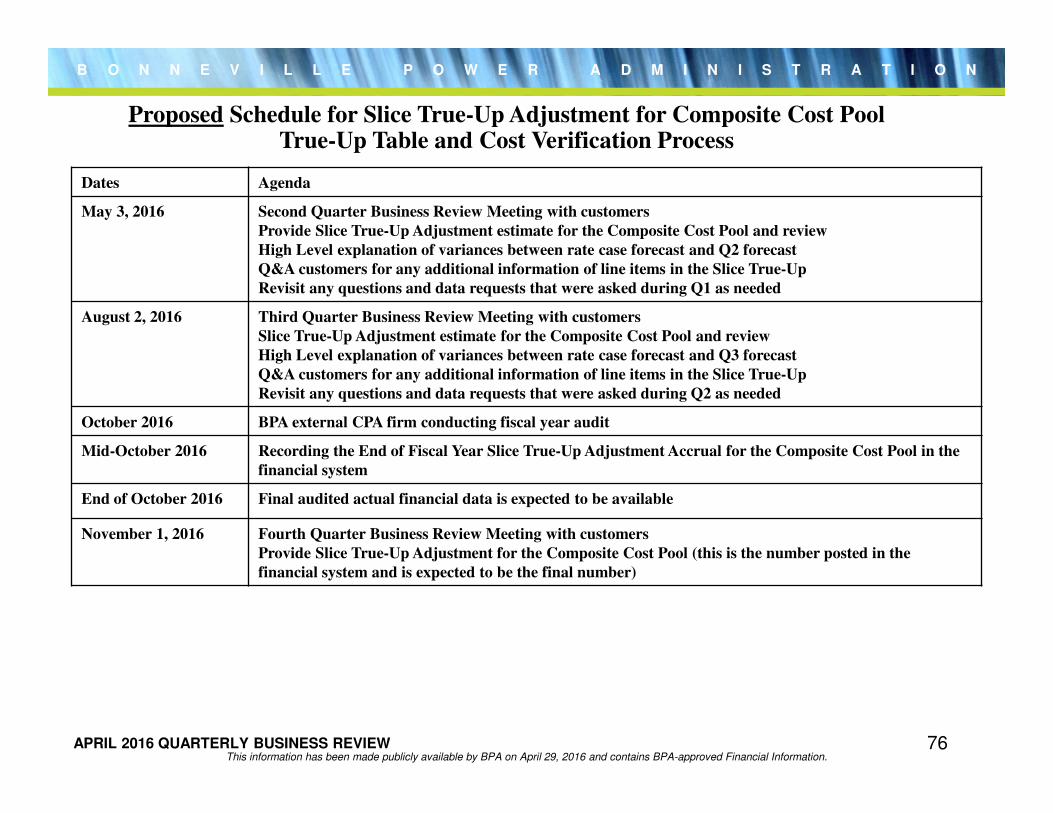
B O N N E V I L L E P O W E R A D M I N I S T R A T I O N
APRIL 2016 QUARTERLY BUSINESS REVIEW
Dates Agenda
May 3, 2016 Second Quarter Business Review Meeting with customers
Provide Slice True-Up Adjustment estimate for the Composite Cost Pool and review
High Level explanation of variances between rate case forecast and Q2 forecast
Q&A customers for any additional information of line items in the Slice True-Up
Revisit any questions and data requests that were asked during Q1 as needed
August 2, 2016 Third Quarter Business Review Meeting with customers
Slice True-Up Adjustment estimate for the Composite Cost Pool and review
High Level explanation of variances between rate case forecast and Q3 forecast
Q&A customers for any additional information of line items in the Slice True-Up
Revisit any questions and data requests that were asked during Q2 as needed
October 2016 BPA external CPA firm conducting fiscal year audit
Mid-October 2016 Recording the End of Fiscal Year Slice True-Up Adjustment Accrual for the Composite Cost Pool in the
financial system
End of October 2016 Final audited actual financial data is expected to be available
November 1, 2016 Fourth Quarter Business Review Meeting with customers
Provide Slice True-Up Adjustment for the Composite Cost Pool (this is the number posted in the
financial system and is expected to be the final number)
Proposed Schedule for Slice True-Up Adjustment for Composite Cost Pool True-Up Table and Cost Verification Process
This information has been made publicly available by BPA on April 29, 2016 and contains BPA-approved Financial Information.76
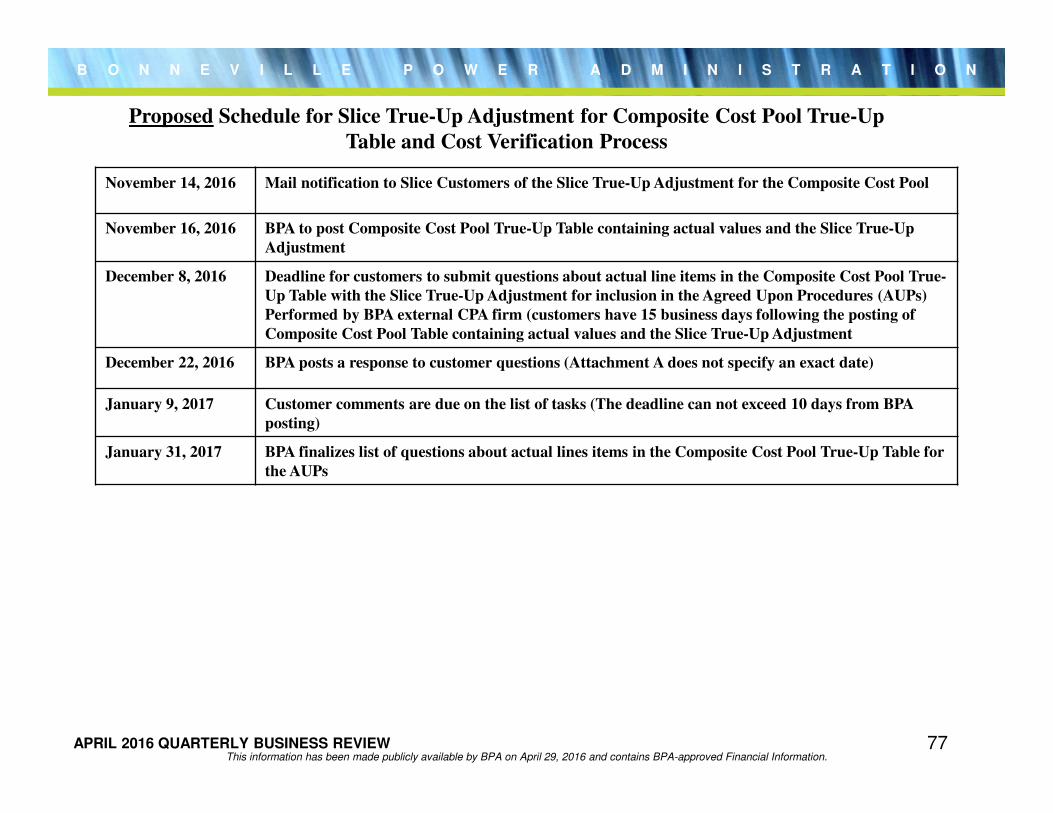
B O N N E V I L L E P O W E R A D M I N I S T R A T I O N
APRIL 2016 QUARTERLY BUSINESS REVIEW
November 14, 2016 Mail notification to Slice Customers of the Slice True-Up Adjustment for the Composite Cost Pool
November 16, 2016 BPA to post Composite Cost Pool True-Up Table containing actual values and the Slice True-Up
Adjustment
December 8, 2016 Deadline for customers to submit questions about actual line items in the Composite Cost Pool True-
Up Table with the Slice True-Up Adjustment for inclusion in the Agreed Upon Procedures (AUPs)
Performed by BPA external CPA firm (customers have 15 business days following the posting of
Composite Cost Pool Table containing actual values and the Slice True-Up Adjustment
December 22, 2016 BPA posts a response to customer questions (Attachment A does not specify an exact date)
January 9, 2017 Customer comments are due on the list of tasks (The deadline can not exceed 10 days from BPA
posting)
January 31, 2017 BPA finalizes list of questions about actual lines items in the Composite Cost Pool True-Up Table for
the AUPs
Proposed Schedule for Slice True-Up Adjustment for Composite Cost Pool True-Up
Table and Cost Verification Process
This information has been made publicly available by BPA on April 29, 2016 and contains BPA-approved Financial Information.77
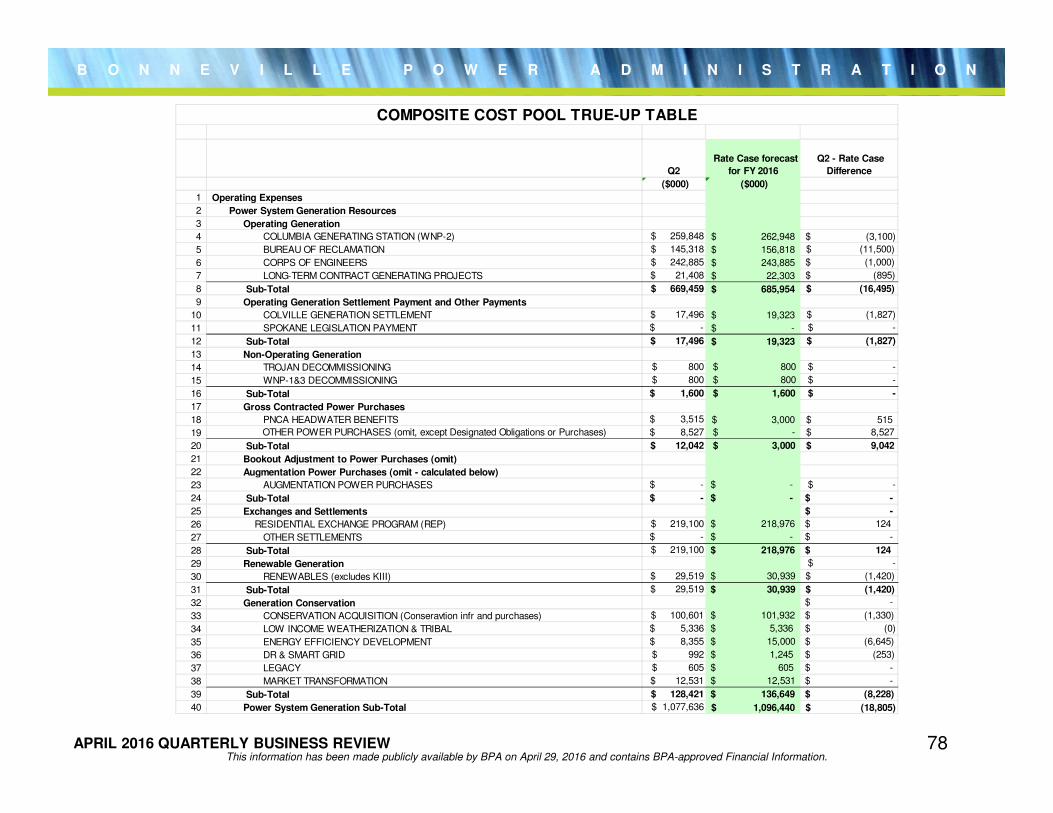
B O N N E V I L L E P O W E R A D M I N I S T R A T I O N
APRIL 2016 QUARTERLY BUSINESS REVIEW
Q2
Rate Case forecast
for FY 2016
Q2 - Rate Case
Difference
($000) ($000)
1 Operating Expenses
2 Power System Generation Resources
3 Operating Generation
4 COLUMBIA GENERATING STATION (WNP-2) $ 259,848 262,948$ (3,100)$
5 BUREAU OF RECLAMATION $ 145,318 156,818$ $ (11,500)
6 CORPS OF ENGINEERS $ 242,885 243,885$ $ (1,000)
7 LONG-TERM CONTRACT GENERATING PROJECTS $ 21,408 22,303$ $ (895)
8 Sub-Total $ 669,459 685,954$ $ (16,495)
9 Operating Generation Settlement Payment and Other Payments
10 COLVILLE GENERATION SETTLEMENT $ 17,496 19,323$ $ (1,827)
11 SPOKANE LEGISLATION PAYMENT $ - -$ $ -
12 Sub-Total $ 17,496 19,323$ $ (1,827)
13 Non-Operating Generation
14 TROJAN DECOMMISSIONING $ 800 $ 800 $ -
15 WNP-1&3 DECOMMISSIONING $ 800 $ 800 $ -
16 Sub-Total $ 1,600 $ 1,600 $ -
17 Gross Contracted Power Purchases
18 PNCA HEADWATER BENEFITS $ 3,515 3,000$ 515$
19 OTHER POWER PURCHASES (omit, except Designated Obligations or Purchases) $ 8,527 $ - $ 8,527
20 Sub-Total $ 12,042 $ 3,000 $ 9,042
21 Bookout Adjustment to Power Purchases (omit)
22 Augmentation Power Purchases (omit - calculated below)
23 AUGMENTATION POWER PURCHASES $ - $ - $ -
24 Sub-Total $ - $ - $ -
25 Exchanges and Settlements $ -
26 RESIDENTIAL EXCHANGE PROGRAM (REP) $ 219,100 $ 218,976 $ 124
27 OTHER SETTLEMENTS $ - $ - $ -
28 Sub-Total $ 219,100 $ 218,976 $ 124
29 Renewable Generation $ -
30 RENEWABLES (excludes KIII) $ 29,519 $ 30,939 $ (1,420)
31 Sub-Total $ 29,519 $ 30,939 $ (1,420)
32 Generation Conservation $ -
33 CONSERVATION ACQUISITION (Conseravtion infr and purchases) $ 100,601 $ 101,932 $ (1,330)
34 LOW INCOME WEATHERIZATION & TRIBAL $ 5,336 $ 5,336 $ (0)
35 ENERGY EFFICIENCY DEVELOPMENT $ 8,355 $ 15,000 $ (6,645)
36 DR & SMART GRID $ 992 $ 1,245 $ (253)
37 LEGACY $ 605 $ 605 $ -
38 MARKET TRANSFORMATION $ 12,531 $ 12,531 $ -
39 Sub-Total $ 128,421 $ 136,649 $ (8,228)
40 Power System Generation Sub-Total $ 1,077,636 1,096,440$ (18,805)$
COMPOSITE COST POOL TRUE-UP TABLE
This information has been made publicly available by BPA on April 29, 2016 and contains BPA-approved Financial Information.78
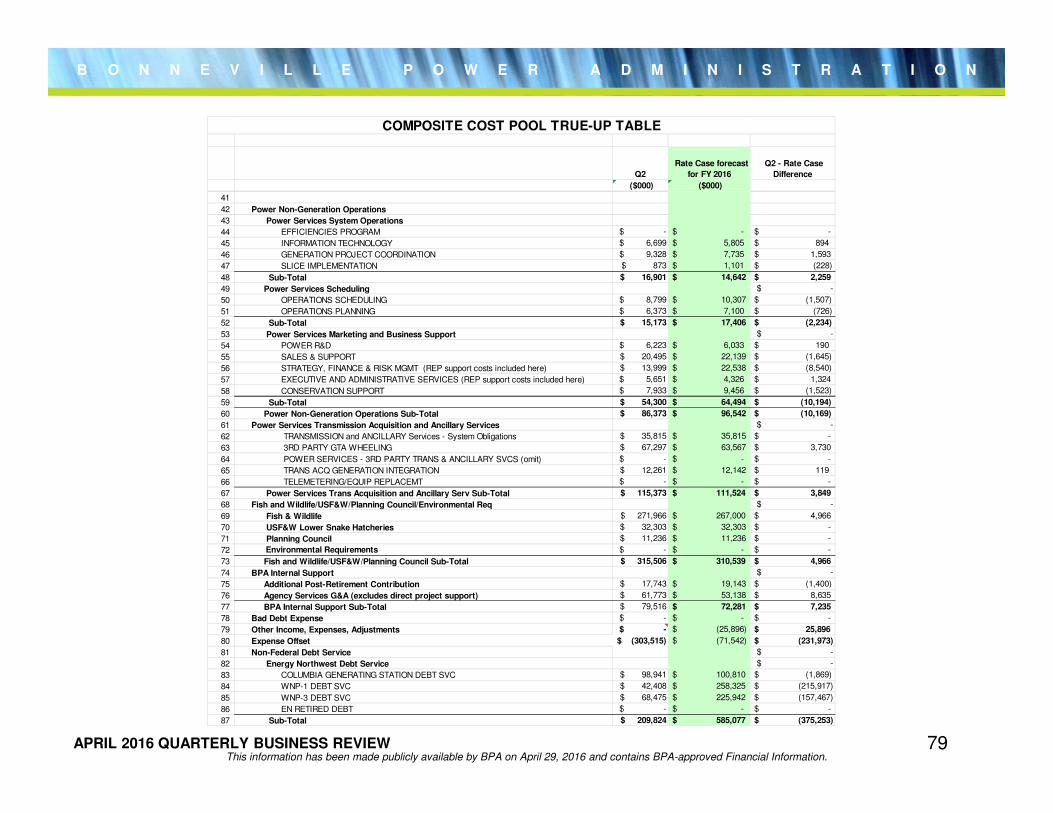
B O N N E V I L L E P O W E R A D M I N I S T R A T I O N
APRIL 2016 QUARTERLY BUSINESS REVIEW
Q2
Rate Case forecast
for FY 2016
Q2 - Rate Case
Difference
($000) ($000)
COMPOSITE COST POOL TRUE-UP TABLE
41
42 Power Non-Generation Operations
43 Power Services System Operations
44 EFFICIENCIES PROGRAM $ - $ - $ -
45 INFORMATION TECHNOLOGY $ 6,699 $ 5,805 $ 894
46 GENERATION PROJECT COORDINATION $ 9,328 $ 7,735 $ 1,593
47 SLICE IMPLEMENTATION $ 873 $ 1,101 $ (228)
48 Sub-Total $ 16,901 $ 14,642 $ 2,259
49 Power Services Scheduling $ -
50 OPERATIONS SCHEDULING $ 8,799 $ 10,307 $ (1,507)
51 OPERATIONS PLANNING $ 6,373 $ 7,100 $ (726)
52 Sub-Total $ 15,173 $ 17,406 $ (2,234)
53 Power Services Marketing and Business Support $ -
54 POWER R&D $ 6,223 $ 6,033 $ 190
55 SALES & SUPPORT $ 20,495 $ 22,139 $ (1,645)
56 STRATEGY, FINANCE & RISK MGMT (REP support costs included here) $ 13,999 $ 22,538 $ (8,540)
57 EXECUTIVE AND ADMINISTRATIVE SERVICES (REP support costs included here) $ 5,651 $ 4,326 $ 1,324
58 CONSERVATION SUPPORT $ 7,933 $ 9,456 $ (1,523)
59 Sub-Total $ 54,300 $ 64,494 $ (10,194)
60 Power Non-Generation Operations Sub-Total $ 86,373 $ 96,542 $ (10,169)
61 Power Services Transmission Acquisition and Ancillary Services $ -
62 TRANSMISSION and ANCILLARY Services - System Obligations $ 35,815 $ 35,815 $ -
63 3RD PARTY GTA WHEELING $ 67,297 $ 63,567 $ 3,730
64 POWER SERVICES - 3RD PARTY TRANS & ANCILLARY SVCS (omit) $ - $ - $ -
65 TRANS ACQ GENERATION INTEGRATION $ 12,261 $ 12,142 $ 119
66 TELEMETERING/EQUIP REPLACEMT $ - $ - $ -
67 Power Services Trans Acquisition and Ancillary Serv Sub-Total $ 115,373 $ 111,524 $ 3,849
68 Fish and Wildlife/USF&W/Planning Council/Environmental Req $ -
69 Fish & Wildlife $ 271,966 $ 267,000 $ 4,966
70 USF&W Lower Snake Hatcheries $ 32,303 $ 32,303 $ -
71 Planning Council $ 11,236 $ 11,236 $ -
72 Environmental Requirements $ - $ - $ -
73 Fish and Wildlife/USF&W/Planning Council Sub-Total $ 315,506 $ 310,539 $ 4,966
74 BPA Internal Support $ -
75 Additional Post-Retirement Contribution $ 17,743 $ 19,143 $ (1,400)
76 Agency Services G&A (excludes direct project support) $ 61,773 $ 53,138 $ 8,635
77 BPA Internal Support Sub-Total $ 79,516 $ 72,281 $ 7,235
78 Bad Debt Expense $ - $ - $ -
79 Other Income, Expenses, Adjustments $ - $ (25,896) $ 25,896
80 Expense Offset $ (303,515) $ (71,542) $ (231,973)
81 Non-Federal Debt Service $ -
82 Energy Northwest Debt Service $ -
83 COLUMBIA GENERATING STATION DEBT SVC $ 98,941 $ 100,810 $ (1,869)
84 WNP-1 DEBT SVC $ 42,408 $ 258,325 $ (215,917)
85 WNP-3 DEBT SVC $ 68,475 $ 225,942 $ (157,467)
86 EN RETIRED DEBT $ - $ - $ -
87 Sub-Total $ 209,824 $ 585,077 $ (375,253)
This information has been made publicly available by BPA on April 29, 2016 and contains BPA-approved Financial Information.79
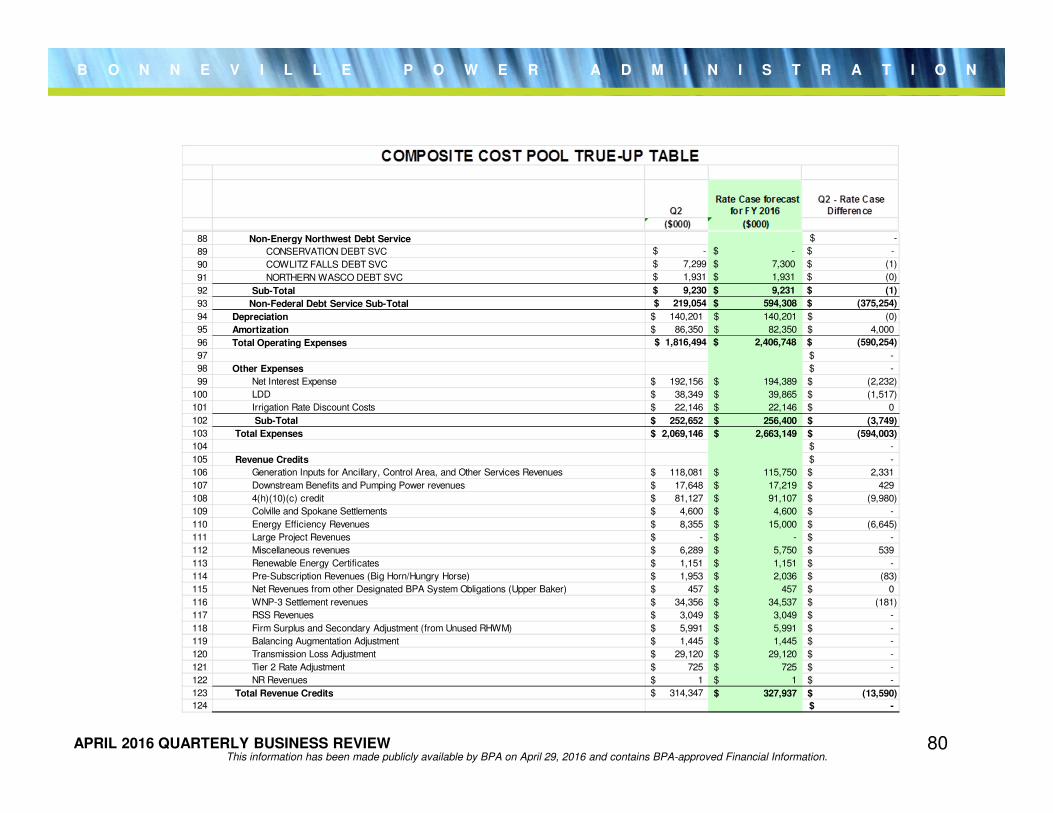
B O N N E V I L L E P O W E R A D M I N I S T R A T I O N
APRIL 2016 QUARTERLY BUSINESS REVIEW
88 Non-Energy Northwest Debt Service $ -
89 CONSERVATION DEBT SVC $ - $ - $ -
90 COWLITZ FALLS DEBT SVC $ 7,299 $ 7,300 $ (1)
91 NORTHERN WASCO DEBT SVC $ 1,931 $ 1,931 $ (0)
92 Sub-Total $ 9,230 $ 9,231 $ (1)
93 Non-Federal Debt Service Sub-Total $ 219,054 $ 594,308 $ (375,254)
94 Depreciation 140,201$ 140,201$ (0)$
95 Amortization 86,350$ 82,350$ 4,000$
96 Total Operating Expenses $ 1,816,494 $ 2,406,748 $ (590,254)
97 -$
98 Other Expenses -$
99 Net Interest Expense 192,156$ 194,389$ (2,232)$
100 LDD 38,349$ 39,865$ (1,517)$
101 Irrigation Rate Discount Costs 22,146$ 22,146$ 0$
102 Sub-Total 252,652$ 256,400$ (3,749)$
103 Total Expenses 2,069,146$ 2,663,149$ (594,003)$
104 -$
105 Revenue Credits -$
106 Generation Inputs for Ancillary, Control Area, and Other Services Revenues 118,081$ 115,750$ 2,331$
107 Downstream Benefits and Pumping Power revenues 17,648$ 17,219$ 429$
108 4(h)(10)(c) credit 81,127$ 91,107$ (9,980)$
109 Colville and Spokane Settlements 4,600$ 4,600$ -$
110 Energy Efficiency Revenues 8,355$ 15,000$ (6,645)$
111 Large Project Revenues -$ -$ -$
112 Miscellaneous revenues 6,289$ 5,750$ 539$
113 Renewable Energy Certificates 1,151$ 1,151$ -$
114 Pre-Subscription Revenues (Big Horn/Hungry Horse) 1,953$ 2,036$ (83)$
115 Net Revenues from other Designated BPA System Obligations (Upper Baker) 457$ 457$ 0$
116 WNP-3 Settlement revenues 34,356$ 34,537$ (181)$
117 RSS Revenues 3,049$ 3,049$ -$
118 Firm Surplus and Secondary Adjustment (from Unused RHWM) 5,991$ 5,991$ -$
119 Balancing Augmentation Adjustment 1,445$ 1,445$ -$
120 Transmission Loss Adjustment 29,120$ 29,120$ -$
121 Tier 2 Rate Adjustment 725$ 725$ -$
122 NR Revenues 1$ 1$ -$
123 Total Revenue Credits 314,347$ 327,937$ (13,590)$
124 -$
This information has been made publicly available by BPA on April 29, 2016 and contains BPA-approved Financial Information.80
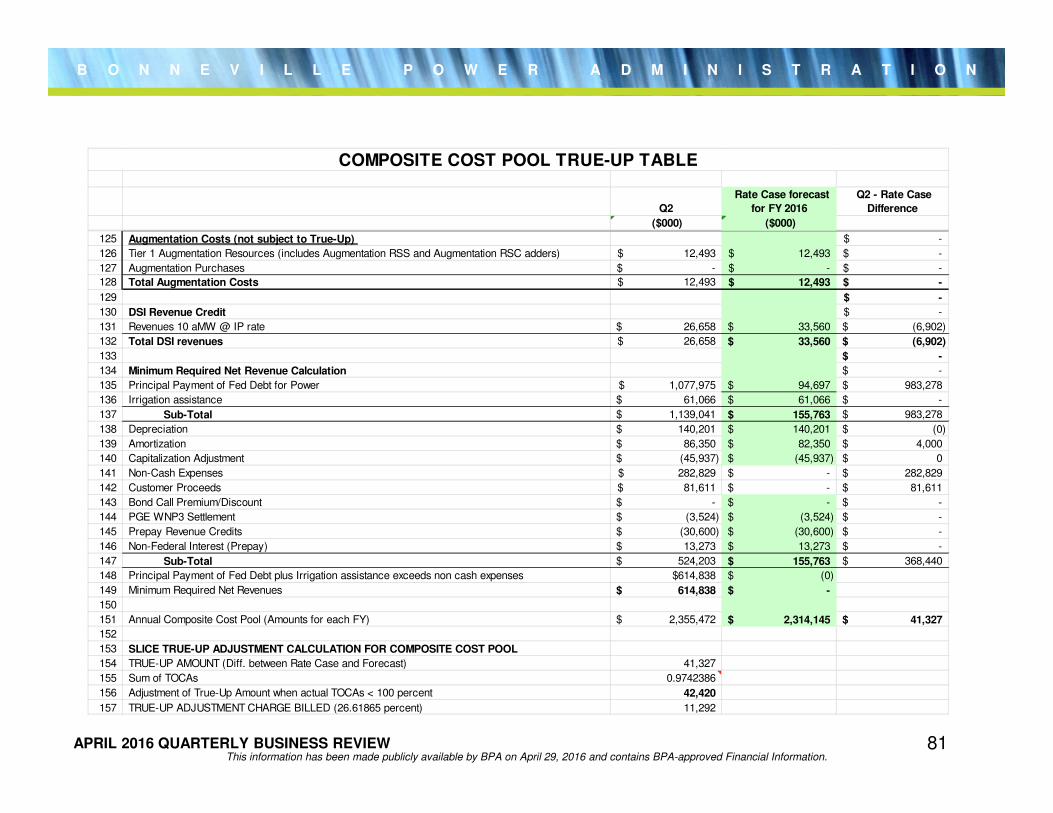
B O N N E V I L L E P O W E R A D M I N I S T R A T I O N
APRIL 2016 QUARTERLY BUSINESS REVIEW
125 Augmentation Costs (not subject to True-Up) -$
126 Tier 1 Augmentation Resources (includes Augmentation RSS and Augmentation RSC adders) 12,493$ 12,493$ -$
127 Augmentation Purchases -$ -$ -$
128 Total Augmentation Costs 12,493$ 12,493$ -$
129 -$
130 DSI Revenue Credit -$
131 Revenues 10 aMW @ IP rate 26,658$ 33,560$ (6,902)$
132 Total DSI revenues 26,658$ 33,560$ (6,902)$
133 -$
134 Minimum Required Net Revenue Calculation -$
135 Principal Payment of Fed Debt for Power 1,077,975$ 94,697$ 983,278$
136 Irrigation assistance 61,066$ 61,066$ -$
137 Sub-Total 1,139,041$ 155,763$ 983,278$
138 Depreciation 140,201$ 140,201$ (0)$
139 Amortization 86,350$ 82,350$ 4,000$
140 Capitalization Adjustment (45,937)$ (45,937)$ 0$
141 Non-Cash Expenses 282,829$ -$ 282,829$
142 Customer Proceeds 81,611$ -$ 81,611$
143 Bond Call Premium/Discount -$ -$ -$
144 PGE WNP3 Settlement (3,524)$ (3,524)$ -$
145 Prepay Revenue Credits (30,600)$ (30,600)$ -$
146 Non-Federal Interest (Prepay) 13,273$ 13,273$ -$
147 Sub-Total 524,203$ 155,763$ 368,440$
148 Principal Payment of Fed Debt plus Irrigation assistance exceeds non cash expenses $614,838 (0)$
149 Minimum Required Net Revenues 614,838$ -$
150
151 Annual Composite Cost Pool (Amounts for each FY) 2,355,472$ 2,314,145$ 41,327$
152
153 SLICE TRUE-UP ADJUSTMENT CALCULATION FOR COMPOSITE COST POOL
154 TRUE-UP AMOUNT (Diff. between Rate Case and Forecast) 41,327
155 Sum of TOCAs 0.9742386
156 Adjustment of True-Up Amount when actual TOCAs < 100 percent 42,420
157 TRUE-UP ADJUSTMENT CHARGE BILLED (26.61865 percent) 11,292
Q2
Rate Case forecast
for FY 2016
Q2 - Rate Case
Difference
($000) ($000)
COMPOSITE COST POOL TRUE-UP TABLE
This information has been made publicly available by BPA on April 29, 2016 and contains BPA-approved Financial Information.81
B O N N E V I L L E P O W E R A D M I N I S T R A T I O N
APRIL 2016 QUARTERLY BUSINESS REVIEW
Financial Disclosure
� The information contained in slides 3-14, 18-21, 33-41 and 65-81 has been made publicly available by BPA on April 29, 2016 and contains BPA-approved Financial Information.
� The information contained in slides 15-17, 22-32, 42-64 has been made publicly available by BPA on April 29, 2016 and does not contain BPA-approved Financial Information.
82