quarterly enterprise software market review - shea & … · 05/06/14 convertro aol 100% - - $89...
TRANSCRIPT

Shea & Company, LLC
www.shea-co.com
Member FINRA & SIPC
Copyright ©2014
Boston
200 Clarendon Street, Floor 25
Boston, MA 02116
Michael H.M. Shea
Managing Director
617.896.2255
Christopher J. Pingpank
Principal
617.896.2218
San Francisco
201 Mission Street, Suite 1850
San Francisco, CA 94105
Michael S. Barker
Managing Director
415.203.5286
Brad E. McCarthy
Vice President
617.896.2245
Quarterly Enterprise Software Market Review 2Q 2014

Copyright ©2014 Shea & Company, LLC
Shea & Company served as the exclusive
financial advisor to Onaro
has been acquired by
Advisory Services and Selected Transactions
Shea & Company Overview
1
Mergers & Acquisitions
Buy-side and sell-side M&A advisory
Divestitures
Restructuring
Private Placements & Capital Raising
Late-stage venture and growth equity
Recapitalizations
IPO advisory
Corporate Strategy
Corporate development advisory
Fairness opinions
Selected Transactions Shea & Company has advised on billions of dollars of software transactions
Shea & Company is a software-focused investment bank that believes focus underpins success, and
success is measured by the outcomes we achieve with our clients
Shea & Company served as the exclusive
financial advisor to SPL WorldGroup
has been acquired by
Shea & Company served as the exclusive
financial advisor to ProfitLogic
has been acquired by
Shea & Company served as the exclusive
financial advisor to Platform Computing
has been acquired by
Shea & Company served as the exclusive
financial advisor to Wavelink
has been acquired by
Shea & Company served as the exclusive
financial advisor to Kashya
has been acquired by
Shea & Company served as the exclusive
financial advisor to Mimecast
has received an investment from
Shea & Company served as the exclusive
financial advisor to Pervasive
has been acquired by
(NASDAQ: PVSW)
Shea & Company served as the exclusive
financial advisor to Worklight
has been acquired by
Shea & Company served as the exclusive
financial advisor to Ping Identity
has received an investment from
Shea & Company served as the exclusive
financial advisor to Bomgar Corporation
has received a majority investment from
Shea & Company served as the exclusive
financial advisor to Dimdim
has been acquired by

Copyright ©2014 Shea & Company, LLC 2
Contents
M&A Activity
Software M&A Summary: 2010 – 2Q 2014 p. 3
Software Acquisitions: Trend Analysis p. 4
Publicly Available Software M&A Transaction Data: 2Q 2014 p. 5
Announced Software Acquisitions: 2Q 2014 p. 7
Most Active Software Acquirers: 2007 – 2Q 2014 p. 11
Most Active Software Acquirers: 2012 – 2Q 2014 p. 12
Public Equity Market Valuations
Relative Performance by Index p. 21
Price Performance and Valuation Metrics by Segment p. 22
Price Performance and Valuation Metrics of Selected Software Vendors p. 23
Equity Trading Multiples by Growth Tranche p. 24
Equity Trading Multiples by Segment p. 25
Equity Trading Multiples by Comparable Subset p. 31
Equity Financing Activity
Software IPOs: Trailing Six Months p. 34
Software IPO Pricing & Performance Data p. 35
Software IPO Pipeline p. 36
Software Private Capital Raise Activity: 2Q 2014 p. 37

Copyright ©2014 Shea & Company, LLC
Transaction Count by Deal Size
> $1bn 2 6 5 2 0 4 6 4 2 3 3 2 1 4 4 5 1 0
$500m - $1bn 0 4 3 2 0 1 1 1 1 2 0 3 0 5 5 1 3 2
$250m - $500m 1 6 3 3 2 9 4 2 5 2 3 1 0 3 1 3 2 1
< $250m 28 28 26 25 31 25 28 31 29 30 29 28 34 24 25 40 26 42
No Reported Value 79 61 93 48 72 52 49 91 84 96 95 107 104 121 127 118 115 155
Total 110 105 130 80 105 91 88 129 121 133 130 141 139 157 162 167 147 200
Acquirer
Target
Date 04/28/14 04/30/14 05/06/14 05/06/14 05/19/14 06/09/14 06/17/14
Enterprise Value $185 $175 n/a $60 n/a n/a $175
NASDAQ
$4.8
$19.4 $19.2
$7.9
$2.5
$12.3
$23.2
$10.1
$6.8
$12.0
$6.3 $7.6
$3.0
$19.9
$14.0 $11.5
$5.9 $3.9
$-
$10
$20
$30
Q1 Q2 Q3 Q4 Q1 Q2 Q3 Q4 Q1 Q2 Q3 Q4 Q1 Q2 Q3 Q4 Q1 Q2
2010 2011 2012 2013 2014
An
no
un
ce
d D
ea
l V
alu
e (
$ b
illio
ns)
M&A Activity Software M&A Summary: 2010 – 2Q 2014
Notable Announced Transactions: 2Q 2014 ($ millions)
Sources: Company releases, Wall Street research
3

Copyright ©2014 Shea & Company, LLC 4
M&A Activity
Software Acquisitions: Trend Analysis
By Transaction Size (2012 – 2Q 2014)
By Target Segment (2012 – 2Q 2014)
Notes:
Business Applications includes: Advertising Technology; ERP & Business Applications; Marketing Applications; Technical & Embedded Applications
Information Management includes: Business Intelligence; Content Management
Infrastructure includes: Application Delivery & Network Acceleration; IT Operations Management; Platforms, Development Tools & Deployment; Storage Management
Sources: Company releases, Wall Street research
116
11 6
10
123
7 11
14
68
3 5 1
0
20
40
60
80
100
120
140
< $250m $250m - $500m $500m - $1bn > $1bn
Deal Value (Enterprise Value)
# of Deals 2012
2013
2014
$5 $4
$5
$18
$6
$3
$8
$30
$4
$1
$4
$2
$-
$5
$10
$15
$20
$25
$30
$35
< $250m $250m - $500m $500m - $1bn > $1bn
Deal Value (Enterprise Value)
Aggregate Deal Value ($ billions)
1.6x
3.6x
5.1x
4.0x
2.4x
3.8x 3.7x
4.3x
2.0x
4.2x
3.8x
n/a
0x
1x
2x
3x
4x
5x
6x
< $250m $250m - $500m $500m - $1bn > $1bn
Deal Value (Enterprise Value)
Median EV / LTM Revenue
217
57 69
104
46
208
66
115
150
65
157
45
61 58
26
0
50
100
150
200
250
Business
Applications
IT Security Information
Management
Infrastructure Financial
Applications
# of Deals 2012
2013
2014
$20
$2 $1
$5
$2
$11
$4
$2
$15 $15
$4
$1 $1
$3
$1
$-
$5
$10
$15
$20
$25
Business
Applications
IT Security Information
Management
Infrastructure Financial
Applications
Aggregate Deal Value ($ billions)
2.9x
3.8x
1.2x
2.7x
1.8x
2.7x 2.2x
3.8x
2.9x
3.8x
1.9x
9.7x
5.3x
7.6x
3.6x
0x
2x
4x
6x
8x
10x
12x
Business
Applications
IT Security Information
Management
Infrastructure Financial
Applications
Median EV / LTM Revenue

Copyright ©2014 Shea & Company, LLC
Consideration Equity Enterprise EV / Revenue
Announced Target Acquirer(s) % Cash % Stock Value Value LTM Current yr Fwd yr
06/30/14 Grow Mobile Perion Network 59% 41% - $17 - - -
06/26/14 Serenic Corporation (assets) Sylogist Ltd. 100% - - $11 - - -
06/25/14 Cegedim Group (assets) IMS Health 100% - - $520 0.9x - -
06/24/14 AdColony Opera Mediaworks 100% - - $75 1.4x - -
06/23/14 Capario Emdeon 100% - - $115 - - -
06/18/14 eNovance SaS Red Hat 71% 29% - $95 - - -
06/17/14 Tail-f Systems Cisco Systems - - - $175 - - -
06/10/14 Adconion Amobee - - $209 $235 1.3x - -
06/10/14 Kontera Amobee - - - $150 5.8x - -
06/10/14 ViryaNet Ltd. Verisae 100% - - $19 - - -
06/06/14 Impact Mobile DealNet Capital 67% 33% - $1 - - -
06/04/14 Infinitive Pty Ltd Rubik Financial Ltd. 100% - - $2 - - -
06/04/14 Serus E2open 78% 22% - $19 - - -
06/04/14 Stargate Information Systems Pty Ltd Rubik Financial Ltd. 100% - - $19 - - -
06/03/14 Compliance Technologies International Markit Group Limited 100% - - $43 - - -
06/02/14 NowSpots Marin Software 24% 76% - $23 - - -
05/29/14 HelloWallet Morningstar - - $53 $39 - - -
05/20/14 NetCitadel Proofpoint 100% - - $24 - - -
05/14/14 Fixmo (assets) Good Technology - 100% - $18 - - -
05/14/14 LiveRamp Acxiom 100% - - $310 - - 10.3x
05/14/14 Notivus Multi-Family (assets) RealPage 100% - - $4 - - -
05/06/14 CallCopy inContact 21% 79% - $42 2.1x - -
05/06/14 Convertro AOL 100% - - $89 - - -
05/06/14 ISG Xerox - - - $225 - - -
05/06/14 nPulse Technologies FireEye 100% - - $60 - - -
05/06/14 ReadSoft AB Lexmark International - 100% $195 $182 1.5x - -
05/06/14 Soft-ex Communications WidePoint 100% - - $5 - 0.8x -
05/06/14 UpdateLogic Silicon Image 100% - $14 $14 - - -
05/05/14 Veloxum (assets) AmbiCom - 100% - $3 - - -
05/02/14 FortConsult A/S NCC Group - - - $3 - - -
M&A Activity
Publicly Available Software M&A Transaction Data: 2Q 2014
5
Notes:
Includes only transactions for which data was publicly available
EV / Revenue multiples in excess of 50x or less than 0x are considered to be not meaningful
Sources: Company releases, Wall Street research
($ millions)

Copyright ©2014 Shea & Company, LLC
Consideration Equity Enterprise EV / Revenue
Announced Target Acquirer(s) % Cash % Stock Value Value LTM Current yr Fwd yr
04/30/14 Inktank Storage Red Hat 100% - - $175 - - -
04/29/14 Intesource Proactis Group 100% - - $4 0.8x - -
04/28/14 Jaspersoft TIBCO Software - - - $185 - - -
04/24/14 DecTech Solutions Pty Ltd GB Group PLC - - - $34 3.6x - -
04/23/14 docTrackr IntraLinks 100% - - $10 - - -
04/18/14 FixStream Network Tech Mahindra Ltd - - - $10 - - -
04/15/14 E-Learning S.A. John Wiley & Sons 100% - - $175 - - -
04/15/14 FeedMagnet Bazaarvoice 100% - - $9 - - -
04/10/14 Beijing Topwalk Beijing TRS Information Technology - - - $97 - - -
04/10/14 Zopim Technologies Zendesk 31% 69% - $16 - - -
04/09/14 One-Page Company InterMet Resources Limited - 100% $9 $10 - - -
04/07/14 ABILITY Network Summit Partners 100% - - $550 - - -
04/07/14 Metaforic INSIDE Secure 100% - - $12 - - -
04/02/14 Profiles International John Wiley & Sons 100% - - $51 1.9x - -
04/01/14 ByAllAccounts Morningstar 100% - - $28 - - -
M&A Activity
Publicly Available Software M&A Transaction Data: 2Q 2014 continued
6
Notes:
Includes only transactions for which data was publicly available
EV / Revenue multiples in excess of 50x or less than 0x are considered to be not meaningful
Sources: Company releases, Wall Street research
($ millions)

Copyright ©2014 Shea & Company, LLC
Announced Target Acquirer(s) Target Segment & Description Price
06/30/14 Beans & Intellect Financial Technology Ltd. Miles Software Solutions Ltd. Financial Applications - Portfolio management and trade processing n/a
06/30/14 Grow Mobile Perion Network Advertising Technology - Mobile ad spend tracking $17
06/30/14 OhmData WANdisco International Ltd. Platforms, Development Tools & Deployment - Open source non-relational database n/a
06/27/14 Assemblage Cisco Systems ERP & Business Applications - Web conferencing, collaboration and file sharing n/a
06/27/14 MoFuse Search Agency Platforms, Development Tools & Deployment - Mobile website development and monetization n/a
06/26/14 Serenic Corporation (assets) Sylogist Ltd. ERP & Business Applications - Financial management and accounting for the nonprofit and government sectors $11
06/26/14 Synference Ltd. Optimizely Business Intelligence - Targeting metric optimization and testing n/a
06/26/14 vTrainingRoom (assets) Bitkea Technologies ERP & Business Applications - Distance learning and training management n/a
06/25/14 Appurify Google Platforms, Development Tools & Deployment - Mobile API management, testing and debugging n/a
06/25/14 Cegedim Group (assets) IMS Health ERP & Business Applications - CRM and sales force optimization for the healthcare sector $520
06/25/14 NeoSystems Wmode ERP & Business Applications - CRM, ERP and content management n/a
06/24/14 AdColony Opera Mediaworks Advertising Technology - Mobile advertising placement and application monetization $75
06/24/14 Cogniserv DataBank IMX ERP & Business Applications - Document management, mobile data capture and workforce management n/a
06/23/14 Capario Emdeon ERP & Business Applications - Insurance claim processing and revenue management $115
06/23/14 NYSE Technologies (assets) Ullink Financial Applications - Derivative trading and messaging n/a
06/20/14 LiveLOOK Oracle ERP & Business Applications - CRM co-browsing and live chat n/a
06/19/14 Aito Technologies (assets) EXFO ERP & Business Applications - Customer analytics, mobile device management and billing for the telecom sector n/a
06/19/14 IBM (storage patents) Pure Storage Storage Management - IT storage and technology patents n/a
06/19/14 mDialog Google Advertising Technology - Video ad insertion across connected devices n/a
06/18/14 CryptoSeal CloudFlare IT Security - Virtual private network for securing web applications n/a
06/18/14 eNovance SaS Red Hat Platforms, Development Tools & Deployment - Open source cloud hosting and operation $95
06/18/14 Pingdom AB SolarWinds IT Operations Management - Uptime website monitoring and performance management n/a
06/17/14 nettime Solutions Paychex ERP & Business Applications - Employee time, attendance and payroll management n/a
06/17/14 Radoop RapidMiner Business Intelligence - Simplified big data and predictive data analytics n/a
06/17/14 Tail-f Systems Cisco Systems IT Operations Management - Configuration management and network automation $175
06/17/14 TIA Technology A/S EQT Partners AB Financial Applications - CRM, financial management and claims management for the insurance sector n/a
06/16/14 Parastructure Dropbox Business Intelligence - Open source data visualization and database analytics n/a
06/13/14 StrikeIron Informatica IT Operations Management - Application performance management and API management n/a
06/12/14 Innovode Ltd. (assets) CloudLock IT Security - Anti data leakage and compliance n/a
06/12/14 Integrated Industrial Information KPIT Cummins Infosystems Ltd ERP & Business Applications - Product lifecycle management n/a
06/12/14 Medio Systems HERE Business Intelligence - Mobile predictive customer analytics and ad targeting n/a
06/11/14 Bank of America (assets) REDI Global Technologies Financial Applications - Trade execution management system n/a
06/11/14 Commonwealth Legal Ricoh Canada ERP & Business Applications - E-discovery and litigation evidence management n/a
06/11/14 FireMon Insight Venture Partners IT Security - Firewall policy, vulnerability risk and network device change management n/a
06/11/14 Harmony Information Systems Mediware Information Systems ERP & Business Applications - Financial management and collaboration for the healthcare sector n/a
06/11/14 Synergistic Software Solutions RKL eSolutions ERP & Business Applications - Workforce and payroll management and salesforce automation n/a
06/11/14 Upfront Digital Media Undertone Advertising Technology - Segmented audience data for ad placement and forecasting n/a
06/10/14 Adconion Amobee Advertising Technology - Cross-channel advertising network and monetization platform $235
06/10/14 ASDIS Solutions GmbH Auconet IT Security - ATM, kiosk, POS and device security management n/a
06/10/14 Kontera Amobee Business Intelligence - Social media content analytics and marketing $150
06/10/14 ViryaNet Ltd. Verisae ERP & Business Applications - Mobile workforce business process management for field service organizations $19
06/09/14 Autotask Vista Equity Partners ERP & Business Applications - IT service management and business automation for VARs and MSPs n/a
06/09/14 Cloudfinder eFolder Storage Management - Cloud-to-cloud backup and recovery n/a
06/09/14 Modulus Progress Software Platforms, Development Tools & Deployment - Application lifecycle management for Node.js and MongoDB n/a
06/09/14 Profeatable Pegasystems ERP & Business Applications - Co-browsing screen sharing n/a
06/09/14 TeamConnect Legal Hold Mitratech ERP & Business Applications - Legal hold and E-discovery business process management n/a
06/09/14 WebEquity Solutions Moodys Analytics Financial Applications - Lending management for the banking and financial institution sectors n/a
06/06/14 Impact Mobile DealNet Capital Advertising Technology - Mobile customer engagement and ads $1
06/05/14 Axium XTS Deltek ERP & Business Applications - Project management and accounting for the architecture and engineering sectors n/a
06/05/14 Droptalk Dropbox ERP & Business Applications - Business messaging and link sharing n/a
M&A Activity
Announced Software Acquisitions: 2Q 2014
7
Sources: Company releases, Wall Street research
($ millions)

Copyright ©2014 Shea & Company, LLC
Announced Target Acquirer(s) Target Segment & Description Price
06/05/14 Eversync Solutions Infrascale Storage Management - Data protection, recovery, backup and continuity suite n/a
06/05/14 Globalone Information Technologies Medytox Solutions ERP & Business Applications - Electronic health record and revenue cycle management for the healthcare sector n/a
06/04/14 Infinitive Pty Ltd Rubik Financial Ltd. Financial Applications - CRM, application automation and loan comparison for mortgage brokers $2
06/04/14 KKT srl FleetMatics ERP & Business Applications - Fleet management and routing optimization n/a
06/04/14 Measureful Chirpify Business Intelligence - Automated marketing reports integrated with Google and social media n/a
06/04/14 Namo Media Twitter Advertising Technology - In-stream ad creation and analytics n/a
06/04/14 Serus E2open ERP & Business Applications - Supply chain process management $19
06/04/14 Stargate Information Systems Pty Ltd Rubik Financial Ltd. Financial Applications - CRM and loan processing for mortgage brokers $19
06/04/14 Synchronite GmbH LivePerson ERP & Business Applications - Co-browsing and collaboration for customer support and sales n/a
06/03/14 Compliance Technologies International Markit Group Limited Financial Applications - Tax processing and due diligence for financial institutions $43
06/03/14 Gazzang Cloudera IT Security - Data encryption and key management n/a
06/03/14 Objective Systems Integrators MYCOM Group Ltd. IT Operations Management - Operations support system optimization for the telecom sector n/a
06/03/14 Simplikate Phunware Platforms, Development Tools & Deployment - Mobile pop-up advertising and marketing application development n/a
06/03/14 TruCentric Acquia Platforms, Development Tools & Deployment - Marketing and website personalization n/a
06/02/14 AIRSIS Oceaneering International ERP & Business Applications - Remote asset management n/a
06/02/14 Clinknow Ezetap Private Ltd Business Intelligence - Predictive consumer spending analytics for banks n/a
06/02/14 NowSpots Marin Software Advertising Technology - Social media ad retargeting $23
05/29/14 DC Storm Ltd. Rakuten Marketing Marketing Applications - Online marketing performance management and reporting n/a
05/29/14 HelloWallet Morningstar Financial Applications - Financial planning and investment advice for employee benefits $39
05/29/14 RGI SpA Ardian Financial Applications - Insurance agency and broker back-office management n/a
05/29/14 Yuruware Pty Ltd Unitrends Storage Management - Openstack disaster recovery and data migration n/a
05/28/14 Capptain Microsoft Marketing Applications - Mobile application marketing and usage analytics n/a
05/28/14 Cognitive Match Magnetic Media Online Marketing Applications - Online ad targeting and customer tracking n/a
05/28/14 Distimo Holding B.V. App Annie Limited Platforms, Development Tools & Deployment - Mobile application store analytics and advertising n/a
05/28/14 Nitrodesk Symantec ERP & Business Applications - Secure mobile email n/a
05/27/14 eDealya (assets) Human Demand Advertising Technology - Media aggregation and contextual mobile advertising n/a
05/27/14 Risk IDS, Ltd. VASCO Data Security International Financial Applications - Banking transaction security and fraud detection n/a
05/23/14 Systems & Programming Solutions Neopost Group ERP & Business Applications - Shipping logistics and warehouse management n/a
05/22/14 Springboard Business Tools (assets) Deven Software ERP & Business Applications - M&A project management n/a
05/21/14 LetMobile LANDesk Software IT Security - Mobile security and device management n/a
05/21/14 Renesys Dyn IT Operations Management - Network performance monitoring n/a
05/21/14 SimplyBox (technology assets) Moxie Software Advertising Technology - Social media monitoring and contextual mobile advertising n/a
05/21/14 ThreatGRID Cisco Systems IT Security - Malware identification and threat detection n/a
05/20/14 Cognea IBM Business Intelligence - Cognitive computing and customer service AI platform n/a
05/20/14 CommTrack CellarStone ERP & Business Applications - QuickBooks add-on for sales commission tracking n/a
05/20/14 NetCitadel Proofpoint IT Security - Security threat containment and remediation $24
05/20/14 SeeWhy SAP Marketing Applications - Behavioral marketing platform to retarget abandoned shopping cards n/a
05/19/14 Divide Google IT Security - Mobile device management and security n/a
05/19/14 Enterprise Technology Group Nexstar Broadcasting Group Content Management - Creation and management of website content n/a
05/19/14 Mocean Mobile PubMatic Advertising Technology - Targeted mobile advertising and analytics n/a
05/15/14 Kalistick Coverity Platforms, Development Tools & Deployment - Software testing and development n/a
05/15/14 XA Secure Hortonworks IT Security - Hadoop big data security and governance n/a
05/14/14 Besol Soluciones SL (assets) Flexiant Ltd. Platforms, Development Tools & Deployment - Multi-cloud management and monitoring n/a
05/14/14 Fixmo (assets) Good Technology IT Security - Mobile risk management and containerized security $18
05/14/14 Invitco Intuit Financial Applications - Email-based accounts payable management n/a
05/14/14 LiveRamp Acxiom Marketing Applications - CRM marketing data integration $310
05/14/14 MediaV Qihoo 360 Technology Company Business Intelligence - Online marketing analytics and tracking n/a
05/14/14 Notivus Multi-Family (assets) RealPage ERP & Business Applications - Vendor risk mitigation and credentialing $4
05/14/14 Redwood Analytics Aderant Business Intelligence - Performance analytics for the legal sector n/a
05/13/14 Cegid SA (hospitality assets) SequoiaSoft ERP & Business Applications - ERP and data management for the hospitality sector n/a
M&A Activity
Announced Software Acquisitions: 2Q 2014 continued
8
($ millions)
Sources: Company releases, Wall Street research

Copyright ©2014 Shea & Company, LLC
Announced Target Acquirer(s) Target Segment & Description Price
05/13/14 DealerSocket Vista Equity Partners ERP & Business Applications - CRM and marketing automation for the automotive sector n/a
05/12/14 Acclaimd eBoss Online Recruitment Solutions ERP & Business Applications - Job marketing and employee recruiting platform n/a
05/09/14 Smak Unified Inbox Content Management - Email and social media aggregation and organization n/a
05/09/14 Wurldtech General Electric Company IT Security - Cyber attack vulnerability and anomaly testing n/a
05/08/14 Brandify Where 2 Get It Business Intelligence - Brand awareness analysis on social media n/a
05/08/14 Lettuce Intuit ERP & Business Applications - Sales automation, inventory and order management n/a
05/08/14 Spendship Moontoast Advertising Technology - Mobile social promotions and reward placement on social media n/a
05/07/14 MediaSpan Group NEWSCYCLE Solutions Content Management - Media content management n/a
05/07/14 Stackdriver Google IT Operations Management - Cloud environment monitoring and performance management n/a
05/06/14 Adometry Google Business Intelligence - Marketing analytics and campaign optimization platform n/a
05/06/14 BrandAds Extreme Reach Advertising Technology - Online video advertising efficacy measurement n/a
05/06/14 CallCopy inContact ERP & Business Applications - Call center workforce management $42
05/06/14 Convertro AOL Marketing Applications - Marketing optimization platform via sales conversions $89
05/06/14 DocuLex Astria Solutions Group Content Management - Document and record management n/a
05/06/14 ISG Xerox ERP & Business Applications - Workers compensation bill processing, review and medical case management $225
05/06/14 Kippt Coinbase Content Management - Collaborative bookmarking and file share n/a
05/06/14 MeshLabs Software Private Limited Pegasystems Business Intelligence - Text mining and information extraction from messages n/a
05/06/14 nPulse Technologies FireEye IT Security - Network packet analysis and security $60
05/06/14 PivotLink Corp SmartFocus Business Intelligence - Sales, orders, inventory and customer behavior analytics n/a
05/06/14 ReadSoft AB Lexmark International Content Management - Document management and processing $182
05/06/14 ScaleXtreme Citrix Systems IT Operations Management - Server monitoring, management and deployment n/a
05/06/14 Soft-ex Communications WidePoint IT Operations Management - Telecom network analysis, usage and management $5
05/06/14 UpdateLogic Silicon Image Technical & Embedded Applications - System upgrade and device management for connected devices $14
05/05/14 Rangespan Google ERP & Business Applications - Automated and predictive inventory management n/a
05/05/14 Veloxum (assets) AmbiCom IT Operations Management - Operating system optimization $3
05/02/14 FortConsult A/S NCC Group IT Security - Security penetration testing $3
05/02/14 iSystems Silver Oak ERP & Business Applications - Payroll, tax and workforce management n/a
05/01/14 Black Ice Partners Ltd Bonaparte Resources Financial Applications - Financial risk management and regulatory reporting n/a
05/01/14 GreenButton Limited Microsoft IT Operations Management - Cloud middleware for high performance computing and job cost analysis n/a
05/01/14 Snowball Factory Unified Social Business Intelligence - Social media campaign management and analytics n/a
05/01/14 Sterling Trader Professional Trading Solutions Financial Applications - Trading order management and execution n/a
04/30/14 apprupt GmbH Opera Mediaworks Advertising Technology - Mobile advertising networks and lead generation n/a
04/30/14 Fivia SA WideOrbit Advertising Technology - Online ad campaign management and information databases n/a
04/30/14 i4C Analytics Accenture ERP & Business Applications - Vertical-specific operations analytics for specific industries n/a
04/30/14 Inktank Storage Red Hat Storage Management - Open source storage system $175
04/30/14 Medical Billing Solutions Services Etransmedia Technology ERP & Business Applications - Billing, financial and records management for the healthcare sector n/a
04/30/14 ORSYP Automic Software ERP & Business Applications - Job scheduling and IT process automation n/a
04/29/14 4DK Technologies Radius Networks Business Intelligence - Mobile customer analytics and marketing automation n/a
04/29/14 Audience Media SL Zinio Content Management - Multi-channel publishing and content management n/a
04/29/14 Indicee Dun & Bradstreet Business Intelligence - Social media and CRM business intelligence and analytics n/a
04/29/14 Intesource Proactis Group ERP & Business Applications - Reverse auction and procurement management $4
04/29/14 Velocent Systems Zettics Business Intelligence - Mobile customer experience analysis and mobile network monitoring n/a
04/29/14 XYPRO Technology XYPRO Technology (management) IT Security - Security compliance for HP NonStop environments n/a
04/28/14 Cascade Human Resources Limited IRIS Software Group Ltd. ERP & Business Applications - HR, recruitment and payroll management n/a
04/28/14 HSP International Nair & Co. ERP & Business Applications - Accounting, payroll and business management n/a
04/28/14 Jaspersoft TIBCO Software Business Intelligence - Open source business intelligence and analytics $185
04/28/14 metaquark GmbH Software AG Platforms, Development Tools & Deployment - Mobile software development, testing and deployment n/a
04/25/14 Boxwood Technology Naylor ERP & Business Applications - Career center recruiting and workforce management n/a
04/25/14 Scroll Kit Automattic Platforms, Development Tools & Deployment - Website development and content editor n/a
04/24/14 DecTech Solutions Pty Ltd GB Group PLC Financial Applications - Fraud detection, credit scoring and risk management $34
M&A Activity
Announced Software Acquisitions: 2Q 2014 continued
9
($ millions)
Sources: Company releases, Wall Street research

Copyright ©2014 Shea & Company, LLC
Announced Target Acquirer(s) Target Segment & Description Price
04/24/14 JasperLabs DataXu Advertising Technology - Online display and multimedia banner advertising deployment n/a
04/24/14 Tactads MediaMath Advertising Technology - Cookie-less ad targeting n/a
04/23/14 Algo Technologies Ltd IntercontinentalExchange Financial Applications - High-speed exchange trading n/a
04/23/14 Axiom EPM Kaufman Hall Financial Applications - Financial planning and enterprise performance management n/a
04/23/14 docTrackr IntraLinks IT Security - Document access management security and digital rights management $10
04/23/14 Korrelate J.D. Power & Associates Advertising Technology - Advertising correlation analysis for the automotive sector n/a
04/23/14 WorkForce Software Insight Venture Partners ERP & Business Applications - Workforce and employee management n/a
04/22/14 Coaxis Bain Capital ERP & Business Applications - Project management and ERP for the construction sector n/a
04/22/14 CORENA A/S Flatirons Solutions Platforms, Development Tools & Deployment - Software development lifecycle and technical document management n/a
04/22/14 Secure Document Technology FPX ERP & Business Applications - Sales contract lifecycle management and collaboration n/a
04/22/14 XTEL Group Kantar Media ERP & Business Applications - Sales planning, pricing and retail optimization n/a
04/21/14 Untangle Total Defense IT Security - Open source firewall and internet security management n/a
04/18/14 FixStream Network Tech Mahindra Ltd IT Operations Management - Datacenter and cloud environment analytics $10
04/17/14 Fliptop (data matching unit) Dun & Bradstreet Business Intelligence - Social data matching and predictive analytics n/a
04/16/14 BrightContext WealthEngine Business Intelligence - Data processing, analytics and visualization platform n/a
04/16/14 Hackpad Dropbox ERP & Business Applications - Team collaboration and document sharing n/a
04/16/14 Karmasphere (assets) Fair Isaac Business Intelligence - Customer analytics through big data n/a
04/16/14 Pitney Bowes Canada (Document Imaging) Konica Minolta Business Solutions Content Management - Document management and imaging n/a
04/15/14 E-Learning S.A. John Wiley & Sons ERP & Business Applications - Employee training $175
04/15/14 FeedMagnet Bazaarvoice ERP & Business Applications - Social media curation $9
04/15/14 WeVault Converged Technology Professionals Storage Management - Data backup and recovery n/a
04/14/14 CMSI Fidelity National Information Services Financial Applications - Loan automation and origination n/a
04/14/14 Frayman Group IntApp ERP & Business Applications - Business process and risk management for the legal sector n/a
04/14/14 Ipreo Blackstone, Goldman Sachs Financial Applications - Securities issuance and investor CRM n/a
04/10/14 Beijing Topwalk Beijing TRS Information Technology Storage Management - Secure data exchange and processing $97
04/10/14 RapidEngines SevOne IT Operations Management - Application performance and log data analytics n/a
04/10/14 Silverpop Systems IBM Marketing Applications - Email marketing automation and campaign creation n/a
04/10/14 Zopim Technologies Zendesk ERP & Business Applications - Customer service live chat $16
04/09/14 One-Page Company InterMet Resources Limited ERP & Business Applications - Employee recruitment management $10
04/08/14 Global DataGuard Masergy IT Security - Adaptive threat management and vulnerability analysis n/a
04/08/14 SE46 AB Technology Nexus AB IT Security - IT infrastructure and application security n/a
04/07/14 8thBridge Fluid Marketing Applications - Customer analytics and marketing automation n/a
04/07/14 ABILITY Network Summit Partners ERP & Business Applications - Data integration for the healthcare sector $550
04/07/14 ByteSphere (assets) EXFO IT Operations Management - IT management and network monitoring n/a
04/07/14 Cryptzone AB Medina Capital IT Security - File encryption, anti-data leakage and secure internal collaboration n/a
04/07/14 Metaforic INSIDE Secure IT Security - Application security and anti-malware protection $12
04/07/14 Network Automation HelpSystems IT Operations Management - IT business process automation for network administrators n/a
04/07/14 On-Demand WMS DiCentral ERP & Business Applications - Inventory and warehouse management n/a
04/04/14 GENIEgroup Ve Interactive Ltd Advertising Technology - Banner ad targeting and ad placement on websites n/a
04/03/14 Datamonk GmbH HitFox Group Advertising Technology - Mobile ad targeting and audience analytics n/a
04/03/14 Sociomantic Labs GmbH dunnhumby Ltd. Advertising Technology - Personalized customer ad retargeting n/a
04/02/14 Accuship Spire Capital Partners ERP & Business Applications - Shipping and transportation logistics n/a
04/02/14 eyeOS Telefonica Platforms, Development Tools & Deployment - Open source desktop virtualization n/a
04/02/14 Mass Relevance Spredfast Business Intelligence - Social media analytics and content distribution n/a
04/02/14 Profiles International John Wiley & Sons ERP & Business Applications - Talent management and pre-hire assessment $51
04/01/14 Broadbean Technology CareerBuilder.com ERP & Business Applications - Online job ad management n/a
04/01/14 ByAllAccounts Morningstar Financial Applications - Financial data integration and competitive analysis $28
04/01/14 Data Capture Solutions Ltd. Neopost Ltd. Content Management - Document and invoice management n/a
04/01/14 GlobalBridge FolioDynamix Financial Applications - Trade and portfolio management for banks n/a
04/01/14 Tracesmart Ltd. LexisNexis Risk Solutions IT Security - Online client tracing and identity verification n/a
M&A Activity
Announced Software Acquisitions: 2Q 2014 continued
10
($ millions)
Sources: Company releases, Wall Street research

Copyright ©2014 Shea & Company, LLC
M&A Activity
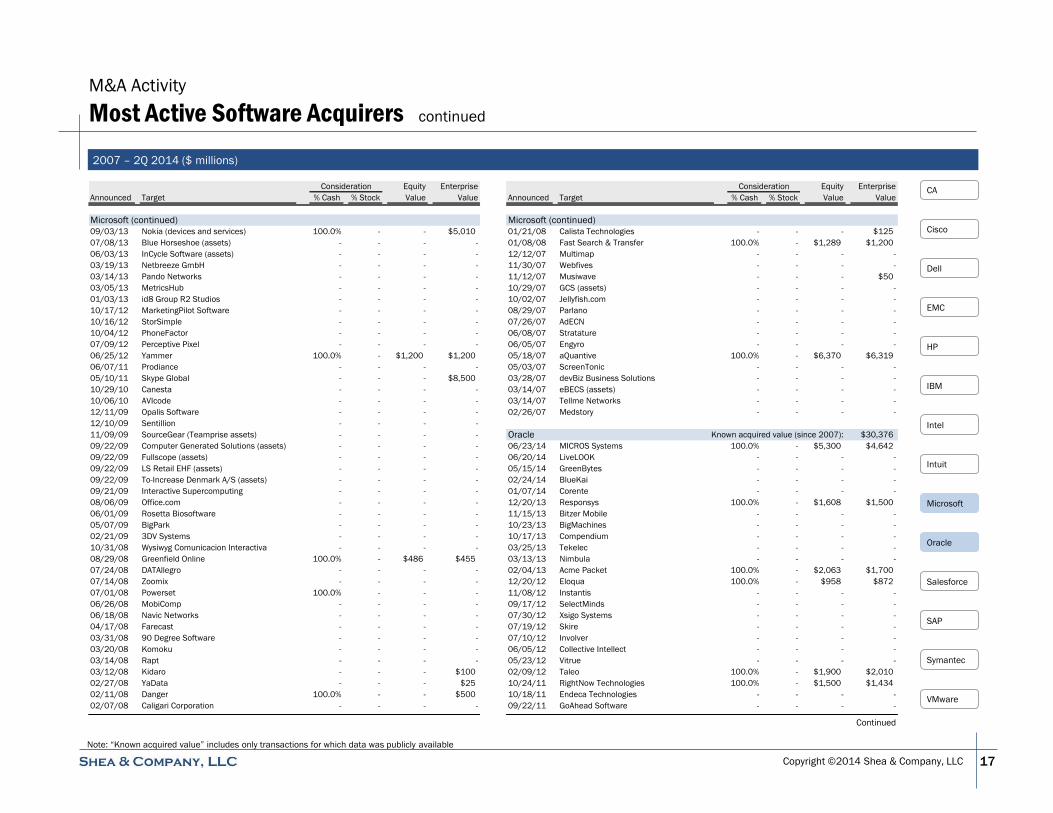
Most Active Software Acquirers: 2007 – 2Q 2014
11
$30.4
$13.1
$23.5
$11.1
$22.6
$4.8
$21.3
$4.0
$35.9
$4.1
$6.4
$4.5
$1.3 $1.5
77
74
66
60
57
35
33 33
30
27 26
21 20 20
0
10
20
30
40
50
60
70
80
$-
$5
$10
$15
$20
$25
$30
$35
$40
# o
f D
ea
ls
Aggre
ga
te D
ea
l V
alu
e (
$ b
illio
ns)
Announced Deal Value [a]
Number of Deals
[a] Includes only transactions for which data was publicly available

Copyright ©2014 Shea & Company, LLC
$0.8
$10.6
$1.3
$10.7
$6.2
$0.8
n/a
$5.6
$3.7
$3.3 $3.1
$0.1 $0.2 $0.2
23
21 21 21
18
13
12 12
11
10
8
5
3
2
0
5
10
15
20
25
$-
$2
$4
$6
$8
$10
$12
$14
# o
f D
ea
ls
Aggre
ga
te D
ea
l V
alu
e (
$ b
illio
ns)
Announced Deal Value [a]
Number of Deals
M&A Activity
Most Active Software Acquirers: 2012 – 2Q 2014
12
[a] Includes only transactions for which data was publicly available

Copyright ©2014 Shea & Company, LLC
Consideration Equity Enterprise
Announced Target % Cash % Stock Value Value
Cisco Systems (continued)
10/20/11 BNI Video - - - $99
08/29/11 Versly - - - -
03/29/11 newScale - - - -
02/04/11 Inlet Technologies 100.0% - - $95
01/26/11 Pari Networks - - - -
12/01/10 LineSider Technologies - - - -
09/02/10 Arch Rock Corporation - - - -
08/26/10 ExtendMedia - - - -
05/20/10 CoreOptics 100.0% - - $99
05/18/10 MOTO Development Group - - - -
01/05/10 Rohati Systems - - - -
11/02/09 DVN Holdings (set-top box business) - - - $45
10/27/09 ScanSafe 100.0% - - $183
10/13/09 Starent Networks 100.0% - $2,900 $2,510
10/01/09 Tandberg 100.0% - $3,400 $3,400
04/09/09 Tidal Software 100.0% - - $105
03/19/09 Pure Digital Technologies - - - $590
01/27/09 Richards-Zeta Building Intelligence - - - -
09/19/08 Jabber - - - -
08/27/08 PostPath - - - $215
07/23/08 Pure Networks 100.0% - - $120
06/10/08 DiviTech A/S - - - -
11/01/07 Securent - - - -
10/23/07 Navini Networks - - - $330
09/27/07 Latigent - - - -
09/18/07 Cognio - - - -
07/23/07 GlooLabs - - - -
05/21/07 BroadWare Technologies - - - -
03/28/07 SpansLogic - - - -
03/15/07 WebEx 100.0% - $3,200 $3,145
03/13/07 NeoPath Networks - - - $60
03/05/07 Utah Street Networks (assets) - - - -
02/26/07 Qovia - - - -
02/21/07 Reactivity 100.0% - - $135
02/09/07 Five Across - - - -
01/04/07 IronPort Systems - - - $830
Dell Known acquired value (since 2007): $6,373
03/24/14 StatSoft - - - -
05/06/13 Enstratius 100.0% - - -
12/18/12 Credant Technologies - - - -
11/16/12 Gale Technologies - - - -
10/23/12 Kitenga - - - -
Consideration Equity Enterprise
Announced Target % Cash % Stock Value Value
CA Technologies Known acquired value (since 2007): $1,314
04/22/13 Layer 7 Technologies 100.0% - - $155
03/24/13 Nolio 100.0% - - $42
09/10/12 Paragon Global Technology - - - -
07/29/11 Watchmouse BV - - - -
06/29/11 Interactive TKO 100.0% - - $330
05/16/11 SE-Consulting GmbH - - - -
04/06/11 Base Technologies - - - -
01/25/11 Torokina Networks - - - -
09/28/10 Hyperformix - - - -
08/30/10 Arcot Systems 100.0% - - $200
08/12/10 4Base Technology - - - -
03/10/10 Nimsoft 100.0% - - $350
02/24/10 3Tera - - - -
01/11/10 Oblicore 100.0% - - $20
09/14/09 NetQoS 100.0% - $200 $200
06/02/09 Cassatt - - - -
01/05/09 Orchestria - - - -
11/13/08 Eurekify - - - $17
10/15/08 Optinuity - - - -
10/07/08 IDFocus - - - -
Cisco Systems Known acquired value (since 2007): $22,604
06/27/14 Assemblage - - - -
06/17/14 Tail-f Systems - - - $175
05/21/14 ThreatGRID - - - -
12/17/13 Kibits - - - -
09/10/13 Whiptail Technologies 100.0% - - $415
07/23/13 Sourcefire 100.0% - $2,700 $2,494
06/20/13 Composite Software 100.0% - - $180
05/29/13 JouleX 100.0% - - $107
04/03/13 Ubiquisys - - - $310
03/25/13 SolveDirect Service Management - - $21 $21
01/29/13 Cognitive Security sro - - - -
01/23/13 Intucell 100.0% - $475 $475
12/18/12 BroadHop - - - -
11/29/12 Cariden Technologies 100.0% - $141 $141
11/18/12 Meraki 100.0% - $1,200 $1,200
11/15/12 Cloupia 100.0% - $125 $125
10/04/12 vCider - - - -
07/13/12 Virtuata - - - -
05/03/12 Truviso - - - -
03/28/12 ClearAccess - - - -
03/15/12 NDS Group Ltd. - - $3,896 $5,000
M&A Activity
Most Active Software Acquirers
13
Note: “Known acquired value” includes only transactions for which data was publicly available
2007 – 2Q 2014 ($ millions)
Cisco
Dell
Salesforce
HP
IBM
Intel
Intuit
Microsoft
Oracle
SAP
Symantec
VMware
CA
EMC
Continued

Copyright ©2014 Shea & Company, LLC
Consideration Equity Enterprise
Announced Target % Cash % Stock Value Value
EMC (continued)
05/27/09 Configuresoft - - - $87
01/02/09 SourceLabs - - - -
04/08/08 Iomega 100.0% - $213 $148
04/07/08 WysDM Software - - - -
04/01/08 Conchango plc 100.0% - - $84
03/10/08 Infra Corporation - - - -
02/21/08 Pi 100.0% - - -
12/27/07 Document Sciences 100.0% - $87 $85
10/30/07 Voyence - - - -
10/15/07 Illuminator - - - -
10/04/07 Berkeley Data Systems - - - -
08/30/07 BusinessEdge Solutions - - - -
08/09/07 Tablus - - - -
07/19/07 X-Hive Corporation - - - -
06/04/07 Verid - - - -
HP Known acquired value (since 2007): $35,915
03/04/14 Shunra Software (assets) - - - -
12/03/12 Digital Risk 100.0% - $175 $175
12/06/11 Hiflex Software GmbH - - - -
08/18/11 Autonomy 100.0% - $11,560 $10,889
05/24/11 Printelligent - - - -
02/14/11 Vertica - - - -
09/13/10 ArcSight 100.0% - $1,651 $1,500
08/26/10 Stratavia - - - -
08/23/10 3PAR 100.0% - $2,400 $2,296
08/17/10 Fortify Software - - - -
06/10/10 Phoenix Technologies (HyperSpace assets) 100.0% - - $12
04/28/10 Palm 100.0% - $1,400 $1,199
11/11/09 3Com 100.0% - $3,131 $2,705
07/17/09 IBRIX - - - -
06/22/09 Excellerate HRO - - - -
10/01/08 LeftHand Networks 100.0% - - $360
08/11/08 Colubris Networks - - - -
05/13/08 Electronic Data Systems - - - $13,900
03/31/08 Tower Software - - - $100
01/22/08 Exstream Software - - - $720
12/10/07 NUR Macroprinters 100.0% - - $118
11/12/07 EYP Mission Critical Facilities - - - -
10/22/07 AOME - - - -
09/13/07 MacDermid ColorSpan - - - -
07/23/07 Neoware 100.0% - $328 $206
07/23/07 Opsware 100.0% - $1,673 $1,600
Consideration Equity Enterprise
Announced Target % Cash % Stock Value Value
Dell (continued)
06/25/12 Quest Software 100.0% - $2,383 $2,408
04/05/12 MAKE Technologies - - - -
04/03/12 Clerity Solutions - - - -
04/02/12 Wyse Technology - - - -
03/13/12 SonicWALL - - - $1,250
02/24/12 AppAssure - - - -
06/20/11 RNA Networks - - - -
01/04/11 SecureWorks - - - -
12/22/10 InSite One - - - -
12/13/10 Compellent Technologies 100.0% - $960 $820
11/02/10 Boomi - - - -
07/19/10 Ocarina Networks - - - -
07/01/10 Scalent - - - -
02/11/10 Kace Networks 100.0% - - -
02/12/08 MessageOne 100.0% - - $155
02/08/08 Exanet - - - -
11/15/07 Everdream - - - -
11/05/07 EqualLogic 100.0% - $1,418 $1,400
08/06/07 Zing Systems - - - -
08/02/07 ASAP Software - - - $340
07/18/07 SilverBack Technologies - - - -
EMC Known acquired value (since 2007): $4,754
05/05/14 DSSD - - - -
07/25/13 PassBan - - - -
07/11/13 ScaleIO 100.0% - - -
07/08/13 Aveksa - - - -
05/21/13 Adaptivity (assets) - - - -
01/04/13 iWave Software - - - -
11/29/12 MoreVRP - - - -
10/30/12 Silver Tail Systems - - - -
05/31/12 Watch4Net Solutions - - - -
05/21/12 Syncplicity - - - -
05/10/12 XtremIO - - - -
03/20/12 Likewise Software - - - -
10/03/11 Zettapoint - - - -
04/04/11 NetWitness - - - -
11/15/10 Isilon 100.0% - $2,434 $2,250
07/06/10 Greenplum 100.0% - - -
01/04/10 Archer Technologies - - - -
09/01/09 Kazeon Systems - - - -
08/31/09 FastScale Technology - - - -
06/01/09 Data Domain 100.0% - $2,378 $2,100
M&A Activity
Most Active Software Acquirers continued
14
2007 – 2Q 2014 ($ millions)
EMC
Cisco
Salesforce
HP
Intel
Intuit
Microsoft
Oracle
SAP
Symantec
VMware
CA
Note: “Known acquired value” includes only transactions for which data was publicly available
Dell
IBM
Continued

Copyright ©2014 Shea & Company, LLC
Consideration Equity Enterprise
Announced Target % Cash % Stock Value Value
IBM (continued)
07/01/10 BigFix - - - -
06/15/10 Coremetrics - - - -
05/24/10 Sterling Commerce 100.0% - - $1,400
05/03/10 Cast Iron Systems 100.0% - - -
02/16/10 Intelliden - - - -
02/03/10 Initiate Systems - - - -
01/20/10 National Interest Security Company - - - -
12/16/09 Lombardi - - - -
11/30/09 Guardium - - - $225
10/05/09 Wilshire Credit Corporation - - - -
09/22/09 RedPill Solutions - - - -
07/28/09 Ounce Labs - - - -
07/25/09 SPSS 100.0% - $1,170 $859
05/04/09 Exeros 100.0% - - $12
01/15/09 Outblaze - - - $8
11/18/08 Transitive - - - -
07/28/08 ILOG SA 100.0% - - -
07/02/08 Platform Solutions - - - -
04/29/08 InfoDyne - - - -
04/18/08 Diligent Technologies - - - -
04/10/08 FilesX - - - $50
03/12/08 Encentuate - - - -
01/23/08 AptSoft - - - -
01/18/08 Net Integration Technologies - - - -
01/02/08 XIV - - - $325
12/21/07 Solid Information Technology - - - -
12/06/07 Arsenal Digital Solutions - - - -
11/12/07 Cognos 100.0% - $5,000 $4,960
10/24/07 NovusCG - - - -
08/22/07 WebDialogs - - - -
08/03/07 Princeton Softech - - - -
07/16/07 DataMirror 100.0% - $179 $161
06/11/07 Telelogic 100.0% - $745 $745
06/06/07 Watchfire - - - -
04/26/07 Serbian Business Systems (assets) - - - -
01/30/07 DM Information Systems - - - -
01/29/07 Softek - - - -
Intel Known acquired value (since 2007): $11,116
05/09/14 Ginger Software (assets) - - - -
04/01/14 INSIDE Secure (assets) 100.0% - - $19
03/04/14 BASIS Science - - - -
12/16/13 Mindspeed Technologies (assets) - - - -
Consideration Equity Enterprise
Announced Target % Cash % Stock Value Value
HP (continued)
06/19/07 SPI Dynamics - - - $135
03/22/07 Tabblo - - - -
02/26/07 PolyServe - - - -
02/05/07 Bristol Technology - - - -
IBM Known acquired value (since 2007): $13,139
05/20/14 Cognea - - - -
04/10/14 Silverpop Systems - - - -
02/24/14 Cloudant - - - -
12/19/13 Aspera - - - -
11/13/13 Fiberlink Communications 100.0% - - -
10/03/13 Xtify - - - -
10/01/13 The Now Factory - - - -
09/19/13 Daeja Image Systems Ltd. - - - -
08/15/13 Trusteer - - - -
07/09/13 CSL International - - - -
06/04/13 SoftLayer Technologies - - - -
04/22/13 UrbanCode - - - -
02/01/13 Star Analytics - - - -
12/19/12 StoredIQ - - - -
09/24/12 Butterfly Software Ltd. - - - -
08/27/12 Kenexa 100.0% - $1,307 $1,280
05/02/12 Tealeaf Technology - - - -
04/25/12 Vivisimo - - - -
04/13/12 Varicent Software - - - -
01/31/12 Worklight - - - -
01/04/12 Green Hat - - - -
12/15/11 Emptoris - - - -
12/08/11 DemandTec 100.0% - $504 $439
12/05/11 Curam Software Ltd. - - - -
10/11/11 Platform Computing - - - -
10/04/11 Q1 Labs - - - -
09/01/11 Algorithmics - - - $387
08/31/11 i2 - - - -
03/22/11 TRIRIGA 100.0% - - $108
10/21/10 Clarity Systems Ltd. - - - -
10/14/10 PSS Systems - - - -
09/27/10 BLADE Network Technologies - - - -
09/20/10 Netezza 100.0% - $1,836 $1,700
09/15/10 OpenPages - - - -
08/13/10 Unica 100.0% - $523 $480
08/10/10 Datacap - - - -
07/29/10 Storwize - - - -
M&A Activity
Most Active Software Acquirers continued
15
Continued
EMC
Cisco
Dell
Salesforce
IBM
Intel
Microsoft
Oracle
SAP
Symantec
VMware
CA
Intuit
2007 – 2Q 2014 ($ millions)
Note: “Known acquired value” includes only transactions for which data was publicly available
HP

Copyright ©2014 Shea & Company, LLC
Consideration Equity Enterprise
Announced Target % Cash % Stock Value Value
Intel (continued)
05/15/09 Solidcore Systems [a] 100.0% - $32 $41
05/12/09 Endeavor Security [a] 100.0% - $3 $3
02/16/09 Swiftfoot Graphics AB - - - -
10/15/08 NetEffect - - - $8
09/22/08 Secure Computing [a] 100.0% - $497 $465
08/29/08 OpenedHand - - - -
07/31/08 Reconnex [a] 100.0% - $40 $45
05/19/08 WebVMC - - - -
02/25/08 Offset Software - - - -
11/28/07 Neoptica - - - -
10/30/07 ScanAlert [a] 100.0% - $48 $54
10/08/07 SafeBoot [a] 100.0% - $339 $350
09/14/07 Havok 100.0% - - $110
Intuit Known acquired value (since 2007): $1,514
05/27/14 Check Inc - - - $360
05/14/14 Invitco - - - -
05/08/14 Lettuce - - - -
12/04/13 Docstoc - - - -
11/20/13 Prestwick Services - - - -
10/30/13 Full Slate - - - -
10/23/13 Level Up Analytics - - - -
08/08/13 GoodApril - - - -
07/18/13 Fifo Pty Ltd. - - - -
06/21/13 Elastic Intelligence - - - -
01/28/13 Payvment (assets) - - - -
04/23/12 Demandforce 100.0% - $424 $424
04/10/12 AisleBuyer - - - -
05/11/10 Medfusion 100.0% - - $91
09/14/09 Mint.com 100.0% - - $170
06/02/09 PayCycle 100.0% - - $170
04/17/09 BooRah - - - -
12/03/08 Entellium (CRM assets) 100.0% - - $8
12/19/07 Electronic Clearing House 100.0% - $131 $122
11/26/07 Homestead Technologies 100.0% - - $170
Microsoft Known acquired value (since 2007): $23,483
05/28/14 Capptain - - - -
05/01/14 GreenButton Limited - - - -
03/04/14 Junction Solutions (JunctionMCR) - - - -
01/27/14 Epic Games (assets) - - - -
01/07/14 Parature - - - -
10/23/13 Apiphany - - - -
Consideration Equity Enterprise
Announced Target % Cash % Stock Value Value
Intel (continued)
12/03/13 Hacker League LLC (assets) - - - -
11/08/13 Kno - - - -
09/30/13 Sensory Networks - - - -
09/13/13 Indisys - - - -
07/16/13 Omek Interactive - - - $50
05/29/13 ST-Ericsson (assets) - - - -
05/06/13 Stonesoft Oyj 100.0% - - $389
04/24/13 Aepona - - - -
04/17/13 Mashery - - - -
04/03/13 ProFUSION - - - -
02/26/13 LynuxWorks (ValidEdge technology) - - - -
02/22/13 appMobi (HTML5 developer tools division) - - - -
11/28/12 Rocketbox Studios GmbH - - - -
11/19/12 ZiiLABS 100.0% - $30 $30
08/24/12 NEVEX - - - -
07/13/12 Whamcloud - - - -
07/02/12 IDesia Ltd. - - - -
04/24/12 Cray (assets) - - $140 $140
01/23/12 Qlogic (InfiniBand assets) 100.0% - - $125
10/04/11 NitroSecurity - - - -
09/28/11 Telemap Ltd. - - - -
09/14/11 CoFluent Design - - - -
09/01/11 GraphTech - - - -
07/19/11 Fulcrum Microsystems - - - -
05/25/11 SiPort Corporation - - - -
03/23/11 Sentrigo - - - $35
03/14/11 SySDSoft - - - -
02/14/11 Silicon Hive BV - - - -
01/04/11 Nordic Edge AB - - - -
12/02/10 InternetSafety.com [a] 100.0% - $11 $10
11/17/10 CognoVision - - - $17
09/02/10 Neocleus - - - -
08/30/10 Infineon Technologies AG (assets) 100.0% - - $1,400
08/19/10 McAfee 100.0% - $7,680 $6,876
08/16/10 Texas Instruments (assets) - - - -
07/29/10 tenCube [a] 100.0% - $11 $10
05/25/10 Trust Digital [a] 100.0% - $33 $32
05/24/10 Comsys Communications - - - $30
02/05/10 Virtutech - - - -
08/19/09 RapidMind - - - -
07/31/09 Cilk Arts - - - -
07/30/09 MX Logic [a] 100.0% - $138 $163
06/04/09 Wind River Systems 100.0% - $884 $714
M&A Activity
Most Active Software Acquirers continued
16
Continued
EMC
Cisco
Dell
Salesforce
HP
IBM
Microsoft
Oracle
SAP
Symantec
VMware
CA
Intuit
Intel
[a] Acquired by McAfee prior to Intel acquisition
Note: “Known acquired value” includes only transactions for which data was publicly available
2007 – 2Q 2014 ($ millions)
Copyright ©2014 Shea & Company, LLC
Consideration Equity Enterprise
Announced Target % Cash % Stock Value Value
Microsoft (continued)
01/21/08 Calista Technologies - - - $125
01/08/08 Fast Search & Transfer 100.0% - $1,289 $1,200
12/12/07 Multimap - - - -
11/30/07 Webfives - - - -
11/12/07 Musiwave - - - $50
10/29/07 GCS (assets) - - - -
10/02/07 Jellyfish.com - - - -
08/29/07 Parlano - - - -
07/26/07 AdECN - - - -
06/08/07 Stratature - - - -
06/05/07 Engyro - - - -
05/18/07 aQuantive 100.0% - $6,370 $6,319
05/03/07 ScreenTonic - - - -
03/28/07 devBiz Business Solutions - - - -
03/14/07 eBECS (assets) - - - -
03/14/07 Tellme Networks - - - -
02/26/07 Medstory - - - -
Oracle Known acquired value (since 2007): $30,376
06/23/14 MICROS Systems 100.0% - $5,300 $4,642
06/20/14 LiveLOOK - - - -
05/15/14 GreenBytes - - - -
02/24/14 BlueKai - - - -
01/07/14 Corente - - - -
12/20/13 Responsys 100.0% - $1,608 $1,500
11/15/13 Bitzer Mobile - - - -
10/23/13 BigMachines - - - -
10/17/13 Compendium - - - -
03/25/13 Tekelec - - - -
03/13/13 Nimbula - - - -
02/04/13 Acme Packet 100.0% - $2,063 $1,700
12/20/12 Eloqua 100.0% - $958 $872
11/08/12 Instantis - - - -
09/17/12 SelectMinds - - - -
07/30/12 Xsigo Systems - - - -
07/19/12 Skire - - - -
07/10/12 Involver - - - -
06/05/12 Collective Intellect - - - -
05/23/12 Vitrue - - - -
02/09/12 Taleo 100.0% - $1,900 $2,010
10/24/11 RightNow Technologies 100.0% - $1,500 $1,434
10/18/11 Endeca Technologies - - - -
09/22/11 GoAhead Software - - - -
Consideration Equity Enterprise
Announced Target % Cash % Stock Value Value
Microsoft (continued)
09/03/13 Nokia (devices and services) 100.0% - - $5,010
07/08/13 Blue Horseshoe (assets) - - - -
06/03/13 InCycle Software (assets) - - - -
03/19/13 Netbreeze GmbH - - - -
03/14/13 Pando Networks - - - -
03/05/13 MetricsHub - - - -
01/03/13 id8 Group R2 Studios - - - -
10/17/12 MarketingPilot Software - - - -
10/16/12 StorSimple - - - -
10/04/12 PhoneFactor - - - -
07/09/12 Perceptive Pixel - - - -
06/25/12 Yammer 100.0% - $1,200 $1,200
06/07/11 Prodiance - - - -
05/10/11 Skype Global - - - $8,500
10/29/10 Canesta - - - -
10/06/10 AVIcode - - - -
12/11/09 Opalis Software - - - -
12/10/09 Sentillion - - - -
11/09/09 SourceGear (Teamprise assets) - - - -
09/22/09 Computer Generated Solutions (assets) - - - -
09/22/09 Fullscope (assets) - - - -
09/22/09 LS Retail EHF (assets) - - - -
09/22/09 To-Increase Denmark A/S (assets) - - - -
09/21/09 Interactive Supercomputing - - - -
08/06/09 Office.com - - - -
06/01/09 Rosetta Biosoftware - - - -
05/07/09 BigPark - - - -
02/21/09 3DV Systems - - - -
10/31/08 Wysiwyg Comunicacion Interactiva - - - -
08/29/08 Greenfield Online 100.0% - $486 $455
07/24/08 DATAllegro - - - -
07/14/08 Zoomix - - - -
07/01/08 Powerset 100.0% - - -
06/26/08 MobiComp - - - -
06/18/08 Navic Networks - - - -
04/17/08 Farecast - - - -
03/31/08 90 Degree Software - - - -
03/20/08 Komoku - - - -
03/14/08 Rapt - - - -
03/12/08 Kidaro - - - $100
02/27/08 YaData - - - $25
02/11/08 Danger 100.0% - - $500
02/07/08 Caligari Corporation - - - -
M&A Activity
Most Active Software Acquirers continued
17
Note: “Known acquired value” includes only transactions for which data was publicly available
EMC
Cisco
Dell
HP
IBM
Intel
Intuit
Microsoft
Oracle
VMware
CA
Symantec
2007 – 2Q 2014 ($ millions)
Continued
Salesforce
SAP

Copyright ©2014 Shea & Company, LLC
Consideration Equity Enterprise
Announced Target % Cash % Stock Value Value
Oracle (continued)
09/02/07 Netsure Telecom - - - -
08/31/07 Bridgestream - - - -
07/18/07 Bharosa - - - -
05/15/07 Agile Software 100.0% - $495 $301
05/01/07 Revenue Technologies - - - -
04/24/07 Lodestar - - - -
04/18/07 AppForge - - - -
04/12/07 SavaJe Technologies [a] - - - -
03/23/07 Tangosol - - - -
03/01/07 Hyperion 100.0% - $3,192 $2,706
Salesforce.com Known acquired value (since 2007): $4,118
11/18/13 Cloudconnect.com - - - -
06/07/13 EdgeSpring 47.0% 53.0% - $134
06/04/13 ExactTarget 100.0% - $2,500 $2,399
02/06/13 EntropySoft - - - -
09/11/12 BlueTail - - - -
07/09/12 GoInstant 100.0% - - $51
06/25/12 Thinkfuse - - - -
06/18/12 ChoicePass - - - -
06/04/12 Buddy Media - - - $689
05/01/12 Stypi - - - -
12/15/11 Rypple - - - -
11/14/11 Model Metrics 100.0% - - $58
09/21/11 Assistly 100.0% - - $50
08/26/11 Navajo Systems - - - -
03/30/11 Radian6 84.7% 15.3% - $326
02/01/11 Manymoon - - - -
01/06/11 Dimdim 100.0% - - $31
12/21/10 Etacts - - - -
12/08/10 Heroku 100.0% - - $212
09/24/10 Activa Live - - - -
06/04/10 Sitemasher - - - -
04/21/10 Jigsaw Data Corporation 100.0% - - $142
01/21/10 Informavores - - - -
12/11/09 GroupSwim - - - -
08/04/08 InStranet - - $32 $27
10/23/07 CrispyNews - - - -
04/10/07 Koral - - - -
Consideration Equity Enterprise
Announced Target % Cash % Stock Value Value
Oracle (continued)
07/28/11 InQuira - - - -
07/21/11 Ksplice - - - -
06/30/11 Pillar Data Systems - - - -
06/21/11 FatWire Software - - - -
06/20/11 Datanomic - - - -
11/02/10 Art Technology Group 100.0% - $1,000 $848
10/05/10 Passlogix - - - -
05/26/10 eServGlobal (pre-paid software assets) - - - -
05/25/10 Market2Lead (assets) - - - -
05/20/10 Secerno - - - -
04/16/10 Phase Forward 100.0% - $755 $714
02/10/10 Convergin - - - -
02/08/10 AmberPoint - - - -
01/04/10 Silver Creek Systems - - - -
10/12/09 Sophoi - - - -
09/29/09 HyperRoll - - - -
07/23/09 GoldenGate Software - - - -
06/17/09 Conformia - - - -
05/13/09 Virtual Iron - - - -
04/20/09 Sun Microsystems 100.0% - $7,400 $5,667
03/23/09 Relsys International - - - -
02/04/09 mValent - - - -
01/07/09 Q-layers [a] - - - -
11/03/08 Tacit Software - - - -
10/29/08 Haley Ltd. - - - $100
10/08/08 Primavera Systems - - - -
10/01/08 Advanced Visual Technology - - - $5
09/02/08 ClearApp - - - -
07/31/08 Global Knowledge Software - - - -
06/23/08 Skywire Software - - - -
05/13/08 AdminServer - - - -
04/25/08 Montalvo Systems [a] - - - $25
04/09/08 Auptyma - - - -
03/27/08 Empirix (e-TEST software) - - - -
02/12/08 innotek [a] - - - -
01/16/08 BEA Systems 100.0% - $8,352 $6,852
01/16/08 Captovation - - - -
01/16/08 MySQL [a] - - - $1,000
12/06/07 Moniforce - - - -
11/13/07 Vaau [a] - - - -
10/24/07 Interlace Systems - - - -
10/09/07 LogicalApps - - - -
09/12/07 Cluster File Systems [a] - - - -
M&A Activity
Most Active Software Acquirers continued
18
EMC
Cisco
Dell
HP
IBM
Intel
Intuit
Microsoft
CA
2007 – 2Q 2014 ($ millions)
Salesforce
Oracle
VMware
[a] Acquired by Sun Microsystems prior to Oracle acquisition
Note: “Known acquired value” includes only transactions for which data was publicly available
Symantec
SAP

Copyright ©2014 Shea & Company, LLC
Consideration Equity Enterprise
Announced Target % Cash % Stock Value Value
Symantec (continued)
04/29/10 PGP Corporation 100.0% - - $300
01/12/10 Gideon Technology - - - -
11/01/09 SoftScan - - - -
04/21/09 Mi5 Networks - - - $18
10/08/08 MessageLabs 100.0% - - $695
08/18/08 PC Tools 100.0% - - $250
08/05/08 nSuite Technologies 100.0% - - $20
06/06/08 SwapDrive 100.0% - - $123
04/09/08 AppStream 100.0% - - $52
01/02/08 Transparent Logic 100.0% - - $12
11/05/07 Vontu 100.0% - - $350
02/23/07 4FrontSecurity 100.0% - - $7
01/29/07 Altiris 100.0% - $1,030 $830
Consideration Equity Enterprise
Announced Target % Cash % Stock Value Value
SAP Known acquired value (since 2007): $21,286
05/20/14 SeeWhy - - - -
03/26/14 Fieldglass - - - -
09/10/13 KXEN - - - -
06/05/13 hybris GmbH 100.0% - - $1,341
05/16/13 KMS Software - - - -
03/07/13 Camilion Solutions - - - -
02/22/13 SmartOps - - - -
01/31/13 Ticket-Web GmbH - - - -
05/22/12 Ariba 100.0% - $4,500 $4,267
04/30/12 Purisma 100.0% - $2 $2
04/10/12 Syclo - - - -
01/16/12 Datango AG (assets) - - - -
12/03/11 SuccessFactors 100.0% - $3,650 $3,400
09/20/11 Crossgate AG - - - -
09/06/11 Right Hemisphere - - - -
01/12/11 SECUDE AG (IdM assets) - - - -
12/16/10 cundus AG (disclosure management assets) - - - -
05/12/10 Sybase 100.0% - $6,100 $5,800
04/21/10 TechniData AG - - - -
12/03/09 SOALogix - - - -
07/20/09 SAF Simulation, Analysis & Forecasting 100.0% - - -
06/10/09 SkyData Systems - - - -
05/11/09 Clear Standards - - - -
05/06/09 Highdeal - - - -
02/18/09 Coghead - - - -
07/10/08 Ness Technologies (SAP distribution division) - - - $21
06/17/08 Visiprise - - - -
10/17/07 YASU Technologies - - - -
10/07/07 Business Objects 100.0% - $6,770 $6,455
05/14/07 MaXware - - - -
05/14/07 Wicom Communications - - - -
05/08/07 OutlookSoft - - - -
02/20/07 Pilot Software - - - -
Symantec Known acquired value (since 2007): $4,543
05/28/14 Nitrodesk - - - -
07/18/13 PasswordBank - - - -
03/20/12 Nukona 100.0% - - $28
03/05/12 Odyssey Software - - - -
01/16/12 LiveOffice - - - $115
05/19/11 Clearwell Systems - - $410 $390
05/19/10 VeriSign (identity & authentication assets) 100.0% - - $1,280
04/29/10 GuardianEdge 100.0% - - $73
M&A Activity
Most Active Software Acquirers continued
19
EMC
Cisco
Dell
HP
IBM
Intel
Intuit
Microsoft
CA
Oracle
Note: “Known acquired value” includes only transactions for which data was publicly available
2007 – 2Q 2014 ($ millions)
Salesforce
Symantec
SAP
VMware

Copyright ©2014 Shea & Company, LLC
Consideration Equity Enterprise
Announced Target % Cash % Stock Value Value
VMware Known acquired value (since 2007): $4,009
03/06/14 Third Sky - - - -
01/22/14 AirWatch 76.0% 24.0% - $1,540
10/15/13 Desktone - - - -
02/11/13 Virsto Software 100.0% - - $185
08/07/12 Pattern Insight (assets) - - - -
07/23/12 Nicira 83.3% 16.7% - $1,260
05/22/12 Wanova - - - $75
04/24/12 Cetas Software - - - -
08/26/11 PacketMotion - - - -
06/13/11 Digital Fuel Technologies - - - -
05/31/11 Socialcast - - - -
05/16/11 Shavlik Technologies - - - -
04/26/11 SlideRocket - - - -
03/08/11 WaveMaker - - - -
01/14/11 NeoAccel 100.0% - - $15
08/31/10 Integrien - - - $100
08/31/10 TriCipher - - - -
05/06/10 GemStone Systems - - - -
04/13/10 Rabbit Technologies 100.0% - - -
02/25/10 EMC (Ionix software assets) 100.0% - - $200
02/23/10 RTO Software - - - -
01/12/10 Zimbra 100.0% - - $100
08/10/09 SpringSource 86.2% 13.8% $362 $420
11/26/08 Tungsten Graphics - - - -
11/10/08 Trango Virtual Processors - - - -
10/09/08 Blue Lane Technologies - - - -
05/28/08 B-hive Networks - - - $61
01/15/08 Thinstall - - - -
01/14/08 Foedus - - - -
10/01/07 Sciant - - - $9
09/11/07 Dunes Technologies 100.0% - - $45
M&A Activity
Most Active Software Acquirers continued
20
EMC
Cisco
Dell
HP
IBM
Intel
Intuit
Microsoft
CA
Oracle
VMware
Note: “Known acquired value” includes only transactions for which data was publicly available
2007 – 2Q 2014 ($ millions)
Salesforce
Symantec
SAP

Copyright ©2014 Shea & Company, LLC 21
Public Equity Market Valuations Relative Performance by Index
Median EV / Revenue Median EV / EBITDA Median % of 52 Week High
Sources: Company releases, Wall Street research
Small Cap Software includes: ATTU, BIRT, COVS, CYNI, DWCH, EXA, FALC, NTWK, OM:RSOF B, TISA, TSX:NXJ, WSE:CMR, YUME
Large Cap Software includes: CSCO, EMC, HPQ, IBM, INTC, MSFT, ORCL, SAP
High Growth Software includes: ATTU, BNFT, CSOD, CVT, DATA, FEYE, FIVN, FUEL, GIMO, MKTO, N, NOW, NTWK, PANW, PAYC, RUBI, SPLK, VRNS, WDAY, ZEN
High Profitability Software includes: AKAM, ANSS, AVG, AZPN, CA, CHKP, EBIX, FFIV, INTC, INTU, MCRO, MSCI, ORCL, PRGS, SSNC, SWI, VMW, VRSK, VRSN
12%
-20%
39%
28%
-40%
-20%
0%
20%
40%
60%
80%
100%
120%
140%
160%
Jun-13 Sep-13 Dec-13 Mar-14 Jun-14
1 Year Relative Performance NASDAQ
Large Cap Software
Small Cap Software
High Growth Software
High Profitability Software
-50%
0%
50%
100%
150%
200%
250%
300%
350%
400%
Jun-11 Jun-12 Jun-13 Jun-14
3 Year Relative Performance
2.5x
8.8x
5.4x
1.6x
2.4x
6.6x
5.3x
1.4x
0x
1x
2x
3x
4x
5x
6x
7x
8x
9x
10x
Large Cap
Software
High Growth
Software
High Profitability
Software
Small Cap
Software
CY14E
CY15E
94%
65%
94%
80%
0%
25%
50%
75%
100%
Large Cap
Software
High Growth
Software
High
Profitability
Software
Small Cap
Software
7.6x
20.0x
11.8x
21.7x
7.2x
26.5x
10.7x 9.7x
0x
5x
10x
15x
20x
25x
30x
Large Cap
Software
High Growth
Software
High Profitability
Software
Small Cap
Software

Copyright ©2014 Shea & Company, LLC
9.2x
5.3x 5.5x 5.0x
5.4x
4.5x 4.0x 3.9x
3.2x 3.0x
2.6x 2.5x 2.4x 2.1x 2.1x 2.0x
8.8x
6.0x 5.4x
1.6x
7.0x
4.8x 4.7x 4.1x 4.2x 4.2x
3.7x 3.4x 2.8x 2.7x
2.5x 2.4x 1.8x 2.0x 1.8x 1.8x
6.6x
4.5x
5.3x
1.4x
0x
2x
4x
6x
8x
10x
12x
14x
16x CY14E CY15E
Median CY14E Median CY15E
38.0x
17.3x
11.1x
38.0x
13.7x 13.6x 12.8x
18.0x
nm
10.7x
11.4x
7.6x
20.3x
14.7x
12.3x
9.2x
20.0x
32.7x
11.8x
21.7x
25.7x
15.1x
10.0x
27.9x
11.3x 12.2x 11.0x
17.3x
nm
9.5x 9.9x
7.2x
17.6x
11.6x 10.0x
7.5x
26.5x
23.8x
10.7x 9.7x
0x
5x
10x
15x
20x
25x
30x
35x
40x
45x
76%
89%
83%
65%
84%
90% 95%
78% 75%
92%
82%
94%
55%
87%
73%
79%
65%
72%
94%
80%
0%
25%
50%
75%
100%
HCM Supply
Chain
Mgmt
IT
Security
Business
Intelligence
IT
Ops.
Mgmt
Financial
Apps
Tech.
&
Embedded
Apps
ERP &
General
Business
Apps
Marketing
Apps
App
Delivery &
Network
Acceleration
Platforms,
Dev
Tools
&
Deployment
Global
Diversified
Ad
Tech
Content
Mgmt
Storage
Mgmt
Network
Infra.
High
Growth
SaaS High
Profitability
Small Cap
Public Equity Market Valuations
Price Performance and Valuation Metrics by Segment
22
Me
dia
n E
V /
Re
ve
nu
e
Me
dia
n E
V /
EB
ITD
A
Me
dia
n %
of
52
We
ek
Hig
h
Note: EV / EBITDA multiples in excess of 50x or less than 0x are considered to be not meaningful
Sources: Company releases, Wall Street research
Copyright ©2014 Shea & Company, LLC
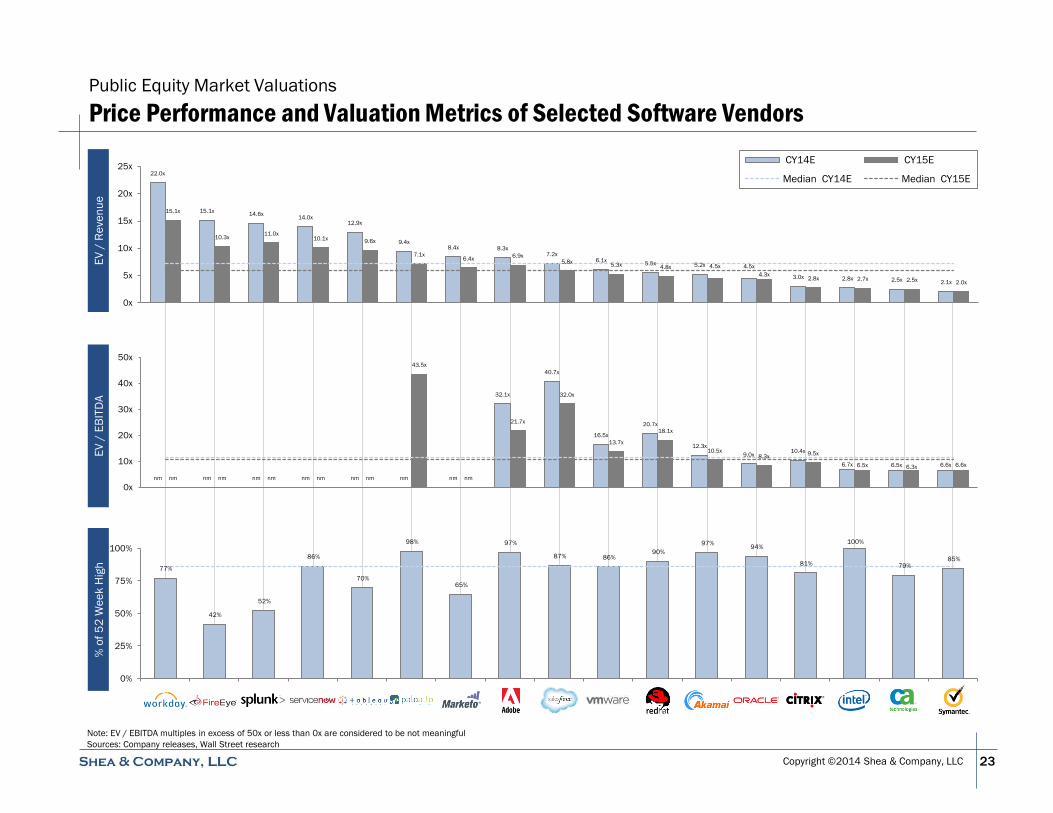
Public Equity Market Valuations
Price Performance and Valuation Metrics of Selected Software Vendors E
V /
Re
ve
nu
e
EV
/ E
BIT
DA
%
of
52
We
ek
Hig
h
23
77%
42%
52%
86%
70%
98%
65%
97%
87% 86% 90%
97% 94%
81%
100%
79% 85%
0%
25%
50%
75%
100%
WDAY FEYE SPLK NOW DATA PANW MKTO ADBE CRM VMW RHT AKAM ORCL CTXS intc CA SYMC
22.0x
15.1x 14.6x
14.0x 12.9x
9.4x 8.4x 8.3x
7.2x 6.1x
5.5x 5.2x 4.5x
3.0x 2.8x 2.5x 2.1x
15.1x
10.3x 11.0x
10.1x 9.6x
7.1x 6.4x
6.9x 5.8x
5.3x 4.8x 4.5x
4.3x 2.8x 2.7x 2.5x 2.0x
0x
5x
10x
15x
20x
25x CY14E CY15E
Median CY14E Median CY15E
nm nm nm nm nm nm nm
32.1x
40.7x
16.5x
20.7x
12.3x
9.0x 10.4x
6.7x 6.5x 6.6x
nm nm nm nm nm
43.5x
nm
21.7x
32.0x
13.7x
18.1x
10.5x 8.3x
9.5x
6.5x 6.3x 6.6x
0x
10x
20x
30x
40x
50x
Note: EV / EBITDA multiples in excess of 50x or less than 0x are considered to be not meaningful
Sources: Company releases, Wall Street research

Copyright ©2014 Shea & Company, LLC
0x
2x
4x
6x
8x
10x
12x
Q2Q1Q4Q3Q2Q1Q4Q3Q2Q1Q4Q3Q2Q1
2014201320122011
> 25% growth
15% - 25% growth
5% - 15% growth
< 5% growth
Public Equity Market Valuations
Equity Trading Multiples by Growth Tranche
24
Market Valuations of Publicly-Traded Software Companies by Growth Tranche Forward Year Median EV / Revenue by Growth Tranche
Forward Year Median EV / EBITDA by Growth Tranche
0x
5x
10x
15x
20x
25x
30x
35x
40x
45x
Q2Q1Q4Q3Q2Q1Q4Q3Q2Q1Q4Q3Q2Q1
2014201320122011
> 25% growth
15% - 25% growth
5% - 15% growth
< 5% growth
Note: EV / EBITDA multiples in excess of 50x or less than 0x are considered to be not meaningful
Sources: Company releases, Wall Street research
EV / Revenue EV / EBITDA
Revenue Current Year Forward Year Current Year Forward Year
Growth Date Mean Median Mean Median Mean Median Mean Median
< 5% Q2 2014 2.3 x 2.2 x 2.3 x 2.2 x 8.7 x 8.2 x 7.4 x 7.1 x
Q1 2014 2.3 2.4 2.3 2.4 8.3 8.0 7.8 7.7
Q4 2013 2.7 2.3 2.6 2.4 10.7 9.0 9.6 8.5
Q3 2013 2.3 2.2 2.2 2.1 8.8 8.1 8.3 7.7
Q2 2013 2.3 2.3 2.2 2.2 7.8 8.2 7.2 7.3
Q1 2013 2.2 2.3 2.2 2.2 7.7 8.1 7.3 7.7
Q4 2012 2.0 2.0 1.9 2.0 7.2 7.3 6.9 7.5
Q3 2012 1.9 1.9 1.8 1.9 6.6 6.6 6.3 6.1
Q2 2012 1.8 1.9 1.7 1.8 7.0 6.9 6.1 5.9
Q1 2012 2.3 2.2 2.2 2.1 8.4 8.4 7.3 8.1
Q4 2011 2.1 2.0 2.0 1.9 7.1 6.9 6.9 7.0
Q3 2011 1.8 1.9 1.7 1.8 6.6 6.9 6.5 6.8
5% - 15% Q2 2014 3.5 x 3.1 x 3.2 x 2.9 x 15.4 x 12.8 x 13.5 x 11.7 x
Q1 2014 3.5 3.1 3.3 2.9 12.8 11.5 12.1 11.0
Q4 2013 3.9 3.5 3.5 3.2 15.5 13.1 14.3 12.4
Q3 2013 3.5 3.1 3.2 2.8 13.9 13.0 12.1 11.3
Q2 2013 3.0 2.6 2.7 2.4 12.2 10.0 9.8 9.1
Q1 2013 3.1 2.6 2.8 2.4 11.5 10.8 9.8 9.6
Q4 2012 3.3 2.9 3.0 2.6 12.2 10.4 10.5 9.6
Q3 2012 3.0 2.7 2.7 2.4 10.8 10.1 9.4 8.7
Q2 2012 2.9 2.4 2.6 2.3 9.8 8.9 8.6 7.9
Q1 2012 3.2 2.7 3.0 2.4 11.6 10.4 10.1 9.2
Q4 2011 2.7 2.4 2.5 2.2 11.3 9.9 8.8 7.9
Q3 2011 2.4 2.0 2.1 1.9 9.0 7.9 7.4 6.8
15% - 25% Q2 2014 4.9 x 4.8 x 4.0 x 3.9 x 25.5 x 22.7 x 20.2 x 18.4 x
Q1 2014 5.3 4.8 4.4 4.0 26.1 26.8 22.5 19.3
Q4 2013 5.8 5.2 4.8 4.3 26.6 8.1 23.5 20.4
Q3 2013 5.9 5.9 4.9 4.9 26.3 21.8 24.8 25.6
Q2 2013 4.9 4.9 4.1 4.1 23.3 23.2 21.8 20.5
Q1 2013 4.6 4.3 3.8 3.6 23.5 20.7 19.6 18.9
Q4 2012 4.8 4.1 4.0 3.4 23.8 19.7 21.7 15.8
Q3 2012 5.2 4.6 4.3 3.9 39.3 22.2 34.0 18.5
Q2 2012 5.0 4.6 4.1 3.8 41.7 22.9 24.4 16.6
Q1 2012 5.6 5.5 4.6 4.5 32.5 23.3 22.7 19.0
Q4 2011 4.6 4.6 3.8 4.0 23.9 21.3 17.3 14.3
Q3 2011 4.3 4.2 3.6 3.6 21.8 19.5 15.5 14.0
> 25% Q2 2014 8.4 x 8.4 x 6.2 x 6.4 x 25.9 x 26.4 x 25.1 x 26.3 x
Q1 2014 10.0 9.3 7.4 7.1 15.3 15.3 21.8 17.3
Q4 2013 12.7 8.9 9.1 6.6 25.6 0.0 25.3 24.1
Q3 2013 11.6 8.3 8.5 6.4 30.4 28.5 30.6 36.8
Q2 2013 10.4 9.0 7.6 7.0 26.9 26.9 22.6 24.9
Q1 2013 9.1 9.6 6.7 6.5 45.7 45.7 23.6 23.6
Q4 2012 8.3 7.9 6.1 6.1 35.2 32.9 36.6 28.8
Q3 2012 9.4 7.8 6.8 5.7 55.8 36.6 nm 28.7
Q2 2012 7.9 8.3 5.9 6.2 32.4 33.6 nm 25.6
Q1 2012 7.2 5.9 5.1 4.2 26.2 11.9 nm 21.7
Q4 2011 7.8 7.5 5.8 5.9 76.5 34.5 48.1 24.6
Q3 2011 5.2 5.6 3.8 4.3 79.6 43.4 46.3 25.2

Copyright ©2014 Shea & Company, LLC
Share Price Market Enterprise Revenue [a] EV / Revenue EBITDA [a] EV / EBITDA [b] P / E Multiple [b]
Company (06/30/14) Value Value CY14E CY15E y/y CY14E CY15E CY14E mgn CY15E mgn CY14E CY15E CY14E CY15E
Global Diversified
Microsoft 41.70$ 346,125$ 279,129$ 95,522$ 104,405$ 9% 2.9 x 2.7 x 32,646$ 34% 34,519$ 33% 8.6 x 8.1 x 15.5 x 15.3 x
Oracle 40.53 187,446 174,942 39,122 41,075 5% 4.5 4.3 19,451 50% 21,034 51% 9.0 8.3 14.6 13.6
IBM 181.27 183,952 218,361 97,412 98,464 1% 2.2 2.2 26,744 27% 28,366 29% 8.2 7.7 10.8 10.1
Intel 30.90 155,008 150,355 54,628 55,917 2% 2.8 2.7 22,433 41% 23,162 41% 6.7 6.5 16.3 15.3
Cisco Systems 24.85 127,741 98,173 47,793 49,971 5% 2.1 2.0 16,489 35% 16,926 34% 6.0 5.8 12.3 11.9
SAP AG 77.58 92,629 92,229 23,915 25,522 7% 3.9 3.6 8,360 35% 9,081 36% 11.0 10.2 17.1 16.6
Hewlett Packard 33.68 63,226 71,113 110,320 110,294 0% 0.6 0.6 13,364 12% 14,139 13% 5.3 5.0 9.4 9.0
EMC 26.34 54,653 53,435 24,572 26,237 7% 2.2 2.0 7,586 31% 7,968 30% 7.0 6.7 14.7 13.8
Mean 61,660$ 63,986$ 4% 2.6 x 2.5 x 18,384$ 33% 19,399$ 33% 7.7 x 7.3 x 13.8 x 13.2 x
Median 51,210 52,944 5% 2.5 2.4 17,970 34% 18,980 33% 7.6 7.2 14.6 13.7
Advertising Technology
Criteo 33.77$ 1,920$ 1,605$ 670$ 909$ 36% 2.4 x 1.8 x 49$ 7% 90$ 10% 32.7 x 17.8 x nm x 79.0 x
Conversant 25.40 1,702 1,671 617 668 8% 2.7 2.5 212 34% 236 35% 7.9 7.1 16.9 14.6
Rocket Fuel 31.09 1,177 995 422 663 57% 2.4 1.5 4 1% 37 6% nm 26.8 nm nm
Millenial Media 4.99 534 436 329 387 18% 1.3 1.1 (10) nm 25 6% nm 17.3 nm nm
The Rubicon Project 12.84 486 465 113 149 32% 4.1 3.1 (5) nm 6 4% nm nm nm nm
Mean 430$ 555$ 30% 2.6 x 2.0 x 50$ 14% 79$ 12% 20.3 x 17.2 x 16.9 x 46.8 x
Median 422 663 32% 2.4 1.8 4 7% 37 6% 20.3 17.6 nm 46.8
Application Delivery & Network Acceleration
Akamai Technologies 61.06$ 10,973$ 10,144$ 1,934$ 2,254$ 17% 5.2 x 4.5 x 825$ 43% 968$ 43% 12.3 x 10.5 x 30.7 x 26.6 x
Citrix Systems 62.55 10,253 9,675 3,190 3,490 9% 3.0 2.8 932 29% 1,021 29% 10.4 9.5 21.2 20.2
F5 Networks 111.44 8,453 7,288 1,770 1,993 13% 4.1 3.7 679 38% 778 39% 10.7 9.4 24.0 20.1
Riverbed Technology 20.63 3,352 3,314 1,147 1,241 8% 2.9 2.7 387 34% 396 32% 8.6 8.4 20.5 17.6
Radware 16.87 787 606 215 236 10% 2.8 2.6 39 18% 52 22% 15.6 11.7 24.6 22.0
Limelight Networks 3.06 304 192 156 154 -1% 1.2 1.2 (2) nm (1) nm nm nm nm nm
Mean 1,402$ 1,561$ 9% 3.2 x 2.9 x 476$ 32% 536$ 33% 11.5 x 9.9 x 24.2 x 21.3 x
Median 1,459 1,617 9% 3.0 2.7 533 34% 587 32% 10.7 9.5 24.0 20.2
Business Intelligence
Tableau Software 71.33$ 5,174$ 4,557$ 352$ 474$ 35% 12.9 x 9.6 x 10$ 3% 21$ 4% nm x nm x nm x nm x
Qlik Technologies 22.62 2,053 1,800 548 638 17% 3.3 2.8 42 8% 59 9% 42.5 30.6 89.3 91.6
MicroStrategy 140.62 1,589 1,223 612 654 7% 2.0 1.9 37 6% 49 7% 33.4 25.2 68.0 nm
Varonis Systems 29.01 780 655 98 123 26% 6.7 5.3 (14) nm (12) nm nm nm nm nm
Mean 402$ 473$ 21% 6.2 x 4.9 x 19$ 6% 29$ 7% 38.0 x 27.9 x 78.6 x 91.6 x
Median 450 556 21% 5.0 4.1 23 6% 35 7% 38.0 27.9 78.6 nm
Content Management
Supply Chain
Management
Public Equity Market Valuations
Equity Trading Multiples by Segment
25
Business Intelligence
Global Diversified
ERP & General
Business Applications
Financial Applications
Human Capital
Management
IT Security
Network
Infrastructure
Platforms, Dev Tools
& Deployment
Storage Management
Technical &
Embedded Apps
High Growth
High Profitability
Software-as-a-Service
Small Cap
Marketing
Applications
Application Delivery &
Network Acceleration
($ millions)
Notes:
[a] Wall Street consensus estimates
[b] EV / EBITDA multiples in excess of 50x or less than 0x and P / E multiples in excess of 100x or less than 0x are considered to be not meaningful
Sources: Company releases, Wall Street research
IT Operations
Management
Advertising
Technology

Copyright ©2014 Shea & Company, LLC
Share Price Market Enterprise Revenue [a] EV / Revenue EBITDA [a] EV / EBITDA [b] P / E Multiple [b]
Company (06/30/14) Value Value CY14E CY15E y/y CY14E CY15E CY14E mgn CY15E mgn CY14E CY15E CY14E CY15E
Content Management
Adobe 72.36$ 36,398$ 34,574$ 4,173$ 4,993$ 20% 8.3 x 6.9 x 1,076$ 26% 1,591$ 32% 32.1 x 21.7 x 53.9 x 58.8 x
Open Text 47.94 5,836 6,832 1,854 1,939 5% 3.7 3.5 606 33% 670 35% 11.3 10.2 17.2 13.3
Kofax 8.55 763 670 315 342 9% 2.1 2.0 45 14% 61 18% 14.7 11.0 nm 23.4
IntraLinks 8.89 506 518 244 257 5% 2.1 2.0 36 15% 45 17% 14.3 11.6 69.7 nm
Avid Technology 7.40 287 215 n/a n/a n/a n/a n/a n/a n/a n/a n/a nm nm nm nm
Guidance Software 9.12 264 243 116 126 8% 2.1 1.9 9 8% 13 10% 27.7 18.7 nm nm
Mean 1,340$ 1,531$ 9% 3.7 x 3.3 x 354$ 19% 476$ 22% 20.0 x 14.6 x 46.9 x 31.9 x
Median 315 342 8% 2.1 2.0 45 15% 61 18% 14.7 11.6 53.9 23.4
ERP & General Business Applications
Salesforce.com 58.08$ 38,226$ 38,447$ 5,335$ 6,606$ 24% 7.2 x 5.8 x 944$ 18% 1,200$ 18% 40.7 x 32.0 x nm x nm x
Sage Group 6.57 7,233 7,793 2,304 2,439 6% 3.4 3.2 692 30% 737 30% 11.3 10.6 17.2 16.5
NetSuite 86.88 6,662 6,454 544 696 28% 11.9 9.3 46 8% 66 9% nm nm nm nm
Constellation Software 254.93 5,402 5,743 1,692 1,985 17% 3.4 2.9 318 19% 396 20% 18.0 14.5 28.4 21.2
Guidewire Software 40.66 2,912 2,312 361 400 11% 6.4 5.8 63 17% 69 17% 36.8 33.6 92.4 79.7
Medidata Solutions 42.81 2,362 2,192 341 415 22% 6.4 5.3 80 24% 105 25% 27.3 21.0 55.1 57.0
Aveva Group 34.87 2,330 2,129 432 475 10% 4.9 4.5 141 33% 157 33% 15.1 13.6 24.5 nm
RealPage 22.48 1,787 1,745 443 514 16% 3.9 3.4 106 24% 131 25% 16.4 13.3 37.7 33.4
Blackbaud 35.74 1,650 1,791 548 592 8% 3.3 3.0 115 21% 131 22% 15.6 13.7 29.1 30.8
Synchronoss Technologies 34.96 1,468 1,415 427 499 17% 3.3 2.8 144 34% 170 34% 9.8 8.3 26.4 21.2
Zendesk 17.38 1,292 1,258 111 160 44% 11.3 7.9 (30) nm (12) nm nm nm nm nm
Fleetmatics 32.34 1,230 1,107 229 285 25% 4.8 3.9 61 27% 83 29% 18.1 13.4 37.8 38.9
Cvent 29.09 1,228 1,027 140 176 26% 7.3 5.8 13 9% 20 11% nm nm nm nm
SPS Commerce 63.19 1,055 923 126 151 19% 7.3 6.1 17 14% 22 15% nm 41.4 nm 99.7
Enghouse Systems Ltd. 33.45 891 797 210 n/a n/a 3.8 n/a 54 26% n/a n/a 14.8 nm 33.7 29.9
Exact Holding N.V. 35.60 814 732 303 320 5% 2.4 2.3 65 21% 68 21% 11.3 10.8 19.8 20.3
PROS 26.44 783 736 190 225 19% 3.9 3.3 26 14% 38 17% 28.0 19.3 47.9 80.5
TechnologyOne 2.52 773 716 187 206 10% 3.8 3.5 43 23% 49 24% 16.7 14.6 29.5 25.4
Basware 52.79 683 663 189 217 15% 3.5 3.1 24 13% 38 18% 27.5 17.3 nm 56.3
Jive Software 8.51 630 524 174 205 18% 3.0 2.6 (12) nm (3) nm nm nm nm nm
E2open 20.67 608 556 84 101 21% 6.6 5.5 (13) nm (6) nm nm nm nm nm
Callidus Software 11.94 580 548 130 151 16% 4.2 3.6 13 10% 18 12% 41.1 31.1 nm 84.2
SciQuest 17.69 491 460 105 119 14% 4.4 3.9 18 17% 25 21% 25.2 18.7 50.5 61.7
ServiceSource 5.80 488 357 295 329 12% 1.2 1.1 (13) nm 8 3% nm 42.7 84.9 nm
Five9 7.20 352 371 104 132 27% 3.6 2.8 (28) nm (28) nm nm nm nm nm
QAD 21.32 342 299 179 218 22% 1.7 1.4 (3) nm 4 2% nm nm nm nm
Model N 11.05 297 195 81 n/a n/a 2.4 n/a (8) nm n/a n/a nm nm 70.7 nm
ClickSoftware 8.07 269 222 128 146 14% 1.7 1.5 4 3% 7 5% nm 32.1 nm nm
Mean 550$ 683$ 18% 4.7 x 4.0 x 103$ 19% 134$ 19% 22.0 x 21.2 x 42.9 x 47.3 x
Median 200 255 17% 3.9 3.4 35 19% 44 19% 18.0 17.3 35.7 36.1
Content Management
Public Equity Market Valuations
Equity Trading Multiples by Segment continued
26
($ millions)
Notes:
[a] Wall Street consensus estimates
[b] EV / EBITDA multiples in excess of 50x or less than 0x and P / E multiples in excess of 100x or less than 0x are considered to be not meaningful
Sources: Company releases, Wall Street research
Supply Chain
Management
Business Intelligence
Global Diversified
ERP & General
Business Applications
Financial Applications
Human Capital
Management
IT Security
Network
Infrastructure
Platforms, Dev Tools
& Deployment
Storage Management
Technical &
Embedded Apps
High Growth
High Profitability
Software-as-a-Service
Small Cap
Marketing
Applications
Application Delivery &
Network Acceleration
IT Operations
Management
Advertising
Technology

Copyright ©2014 Shea & Company, LLC
Share Price Market Enterprise Revenue [a] EV / Revenue EBITDA [a] EV / EBITDA [b] P / E Multiple [b]
Company (06/30/14) Value Value CY14E CY15E y/y CY14E CY15E CY14E mgn CY15E mgn CY14E CY15E CY14E CY15E
Financial Applications
Intuit 80.53$ 23,121$ 20,956$ 4,681$ 4,948$ 6% 4.5 x 4.2 x 1,892$ 40% 1,958$ 40% 11.1 x 10.7 x 27.5 x 21.1 x
FIS 54.74 15,984 20,193 6,385 6,763 6% 3.2 3.0 1,938 30% 2,076 31% 10.4 9.7 19.2 17.7
Fiserv 60.32 15,270 18,811 5,056 5,310 5% 3.7 3.5 1,649 33% 1,764 33% 11.4 10.7 20.1 18.0
Verisk Analytics 60.02 10,249 11,093 1,765 1,969 12% 6.3 5.6 815 46% 912 46% 13.6 12.2 26.7 24.8
Concur 93.34 5,926 5,536 726 907 25% 7.6 6.1 123 17% 164 18% 45.1 33.8 nm nm
MSCI 45.85 5,397 5,939 990 1,078 9% 6.0 5.5 413 42% 455 42% 14.4 13.0 20.8 22.7
Jack Henry 59.43 5,030 4,993 1,263 1,376 9% 4.0 3.6 424 34% 471 34% 11.8 10.6 26.3 23.9
SS&C Technologies 44.22 3,889 4,541 767 824 7% 5.9 5.5 320 42% 344 42% 14.2 13.2 22.5 19.2
Xero 22.77 2,746 2,562 97 181 87% 26.4 14.1 (36) nm (39) nm nm nm nm nm
Temenos Group 38.96 2,652 2,749 506 553 9% 5.4 5.0 167 33% 190 34% 16.5 14.5 34.0 27.5
Fair Isaac 63.76 2,216 2,582 774 817 6% 3.3 3.2 216 28% 220 27% 11.9 11.7 19.9 17.1
Envestnet 48.92 1,810 1,763 335 403 20% 5.3 4.4 53 16% 74 18% 33.4 23.8 89.2 66.1
Advent Software 32.57 1,733 1,983 399 424 6% 5.0 4.7 136 34% 148 35% 14.6 13.4 25.1 23.5
SimCorp 34.44 1,422 1,352 333 366 10% 4.1 3.7 86 26% 102 28% 15.7 13.3 26.7 24.0
Fidessa 37.88 1,415 1,290 484 511 6% 2.7 2.5 132 27% 139 27% 9.8 9.3 27.2 26.2
Bottomline Technologies 29.92 1,189 1,110 323 348 8% 3.4 3.2 71 22% 80 23% 15.5 13.9 26.2 21.0
Asseco Poland 13.54 1,124 1,794 1,958 2,063 5% 0.9 0.9 285 15% 310 15% 6.3 5.8 9.4 9.9
IRESS 7.72 1,084 1,184 323 346 7% 3.7 3.4 101 31% 114 33% 11.7 10.4 23.0 20.2
Ellie Mae 31.13 914 780 151 185 23% 5.2 4.2 40 27% 57 31% 19.5 13.7 31.6 31.6
Ebix 14.31 555 559 210 218 4% 2.7 2.6 85 41% 90 41% 6.6 6.2 9.9 9.4
Q2 Holdings 14.26 522 448 75 98 32% 6.0 4.5 (14) nm (13) nm nm nm nm nm
Mean 1,314$ 1,414$ 14% 5.5 x 4.5 x 424$ 31% 458$ 32% 15.4 x 13.2 x 27.0 x 23.6 x
Median 506 553 8% 4.5 4.2 136 31% 164 33% 13.6 12.2 25.6 21.9
Human Capital Management
Workday 89.86$ 18,326$ 16,470$ 748$ 1,090$ 46% 22.0 x 15.1 x (38)$ nm 36$ 3% nm x nm x nm x nm x
Ultimate Software 138.17 4,056 3,963 506 622 23% 7.8 6.4 121 24% 158 25% 32.7 25.1 94.0 69.0
Cornerstone OnDemand 46.02 2,538 2,467 269 367 36% 9.2 6.7 4 2% 21 6% nm nm nm nm
Benefitfocus 46.22 1,280 1,229 134 170 27% 9.2 7.2 (52) nm (40) nm nm nm nm nm
Paylocity 21.63 1,088 1,002 107 134 25% 9.4 7.5 4 4% 1 1% nm nm nm nm
Paycom Software 14.59 745 818 141 181 28% 5.8 4.5 19 13% 31 17% 43.3 26.3 nm nm
Mean 317$ 427$ 31% 10.6 x 7.9 x 10$ 11% 34$ 10% 38.0 x 25.7 x nm x nm x
Median 205 274 28% 9.2 7.0 4 9% 26 6% 38.0 25.7 nm nm
Public Equity Market Valuations
Equity Trading Multiples by Segment continued
27
($ millions)
Notes:
[a] Wall Street consensus estimates
[b] EV / EBITDA multiples in excess of 50x or less than 0x and P / E multiples in excess of 100x or less than 0x are considered to be not meaningful
Sources: Company releases, Wall Street research
Content Management
Supply Chain
Management
Business Intelligence
Global Diversified
ERP & General
Business Applications
Financial Applications
Human Capital
Management
IT Security
Network
Infrastructure
Platforms, Dev Tools
& Deployment
Storage Management
Technical &
Embedded Apps
High Growth
High Profitability
Software-as-a-Service
Small Cap
Marketing
Applications
Application Delivery &
Network Acceleration
IT Operations
Management
Advertising
Technology

Copyright ©2014 Shea & Company, LLC
Share Price Market Enterprise Revenue [a] EV / Revenue EBITDA [a] EV / EBITDA [b] P / E Multiple [b]
Company (06/30/14) Value Value CY14E CY15E y/y CY14E CY15E CY14E mgn CY15E mgn CY14E CY15E CY14E CY15E
IT Operations Management
VMware 96.81$ 41,920$ 36,804$ 6,030$ 6,987$ 16% 6.1 x 5.3 x 2,235$ 37% 2,681$ 38% 16.5 x 13.7 x 28.7 x 27.5 x
CA Technologies 28.74 12,732 11,246 4,449 4,500 1% 2.5 2.5 1,720 39% 1,777 39% 6.5 6.3 9.1 11.4
ServiceNow 61.96 9,384 9,150 656 907 38% 14.0 10.1 57 9% 102 11% nm nm nm nm
Splunk 55.33 6,817 5,990 411 546 33% 14.6 11.0 12 3% 30 6% nm nm nm nm
SolarWinds 38.66 2,944 2,722 417 492 18% 6.5 5.5 199 48% 240 49% 13.7 11.4 24.7 23.5
Compuware 9.99 2,209 1,909 718 708 -1% 2.7 2.7 187 26% 222 31% 10.2 8.6 24.1 26.1
Netscout Systems 44.34 1,822 1,645 440 498 13% 3.7 3.3 133 30% 157 32% 12.4 10.5 30.0 26.3
LogMeIn 46.62 1,188 984 211 249 18% 4.7 3.9 45 22% 56 22% 21.7 17.5 86.2 46.6
MobileIron 9.52 760 699 115 157 36% 6.1 4.5 (63) nm (58) nm nm nm nm nm
Gigamon 19.14 620 478 174 219 26% 2.7 2.2 24 14% 42 19% 20.0 11.3 42.3 58.9
Mean 1,362$ 1,526$ 20% 6.4 x 5.1 x 455$ 25% 525$ 28% 14.4 x 11.3 x 35.0 x 31.5 x
Median 428 522 18% 5.4 4.2 95 26% 130 31% 13.7 11.3 28.7 26.3
IT Security
Symantec 22.90$ 15,850$ 13,861$ 6,662$ 6,765$ 2% 2.1 x 2.0 x 2,104$ 32% 2,108$ 31% 6.6 x 6.6 x 12.7 x 12.4 x
Check Point 67.03 13,016 11,809 1,473 1,560 6% 8.0 7.6 846 57% 897 58% 14.0 13.2 19.7 18.5
Verisign 48.81 7,298 6,331 1,013 1,064 5% 6.3 5.9 658 65% 699 66% 9.6 9.1 20.8 18.4
FireEye 40.55 6,221 6,221 411 604 47% 15.1 10.3 (229) nm (184) nm nm nm nm nm
Trend Micro 32.92 4,441 3,458 1,119 1,155 3% 3.1 3.0 377 34% 381 33% 9.2 9.1 24.0 22.6
Fortinet 25.13 4,276 3,715 714 807 13% 5.2 4.6 140 20% 171 21% 26.4 21.7 54.5 50.7
Cheetah Mobile 21.24 2,603 2,523 251 469 87% 10.1 5.4 11 5% 109 23% nm 23.2 nm 81.5
Barracuda Networks 31.02 1,630 1,495 260 306 18% 5.8 4.9 63 24% 67 22% 23.8 22.3 nm nm
Proofpoint 37.46 1,516 1,416 179 218 22% 7.9 6.5 (3) nm 4 2% nm nm nm nm
AVG Technologies 20.13 1,074 1,062 385 430 12% 2.8 2.5 142 37% 158 37% 7.5 6.7 9.8 9.9
Qualys 25.67 932 787 130 156 20% 6.0 5.1 22 17% 30 19% 35.6 26.6 nm nm
Imperva 26.18 696 590 154 187 22% 3.8 3.2 (26) nm (16) nm nm nm nm nm
F-Secure 3.52 555 483 218 231 6% 2.2 2.1 47 22% 54 23% 10.2 8.9 23.2 22.5
Vasco Data Security 11.60 460 351 170 180 6% 2.1 2.0 29 17% 35 19% 12.0 10.0 48.3 23.1
Imprivata 16.38 413 409 n/a n/a n/a n/a n/a n/a n/a n/a n/a nm nm nm nm
Mean 939$ 1,009$ 19% 5.7 x 4.6 x 299$ 30% 322$ 29% 15.5 x 14.3 x 26.6 x 28.8 x
Median 322 449 12% 5.5 4.7 55 24% 88 23% 11.1 10.0 22.0 22.5
Marketing Applications
Marketo 29.08$ 1,302$ 1,190$ 141$ 186$ 32% 8.4 x 6.4 x (33)$ nm (22)$ nm nm x nm x nm x nm x
Constant Contact 32.11 1,045 914 330 376 14% 2.8 2.4 60 18% 75 20% 15.1 12.2 44.2 31.4
Bazaarvoice 7.89 629 571 182 206 13% 3.1 2.8 (21) nm (13) nm nm nm nm nm
Marin Software 11.77 414 323 97 117 20% 3.3 2.8 (22) nm (12) nm nm nm nm nm
Mean 188$ 221$ 20% 4.4 x 3.6 x (4)$ 18% 7$ 20% nm x nm x nm x nm x
Median 162 196 17% 3.2 2.8 (21) nm (13) nm nm nm nm nm
Public Equity Market Valuations
Equity Trading Multiples by Segment continued
28
($ millions)
Notes:
[a] Wall Street consensus estimates
[b] EV / EBITDA multiples in excess of 50x or less than 0x and P / E multiples in excess of 100x or less than 0x are considered to be not meaningful
Sources: Company releases, Wall Street research
Content Management
Supply Chain
Management
Business Intelligence
Global Diversified
ERP & General
Business Applications
Financial Applications
Human Capital
Management
IT Security
Network
Infrastructure
Platforms, Dev Tools
& Deployment
Storage Management
Technical &
Embedded Apps
High Growth
High Profitability
Software-as-a-Service
Small Cap
Marketing
Applications
Application Delivery &
Network Acceleration
IT Operations
Management
Advertising
Technology

Copyright ©2014 Shea & Company, LLC
Share Price Market Enterprise Revenue [a] EV / Revenue EBITDA [a] EV / EBITDA [b] P / E Multiple [b]
Company (06/30/14) Value Value CY14E CY15E y/y CY14E CY15E CY14E mgn CY15E mgn CY14E CY15E CY14E CY15E
Network Infrastructure
Juniper Networks 24.54$ 11,711$ 10,102$ 4,982$ 5,239$ 5% 2.0 x 1.9 x 1,290$ 26% 1,509$ 29% 7.8 x 6.7 x 20.0 x 15.2 x
Palo Alto Networks 83.85 6,733 6,365 674 891 32% 9.4 7.1 83 12% 146 16% nm 43.5 nm nm
Brocade 9.20 4,372 3,972 2,194 2,260 3% 1.8 1.8 632 29% 666 29% 6.3 6.0 11.5 11.2
Aruba Networks 17.52 2,019 1,719 789 905 15% 2.2 1.9 173 22% 209 23% 10.0 8.2 31.4 19.3
Infoblox 13.15 740 478 247 288 16% 1.9 1.7 22 9% 42 15% 21.5 11.3 28.2 98.4
Extreme Networks 4.44 432 449 591 669 13% 0.8 0.7 49 8% 80 12% 9.2 5.6 14.0 21.8
Mean 1,580$ 1,709$ 14% 3.0 x 2.5 x 375$ 18% 442$ 21% 11.0 x 13.5 x 21.0 x 33.2 x
Median 731 898 14% 2.0 1.8 128 17% 177 20% 9.2 7.5 20.0 19.3
Platforms, Development Tools & Deployment
Red Hat 55.27$ 10,471$ 9,489$ 1,715$ 1,957$ 14% 5.5 x 4.8 x 458$ 27% 524$ 27% 20.7 x 18.1 x 40.1 x 36.5 x
Informatica 35.65 3,978 3,248 1,061 1,185 12% 3.1 2.7 286 27% 329 28% 11.4 9.9 24.9 21.9
TIBCO Software 20.17 3,358 3,143 1,093 1,158 6% 2.9 2.7 229 21% 268 23% 13.7 11.7 19.6 24.9
Software AG 36.10 2,901 3,083 1,277 1,336 5% 2.4 2.3 365 29% 394 29% 8.4 7.8 13.3 12.6
Micro Focus 14.85 2,226 2,390 444 455 3% 5.4 5.3 203 46% 210 46% 11.8 11.4 16.1 14.1
Pegasystems 21.12 1,616 1,396 589 647 10% 2.4 2.2 93 16% 110 17% 15.1 12.6 31.3 26.2
Progress Software 24.04 1,242 994 331 338 2% 3.0 2.9 122 37% 124 37% 8.2 8.0 20.5 17.5
Axway Software 31.13 637 622 355 391 10% 1.7 1.6 62 17% 73 19% 10.1 8.5 13.7 14.8
Magic Software 7.49 281 249 164 180 9% 1.5 1.4 29 17% 33 18% 8.8 7.7 nm 15.7
Rally Software 10.89 271 186 87 106 21% 2.1 1.7 (30) nm (25) nm nm nm nm nm
Mean 712$ 775$ 9% 3.0 x 2.8 x 182$ 26% 204$ 27% 12.0 x 10.6 x 22.4 x 20.5 x
Median 516 551 10% 2.6 2.5 162 27% 167 27% 11.4 9.9 20.0 17.5
Storage Management
NetApp 36.52$ 11,856$ 7,848$ 6,257$ 6,428$ 3% 1.3 x 1.2 x 1,398$ 22% 1,464$ 23% 5.6 x 5.4 x 14.1 x 12.6 x
CommVault Systems 49.17 2,426 1,943 641 741 16% 3.0 2.6 158 25% 195 26% 12.3 10.0 26.9 25.4
Carbonite 11.97 323 253 123 139 13% 2.1 1.8 12 10% 16 11% 20.4 16.0 nm nm
Mean 2,340$ 2,436$ 10% 2.1 x 1.9 x 523$ 19% 558$ 20% 12.8 x 10.4 x 20.5 x 19.0 x
Median 641 741 13% 2.1 1.8 158 22% 195 23% 12.3 10.0 20.5 19.0
Supply Chain Management
Manhattan Associates 34.43$ 2,612$ 2,486$ 463$ 506$ 9% 5.4 x 4.9 x 133$ 29% 149$ 29% 18.7 x 16.7 x 37.8 x 32.2 x
Descartes Systems 14.33 923 899 174 194 12% 5.2 4.6 52 30% 60 31% 17.3 15.1 20.8 23.3
Amber Road 16.13 429 380 63 74 17% 6.1 5.2 (3) nm 1 1% nm nm nm nm
American Software 9.88 282 216 107 119 12% 2.0 1.8 20 19% 27 23% 10.7 8.0 22.5 25.3
Mean 202$ 223$ 13% 4.7 x 4.1 x 51$ 26% 59$ 21% 15.6 x 13.2 x 27.0 x 26.9 x
Median 140 157 12% 5.3 4.8 36 29% 43 26% 17.3 15.1 22.5 25.3
Public Equity Market Valuations
Equity Trading Multiples by Segment continued
29
($ millions)
Notes:
[a] Wall Street consensus estimates
[b] EV / EBITDA multiples in excess of 50x or less than 0x and P / E multiples in excess of 100x or less than 0x are considered to be not meaningful
Sources: Company releases, Wall Street research
Content Management
Supply Chain
Management
Business Intelligence
Global Diversified
ERP & General
Business Applications
Financial Applications
Human Capital
Management
IT Security
Network
Infrastructure
Platforms, Dev Tools
& Deployment
Storage Management
Technical &
Embedded Apps
High Growth
High Profitability
Software-as-a-Service
Small Cap
Marketing
Applications
Application Delivery &
Network Acceleration
IT Operations
Management
Advertising
Technology

Copyright ©2014 Shea & Company, LLC
Share Price Market Enterprise Revenue [a] EV / Revenue EBITDA [a] EV / EBITDA [b] P / E Multiple [b]
Company (06/30/14) Value Value CY14E CY15E y/y CY14E CY15E CY14E mgn CY15E mgn CY14E CY15E CY14E CY15E
Technical & Embedded Applications
Dassault Systemes 64.33$ 16,213$ 14,350$ 3,137$ 3,465$ 10% 4.6 x 4.1 x 1,010$ 32% 1,152$ 33% 14.2 x 12.5 x 26.8 x 26.8 x
Autodesk 56.38 13,047 11,674 2,397 2,537 6% 4.9 4.6 480 20% 569 22% 24.3 20.5 34.9 47.7
ANSYS 75.82 7,197 6,339 950 1,039 9% 6.7 6.1 480 51% 534 51% 13.2 11.9 24.0 23.0
Synopsys 38.82 6,102 5,570 2,107 2,265 8% 2.6 2.5 652 31% 661 29% 8.5 8.4 17.0 15.6
Cadence Design 17.49 5,165 5,234 1,570 1,671 6% 3.3 3.1 504 32% 561 34% 10.4 9.3 20.5 18.1
Parametric Technology 38.80 4,605 4,653 1,361 1,433 5% 3.4 3.2 376 28% 464 32% 12.4 10.0 20.5 18.5
Aspen Technology 46.40 4,383 4,126 412 461 12% 10.0 8.9 154 37% 185 nm 26.7 22.3 55.2 44.5
Mentor Graphics 21.57 2,517 2,583 1,238 1,313 6% 2.1 2.0 295 24% 328 25% 8.8 7.9 13.6 12.3
Mean 1,646$ 1,773$ 8% 4.7 x 4.3 x 494$ 32% 557$ 32% 14.8 x 12.9 x 26.5 x 25.8 x
Median 1,465 1,552 7% 4.0 3.7 480 32% 547 32% 12.8 11.0 22.2 20.8
30
($ millions)
Public Equity Market Valuations
Equity Trading Multiples by Segment continued
Notes:
[a] Wall Street consensus estimates
[b] EV / EBITDA multiples in excess of 50x or less than 0x and P / E multiples in excess of 100x or less than 0x are considered to be not meaningful
Sources: Company releases, Wall Street research
Content Management
Supply Chain
Management
Business Intelligence
Global Diversified
ERP & General
Business Applications
Financial Applications
Human Capital
Management
IT Security
Network
Infrastructure
Platforms, Dev Tools
& Deployment
Storage Management
Technical &
Embedded Apps
High Growth
High Profitability
Software-as-a-Service
Small Cap
Marketing
Applications
Application Delivery &
Network Acceleration
IT Operations
Management
Advertising
Technology

Copyright ©2014 Shea & Company, LLC
Share Price Market Enterprise Revenue [a] EV / Revenue EBITDA [a] EV / EBITDA [b] P / E Multiple [b]
Company (06/30/14) Value Value CY14E CY15E y/y CY14E CY15E CY14E mgn CY15E mgn CY14E CY15E CY14E CY15E
Software-as-a-Service
Salesforce.com 58.08$ 38,226$ 38,447$ 5,335$ 6,606$ 24% 7.2 x 5.8 x 944$ 18% 1,200$ 18% 40.7 x 32.0 x nm x nm x
Workday 89.86 18,326 16,470 748 1,090 46% 22.0 15.1 (38) nm 36 3% nm nm nm nm
ServiceNow 61.96 9,384 9,150 656 907 38% 14.0 10.1 57 9% 102 11% nm nm nm nm
Splunk 55.33 6,817 5,990 411 546 33% 14.6 11.0 12 3% 30 6% nm nm nm nm
NetSuite 86.88 6,662 6,454 544 696 28% 11.9 9.3 46 8% 66 9% nm nm nm nm
Concur 93.34 5,926 5,536 726 907 25% 7.6 6.1 123 17% 164 18% 45.1 33.8 nm nm
Ultimate Software 138.17 4,056 3,963 506 622 23% 7.8 6.4 121 24% 158 25% 32.7 25.1 94.0 69.0
Cornerstone OnDemand 46.02 2,538 2,467 269 367 36% 9.2 6.7 4 2% 21 6% nm nm nm nm
Criteo 33.77 1,920 1,605 670 909 36% 2.4 1.8 49 7% 90 10% 32.7 17.8 nm 79.0
Envestnet 48.92 1,810 1,763 335 403 20% 5.3 4.4 53 16% 74 18% 33.4 23.8 89.2 66.1
RealPage 22.48 1,787 1,745 443 514 16% 3.9 3.4 106 24% 131 25% 16.4 13.3 37.7 33.4
Marketo 29.08 1,302 1,190 141 186 32% 8.4 6.4 (33) nm (22) nm nm nm nm nm
Zendesk 17.38 1,292 1,258 111 160 44% 11.3 7.9 (30) nm (12) nm nm nm nm nm
Benefitfocus 46.22 1,280 1,229 134 170 27% 9.2 7.2 (52) nm (40) nm nm nm nm nm
Fleetmatics 32.34 1,230 1,107 229 285 25% 4.8 3.9 61 27% 83 29% 18.1 13.4 37.8 38.9
Cvent 29.09 1,228 1,027 140 176 26% 7.3 5.8 13 9% 20 11% nm nm nm nm
LogMeIn 46.62 1,188 984 211 249 18% 4.7 3.9 45 22% 56 22% 21.7 17.5 86.2 46.6
Rocket Fuel 31.09 1,177 995 422 663 57% 2.4 1.5 4 1% 37 6% nm 26.8 nm nm
Paylocity 21.63 1,088 1,002 107 134 25% 9.4 7.5 4 4% 1 1% nm nm nm nm
SPS Commerce 63.19 1,055 923 126 151 19% 7.3 6.1 17 14% 22 15% nm 41.4 nm 99.7
Constant Contact 32.11 1,045 914 330 376 14% 2.8 2.4 60 18% 75 20% 15.1 12.2 44.2 31.4
OPOWER 18.85 989 966 118 146 24% 8.2 6.6 (29) nm (27) nm nm nm nm nm
Varonis Systems 29.01 780 655 98 123 26% 6.7 5.3 (14) nm (12) nm nm nm nm nm
MobileIron 9.52 760 699 115 157 36% 6.1 4.5 (63) nm (58) nm nm nm nm nm
Paycom Software 14.59 745 818 141 181 28% 5.8 4.5 19 13% 31 17% 43.3 26.3 nm nm
Jive Software 8.51 630 524 174 205 18% 3.0 2.6 (12) nm (3) nm nm nm nm nm
Bazaarvoice 7.89 629 571 182 206 13% 3.1 2.8 (21) nm (13) nm nm nm nm nm
Callidus Software 11.94 580 548 130 151 16% 4.2 3.6 13 10% 18 12% 41.1 31.1 nm 84.2
Q2 Holdings 14.26 522 448 75 98 32% 6.0 4.5 (14) nm (13) nm nm nm nm nm
IntraLinks 8.89 506 518 244 257 5% 2.1 2.0 36 15% 45 17% 14.3 11.6 69.7 nm
SciQuest 17.69 491 460 105 119 14% 4.4 3.9 18 17% 25 21% 25.2 18.7 50.5 61.7
The Rubicon Project 12.84 486 465 113 149 32% 4.1 3.1 (5) nm 6 4% nm nm nm nm
Amber Road 16.13 429 380 63 74 17% 6.1 5.2 (3) nm 1 1% nm nm nm nm
Five9 7.20 352 371 104 132 27% 3.6 2.8 (28) nm (28) nm nm nm nm nm
Rally Software 10.89 271 186 87 106 21% 2.1 1.7 (30) nm (25) nm nm nm nm nm
Covisint 4.86 182 133 93 95 3% 1.4 1.4 n/a n/a n/a n/a nm nm nm nm
Mean 401$ 509$ 26% 6.7 x 5.2 x 41$ 13% 64$ 14% 29.2 x 23.0 x 63.7 x 61.0 x
Median 157 196 25% 6.0 4.5 12 14% 22 13% 32.7 23.8 60.1 63.9
Public Equity Market Valuations
Equity Trading Multiples by Comparable Subset
31
($ millions)
Notes:
[a] Wall Street consensus estimates
[b] EV / EBITDA multiples in excess of 50x or less than 0x and P / E multiples in excess of 100x or less than 0x are considered to be not meaningful
Sources: Company releases, Wall Street research
Content Management
Supply Chain
Management
Business Intelligence
Global Diversified
ERP & General
Business Applications
Financial Applications
Human Capital
Management
IT Security
Network
Infrastructure
Platforms, Dev Tools
& Deployment
Storage Management
Technical &
Embedded Apps
High Growth
High Profitability
Software-as-a-Service
Small Cap
Marketing
Applications
Application Delivery &
Network Acceleration
IT Operations
Management
Advertising
Technology

Copyright ©2014 Shea & Company, LLC
Share Price Market Enterprise Revenue [a] EV / Revenue EBITDA [a] EV / EBITDA [b] P / E Multiple [b]
Company (06/30/14) Value Value CY14E CY15E y/y CY14E CY15E CY14E mgn CY15E mgn CY14E CY15E CY14E CY15E
Small Cap (<$250m Market Value)
Tremor Video 4.72$ 238$ 151$ 161$ 201$ 25% 0.9 x 0.8 x (11)$ nm (1)$ nm nm x nm x nm x nm x
Comarch SA 28.04 228 207 326 339 4% 0.6 0.6 35 11% 40 12% 5.9 5.2 28.1 13.6
Actuate 4.77 222 158 101 101 0% 1.6 1.6 7 7% 0 0% 21.7 nm 14.0 nm
ReadSoft 6.63 220 207 121 125 3% 1.7 1.6 17 14% 21 17% 11.9 9.7 74.5 40.6
Cyan 4.03 196 155 97 119 23% 1.6 1.3 (47) nm (35) nm nm nm nm nm
YuMe 5.90 191 132 194 245 26% 0.7 0.5 4 2% 14 6% 36.5 9.4 nm nm
Covisint 4.86 182 133 93 95 3% 1.4 1.4 n/a n/a n/a n/a nm nm nm nm
Exa 11.26 171 143 62 70 13% 2.3 2.0 3 5% 5 7% 49.8 27.7 nm nm
Datawatch 14.96 164 110 38 47 25% 2.9 2.3 (6) nm (2) nm nm nm nm nm
Attunity 7.77 124 106 35 45 27% 3.0 2.3 n/a n/a n/a n/a nm nm 45.7 32.4
FalconStor Software 1.70 82 61 n/a n/a n/a n/a n/a n/a n/a n/a n/a nm nm nm nm
Top Image Systems 3.94 62 59 34 38 14% 1.8 1.5 1 4% 2 4% 49.6 34.6 78.8 87.6
NexJ Systems 1.92 39 13 29 32 11% 0.5 0.4 (7) nm (4) n/a nm nm nm nm
NetSol Technologies 3.88 36 47 47 60 28% 1.0 0.8 6 13% n/a n/a 7.6 nm 16.2 nm
Mean 103$ 117$ 16% 1.5 x 1.3 x 0$ 8% 4$ 8% 26.1 x 17.3 x 42.9 x 43.5 x
Median 93 95 14% 1.6 1.4 3 7% 1 7% 21.7 9.7 36.9 36.5
Public Equity Market Valuations
Equity Trading Multiples by Comparable Subset continued
32
($ millions)
Notes:
[a] Wall Street consensus estimates
[b] EV / EBITDA multiples in excess of 50x or less than 0x and P / E multiples in excess of 100x or less than 0x are considered to be not meaningful
Sources: Company releases, Wall Street research
Content Management
Supply Chain
Management
Business Intelligence
Global Diversified
ERP & General
Business Applications
Financial Applications
Human Capital
Management
IT Security
Network
Infrastructure
Platforms, Dev Tools
& Deployment
Storage Management
Technical &
Embedded Apps
High Profitability
Software-as-a-Service
Small Cap
Marketing
Applications
Application Delivery &
Network Acceleration
IT Operations
Management
Advertising
Technology
High Growth

Copyright ©2014 Shea & Company, LLC
Share Price Market Enterprise Revenue [a] EV / Revenue EBITDA [a] EV / EBITDA [b] P / E Multiple [b]
Company (06/30/14) Value Value CY14E CY15E y/y CY14E CY15E CY14E mgn CY15E mgn CY14E CY15E CY14E CY15E
High Growth (>25% CY15 Revenue Growth)
Rocket Fuel 31.09$ 1,177$ 995$ 422$ 663$ 57% 2.4 x 1.5 x 4$ 1% 37$ 6% nm x 26.8 x nm x nm x
FireEye 40.55 6,221 6,221 411 604 47% 15.1 10.3 (229) nm (184) nm nm nm nm nm
Workday 89.86 18,326 16,470 748 1,090 46% 22.0 15.1 (38) nm 36 3% nm nm nm nm
Zendesk 17.38 1,292 1,258 111 160 44% 11.3 7.9 (30) nm (12) nm nm nm nm nm
ServiceNow 61.96 9,384 9,150 656 907 38% 14.0 10.1 57 9% 102 11% nm nm nm nm
Cornerstone OnDemand 46.02 2,538 2,467 269 367 36% 9.2 6.7 4 2% 21 6% nm nm nm nm
Tableau Software 71.33 5,174 4,557 352 474 35% 12.9 9.6 10 3% 21 4% nm nm nm nm
Splunk 55.33 6,817 5,990 411 546 33% 14.6 11.0 12 3% 30 6% nm nm nm nm
Palo Alto Networks 83.85 6,733 6,365 674 891 32% 9.4 7.1 83 12% 146 16% nm 43.5 nm nm
Marketo 29.08 1,302 1,190 141 186 32% 8.4 6.4 (33) nm (22) nm nm nm nm nm
The Rubicon Project 12.84 486 465 113 149 32% 4.1 3.1 (5) nm 6 4% nm nm nm nm
Paycom Software 14.59 745 818 141 181 28% 5.8 4.5 19 13% 31 17% 43.3 26.3 nm nm
NetSol Technologies 3.88 36 47 47 60 28% 1.0 0.8 6 13% n/a n/a 7.6 nm 16.2 nm
NetSuite 86.88 6,662 6,454 544 696 28% 11.9 9.3 46 8% 66 9% nm nm nm nm
Attunity 7.77 124 106 35 45 27% 3.0 2.3 n/a n/a n/a n/a nm nm 45.7 32.4
Benefitfocus 46.22 1,280 1,229 134 170 27% 9.2 7.2 (52) nm (40) nm nm nm nm nm
Five9 7.20 352 371 104 132 27% 3.6 2.8 (28) nm (28) nm nm nm nm nm
Varonis Systems 29.01 780 655 98 123 26% 6.7 5.3 (14) nm (12) nm nm nm nm nm
Cvent 29.09 1,228 1,027 140 176 26% 7.3 5.8 13 9% 20 11% nm nm nm nm
Gigamon 19.14 620 478 174 219 26% 2.7 2.2 24 14% 42 19% 20.0 11.3 42.3 58.9
Mean 286$ 392$ 34% 8.7 x 6.5 x (8)$ 8% 14$ 9% 23.7 x 27.0 x 34.7 x 45.7 x
Median 158 203 32% 8.8 6.6 4 9% 21 8% 20.0 26.5 42.3 45.7
High Profitability (>35% CY14 EBITDA Margin)
Verisign 48.81$ 7,298$ 6,331$ 1,013$ 1,064$ 5% 6.3 x 5.9 x 658$ 65% 699$ 66% 9.6 x 9.1 x 20.8 x 18.4 x
Check Point 67.03 13,016 11,809 1,473 1,560 6% 8.0 7.6 846 57% 897 58% 14.0 13.2 19.7 18.5
ANSYS 75.82 7,197 6,339 950 1,039 9% 6.7 6.1 480 51% 534 51% 13.2 11.9 24.0 23.0
Oracle 40.53 187,446 174,942 39,122 41,075 5% 4.5 4.3 19,451 50% 21,034 51% 9.0 8.3 14.6 13.6
SolarWinds 38.66 2,944 2,722 417 492 18% 6.5 5.5 199 48% 240 49% 13.7 11.4 24.7 23.5
Verisk Analytics 60.02 10,249 11,093 1,765 1,969 12% 6.3 5.6 815 46% 912 46% 13.6 12.2 26.7 24.8
Micro Focus 14.85 2,226 2,390 444 455 3% 5.4 5.3 203 46% 210 46% 11.8 11.4 16.1 14.1
Akamai Technologies 61.06 10,973 10,144 1,934 2,254 17% 5.2 4.5 825 43% 968 43% 12.3 10.5 30.7 26.6
MSCI 45.85 5,397 5,939 990 1,078 9% 6.0 5.5 413 42% 455 42% 14.4 13.0 20.8 22.7
SS&C Technologies 44.22 3,889 4,541 767 824 7% 5.9 5.5 320 42% 344 42% 14.2 13.2 22.5 19.2
Intel 30.90 155,008 150,355 54,628 55,917 2% 2.8 2.7 22,433 41% 23,162 41% 6.7 6.5 16.3 15.3
Ebix 14.31 555 559 210 218 4% 2.7 2.6 85 41% 90 41% 6.6 6.2 9.9 9.4
Intuit 80.53 23,121 20,956 4,681 4,948 6% 4.5 4.2 1,892 40% 1,958 40% 11.1 10.7 27.5 21.1
CA Technologies 28.74 12,732 11,246 4,449 4,500 1% 2.5 2.5 1,720 39% 1,777 39% 6.5 6.3 9.1 11.4
F5 Networks 111.44 8,453 7,288 1,770 1,993 13% 4.1 3.7 679 38% 778 39% 10.7 9.4 24.0 20.1
Aspen Technology 46.40 4,383 4,126 412 461 12% 10.0 8.9 154 37% 185 40% 26.7 22.3 55.2 44.5
VMware 96.81 41,920 36,804 6,030 6,987 16% 6.1 5.3 2,235 37% 2,681 38% 16.5 13.7 28.7 27.5
AVG Technologies 20.13 1,074 1,062 385 430 12% 2.8 2.5 142 37% 158 37% 7.5 6.7 9.8 9.9
Progress Software 24.04 1,242 994 331 338 2% 3.0 2.9 122 37% 124 37% 8.2 8.0 20.5 17.5
Mean 6,409$ 6,716$ 8% 5.2 x 4.8 x 2,825$ 44% 3,011$ 45% 11.9 x 10.7 x 22.2 x 20.1 x
Median 1,013 1,078 7% 5.4 5.3 658 42% 699 42% 11.8 10.7 20.8 19.2
Notes:
[a] Wall Street consensus estimates
[b] EV / EBITDA multiples in excess of 50x or less than 0x and P / E multiples in excess of 100x or less than 0x are considered to be not meaningful
Sources: Company releases, Wall Street research
Public Equity Market Valuations
Equity Trading Multiples by Comparable Subset continued
33
($ millions)
Content Management
Supply Chain
Management
Business Intelligence
Global Diversified
ERP & General
Business Applications
Financial Applications
Human Capital
Management
IT Security
Network
Infrastructure
Platforms, Dev Tools
& Deployment
Storage Management
Technical &
Embedded Apps
High Profitability
Software-as-a-Service
Small Cap
Marketing
Applications
Application Delivery &
Network Acceleration
IT Operations
Management
Advertising
Technology
High Growth

Copyright ©2014 Shea & Company, LLC
IPO Pricing
IPO Date 02/27/14 03/18/14 03/19/14 03/20/14 04/01/14 04/03/14 04/03/14 04/14/14 05/07/14 05/14/14 06/11/14 06/24/14
Original Range $19 - $21 $14 - $16 $11 - $13 $11 - $13 $15 - $17 $9 - $11 $17 - $19 $18 - $20 $13 - $15 $8 - $10 $8 - $10 $14 - $16
Pricing $22.00 $17.00 $13.00 $13.00 $15.00 $7.00 $19.00 $15.00 $14.00 $9.00 $9.00 $15.00
vs. Midpoint 10% 13% 8% 13% (6%) (30%) 6% (21%) 4% 0% 0% 0%
Current $29.01 $21.63 $14.26 $16.13 $12.84 $7.20 $18.85 $14.59 $21.24 $17.38 $9.52 $16.38
vs. Pricing 32% 27% 10% 24% (14%) 3% (1%) (3%) 52% 93% 6% 9%
Operating Statistics at IPO ($ millions)
CY Revenue $98 $107 $75 $63 $113 $104 $118 $141 $251 $111 $115 n/a
CY+1 Revenue $123 $134 $98 $74 $149 $132 $146 $181 $469 $160 $157 n/a
Growth 26% 25% 32% 17% 32% 27% 24% 28% 87% 44% 36% n/a
Fo
rwa
rd R
eve
nu
e M
ult
iple
34
Equity Financing Activity Software IPOs: Trailing Six Months
Sources: Company releases, Wall Street research
Ma
rke
t V
alu
e (
$ m
illio
ns)
$524
$832
$415 $322
$521
$338
$902 $766
$1,934
$632 $672
$342
$780
$1,088
$522 $429 $486
$352
$989
$745
$2,603
$1,292
$760
$413
$-
$1,000
$2,000
$3,000At IPO
At 06/30/14
4.1x
6.2x
4.1x 4.4x
3.3x 2.6x
6.0x
4.6x
3.9x 3.7x 3.9x
n/a
6.7x
9.4x
6.0x 6.1x
4.1x 3.6x
8.2x
5.8x
10.1x
11.3x
6.1x
n/a
0x
2x
4x
6x
8x
10x
12x
Median at 06/30/14
Median at IPO

Copyright ©2014 Shea & Company, LLC
Current Trading Data Valuation at IPO
Share Price Market Enterprise EV / Revenue Performance Share Amount Market Enterprise EV / Revenue
Company (06/30/14) Value Value CY14E CY15E Since IPO IPO Date Price Raised [a] Value Value LTM CY CY +1
Imprivata $ 16.38 $ 413 $ 409 n/a x n/a x 9 % 06/24/14 $ 15.00 $ 75 $ 342 $ 338 4.4 x n/a x n/a x
MobileIron 9.52 760 699 6.1 4.5 6 06/11/14 9.00 100 672 611 5.7 5.3 3.9
Zendesk 17.38 1,292 1,258 11.3 7.9 93 05/14/14 9.00 100 632 598 7.2 5.4 3.7
Cheetah Mobile 21.24 2,603 2,523 10.1 5.4 52 05/07/14 14.00 168 1,934 1,837 14.8 7.3 3.9
Paycom Software 14.59 745 818 5.8 4.5 (3) 04/14/14 15.00 69 766 834 7.8 5.9 4.6
Five9 7.20 352 371 3.6 2.8 3 04/03/14 7.00 70 338 349 4.2 3.4 2.6
OPOWER 18.85 989 966 8.2 6.6 (1) 04/03/14 19.00 116 902 873 9.8 7.4 6.0
The Rubicon Project 12.84 486 465 4.1 3.1 (14) 04/01/14 15.00 102 521 495 5.9 4.4 3.3
Amber Road 16.13 429 380 6.1 5.2 24 03/20/14 13.00 62 322 327 6.2 5.2 4.4
Q2 Holdings 14.26 522 448 6.0 4.5 10 03/19/14 13.00 81 415 408 7.2 5.5 4.1
Paylocity 21.63 1,088 1,002 9.4 7.5 27 03/18/14 17.00 85 832 832 10.0 7.8 6.2
Varonis Systems 29.01 780 655 6.7 5.3 32 02/27/14 22.00 106 524 510 6.8 5.2 4.1
Barracuda Networks 31.02 1,630 1,495 5.8 4.9 72 11/06/13 18.00 75 900 872 4.0 4.4 3.5
Covisint 4.86 182 133 1.4 1.4 (51) 09/26/13 10.00 64 364 363 3.8 3.6 3.2
FireEye 40.55 6,221 6,221 15.1 10.3 103 09/20/13 20.00 304 2,349 2,315 20.1 14.7 9.3
Rocket Fuel 31.09 1,177 995 2.4 1.5 7 09/20/13 29.00 116 942 943 5.9 4.1 2.2
Benefitfocus 46.22 1,280 1,229 9.2 7.2 74 09/18/13 26.50 80 644 633 6.9 6.1 4.9
Cvent 29.09 1,228 1,027 7.3 5.8 39 08/09/13 21.00 118 812 771 8.6 7.2 5.7
Gigamon 19.14 620 478 2.7 2.2 1 06/11/13 19.00 86 560 537 5.1 3.6 2.7
Marketo 29.08 1,302 1,190 8.4 6.4 124 05/16/13 13.00 75 465 434 6.6 5.2 4.1
Tableau Software 71.33 5,174 4,557 12.9 9.6 130 05/16/13 31.00 155 1,783 1,742 12.2 9.0 6.4
Cyan 4.03 196 155 1.6 1.3 (63) 05/08/13 11.00 88 490 489 4.5 3.5 2.4
Rally Software 10.89 271 186 2.1 1.7 (22) 04/11/13 14.00 84 318 302 5.3 4.2 3.3
Marin Software 11.77 414 323 3.3 2.8 (16) 03/21/13 14.00 105 433 433 7.3 5.8 4.7
Model N 11.05 297 195 2.4 n/a (29) 03/20/13 15.50 93 332 325 6.4 3.1 2.6
Mean 6.3 x 4.9 x 24 % $ 103 $ 744 $ 727 7.5 x 5.7 x 4.3 x
Median 6.0 4.9 9 88 560 537 6.6 5.3 4.0
Equity Financing Activity
Software IPO Pricing & Performance Data
35
Initial Equity Issuances from 2013 – 2Q 2014 ($ millions)
Notes:
[a] Primary shares only
Sources: Company releases, Wall Street research

Copyright ©2014 Shea & Company, LLC
Company Stage Ticker IPO Date Range Price First Filing Date Revenue (LTM) Net Income (LTM)
The Rubicon Project Priced RUBI 04/01/14 $15 - $17 $15.00 02/04/14 $84 $9
Five9 Priced FIVN 04/03/14 $9 - $11 $7.00 03/03/14 $84 ($31)
OPOWER Priced OPWR 04/03/14 $17 - $19 $19.00 03/03/14 $89 ($14)
Paycom Software Priced PAYC 04/14/14 $18 - $20 $15.00 03/10/14 $108 $5
Cheetah Mobile Priced CMCM 05/07/14 $13 - $15 $14.00 04/02/14 $124 $10
Zendesk Priced ZEN 05/14/14 $8 - $10 $9.00 04/10/14 $83 ($27)
MobileIron Priced MOBL 06/11/14 $8 - $10 $9.00 04/07/14 $108 ($43)
Imprivata Priced IMPR 06/24/14 $14 - $16 $15.00 03/31/14 $76 ($11)
Good Technology Corporation S-1 Filed GDTC n/a n/a n/a 05/15/14 $174 ($109)
GoDaddy S-1 Filed DADY n/a n/a n/a 06/10/14 $1,188 ($199)
Cyber-Ark Software S-1 Filed CYBR n/a n/a n/a 06/25/14 $71 $5
Yodlee S-1 Filed YDLE n/a n/a n/a 06/30/14 $74 ($0)
Trustwave Holdings Withdrawn TWAV n/a n/a n/a 04/21/11 $121 ($1)
4
15
(8)
(1)
10
18
(9)
(6)
13
14
(20)
(2)
5
17 (17)
5
14 (13)
(2)
4
2010 IPO
Backlog
New Filings Priced Withdrawn 2011 IPO
Backlog
New Filings Priced Withdrawn 2012 IPO
Backlog
New Filings Priced Withdrawn 2013 IPO
Backlog
New Filings Priced Withdrawn 2014 IPO
Backlog
New Filings Priced Withdrawn 2014 YTD
IPO Backlog
Equity Financing Activity
Software IPO Pipeline
36
Note: In a typical IPO process, the offering progresses through three key milestones: the initial filing of the S-1 (prospectus; F-1 for foreign companies); an amended version of the S-1 following comments from the SEC; and
pricing the offering and issuing shares to the public market
($ millions)
Historical IPO Filing Trends

Copyright ©2014 Shea & Company, LLC
Close Date Company Participating Investor(s) Description Amount
06/30/14 DataBricks Andreessen Horowitz, NEA Open source Apache Spark project for big data analytics $33
06/30/14 Numvision SAS Bouygues Telecom Initiatives SASU Cloud storage and disaster recovery <$1
06/28/14 Referly Andreessen Horowitz, Felicis, Flybridge, Gramercy Fund, Slow Ventures, Version One Ventures Private company research platform $2
06/26/14 BlockScore Battery, Boost Fund, Khosla Ventures, Lightspeed, New Atlantic Ventures, Y Combinator Intelligent ID verification system $2
06/26/14 Couchbase Accel Partners, Adams Street, DOCOMO, Ignition, Mayfield, North Bridge, WestSummit Capital NoSQL database for document and key-value storage $60
06/25/14 PLUMgrid Hummer Winblad, Longworth Venture Partners, Qualcomm Ventures, Swisscom Ventures, USVP Network virtualization $16
06/25/14 Sapho Bloomberg Beta, SoftTech VC Live stream for enterprise app updates $3
06/24/14 Aerospike Alsop Louie Partners, Columbus Nova Technology Partners, NEA NoSQL database storage and management systems $20
06/24/14 RedOwl Analytics Attractor Investment Management, Propel Investments Ltd. Corporate data stream analytics for risk detection $5
06/24/14 Seal Software Toba Capital Contract discovery and analytics $4
06/24/14 Transifex Ltd. Arafura Ventures, NEA, Toba Capital Continuous localization platform for app development $3
06/23/14 Alation Andreessen Horowitz Big data analytics n/a
06/23/14 Scivantage Brown Brothers Harriman & Co., Comerica Bank, Edison Ventures, ORIX Ventures Trade processing and account management for the financial services sector $20
06/20/14 Fusemachines n/a AI driven customer behavior analytics <$1
06/20/14 Workspot Kleiner Perkins, NVP, Redpoint Ventures, TransLink Capital Enterprise mobility management and collaboration $11
06/19/14 Puppet Labs Cisco, Google Ventures, Kleiner Perkins, Triangle Peak Partners, True Ventures, VMware IT automation and configuration management $40
06/18/14 BalaBit IT Biztonsagtechnikai Kft C5 Capital Activity monitoring, trusted login and secure gateways $5
06/18/14 CloudHealth Technologies .406 Ventures, Sigma Prime Ventures Cloud environment performance management $3
06/18/14 LogFire Edison Ventures, Fulcrum Equity Partners Inventory and warehouse management $8
06/18/14 Neotys SAS Ardian International Ltd. Web and mobile application performance testing $2
06/18/14 Prevalent Networks Fulcrum Equity Partners Third-party vendor risk management $4
06/18/14 Zerto Ltd. Battery, Greylock, Harmony Partners, RTP Ventures, USVP Business continuity and disaster recovery for virtualized environments $26
06/17/14 Keen Labs Amplify Partners, Cloud Power Capital, Pelion, Rincon Venture Partners, Sequoia Custom data analytics APIs for developers $11
06/17/14 Kony Delta-v Capital, Georgian Partners, Hamilton Lane, Insight, SoftBank, Telstra Mobile application development platform $50
06/17/14 Templafy ApS SEED Capital Management I/S, Sunstone Capital A/S Document template management $10
06/17/14 Virtru Bessemer Venture Partners Email encryption $6
06/16/14 Elastica n/a Cloud application security $18
06/16/14 TreeFrog Software Ltd. Jenson Funding Partners Business workflow and asset tracking n/a
06/12/14 Coherent Path BOLDstart Ventures, CommonAngels, Dunnhumby, GrandBanks, Sigma Prime Ventures Retail promotion customization $6
06/12/14 Freshdesk Accel Partners, Google Capital, Tiger Global Management Social customer service platform $31
06/12/14 SiSense Ltd. Battery, DFJ, Genesis Partners Ltd., Opus Capital Shareable business intelligence analytics reports $30
06/11/14 Plex Systems Accel Partners, T. Rowe Price ERP, accounting and quality management for manufacturers $50
06/11/14 RebelMail BOLDstart Ventures, Box Group, Lerer, Vaizra Investments, Vayner/RSE Interactive email marketing $2
06/11/14 White Ops Grotech Ventures, Paladin Capital Group Online bot detection and defense $7
06/10/14 Argus Cyber Security Ltd. Magma Venture Partners Cyber security for the automotive sector $3
06/09/14 CirrusWorks n/a IP network performance management $4
06/09/14 Knoa Software n/a Business process optimization through end-user experience monitoring $5
06/09/14 Mesosphere Andreessen Horowitz, Data Collective, Fuel Capital Data center operating system for server cluster management $11
06/09/14 Splitforce SOSventures Mobile app A/B testing <$1
06/06/14 Egenera Comvest Partners Cloud computing and data center infrastructure automation $16
Equity Financing Activity
Software Private Capital Raise Activity: 2Q 2014
37
($ millions)
Sources: Company releases, Wall Street research

Copyright ©2014 Shea & Company, LLC
Close Date Company Participating Investor(s) Description Amount
06/06/14 Triblio Kepha Partners, Longworth Venture Partners Content marketing suite $3
06/05/14 Cyber X GlenRock Israel, Glilot Capital Partners, Swarth Group Industrial internet network security $2
06/05/14 Elasticsearch B.V. Benchmark Capital, Index Ventures, NEA Open source big data search and analytics $70
06/05/14 Montage Talent Baird Capital, Beringea, Calumet Venture Fund, Gary Comer, Wisconsin Investment Board Video talent acquisition $6
06/05/14 XebiaLabs Updata Partners Agile application delivery automation $12
06/03/14 Aryaka Networks InterWest Partners, Mohr Davidow, Nexus Venture Partners, Presidio Ventures, Trinity Ventures Wide area network optimization and app acceleration $10
06/03/14 Centric Software n/a Product lifecycle management application suite $12
06/02/14 Concurrent Bain Capital Ventures, Rembrandt Venture Partners, True Ventures Cascading framework-based app creation for data processing $10
05/29/14 Observable Networks DH Capital, Vectis Life Sciences Continuous analysis of network devices and threat detection $2
05/28/14 MATRIXX Software Adams Street, Greylock, Innovacom SA, Swisscom Ventures, Telstra, Tugboat Ventures Online charging and policy management for service providers n/a
05/23/14 DataLogix Breyer Capital, IVP, Wellington Online ad performance analytics for offline purchases $45
05/23/14 Malauzai Software Wellington Mobile banking smart applications $6
05/21/14 Load DynamiX HighBar Partners Data center traffic testing and analytics $12
05/21/14 Ongest Gestiones y Servicios Fundacion Innovacion Bankinter, Venturcap SCR SA Automated billing system for work process automation <$1
05/21/14 Smartling Harmony Partners, Iconiq, IDG Ventures USA, Tenaya, USVP, Venrock Translation localization suite for websites and mobile apps $25
05/20/14 Centrify DOCOMO Capital, Fortinet, Samsung Venture Investment Corporation Identity management and single sign-on $42
05/20/14 Sumo Logic Accel Partners, Greylock, Sequoia, Sutter Hill IT and security management through log data processing and analytics $30
05/20/14 Treasury Intelligence Solution Target Partners GmbH, Zobito AB Risk and compliance cash management $4
05/19/14 Tamr Google Ventures, NEA Machine learning database collection and analysis $16
05/16/14 Odoo Societe Regionale d'Investissement de Wallonie SA, Sofinnova Partners, Xange Open source ERP, CRM and content management systems $10
05/16/14 UnboundID n/a Customer identity data management and sharing $3
05/16/14 VMRay GmbH High-Tech Gruenderfonds GmbH Advanced malware analysis n/a
05/15/14 Click With Me Now n/a Web sharing through multiple devices $2
05/15/14 Innometrics AB SEB Venture Capital Customer data management for customer experience and marketing enhancement $5
05/15/14 OpenDNS Cisco, Evolution, Glynn Capital, Greylock, Lumia, Mohr Davidow, Northgate, Sequoia, Sutter Hill Web security and domain name system controls $35
05/15/14 OpenGov Andreessen Horowitz, Formation8 Partners, Thrive Capital Visualization of financial data for municipal governments $15
05/14/14 Attensity Group Aeris Capital Business intelligence and rapid data analysis $90
05/14/14 Peerius Ltd. Beringea Algorithmic website personalization for each visitor $1
05/14/14 Sift Science First Round Capital, Spark Capital, Union Square Ventures Machine learning fraud management in user behavior $18
05/13/14 Addepar Valor Equity Partners Fund transparency and financial reporting $50
05/13/14 Agiliance Wellington Financial LP Enterprise governance, risk and compliance $5
05/13/14 Passworks SA Faber Ventures, Portugal Capital Ventures Sociedade de Capital de Risco S.A. Customer engagement and marketing through mobile wallets $1
05/13/14 PowerDMS Ballast Point Ventures Compliance and document management $5
05/12/14 Lua Technologies Abundance Partners LP Team collaboration and project management $8
05/09/14 Acquia Investor Growth Capital, NEA, North Bridge, Sigma West, Split Rock, Tenaya Open source website development and management system $50
05/09/14 Pantheon Systems First Round Capital, Foundry Group, OpenView, Scale Venture Partners Drupal website development, scaling and management $22
05/09/14 Searchmetrics GmbH Holtzbrinck eLab, Iris Capital, Neuhaus Partners GmbH SEO and search analytics $9
05/08/14 Anaplan Brookside, Coatue, DFJ, Granite, Meritech, Salesforce, Sands Capital, Shasta, Workday Cloud-based BI and analytics platform for enterprise performance monitoring $100
05/07/14 Colabo The Hive Intelligent sales lead qualification $2
05/07/14 FieldLens Borealis Ventures, Contour, High Peaks, Lerer, NYC Seed, OpenView, SoftBank Mobile field management for the construction sector $8
Equity Financing Activity
Software Private Capital Raise Activity: 2Q 2014 continued
38
($ millions)
Sources: Company releases, Wall Street research

Copyright ©2014 Shea & Company, LLC
Close Date Company Participating Investor(s) Description Amount
05/07/14 Layer AME Cloud Ventures, CrunchFund, Fuel Capital Ltd., Homebrew Ventures Development platform for adding communication features to apps $15
05/07/14 Maxta Andreessen Horowitz, Intel Capital, Tenaya Software-defined data center for storage and management $25
05/07/14 Metacloud AME Cloud Ventures, Canaan Partners, Pelion, SVB, Storm Ventures, UMC Capital OpenStack-based clouds for the enterprise $15
05/06/14 Frontline Technologies Group Insight Automated scheduling and employee management n/a
05/06/14 Perfecto Mobile Ltd. Carmel Ventures, FTV Capital, Globespan, Vertex Venture Capital Automatic mobile testing $20
05/06/14 Smore n/a Commercial publishing platform for single-page promotional websites $2
05/06/14 StackStorm XSeed Capital Self-driving data centers and operations improvement automation n/a
05/02/14 Are You A Human n/a Online human verification and fraud prevention $2
05/02/14 Cloud9 IDE n/a Cloud-based integrated development environment for Web and mobile apps $2
05/01/14 CertiVox NTT Docomo Ventures, Octopus Ventures Ltd. Encryption key generation, management and distribution via cryptography $8
05/01/14 eVariant Health Enterprise Partners, Lightspeed, Salesforce CRM, marketing automation and data integration services and analytics $18
05/01/14 Tresorit Kft Euroventures Venture Capital Fund Manager Secure cloud file synchronization and sharing $3
04/30/14 Aviso Bloomberg Beta, Cowboy Ventures, First Round Capital , Shasta Revenue scenario analysis and risk assessment $8
04/30/14 Ayla Networks Cisco, Crosslink, International Finance, SAIF, Shanghai Zhijing, SJF Ventures, Voyager Platform for connecting devices to the internet $15
04/30/14 BodeTree Greenline Ventures Financial management and business performance tracking $2
04/30/14 CloudGenix Charles River Ventures, Mayfield Software-defined enterprise wide area networks managed through virtualization $9
04/30/14 Igneous Systems Madrona Venture Group, NEA, Redpoint Ventures Data center infrastructure building, maintaining and scaling $24
04/30/14 StackIQ n/a Multi-server management system and provisioning for clusters and clouds $2
04/30/14 Workspot n/a Mobility management for separating work and personal content on devices $4
04/29/14 Scayl n/a P2P network for secure email <$1
04/29/14 Tealium Silver Lake Management, SVB Enterprise tag management and marketing $20
04/29/14 Undo Ltd. Cambridge Angels Reversible computer program debugging $1
04/29/14 Vidder n/a Software defined perimeter network security $3
04/29/14 Vorstack Aligned Partners, EMC Ventures, TechOperators Cybersecurity event notification and collaboration $5
04/29/14 Weaved Maxfield Capital Instant networking and universal remote access n/a
04/28/14 AvidXchange n/a Accounts payable and invoice management $10
04/28/14 BioCatch Janvest Technologies, OurCrowd Continuous authentication and threat detection $7
04/28/14 InsideSales.com Acadia Woods, Epic Ventures, Hummer Winblad, Kleiner Perkins, Polaris, Salesforce, USVP, Zetta Sales acceleration via enhanced communication, gamification and predictive analytics $100
04/28/14 Profitect Motorola Solutions Venture Capital Supply chain loss prevention, fraud detection and operational compliance n/a
04/25/14 Avalara n/a Sales tax, ERP, e-commerce, CRM and compliance automation $26
04/25/14 LiquidPlanner TVC Capital Priority-based predictive online project management $8
04/25/14 SirionLabs Sequoia Sourcing lifecycle management for suppliers $5
04/25/14 Zettics n/a Mobile activity big data analytics and measurement $10
04/24/14 Crate Technology GmbH DFJ Esprit, Sunstone Capital A/S Open source SQL data store with search capabilities $2
04/24/14 Hothothouse Labs ENIAC, Foundation Capital, Freestyle, Google Ventures, SoftTech VC, Sparklabs, Tekton, TriplePoint Mobile productivity sales platform $3
04/24/14 Parallels Ltd. Maxfield Capital Virtualization and automation n/a
04/24/14 Voxware Cross Atlantic Capital Partners Voice-driven workflow and operations management for SCMs n/a
04/23/14 Accompani Cowboy Ventures, Floodgate Network relationship management n/a
04/23/14 Codasip Ltd. Credo Ventures Application specific instruction-set processors enablement $3
04/23/14 Instart Logic Kleiner Perkins, Tenaya, Sutter Hill Website performance optimization $26
Equity Financing Activity
Software Private Capital Raise Activity: 2Q 2014 continued
39
($ millions)
Sources: Company releases, Wall Street research

Copyright ©2014 Shea & Company, LLC
Close Date Company Participating Investor(s) Description Amount
04/22/14 Crowd Computing Systems Greycroft Partners, iNovia Capital, Mohr Davidow, RTP Ventures Unified AI, human skills and machine learning platform for automating content categorization $15
04/22/14 Salesvue Cultivation Capital Outbound sales enablement tools $3
04/22/14 Wandera n/a Mobile data optimization and threat detection $3
04/20/14 Nervana Systems Allen & Co., SV Angel Analytics through computational neuroscience, processor design and machine learning <$1
04/18/14 Concorde Solutions Ltd. Elderstreet Investments, JMI Equity, Panoramic Growth Equity Software asset performance and management across IT infrastructure $3
04/17/14 Apigee Accenture, Bay Partners, BlackRock, Focus, NVP, Pine River, SAP Ventures, Third Point, Wellington Secure cloud-based API management $60
04/16/14 AppsBuilder SpA Annapurna Ventures, United Ventures, Zernike Group Holding B.V. Cross-platform mobile application development $2
04/15/14 AgilOne Four Rivers Group, Mayfield, Next World Capital, Sequoia, Tenaya Predictive marketing and spend analysis $25
04/15/14 BlueStack Systems n/a Android and Windows application management $8
04/15/14 Razorsight n/a Cloud-based customer analytics for communications service providers $2
04/15/14 Squarespace General Atlantic Website publishing and online content management n/a
04/15/14 StarWind Software ABRT Venture Fund, Almaz Capital Partners, AVentures Capital Network storage for SME $3
04/14/14 LearnVest Accel Partners, American Express Ventures, Northwestern Mutual Online personal finance planning $28
04/14/14 Triage Flybridge Capital Partners, Lerer, Vast Ventures Workflow notification streamlining and management $1
04/14/14 ZeroFOX Core Capital Partners, Genacast Ventures, NEA Application security analysis and threat detection $10
04/11/14 Telerik AD n/a Software development lifecycle management $6
04/09/14 Decisyon Axel Johnson, Catalyst Investors Collaborative business intelligence and performance management $22
04/08/14 Namely n/a Team building, goal tracking and talent optimization $3
04/01/14 Certes Networks n/a Encryption, policy and key management for network security $2
Equity Financing Activity
Software Private Capital Raise Activity: 2Q 2014 continued
40
($ millions)
Sources: Company releases, Wall Street research

People ▪ Industry Expertise ▪ Process Excellence
Boston San Francisco
Shea & Company, LLC provides independent financial advice on mergers, acquisitions, financial restructurings, private capital raising and similar corporate finance matters. Shea & Company is not a retail broker-
dealer. The firm does not conduct underwriting activities, provide research or analyst reports or solicit or carry accounts for, or offer or sell securities products to retail customers. Shea & Company is regulated by
the Financial Industry Regulatory Authority, Inc. (”FINRA”) as a FINRA Member Firm. The information and services provided in this presentation are not provided to and may not be used by any person or entity in
any jurisdiction where the provision or use thereof would be contrary to applicable laws, rules or regulations of any governmental authority or regulatory or self-regulatory organization or where Shea & Company is
not authorized to provide such information or services.