quarterly financial results report
TRANSCRIPT

March 2020
QUARTERLY FINANCIAL RESULTS REPORT
2019-20

WESTERN AUST
RA
LIA
THE
GOVERNMEN
OF
T2019 ‑20
Quarterly Financial Results Report
March 2020

Enquiries related to this report should be directed by email to [email protected]
An electronic copy of this report may be obtained at https://www.wa.gov.au/treasury/state-financesISSN 1444-8548 (print) ISSN 1447-9370 (on-line)
2019-20 Quarterly Financial Results Report© Government of Western Australia 2020

2019-20
Quarterly Financial Results Report Nine Months Ended 31 March 2020
Table of Contents
Foreword .......................................................................................................................... i
Statement of Responsibility ............................................................................................ ii
Overview .......................................................................................................................... 1
Summary ....................................................................................................................... 1
Results Compared to Prior Year .................................................................................... 2
General Government Sector ...................................................................................... 2
Total Public Sector ................................................................................................... 10
Appendix 1: Interim Financial Statements ................................................................. 13
Introduction ................................................................................................................. 13
Notes to the Interim Financial Statements ................................................................... 22
Appendix 2: Operating Revenue ................................................................................. 27
Appendix 3: Public Ledger .......................................................................................... 33
Consolidated Account.................................................................................................. 33
Treasurer’s Special Purpose Accounts ........................................................................ 36
Treasurer’s Advance ................................................................................................... 37
Transfers, Excesses and New Items ........................................................................... 38
Appendix 4: Special Purpose Accounts ..................................................................... 41
Appendix 5: General Government Salaries ................................................................ 49


i
Foreword
This Quarterly Financial Results Report (QFRR) provides financial results for the Western Australian public sector for the nine months to 31 March 2020.
Care should be exercised in extrapolating the likely outcome for the 2019-20 year based on the quarterly results to date, particularly in light of the COVID-19 pandemic, which is expected to have a material impact in the June quarter 2020. Seasonal and other timing factors that impact the State’s finances also make full-year estimation difficult.
The presentation in this report is consistent with that used in the 2019-20 State Budget (presented to the Legislative Assembly on 9 May 2019).
Three new accounting standards took effect for reporting periods commencing on or after 1 January 2019, and their impact was included in the 2019-20 Budget and has been reflected in the general government and whole-of-government results for the nine months ended 31 March 2020 in this report. These standards are:
• AASB 16: Leases, which brings operating leases and associated leased assets onto the balance sheet for the first time;
• AASB 15: Revenue From Contracts With Customers, which amends revenue recognition rules, particularly around the nature, amounts, timing and uncertainty of revenue arising from customer contracts; and
• AASB 1058: Income of Not-For-Profit Entities, which simplifies some of the new AASB 15 rules, particularly for public sector entities (where concepts of contracts with customers can be ambiguous).
Further details about the impact of each standard can be found in Chapter 3: Fiscal Outlook and Strategy of the 2019-20 Budget Paper No 3. The 2019-20 Budget included backcast data for the expected outturn for 2018-19 and for prior years to aid with comparisons and trend analysis. However, prior period results detailed in Appendix 1 of this report have not been restated for comparative purposes, in line with the transition provisions contained in paragraph C3(b) of AASB 15 and paragraph C3(b) of AASB 1058 and a Treasury Circular mandating those approaches for actuals reporting in State public sector reporting entities.
Where practical, revenue and expense movements discussed in the Overview chapter of this report abstract from the impact of the new standards to assist the user in understanding the changes in March quarterly performance.
The financial statements in this report have been prepared in accordance with applicable Australian Accounting Standards including AASB 134: Interim Financial Reporting and AASB 1049: Whole of Government and General Government Sector Financial Reporting.
In addition to the financial statements in Appendix 1 and details of operating revenue in Appendix 2, this report includes:

2019-20 Quarterly Financial Results Report
ii
• Appendix 3: Public Ledger, which summarises information on the Consolidated Account, Treasurer’s Special Purpose Accounts and the Treasurer’s Advance;
• Appendix 4: Special Purpose Accounts, which details movements in balances for a number of Special Purpose Accounts established for the delivery of key Government policy outcomes; and
• Appendix 5: General Government Salaries, which summarises interim salaries spending by general government sector agencies.
Information presented in this QFRR is not audited.
Statement of Responsibility
The following Interim Financial Statements and accompanying notes for the general government sector and the whole-of-government have been prepared by the Department of Treasury from information provided by agencies.
In our opinion, the statements are a true and fair presentation of the operating statements and cash flows of these sectors for the three months and nine months ended 31 March 2020, and of the balance sheets of these reporting entities at 31 March 2020. The statements have been prepared in accordance with applicable Australian Accounting Standards and other authoritative pronouncements of the Australian Accounting Standards Board, and where there is no conflict with these standards, they are also consistent with the Australian Bureau of Statistics’ Government Finance Statistics Concepts, Sources and Methods 2015.
MICHAEL BARNES MAGDALENA WITTEK UNDER TREASURER MANAGER FINANCIAL REPORTING
25 May 2020

1
Overview
Summary
The outcomes reported in this March Quarterly Financial Results Report are generally in line with the pre-COVID-19 forecasts for the year ending 30 June 2020 that were detailed in the 2019-20 Mid-year Review (released in December 2019). This reflects that the COVID-19 pandemic had little impact on the State’s finances in the March quarter. However, material impacts are expected in the June quarter, which will be included in the 2019-20 Annual Report on State Finances (due for release by 28 September 2020).
The general government sector recorded an operating surplus of $2.4 billion for the nine months to 31 March 2020. This outcome is primarily the result of higher royalty income and the timing of GST ‘top-up’ payments from the Commonwealth.
Excluding the impact of accounting standards changes1, general government revenue for the first nine months of 2019-20 was $3.1 billion (or 14.7%) higher than the same period last year. This growth mainly reflects the continuing impact of the higher iron ore price on royalty revenue (up $1,791 million) and higher GST grants and associated top-up payments (up $983 million).
General government expenses were $730 million (or 3.5% excluding accounting standards changes) higher than the March 2019 outcome. This increase reflects higher salaries expenditure (up $402 million or 4.4%), largely due to higher employee costs in the health, law and order and education sectors, and higher current and capital transfer expenses (up $273 million).
1 Two new revenue standards came into effect for periods commencing on or after 1 January 2019. AASB 15: Revenue
From Contracts With Customers and AASB 1058: Income of Not-For-Profit Entities include a number of changes to rules for revenue recognition. The key change from these standards for the March quarter 2020 is the removal of Commonwealth grants paid ‘through’ the State to local governments and non-government schools. To assist readers to understand movements in operating aggregates discussed in this report, explanatory information about changes since the same period last year include adjustment to March quarter 2019 outcomes (released a year ago) to remove $1,417 million in grants revenue and expenses to present a consistent basis of comparison for quarterly revenue and expense movements. Readers should note that in line with accounting standards requirements, numerical data in tables throughout this chapter and the appendices to this report are unadjusted and remain in line with the applicable accounting standards for the periods reported.

2019-20 Quarterly Financial Results Report
2
Total public sector net debt was $34.5 billion at 31 March 2020, $930 million lower than the outcome recorded at 30 June 2019. This includes the recognition of lease obligations measured under AASB 16: Leases (which took effect for reporting periods commencing on or after 1 January 2019). Adjusting 2018-19 outcomes for the estimated impact of AASB 16 changes, the 31 March 2020 result represents a reduction in net debt of $3 billion relative to 30 June 2019. This is consistent with the pre-COVID-19 forecast of a peak in net debt at 30 June 2019 contained in the 2019-20 Mid-year Review.
Results Compared to Prior Year
General Government Sector
The general government sector recorded an operating surplus of $2,439 million for the nine months to 31 March 2020, substantially higher than the $62 million surplus reported for the same period in 2018-19.
Table 1 SUMMARY OF GENERAL GOVERNMENT SECTOR FINANCES
Western Austra l ia
(a) Consistent with the estimated outcome published in the 2019-20 Mid-year Review, released on 18 December 2019. (b) Consistent with final audited data contained in the 2018-19 Annual Report on State Finances, released 27 September 2019.
$m $m $m $m $m $mNet operating balance 129 2,439 2,589 -20 62 1,317Net worth 101,002 101,938 102,264 100,593Movement in cash balances -93 1,493 456 -209 -1,389 -1,355Memorandum itemsNet lending -83 3,421 3,429 -129 -560 175Net debt 22,017 23,251 23,190 22,990Cash surplus/-deficit 187 3,348 3,299 183 -787 -426
Estimated Outturn (a) Actual (b)
Nine Months to 31 Mar
Nine Months to 31 Mar
2019-20
Three Months to 31 Mar
2018-19
Three Months to 31 Mar

Overv iew
3
Revenue
Revenue for the nine months to 31 March 2020 totalled $24,234 million, $3,106 million (or 14.7%) higher than the same period last year (after adjusting 2018-19 data for accounting standards changes).
Figure 1 GENERAL GOVERNMENT REVENUE
Change, Nine months to March
The higher revenue outcome for the nine months to 31 March 2020 primarily reflects the net impact of:
• higher royalty income (up $1,791 million), largely due to the combined impact of:
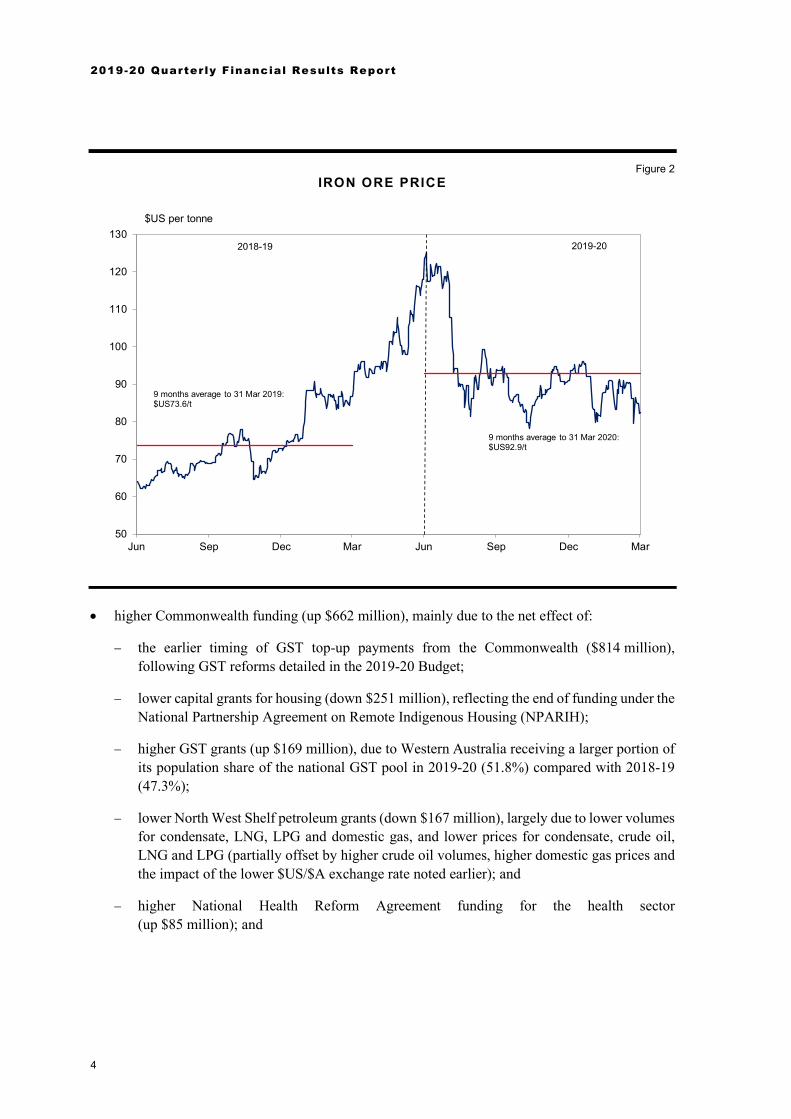
− a higher benchmark iron ore price, which averaged $US92.9 per tonne in the nine months to 31 March 2020, 26.2% above the average price in the same period in 2018-19 ($US73.6 per tonne);
− a lower average $US/$A exchange rate, which at US67.6 cents in the nine months to 31 March 2020, was 6.2% below the average for the corresponding period a year prior (US72.0 cents); and
− slightly lower iron ore export volumes in the nine months to 31 March 2020, which were 4.8% below the level for the same period last year;
Royalty Income$1,791m
GST and GST top-up Grants$983m
Other C'wealth grants
-$320m
Taxation Income$451m
All other$201m
-750
-250
250
750
1,250
1,750
$ Million
Total increase = $3,106m
2019-20 Quarterly Financial Results Report
4
Figure 2 IRON ORE PRICE
• higher Commonwealth funding (up $662 million), mainly due to the net effect of:
− the earlier timing of GST top-up payments from the Commonwealth ($814 million), following GST reforms detailed in the 2019-20 Budget;
− lower capital grants for housing (down $251 million), reflecting the end of funding under the National Partnership Agreement on Remote Indigenous Housing (NPARIH);
− higher GST grants (up $169 million), due to Western Australia receiving a larger portion of its population share of the national GST pool in 2019-20 (51.8%) compared with 2018-19 (47.3%);
− lower North West Shelf petroleum grants (down $167 million), largely due to lower volumes for condensate, LNG, LPG and domestic gas, and lower prices for condensate, crude oil, LNG and LPG (partially offset by higher crude oil volumes, higher domestic gas prices and the impact of the lower $US/$A exchange rate noted earlier); and
− higher National Health Reform Agreement funding for the health sector (up $85 million); and
50
60
70
80
90
100
110
120
130
Jun Sep Dec Mar Jun Sep Dec Mar
2018-19 2019-20
$US per tonne
9 months average to 31 Mar 2020: $US92.9/t
9 months average to 31 Mar 2019: $US73.6/t

Overv iew
5
• higher tax collections (up $451 million), largely due to the net impact of:
- higher payroll tax (up $167 million), primarily due to higher employment in large payroll tax paying industries such as mining;
- higher transfer duty (up $98 million), mainly reflecting a lift in residential property transactions;
- higher betting tax (up $44 million), mainly due to the introduction of the Point of Consumption Tax from 1 January 2019;
- higher insurance duty (up $43 million), consistent with increases in sales and prices of insurance products, and a number of large assessments received in August 2019 and January 2020;
- higher landholder duty (up $40 million), mainly due to a larger number of high value commercial landholder transactions in the nine months to March 2020 compared to the same period last year;
- higher motor vehicle taxes (up $34 million) and revenue from the on-demand transport levy ($34 million) introduced in April 2019; and
- lower land tax (down $28 million), consistent with a forecast 4.1% decline in land tax collections in 2019-20.
As noted earlier, these revenue movements largely predate the COVID-19 pandemic, which is expected to have a material impact on June quarter revenue collections.

2019-20 Quarterly Financial Results Report
6
Figure 3 GENERAL GOVERNMENT REVENUE ( a )
Nine months to 31 March 2020
(a) Segments may not add due to rounding.
Royalty Income$6,142m
25%
Public Corporations$847m
4%Other$565m
2%Other Commonwealth Grants
$3,909m14%
GST and 70% C'wealth Floor Grant
$3,431m14%
Sales of Goods and Services$2,138m
9%
Taxation$7,202m
30%
TOTAL$24,234m

Overv iew
7
Expenses
Expenses for the nine months to 31 March 2020 totalled $21,795 million, up $730 million (or 3.5%) on the same period in 2018-19 (after adjusting 2018-19 data for the impact of accounting standards changes).
Figure 4 GENERAL GOVERNMENT EXPENSES
Change, Nine months to March
The increase in spending for the nine months to 31 March 2020, compared with the same period last year, is mainly due to the net effect of:
• higher salaries (up $402 million or 4.4%), reflecting growth in staff numbers across the health, education and justice sectors, wage increases under prevailing industrial agreements, and the impact of the Government's commitment to convert eligible casual and fixed term contract staff to permanent employees;
• higher current and capital transfers (up $273 million), mainly due to the combined effect of:
− higher grant expenses by the Department of Communities (up $344 million), primarily reflecting a change in the classification of the State’s NDIS contribution to the National Disability Insurance Agency from ‘other’ gross operating expenses to grants;
− lower on-passed capital grants for housing (down $251 million), reflecting the end of Commonwealth funding previously recognised under the NPARIH (noted under grants revenue earlier in this chapter);
− the Voluntary Taxi Plate Buyback Payment Scheme amounting to $118 million in July 2019 by the Department of Transport;
Salary Costs$402m
Capital and Current Transfers$273m
Depreciation and amortisation
$245m
Other Gross Operating Expenses-$172m
Consolidated Account Interest
-$75m
All other$56m
-250
0
250
500$ Million
Total increase = $730m

2019-20 Quarterly Financial Results Report
8
− lower grant payments incurred by Main Roads (down $95 million), reflecting work on flood damaged roads in 2018-19;
− higher operating subsidies (up $90 million), mainly due to a revised subsidy payment profile for the Public Transport Authority for 2019-20; and
− later payment of Remote Essential and Municipal Services funding to the Department of Communities (Housing Services), down $56 million;
• higher depreciation and amortisation costs (up $245 million), primarily due to the implementation of new accounting standard AASB 16: Leases; and
• lower ‘other’ gross operating expenses (down $172 million), mainly due to the reclassification of NDIS payments to current transfers (noted earlier), and the reclassification of rental costs to other spending categories under AASB 16: Leases, partly offset by movements in health and education sector operating costs.
Figure 5 GENERAL GOVERNMENT EXPENSES ( a )
Nine months to 31 March 2020
(a) Segments may not add due to rounding.
Health$6,838m
31%
Education$3,881m
18%
Transport, Roads and Rail
$1,841m8%
Water Subsidies$178m
1%
Law and Order$2,310m
11%
Training$413m
2%
All Other$3,805m
17%Communities
$1,727m8%
Finance$800m
4%
TOTAL$21,795m
Overv iew
9
Balance Sheet
Net worth of the general government sector increased by $409 million during the nine months to 31 March 2020, to stand at $101 billion2. This increase reflects the net impact of:
• a $2.8 billion net increase in general government sector liabilities, mainly due to deferred revenue of $1.4 billion in upfront cash proceeds from Landgate’s partial commercialisation (a non-debt liability), and an increase in lease obligations (of $2 billion, included as debt obligations) with the introduction of AASB 16: Leases. These increases were partially offset by a $1.3 billion reduction in central borrowing mainly due to the application of Western Australia’s GST top-up payments for 2019-20 to debt repayment;
• an estimated net increase of $2.7 billion in general government sector property, plant and equipment, mainly due to right of use leased assets brought to account with the introduction of AASB 16;
• a $1.3 billion increase in liquid assets, mainly due to the timing of cash receipts and payments through the Public Bank Account; and
• a $663 million net decrease in the value of equity in public corporations, mainly due to the increase in public non-financial sector lease liabilities under AASB 16.
Cash Flow
A cash surplus of $3.3 billion was recorded for the nine months to 31 March 2020, a significant turnaround from the $787 million cash deficit reported for the same period in 2018-19. This outcome is largely due to:
• a net cash surplus from operating activities of $3.6 billion, compared with a $832 million cash surplus reported for the same period last year, due to the cash impact of the higher general government sector operating surplus outcome discussed earlier; and
• a $299 million in general government net cash outflow from investment in non-financial assets, compared with $1.6 billion for the same period in 2018-19 (with almost $1.8 billion in infrastructure investment largely offset by cash proceeds from the partial commercialisation of Landgate and sale of other non-financial assets).
2 Net worth is the widest measure of financial value of the public sector and includes the value of all assets less the value
of all liabilities recorded on the balance sheet.

2019-20 Quarterly Financial Results Report
10
Total Public Sector3
Operating Statement
Bolstered by the general government sector, the total public sector recorded an operating surplus of $2,590 million for the nine months to 31 March 2020, $1,948 million higher than the $642 million operating surplus recorded in the same period a year earlier.
Table 2 SUMMARY OF TOTAL PUBLIC SECTOR FINANCES
Western Austra l ia
(a) Consistent with the estimated outcome published in the 2019-20 Mid-year Review, released on 18 December 2019. (b) Consistent with final audited data contained in the 2018-19 Annual Report on State Finances, released 27 September 2019.
The total public sector operating surplus for the nine months to 31 March 2020 includes:
• the $2,439 million operating surplus for the general government sector outlined earlier;
• an operating surplus of $274 million for the public non-financial corporations sector, $460 million lower than the surplus recorded in the same period in 2018-19, mainly due to a lower operating surplus reported by the Housing Authority (reflecting the cessation of Commonwealth Remote Indigenous Housing funding and later timing of Remote Essential and Municipal Services funding, noted earlier); and
• an operating surplus of $212 million for the public financial corporations sector, broadly in line with the surplus recorded in the same period in 2018-19.
3 The total public sector (also known as the whole-of-government) consolidates the general government sector
(discussed above), the public non-financial corporations sector (which includes entities operating on a predominantly cost recovery basis like the State’s ports and the electricity and water utilities), and the public financial corporations sector (which includes agencies mainly engaged in financial activities, such as the Western Australian Treasury Corporation, the Insurance Commission of Western Australia, and Keystart).
$m $m $m $m $m $mNet operating balance 286 2,590 1,853 192 642 716Net worth 101,002 101,938 102,264 100,593Movement in cash balances 1,683 2,891 560 201 -685 -1,863Memorandum itemsNet lending -1,479 1,613 1,935 607 -401 -1,051Net debt 34,532 36,173 34,915 35,462Cash surplus/-deficit 601 3,241 1,961 526 -388 -924
Nine Months to 31 Mar Actual (b)
Nine Months to 31 Mar
Estimated Outturn (a)
2019-20 2018-19
Three Months to 31 Mar
Three Months to 31 Mar

Overv iew
11
Table 3 TOTAL PUBLIC SECTOR OPERATING BALANCE
By Sector
(a) Consistent with the estimated outcome published in the 2019-20 Mid-year Review, released on 18 December 2019. (b) Consistent with the final audited data contained in the 2018-19 Annual Report on State Finances, released on 27 September 2019. (c) Dividends received from Keystart (a public financial corporation) by the Housing Authority (a public non-financial corporation). (d) Depreciation costs incurred by agencies for right of use assets leased from other agencies within the same sub-sector of government are
eliminated directly on consolidation. Equivalent costs between internal sectors of government contribute to expenses (and the operating balance) in the sector in which the lessee is classified, but is not matched by a ‘depreciation revenue’ by the sector in which the lessor is classified. This gives rise to an adjustment against equity for this unmatched internal cost when consolidating the total public sector.
Balance Sheet
The value of the total public sector balance sheet (measured by net worth, or total assets less total liabilities) is identical to that of the general government sector (discussed earlier). This is because the net worth of the public corporations sectors is recognised as an investment asset of the general government sector.
Adjusting the 30 June 2019 outcome for the estimated impact of AASB 16, total public sector net debt declined by $3 billion during the nine months to 31 March 2020 to stand at $34.5 billion. This improvement was mainly reflected in higher liquid financial assets (which are offset against gross debt liabilities when calculating net debt). These assets increased by $2.7 billion for the March quarter, due primarily to higher general government sector and Western Australian Treasury Corporation investment asset holdings.
Cash Flow
A cash surplus of $3.2 billion was recorded for the total public sector for the nine months to 31 March 2020, due mainly to the general government cash outcome noted earlier. Total public sector infrastructure investment was $3.7 billion over the nine months to 31 March 2020, $317 million higher than the same period in 2018-19. This higher level of spending is mainly due to higher capital expenditure on METRONET projects by the Public Transport Authority, and higher investment by Western Power.
$m $m $m $m $m $mNet Operating Balance
General government sector 129 2,439 2,589 -20 62 1,317Public non-financial corporations sector 257 274 534 300 734 648Public financial corporations sector -102 212 109 -68 194 161
lessGeneral government dividend revenue - 339 1,334 19 348 1,350Public non-financial corporations dividend
revenue (c) - - 70 - - 61Agency depreciation costs on right of use assets
leased from other government sectors (d) -3 -3 -26 - - - Total public sector net operating balance 286 2,590 1,853 192 642 716
Actual (b)Nine Months
to 31 MarEstimated Outturn (a)
Nine Months to 31 Mar
2019-20 2018-19
Three Months to 31 Mar
Three Months to 31 Mar

2019-20 Quarterly Financial Results Report
12
Figure 6 ASSET INVESTMENT PROGRAM ( a )
Nine months to 31 March 2020
(a) Segments may not add due to rounding.
Other Agencies$495m13%
Commissioner of Main Roads$855m23%
Water Corporation$464m13%
Education$317m
9%
Public Transport Authority$442m12%
Port Authorities$112m
3%
Justice$99m3%
Health$111m
3%
Electricity Utilities$681m19%
Local Government, Sport and Cultural
Industries$88m2%
TOTAL$3,665m

13
A P P E N D I X 1
Interim Financial Statements
Contents Page Introduction 13 General Government Table 1.1: Operating Statement ............................................................................. 14 Table 1.2: Balance Sheet ....................................................................................... 15 Table 1.3: Statement of Changes in Equity ........................................................... 16 Table 1.4: Cash Flow Statement............................................................................ 17 Total Public Sector Table 1.5: Operating Statement ............................................................................. 18 Table 1.6: Balance Sheet ....................................................................................... 19 Table 1.7: Statement of Changes in Equity ........................................................... 20 Table 1.8: Cash Flow Statement............................................................................ 21 Notes to the Consolidated Financial Statements 1 Statement of significant accounting policies ...................................................... 22 2 Operating revenue .............................................................................................. 23 3 Transfer expenses ............................................................................................... 23 4 Convergence differences .................................................................................... 24 5 Investments, loans and placements .................................................................... 24 6 Receivables ........................................................................................................ 25 7 Borrowings ......................................................................................................... 25 8 Details of agencies consolidated ........................................................................ 25 9 Contingent assets and liabilities ......................................................................... 25
Introduction
Financial information presented in this appendix has been prepared in accordance with Australian Accounting Standards and pronouncements, including AASB 134: Interim Financial Reporting, AASB 1049: Whole of Government and General Government Sector Financial Reporting, and requirements of the Government Financial Responsibility Act 2000. The formats used in this report are the same as those used in 2019-20 State Budget Papers presented to the Legislative Assembly on 9 May 2019, facilitating comparisons between estimates and outturns.
These financial statements (Operating Statement, Balance Sheet and Cash Flow Statement) also comply with Uniform Presentation Framework (UPF) disclosure requirements to assist with comparison to reporting in the Budget, Mid-year Review and the Annual Report on State Finances. Disclosures consistent with other UPF disclosure requirements are included in the notes to the financial statements, and in Appendix 2 of this report.

2019-20 Quarterly Financial Results Report
14
Table 1.1 GENERAL GOVERNMENT OPERATING STATEMENT
(a) Consistent with the estimated outcome published in the 2019-20 Mid-year Review, released on 18 December 2019. (b) Consistent with the final audited data contained in the 2018-19 Annual Report on State Finances, released on 27 September 2019. Note: Columns may not add due to rounding. The accompanying notes form part of these statements.
Note
RESULTS FROM TRANSACTIONS $m $m $m $m $m $m
REVENUE Taxation 2,115 7,202 9,011 1,908 6,751 8,616Current grants and subsidies 2,075 7,057 9,573 2,673 7,471 10,210Capital grants 126 283 980 291 624 873Sales of goods and services 692 2,138 2,796 663 1,987 2,734Interest Income 29 98 148 42 128 168Revenue from public corporations
Dividends from other sectors - 339 1,334 19 348 1,350Tax equivalent income 185 508 628 160 422 642
Royalty income 1,937 6,142 7,505 1,498 4,351 6,713Other 173 468 577 187 463 701Total 2 7,334 24,234 32,553 7,441 22,545 32,006
EXPENSESSalaries 3,146 9,499 12,595 2,982 9,097 12,269Superannuation
Concurrent costs 312 940 1,242 294 896 1,213Superannuation interest cost -8 41 79 11 87 135
Other employee costs 119 285 350 104 315 447Depreciation and amortisation 436 1,311 1,852 359 1,066 1,445Services and contracts 552 1,849 2,877 589 1,794 2,538Other gross operating expenses 1,280 4,025 5,035 1,242 4,197 5,645Interest
Interest on leases 31 106 168 21 63 89Other interest 179 563 745 215 647 859
Current transfers 3 1,129 3,092 4,778 1,474 3,894 5,426Capital transfers 3 28 85 243 170 428 625Total 7,205 21,795 29,964 7,461 22,483 30,689
NET OPERATING BALANCE 129 2,439 2,589 -20 62 1,317
Other economic flows - included in the operating resultNet gains on assets/liabilities -2 4 -106 170 131 59Provision for doubtful debts -3 -4 -14 -1 -6 2Changes in accounting policy/adjustments of prior periods 127 -148 - -299 -352 -172Total other economic flows 122 -149 -119 -130 -227 -111
OPERATING RESULT 251 2,291 2,469 -150 -164 1,206
All other movements in equityItems that will not be reclassified to operating resultRevaluations -10 -71 682 -166 -325 -1,374Net actuarial gains/-loss - superannuation -877 -830 -447 -202 -670 -814Gains recognised directly in equity -4 -10 -71 - - -Change in net worth of the public corporations sectors -557 -971 -495 373 188 -1,661All other - - - - - -Total all other movements in equity -1,448 -1,882 -331 5 -807 -3,849
TOTAL CHANGE IN NET WORTH -1,197 409 2,139 -145 -971 -2,642
KEY FISCAL AGGREGATES
NET OPERATING BALANCE 129 2,439 2,589 -20 62 1,317
Less Net acquisition of non-financial assetsPurchase of non-financial assets 632 1,754 2,563 487 1,670 2,540Changes in inventories 9 10 1 -3 4 -Other movement in non-financial assets 25 21 -13 -2 65 146less:Sales of non-financial assets 17 1,456 1,539 15 51 100Depreciation 436 1,311 1,852 359 1,066 1,445Total net acquisition of non-financial assets 212 -982 -840 109 622 1,142
NET LENDING/-BORROWING -83 3,421 3,429 -129 -560 175
2019-20 2018-19
Three Months to 31 Mar
Nine Months to 31 Mar
Estimated Outturn (a)
Three Months to 31 Mar
Nine Months to 31 Mar Actual (b)

Appendix 1
15
Table 1.2 GENERAL GOVERNMENT BALANCE SHEET
(a) Consistent with the estimated outcome published in the 2019-20 Mid-year Review, released on 18 December 2019. (b) Consistent with the final audited data contained in the 2018-19 Annual Report on State Finances, released on 27 September 2019. Note: Columns may not add due to rounding. The accompanying notes form part of these statements.
31 Mar 30 June 31 Mar 30 June
Note 2020 2020 (a) 2019 2019 (b)
$m $m $m $mASSETS
Financial assetsCash and deposits 852 967 642 601Advances paid 732 740 745 713Investments, loans and placements 5 5,576 4,697 4,448 4,470Receivables 6 3,730 3,303 3,283 3,999Shares and other equity
Investments in other public sector entities - equity method 39,775 40,250 42,595 40,745Investments in other public sector entities - direct injections 10,308 11,083 9,769 10,000Investments in other entities 20 20 15 20
Other financial assets 8 17 8 8Total financial assets 61,001 61,077 61,505 60,556
Non-financial assetsLand 35,591 36,293 36,019 35,600Property, plant and equipment 48,027 48,553 45,388 45,344Biological assets 3 3 3 3Inventories
Land inventories - - - -Other inventories 81 71 74 71
Intangibles 604 578 590 626Assets classified as held for sale 20 43 27 43Investment property 7 - 7 7Other 261 187 304 245Total non-financial assets 84,593 85,728 82,412 81,940
TOTAL ASSETS 145,594 146,805 143,917 142,496
LIABILITIES
Deposits held 569 951 797 686Advances received 343 351 360 343Borrowings 7
Lease liabilities 3,106 3,157 1,183 1,156Other borrowings 25,159 25,195 26,685 26,589
Unfunded superannuation 7,656 7,102 6,943 7,062Other employee benefits 3,526 3,237 3,290 3,197Payables 1,345 1,412 982 1,425Other liabilities 2,888 3,461 1,413 1,445TOTAL LIABILITIES 44,593 44,868 41,653 41,903
NET ASSETS 101,002 101,938 102,264 100,593Of which:Contributed equity - - - -Accumulated surplus 7,805 9,202 5,096 6,317Other reserves 93,197 92,736 97,168 94,276NET WORTH 101,002 101,938 102,264 100,593
MEMORANDUM ITEMS
Net financial worth 16,409 16,210 19,852 18,653Net financial liabilities 33,674 35,124 32,511 32,091
Net debtGross debt liabilities 29,177 29,654 29,025 28,774less: liquid financial assets 7,161 6,403 5,836 5,784less: convergence differences impacting net debt - - - -Net debt 22,017 23,251 23,190 22,990
For the period ending

2019-20 Quarterly Financial Results Report
16
Table 1.3 GENERAL GOVERNMENT STATEMENT OF CHANGES IN EQUITY
For the nine months ended 31 March 2019
For the nine months ended 31 March 2020
Note: Columns/rows may not add due to rounding.
Asset Revaluation
Surplus
Accumulatednet gain on
equity investments
in other sector entities
AccumulatedSurplus/deficit
TotalEquity
$m $m $m $m
Balance at 1 July 2018 54,923 42,406 5,907 103,236Operating result - - -164 -164All other movements in equity -350 188 -646 -807
Total change in net worth -350 188 -810 -971
Balance at 31 March 2019 54,573 42,595 5,096 102,264
Asset Revaluation
Surplus
Accumulatednet gain on
equity investments
in other sector entities
AccumulatedSurplus/deficit
TotalEquity
$m $m $m $m
Balance at 1 July 2019 53,531 40,745 6,317 100,593Operating result - - 2,291 2,291All other movements in equity -108 -971 -803 -1,882
Total change in net worth -108 -971 1,488 409
Balance at 31 March 2020 53,422 39,775 7,805 101,002

Appendix 1
17
Table 1.4 GENERAL GOVERNMENT CASH FLOW STATEMENT
(a) Consistent with the estimated outcome published in the 2019-20 Mid-year Review, released on 18 December 2019. (b) Consistent with the final audited data contained in the 2018-19 Annual Report on State Finances, released on 27 September 2019. Note: Columns may not add due to rounding. The accompanying notes form part of these statements.
CASH FLOWS FROM OPERATING ACTIVITIES $m $m $m $m $m $m
Cash receivedTaxes received 2,196 6,869 9,022 2,072 6,787 8,911Grants and subsidies received 3,004 8,865 11,788 3,001 8,095 11,082Receipts from sales of goods and services 647 2,043 2,796 608 1,828 2,599Interest receipts 27 90 143 38 119 173Dividends and tax equivalents 165 850 2,002 144 890 2,092Other 2,436 8,375 10,099 1,954 5,623 7,659Total cash received 8,475 27,093 35,850 7,816 23,341 32,517
Cash paidWages, salaries and supplements, and superannuation -3,303 -10,383 -14,285 -3,189 -10,094 -13,766Payments for goods and services -1,968 -6,432 -8,361 -1,906 -6,489 -8,473Interest paid -221 -690 -936 -240 -705 -950Grants and subsidies paid -1,771 -4,440 -6,166 -1,463 -3,976 -5,635Dividends and tax equivalents - - - - - -Other -409 -1,500 -1,780 -362 -1,246 -1,679Total cash paid -7,672 -23,446 -31,527 -7,160 -22,509 -30,503
NET CASH FLOWS FROM OPERATING ACTIVITIES 802 3,647 4,323 656 832 2,014
CASH FLOWS FROM INVESTING ACTIVITIES
Cash flows from investments in non-financial assetsPurchase of non-financial assets -632 -1,754 -2,563 -487 -1,670 -2,540Sales of non-financial assets 17 1,456 1,539 15 51 100Total cash flows from investments in non-financial assets -615 -299 -1,024 -472 -1,619 -2,441
Cash flows from investments in financial assetsCash receivedFor policy purposes 7 17 10 4 29 33For liquidity purposes -24 36 117 217 245 308Cash paidFor policy purposes -143 -417 -1,285 -306 -603 -790For liquidity purposes -11 -19 -38 -18 -42 -66Total cash flows from investments in financial assets -170 -383 -1,196 -103 -370 -516
NET CASH FLOWS FROM INVESTING ACTIVITIES -785 -682 -2,220 -575 -1,989 -2,956CASH FLOWS FROM FINANCING ACTIVITIES
Cash receivedAdvances received - - 17 - - 17Borrowings 12 46 166 11 46 61Deposits received - - - - - -Other financing receipts 24 197 140 11 193 253Total cash received 36 243 323 22 240 330
Cash paidAdvances paid - - -17 - - -17Borrowings repaid -82 -1,356 -1,443 -258 -285 -513Deposits paid - - - - - -Other financing payments -64 -359 -511 -53 -187 -214Total cash paid -146 -1,715 -1,970 -312 -472 -744
NET CASH FLOWS FROM FINANCING ACTIVITIES -110 -1,472 -1,647 -289 -232 -414
Net increase in cash and cash equivalents -93 1,493 456 -209 -1,389 -1,355Cash and cash equivalents at the beginning of the year 6,591 5,005 5,005 5,180 6,360 6,360Cash and cash equivalents at the end of the year 6,498 6,498 5,460 4,971 4,971 5,005KEY FISCAL AGGREGATESNet cash flows from operating activities 802 3,647 4,323 656 832 2,014Net cash flows from investing in non-financial assets -615 -299 -1,024 -472 -1,619 -2,441Cash surplus/-deficit 187 3,348 3,299 183 -787 -426
2019-20 2018-19
Three Months to 31 Mar
Nine Months to 31 Mar
Estimated Outturn (a)
Three Months to 31 Mar
Nine Months to 31 Mar Actual (b)

2019-20 Quarterly Financial Results Report
18
Table 1.5 TOTAL PUBLIC SECTOR OPERATING STATEMENT
(a) Consistent with the estimated outcome published in the 2019-20 Mid-year Review, released on 18 December 2019. (b) Consistent with the final audited data contained in the 2018-19 Annual Report on State Finances, released on 27 September 2019. Note: Columns may not add due to rounding. The accompanying notes form part of these statements.
Note
Results from Transactions $m $m $m $m $m $mREVENUETaxation 1,984 6,803 8,485 1,772 6,355 8,097Current grants and subsidies 2,075 7,057 9,573 2,673 7,471 10,210Capital grants 126 283 980 291 624 873Sales of goods and services 9,627 28,853 37,887 5,951 17,969 23,488Interest Income 125 410 674 141 451 639Royalty income 1,937 6,142 7,505 1,498 4,351 6,713Other 251 768 1,032 330 827 1,193Total 2 16,125 50,316 66,136 12,655 38,049 51,214
EXPENSESSalaries 3,421 10,401 13,872 3,261 9,969 13,382Superannuation
Concurrent costs 339 1,029 1,368 344 1,005 1,323Superannuation interest cost -8 41 79 11 87 135
Other employee costs 91 270 296 80 239 350Depreciation and amortisation 949 2,893 3,962 866 2,572 3,431Services and contracts 720 2,374 3,526 726 2,287 3,306Other gross operating expenses 9,207 27,081 35,509 5,447 16,580 22,084Interest
Interest on leases 54 174 262 42 127 174Other interest 313 1,023 1,533 372 1,169 1,583
Other property expenses - - - - - -Current transfers 3 723 2,349 3,680 1,264 3,222 4,411Capital transfers 3 28 91 196 51 150 319Total 15,839 47,726 64,283 12,463 37,407 50,498
NET OPERATING BALANCE 286 2,590 1,853 192 642 716
Other economic flows - included in the operating resultNet gains on assets/liabilities -665 -519 86 439 124 254Provision for doubtful debts -16 -21 -51 -14 -31 -16Changes in accounting policy/adjustment of prior periods 107 -232 - -366 -480 -310Total other economic flows -574 -772 35 59 -387 -72
OPERATING RESULT -287 1,818 1,888 252 255 644
All other movements in equityItems that will not be reclassified to operating resultRevaluations -20 -560 794 -190 -555 -2,444Net actuarial gains/-loss - superannuation -883 -837 -449 -207 -678 -850Gains recognised directly in equity -7 -12 -95 - 6 8All other - - - - - -Total all other movements in equity -910 -1,410 250 -397 -1,227 -3,286
TOTAL CHANGE IN NET WORTH -1,197 409 2,139 -145 -971 -2,642
KEY FISCAL AGGREGATES
NET OPERATING BALANCE 286 2,590 1,853 192 642 716Less Net acquisition of non-financial assetsPurchase of non-financial assets 1,246 3,665 5,646 953 3,348 4,965Changes in inventories 1,529 1,800 84 -449 384 614Other movement in non-financial assets 40 88 139 28 158 273less:Sales of non-financial assets 100 1,682 1,988 80 275 654Depreciation 949 2,893 3,962 866 2,572 3,431Total net acquisition of non-financial assets 1,765 977 -81 -414 1,043 1,767
NET LENDING/-BORROWING -1,479 1,613 1,935 607 -401 -1,051
2019-20 2018-19
Three Months to 31 Mar
Nine Months to 31 Mar
Estimated Outturn (a)
Three Months to 31 Mar
Nine Months to 31 Mar Actual (b)

Appendix 1
19
Table 1.6 TOTAL PUBLIC SECTOR BALANCE SHEET
(a) Consistent with the estimated outcome published in the 2019-20 Mid-year Review, released on 18 December 2019. (b) Consistent with the final audited data contained in the 2018-19 Annual Report on State Finances, released on 27 September 2019. Note: Columns may not add due to rounding. The accompanying notes form part of these statements.
31 Mar 30 June 31 Mar 30 JuneNote 2020 2020 (a) 2019 2019 (b)
$m $m $m $mASSETS
Financial assetsCash and deposits 2,386 1,889 1,454 1,517Advances paid 5,170 5,393 4,683 4,782Investments, loans and placements 5 21,015 19,840 16,684 19,567Receivables 6 5,603 5,255 4,980 5,825Equity - investments in other entities 1,622 2,087 1,815 1,920Other financial assets 17 22 13 13Total financial assets 35,814 34,486 29,629 33,624
Non-financial assetsLand 43,710 44,373 44,780 43,809Property, plant and equipment 103,758 105,232 101,133 101,099Biological assets 343 200 332 345Inventories
Land inventories 1,836 2,022 1,868 1,852Other inventories 6,145 4,429 4,115 4,345
Intangibles 1,106 968 971 1,028Assets classified as held for sale 26 54 31 59Investment property 67 53 68 67Other 404 327 446 381Total non-financial assets 157,396 157,658 153,744 152,985
TOTAL ASSETS 193,209 192,144 183,373 186,610
LIABILITIES
Deposits held 19 11 18 11Advances received 343 351 360 343Borrowings 7
Lease liabilities 4,114 4,171 1,939 1,902Other borrowings 58,627 58,762 55,419 59,072
Unfunded superannuation 7,742 7,194 7,057 7,165Other employee benefits 3,929 3,617 3,664 3,577Payables 9,033 7,260 6,374 7,211Other liabilities 8,401 8,840 6,277 6,736TOTAL LIABILITIES 92,208 90,207 81,109 86,017
NET ASSETS 101,002 101,938 102,264 100,593
Of which:Contributed equity - - - -Accumulated surplus 27,066 29,334 25,852 26,056Other reserves 73,936 72,604 76,412 74,537NET WORTH 101,002 101,938 102,264 100,593MEMORANDUM ITEMS
Net financial worth -56,394 -55,720 -51,480 -52,392Net financial liabilities 56,394 55,720 51,480 52,392
Net debtGross debt liabilities 63,103 63,295 57,736 61,329less : liquid financial assets 28,571 27,122 22,821 25,867less: convergence differences impacting net debt - - - -Net debt 34,532 36,173 34,915 35,462
For the period ending
2019-20 Quarterly Financial Results Report
20
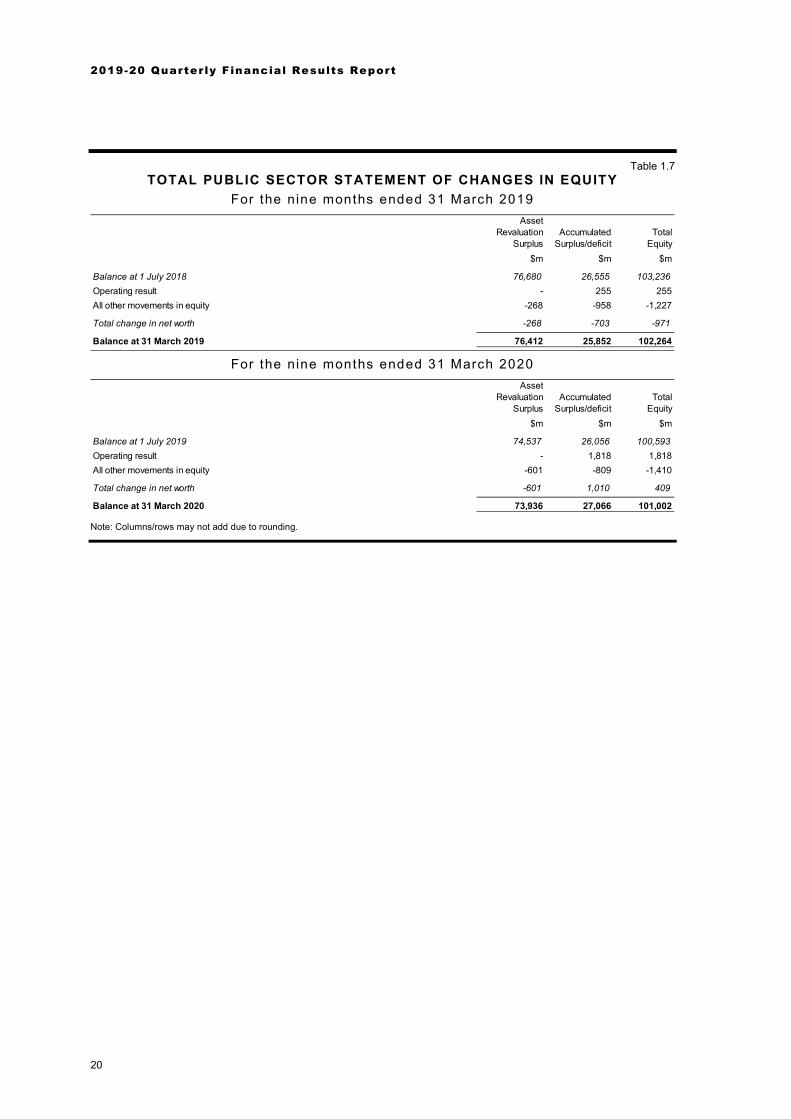
Table 1.7 TOTAL PUBLIC SECTOR STATEMENT OF CHANGES IN EQUITY
For the nine months ended 31 March 2019
For the nine months ended 31 March 2020
Note: Columns/rows may not add due to rounding.
Asset Revaluation
SurplusAccumulated
Surplus/deficitTotal
Equity$m $m $m
Balance at 1 July 2018 76,680 26,555 103,236Operating result - 255 255All other movements in equity -268 -958 -1,227
Total change in net worth -268 -703 -971
Balance at 31 March 2019 76,412 25,852 102,264
Asset Revaluation
SurplusAccumulated
Surplus/deficitTotal
Equity$m $m $m
Balance at 1 July 2019 74,537 26,056 100,593Operating result - 1,818 1,818All other movements in equity -601 -809 -1,410
Total change in net worth -601 1,010 409
Balance at 31 March 2020 73,936 27,066 101,002

Appendix 1
21
Table 1.8 TOTAL PUBLIC SECTOR CASH FLOW STATEMENT
(a) Consistent with the estimated outcome published in the 2019-20 Mid-year Review, released on 18 December 2019. (b) Consistent with the final audited data contained in the 2018-19 Annual Report on State Finances, released on 27 September 2019. Note: Columns may not add due to rounding. The accompanying notes form part of these statements.
$m $m $m $m $m $mCASH FLOWS FROM OPERATING ACTIVITIES
Cash receivedTaxes received 2,100 6,621 8,486 1,978 6,528 8,392Grants and subsidies received 3,004 8,865 11,788 3,001 8,095 11,082Receipts from sales of goods and services 6,858 19,849 25,365 5,829 17,803 23,693Interest receipts 134 442 647 147 471 661Other receipts 2,711 9,260 10,833 2,169 6,517 8,807Total cash received 14,808 45,037 57,119 13,125 39,415 52,635
Cash paidWages, salaries and supplements, and superannuation -3,591 -11,376 -15,712 -3,507 -11,059 -15,062Payments for goods and services -6,456 -19,562 -24,575 -5,531 -17,700 -23,421Interest paid -494 -1,463 -1,767 -513 -1,503 -2,017Grants and subsidies paid -1,387 -3,621 -4,819 -1,189 -3,010 -4,129Other payments -1,132 -3,792 -4,629 -986 -3,458 -4,620Total cash paid -13,060 -39,814 -51,501 -11,726 -36,730 -49,248
NET CASH FLOWS FROM OPERATING ACTIVITIES 1,747 5,223 5,618 1,398 2,685 3,386
CASH FLOWS FROM INVESTING ACTIVITIES
Cash flows from investments in non-financial assetsPurchase of non-financial assets -1,246 -3,665 -5,646 -953 -3,348 -4,965Sales of non-financial assets 100 1,682 1,988 80 275 654Total cash flows from investments in non-financial assets -1,146 -1,982 -3,658 -872 -3,073 -4,310
Cash flows from investments in financial assetsCash receivedFor policy purposes 7 17 10 4 17 21For liquidity purposes 2,523 10,010 6,708 1,336 5,401 6,495Cash paidFor policy purposes -7 -16 -10 -5 -16 -19For liquidity purposes -4,328 -10,637 -7,418 -1,982 -5,312 -8,784Total cash flows from investments in financial assets -1,805 -626 -710 -647 90 -2,286
NET CASH FLOWS FROM INVESTING ACTIVITIES -2,951 -2,609 -4,367 -1,519 -2,984 -6,597
CASH FLOWS FROM FINANCING ACTIVITIES
Cash receivedAdvances received - - - - - -Borrowings 8,272 15,709 18,481 6,289 16,460 21,444Deposits received - - - - - -Other financing receipts 26 115 49 12 37 98Total cash received 8,299 15,824 18,530 6,301 16,497 21,542
Cash paidAdvances paid - - -17 - - -17Borrowings repaid -5,365 -15,206 -18,752 -5,901 -16,705 -19,990Deposits paid - - - - - -Other financing payments -46 -342 -452 -78 -178 -188Total cash paid -5,412 -15,548 -19,221 -5,979 -16,884 -20,194
NET CASH FLOWS FROM FINANCING ACTIVITIES 2,887 276 -691 322 -387 1,348Net increase in cash and cash equivalents 1,683 2,891 560 201 -685 -1,863Cash and cash equivalents at the beginning of the year 9,918 8,710 8,710 9,687 10,573 10,573Cash and cash equivalents at the end of the year 11,601 11,601 9,270 9,888 9,888 8,710KEY FISCAL AGGREGATESNet cash flows from operating activities 1,747 5,223 5,618 1,398 2,685 3,386Net cash flows from investing in non-financial assets -1,146 -1,982 -3,658 -872 -3,073 -4,310Cash surplus/-deficit 601 3,241 1,961 526 -388 -924
2019-20 2018-19
Three Months to 31 Mar
Nine Months to 31 Mar
Estimated Outturn (a)
Three Months to 31 Mar
Nine Months to 31 Mar Actual (b)

2019-20 Quarterly Financial Results Report
22
Notes to the Interim Financial Statements
NOTE 1: STATEMENT OF SIGNIFICANT ACCOUNTING POLICIES
(a) General Statement
The financial statements in this appendix constitute general purpose financial statements for the general government sector and the whole-of-government. The whole-of-government is also known as the total public sector.
The quarterly financial statements are a requirement of the Government Financial Responsibility Act 2000.
(b) The Reporting Entity The reporting entity is the Government of Western Australia (the total public sector) and includes entities under its control.
The total public sector includes the general government sector and the public corporations sector. The general government sector consists of those agencies and Crown entities that provide services that are predominantly funded from central revenue. Public corporations generally seek to recover the majority of the costs of operations through user charges and other own-source revenue.
(c) Basis of Preparation
The financial statements for the nine months ended 31 March 2020 have been prepared in accordance with Australian Accounting Standards, in particular AASB 134: Interim Financial Reporting, and AASB 1049: Whole of Government and General Government Sector Financial Reporting and other authoritative pronouncements of the AASB.
The ABS Government Finance Statistics (GFS) Manual provides the basis upon which GFS information that is contained in the financial statements is prepared. In particular, notes disclosing key financial aggregates of net worth, total change in net worth, net operating balance, net lending/-borrowing and cash surplus/-deficit determined using the principles and rules in the ABS GFS Manual are included in the financial statements, together with a reconciliation of those key fiscal aggregates to the corresponding key fiscal aggregates recognised in the financial statements.
This interim financial report does not include all the note disclosures that are included in an annual financial report. Accordingly, this report is to be read in conjunction with the audited Consolidated Financial Statements for the year ended 30 June 2019, presented in Appendix 1 of the 2018-19 Annual Report on State Finances (ARSF) released on 27 September 2019. The accounting policies adopted in this publication are consistent with those outlined in the 2018-19 ARSF. The specific accounting policies of the Government of Western Australia are described in Note 3: Summary of Significant Accounting Policies in Appendix 1 of the 2018-19 ARSF.
The Interim Financial Statements are presented in Australian dollars and all amounts are rounded to the nearest million dollars ($m). As a consequence, totals and sub-totals quoted in this report may not add due to rounding.
(d) Unaudited Data
The Interim Financial Statements are not audited.

Appendix 1
23
NOTE 2: OPERATING REVENUE
Details of general government sector and total public sector operating revenue is included in Appendix 2: Operating Revenue.
NOTE 3: TRANSFER EXPENSES
Transfer expenses are defined as the provision of something of value for no specific return or consideration and include grants, subsidies, donations, transfers of assets free of charge, etc. The following tables provide detail of current and capital transfer expenses of the general government sector and total public sector.
TRANSFER EXPENSES ( a )
(a) Includes grants, subsidies and other transfer expenses. (b) Consistent with the estimated outcome published in the 2019-20 Mid-year Review, released on 18 December 2019. (c) Consistent with the final audited data contained in the 2018-19 Annual Report on State Finances, released on 27 September 2019. Note: Columns may not add due to rounding.
Three Months
to 31 Mar
NineMonths
to 31 MarEstimated
Outturn (b)
Three Months
to 31 Mar
NineMonths
to 31 Mar Actual (c)
$m $m $m $m
CURRENT TRANSFERSLocal Government 59 198 399 77 268 384 Local Government on-passing - - - 22 67 181 Private and Not-for-profit sector 317 1,182 1,649 293 990 1,377 Private and Not-for-profit sector on-passing - - - 667 1,294 1,323 Other sectors of Government 753 1,712 2,731 414 1,275 2,161 Total Current Transfers 1,129 3,092 4,778 1,474 3,894 5,426 CAPITAL TRANSFERSLocal Government 5 19 60 4 13 64 Local Government on-passing - - - 14 43 118 Private and Not-for-profit sector 15 48 124 23 57 87 Private and Not-for-profit sector on-passing - - - 3 13 18 Other sectors of Government 7 19 59 125 302 338 Total Capital Transfers 28 85 243 170 428 625
Three Months
to 31 Mar
NineMonths
to 31 MarEstimated
Outturn (b)
Three Months
to 31 Mar
NineMonths
to 31 Mar Actual (c)
$m $m $m $mCURRENT TRANSFERSLocal Government 59 198 399 77 268 385 Local Government on-passing - - - 22 67 181 Private and Not-for-profit sector 516 1,799 2,508 497 1,586 2,185 Private and Not-for-profit sector on-passing - - - 667 1,294 1,323 Other sectors of Government 147 352 773 1 6 337 Total Current Transfers 723 2,349 3,680 1,264 3,222 4,411 CAPITAL TRANSFERSLocal Government 5 19 60 4 13 65 Local Government on-passing - - - 14 43 118 Private and Not-for-profit sector 23 72 136 29 81 119 Private and Not-for-profit sector on-passing - - - 3 13 18 Other sectors of Government - - - - - - Total Capital Transfers 28 91 196 51 150 319
General Government
Total Public Sector
2019-20 2018-19
2019-20 2018-19

2019-20 Quarterly Financial Results Report
24
NOTE 4: CONVERGENCE DIFFERENCES
Where possible, AASB 1049 harmonises GFS and accounting concepts into a single presentation. Where harmonisation cannot be achieved (e.g. the recognition of a doubtful debts provision is excluded from GFS net worth), a convergence difference arises. The standard requires that such differences are disclosed in annual outturn reports at the end of the financial year.
This note usually details all convergence differences for the March 2020 results. However, with the adoption of AASB 16: Leases the distinction between operating leases and finance leases as measured under previous accounting standards has been superseded. Accordingly, convergence data between the AASB 1049 key financial aggregates produced in the March 2020 results and GFS concepts is not currently available. Convergence notes in the most recent audited financial results (included in the 2018-19 Annual Report on State Finances, released in September 2019) show that there have been very few convergence differences in Western Australia’s AASB 1049 disclosures compared with equivalent data presented on a GFS basis. The ABS is currently working with State and Territory Treasuries to develop a methodological solution that will enable the ongoing distinction between operating and finance leases for GFS purposes.
NOTE 5: INVESTMENTS, LOANS AND PLACEMENTS
31 MarEstimated
Outturn 31 Mar Actual$m $m $m $m
InvestmentsTerm deposits 5,559 4,661 4,431 4,452Government securities 3 3 3 3Total 5,562 4,664 4,434 4,455Loans and advancesLoans 15 33 13 15Financial Assets held for trading/available for sale - - - -Total 15 33 13 15Total 5,576 4,697 4,448 4,470
31 MarEstimated
Outturn 31 Mar Actual$m $m $m $m
InvestmentsTerm deposits 14,278 12,068 11,967 11,836Government securities 2,171 2,481 1,290 2,481Total 16,449 14,549 13,257 14,318Loans and advancesLoans 3,864 4,659 2,939 4,618Financial Assets held for trading/available for sale 703 631 489 631Total 4,566 5,291 3,427 5,250Total 21,015 19,840 16,684 19,567
2019-20 2018-19
General Government2019-20 2018-19
Total Public Sector

Appendix 1
25
NOTE 6: RECEIVABLES
NOTE 7: BORROWINGS
NOTE 8: DETAILS OF AGENCIES CONSOLIDATED
The agencies included in these financial statements are detailed in Note 35: Composition of Sectors in the 2018-19 Annual Report on State Finances.
NOTE 9: CONTINGENT ASSETS AND LIABILITIES
Material contingent assets and liabilities were described in the 2018-19 Annual Report on State Finances.
A further contingent liability has since arisen in relation to the Perth Children’s Hospital where additional resources may be required in order to exercise contractual entitlements and to represent the State in legal proceedings advanced by John Holland, the Managing Contractor at the hospital.
31 MarEstimated
Outturn 31 Mar Actual$m $m $m $m
Accounts Receivable 3,906 3,500 3,542 4,195Provision for impairment of receivables -176 -197 -258 -196Total 3,730 3,303 3,283 3,999
31 MarEstimated
Outturn 31 Mar Actual$m $m $m $m
Accounts Receivable 5,881 5,580 5,341 6,117Provision for impairment of receivables -277 -325 -361 -293Total 5,603 5,255 4,980 5,825
2019-20 2018-19
General Government2019-20 2018-19
Total Public Sector
31 MarEstimated
Outturn 31 Mar Actual$m $m $m $m
Bank overdrafts - - - 117Lease liabilities 3,106 3,157 1,183 1,156Borrowings 25,159 25,195 26,685 26,473Total 28,265 28,352 27,868 27,745
31 MarEstimated
Outturn 31 Mar Actual$m $m $m $m
Bank overdrafts 2 1 - 117Lease liabilities 4,114 4,171 1,939 1,902Borrowings 58,625 58,761 55,418 58,956Total 62,741 62,933 57,358 60,974
2019-20 2018-19
General Government
Total Public Sector2019-20 2018-19

2019-20 Quarterly Financial Results Report
26
27
A P P E N D I X 2
Operating Revenue
The tables in this appendix detail operating revenue of the general government and total public sectors. They provide detailed revenue information consistent with the operating statements presented in Appendix 1: Interim Financial Statements.
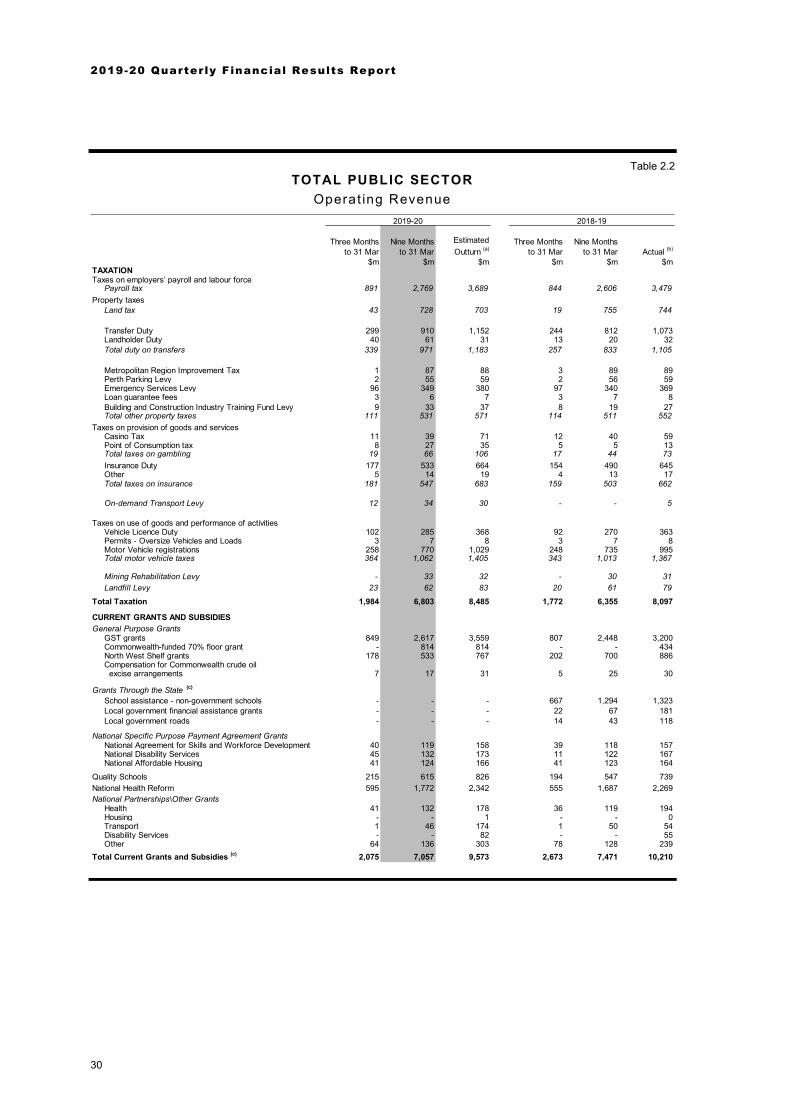
The total public sector consolidates internal transfers between the general government sector and agencies in the public corporations sectors.
Accordingly, some total public sector revenue aggregates may be smaller than the general government equivalent. For example, the general government sector collects payroll tax from some public corporations. These collections are internal to the whole-of-government and are not shown in the total public sector taxation revenue data which is thus smaller in magnitude than the general government taxation revenue aggregate.
Users of this report should note that two new accounting standards became effective from 1 January 2019. These are AASB 15: Revenue From Contracts With Customers and AASB 1058: Income of Not-For-Profit Entities. The key changes from these two standards are in the timing of some revenue recognised over time, and the ‘grossing up’ of some revenue and expenses. These changes are broadly neutral for the operating balance over time (although individual years may move up or down in line with the timing of the spending for which revenue is received, such as Commonwealth infrastructure funding paid in advance of project works carried out by the State in future periods).
Under these standards, revenue is to be recognised if the entity ‘controls’ the good or service before delivering it to the customer. In practical terms, material consequences of these changes for the State’s whole-of-government financial statements will be to:
• remove revenue and expenses where the State acts only as an agent of a third party in a relationship and exerts no control over the underlying assets (for example, general government operating revenue and expenses will be reduced by equivalent amounts to remove on-passed Commonwealth funding for local governments and non-government schools);
• de-recognise Commonwealth revenue paid in advance in earlier years (such as recent transport and hospital infrastructure funding) and then recognise it in future years in line with spending on the works; and
2019-20 Quarterly Financial Results Report
28
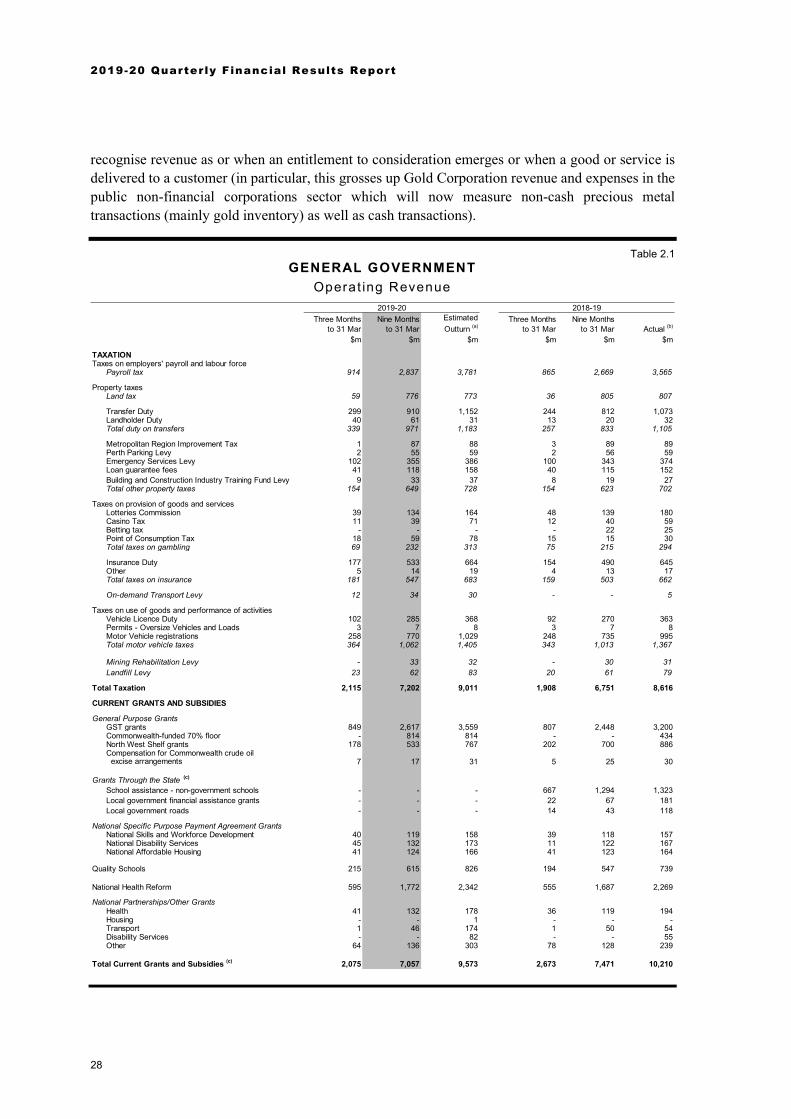
recognise revenue as or when an entitlement to consideration emerges or when a good or service is delivered to a customer (in particular, this grosses up Gold Corporation revenue and expenses in the public non-financial corporations sector which will now measure non-cash precious metal transactions (mainly gold inventory) as well as cash transactions).
Table 2.1 GENERAL GOVERNMENT
Operat ing Revenue
Three Months to 31 Mar
Nine Monthsto 31 Mar
EstimatedOutturn (a)
Three Months to 31 Mar
Nine Monthsto 31 Mar Actual (b)
$m $m $m $m $m $m
TAXATIONTaxes on employers' payroll and labour force
Payroll tax 914 2,837 3,781 865 2,669 3,565
Property taxesLand tax 59 776 773 36 805 807
Transfer Duty 299 910 1,152 244 812 1,073Landholder Duty 40 61 31 13 20 32Total duty on transfers 339 971 1,183 257 833 1,105
Metropolitan Region Improvement Tax 1 87 88 3 89 89Perth Parking Levy 2 55 59 2 56 59Emergency Services Levy 102 355 386 100 343 374Loan guarantee fees 41 118 158 40 115 152Building and Construction Industry Training Fund Levy 9 33 37 8 19 27Total other property taxes 154 649 728 154 623 702
Taxes on provision of goods and servicesLotteries Commission 39 134 164 48 139 180Casino Tax 11 39 71 12 40 59Betting tax - - - - 22 25Point of Consumption Tax 18 59 78 15 15 30Total taxes on gambling 69 232 313 75 215 294
Insurance Duty 177 533 664 154 490 645Other 5 14 19 4 13 17Total taxes on insurance 181 547 683 159 503 662
On-demand Transport Levy 12 34 30 - - 5
Taxes on use of goods and performance of activitiesVehicle Licence Duty 102 285 368 92 270 363Permits - Oversize Vehicles and Loads 3 7 8 3 7 8Motor Vehicle registrations 258 770 1,029 248 735 995Total motor vehicle taxes 364 1,062 1,405 343 1,013 1,367
Mining Rehabilitation Levy - 33 32 - 30 31Landfill Levy 23 62 83 20 61 79
Total Taxation 2,115 7,202 9,011 1,908 6,751 8,616
CURRENT GRANTS AND SUBSIDIES
General Purpose GrantsGST grants 849 2,617 3,559 807 2,448 3,200Commonwealth-funded 70% floor - 814 814 - - 434North West Shelf grants 178 533 767 202 700 886Compensation for Commonwealth crude oil excise arrangements 7 17 31 5 25 30
Grants Through the State (c)
School assistance - non-government schools - - - 667 1,294 1,323Local government financial assistance grants - - - 22 67 181Local government roads - - - 14 43 118
National Specific Purpose Payment Agreement GrantsNational Skills and Workforce Development 40 119 158 39 118 157National Disability Services 45 132 173 11 122 167National Affordable Housing 41 124 166 41 123 164
Quality Schools 215 615 826 194 547 739
National Health Reform 595 1,772 2,342 555 1,687 2,269
National Partnerships/Other GrantsHealth 41 132 178 36 119 194Housing - - 1 - - -Transport 1 46 174 1 50 54Disability Services - - 82 - - 55Other 64 136 303 78 128 239
Total Current Grants and Subsidies (c) 2,075 7,057 9,573 2,673 7,471 10,210
2019-20 2018-19

Appendix 2
29
Table 2.1 (cont.) GENERAL GOVERNMENT
Operat ing Revenue
(a) Consistent with the outcome published in the 2019-20 Mid-year Review, released on 18 December 2019. (b) Consistent with the final audited data contained in the 2018-19 Annual Report on State Finances, released on 27 September 2019. (c) Reporting aggregate impacted by new accounting standards in 2019-20 (see introduction to the appendix). Note: Columns may not add due to rounding.
Three Months to 31 Mar
Nine Monthsto 31 Mar
EstimatedOutturn (a)
Three Months to 31 Mar
Nine Monthsto 31 Mar Actual (b)
$m $m $m $m $m $mCAPITAL GRANTS
Grants Through the State (c)
School assistance - non-government schools - - - 3 13 18
National Partnerships/Other GrantsHousing - - - 121 251 251Transport 126 280 950 167 359 593Other - 4 30 - - 11
Total Capital Grants (c) 126 283 980 291 624 873
SALES OF GOODS AND SERVICES (c) 692 2,138 2,796 663 1,987 2,734
INTEREST INCOME 29 98 148 42 128 168
REVENUE FROM PUBLIC CORPORATIONSDividends - 339 1,334 19 348 1,350Tax Equivalent Regime 185 508 628 160 422 642
Total Revenue from Public Corporations 185 847 1,962 179 770 1,991
ROYALTY INCOME 1,937 6,142 7,505 1,498 4,351 6,713
OTHERLease Rentals 29 89 105 25 82 107Fines 47 142 200 81 174 224Revenue not elsewhere counted 97 237 272 81 206 370
Total Other 173 468 577 187 463 701
GRAND TOTAL 7,334 24,234 32,553 7,441 22,545 32,006
2019-20 2018-19
2019-20 Quarterly Financial Results Report
30
Table 2.2 TOTAL PUBLIC SECTOR
Operat ing Revenue
Three Months to 31 Mar
Nine Monthsto 31 Mar
EstimatedOutturn (a)
Three Months to 31 Mar
Nine Monthsto 31 Mar Actual (b)
$m $m $m $m $m $mTAXATIONTaxes on employers’ payroll and labour force
Payroll tax 891 2,769 3,689 844 2,606 3,479Property taxes
Land tax 43 728 703 19 755 744
Transfer Duty 299 910 1,152 244 812 1,073Landholder Duty 40 61 31 13 20 32Total duty on transfers 339 971 1,183 257 833 1,105
Metropolitan Region Improvement Tax 1 87 88 3 89 89Perth Parking Levy 2 55 59 2 56 59Emergency Services Levy 96 349 380 97 340 369Loan guarantee fees 3 6 7 3 7 8Building and Construction Industry Training Fund Levy 9 33 37 8 19 27Total other property taxes 111 531 571 114 511 552
Taxes on provision of goods and servicesCasino Tax 11 39 71 12 40 59Point of Consumption tax 8 27 35 5 5 13Total taxes on gambling 19 66 106 17 44 73Insurance Duty 177 533 664 154 490 645Other 5 14 19 4 13 17Total taxes on insurance 181 547 683 159 503 662
On-demand Transport Levy 12 34 30 - - 5
Taxes on use of goods and performance of activitiesVehicle Licence Duty 102 285 368 92 270 363Permits - Oversize Vehicles and Loads 3 7 8 3 7 8Motor Vehicle registrations 258 770 1,029 248 735 995Total motor vehicle taxes 364 1,062 1,405 343 1,013 1,367
Mining Rehabilitation Levy - 33 32 - 30 31Landfill Levy 23 62 83 20 61 79
Total Taxation 1,984 6,803 8,485 1,772 6,355 8,097
CURRENT GRANTS AND SUBSIDIESGeneral Purpose Grants
GST grants 849 2,617 3,559 807 2,448 3,200Commonwealth-funded 70% floor grant - 814 814 - - 434North West Shelf grants 178 533 767 202 700 886Compensation for Commonwealth crude oil excise arrangements 7 17 31 5 25 30
Grants Through the State (c)
School assistance - non-government schools - - - 667 1,294 1,323Local government financial assistance grants - - - 22 67 181Local government roads - - - 14 43 118
National Specific Purpose Payment Agreement GrantsNational Agreement for Skills and Workforce Development 40 119 158 39 118 157National Disability Services 45 132 173 11 122 167National Affordable Housing 41 124 166 41 123 164
Quality Schools 215 615 826 194 547 739National Health Reform 595 1,772 2,342 555 1,687 2,269National Partnerships\Other Grants
Health 41 132 178 36 119 194Housing - - 1 - - 0Transport 1 46 174 1 50 54Disability Services - - 82 - - 55Other 64 136 303 78 128 239
Total Current Grants and Subsidies (c) 2,075 7,057 9,573 2,673 7,471 10,210
2018-192019-20

Appendix 2
31
Table 2.2 (cont.) TOTAL PUBLIC SECTOR
Operat ing Revenue
(a) Consistent with the outcome published in the 2019-20 Mid-year Review, released on 18 December 2019. (b) Consistent with the final audited data contained in the 2018-19 Annual Report on State Finances, released on 27 September 2019. (c) Reporting aggregates impacted by new accounting standards in 2019-20 (see introduction to the appendix). Note: Columns may not add due to rounding.
Three Months to 31 Mar
Nine Monthsto 31 Mar
EstimatedOutturn (a)
Three Months to 31 Mar
Nine Monthsto 31 Mar Actual (b)
$m $m $m $m $m $mCAPITAL GRANTS
Grants Through the State (c)
School assistance - non-government schools - - - 3 13 18
National Partnerships/Other GrantsHousing - - - 121 251 251Transport 126 280 950 167 359 593Other - 4 30 - - 11
Total Capital Grants (c) 126 283 980 291 624 873
SALES OF GOODS AND SERVICES (c) 9,627 28,853 37,887 5,951 17,969 23,488
INTEREST INCOME 125 410 674 141 451 639
ROYALTY INCOME 1,937 6,142 7,505 1,498 4,351 6,713
OTHERLease Rentals 29 89 105 25 82 107Fines 48 145 200 82 177 224Revenue not elsewhere counted 174 534 727 223 568 862
Total Other 251 768 1,032 330 827 1,193
GRAND TOTAL 16,125 50,316 66,136 12,655 38,049 51,214
2019-20 2018-19

2019-20 Quarterly Financial Results Report
32
33
A P P E N D I X 3
Public Ledger
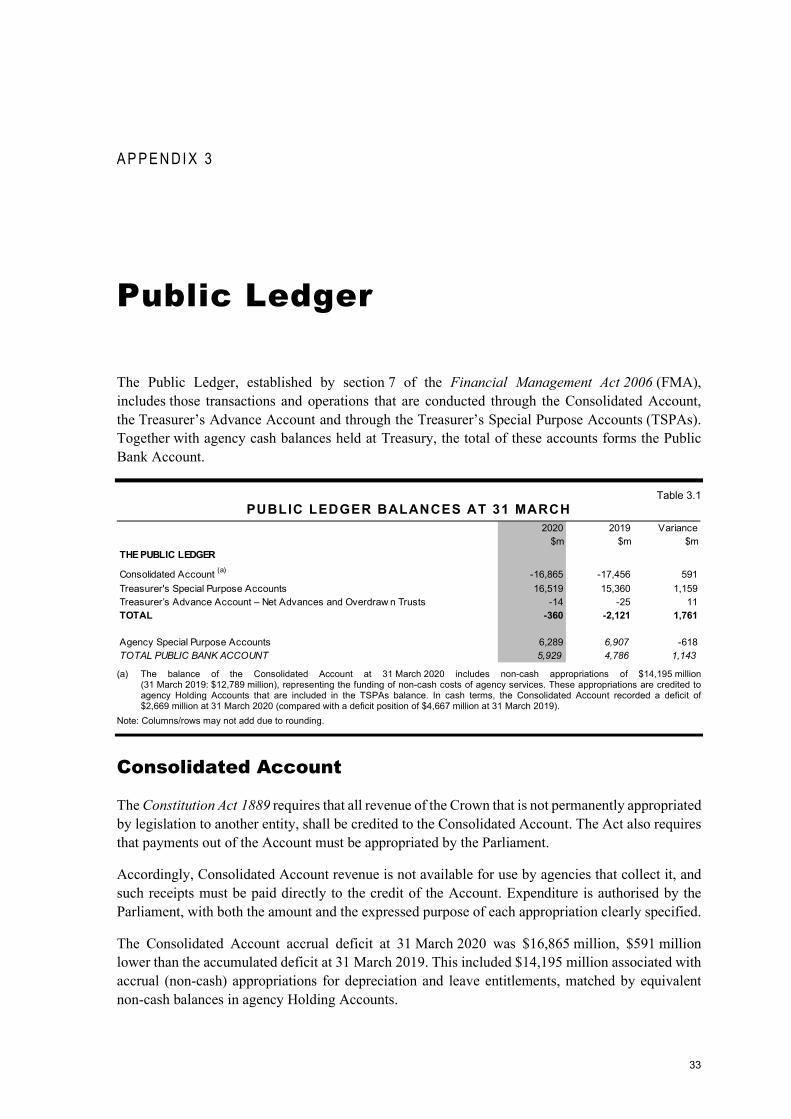
The Public Ledger, established by section 7 of the Financial Management Act 2006 (FMA), includes those transactions and operations that are conducted through the Consolidated Account, the Treasurer’s Advance Account and through the Treasurer’s Special Purpose Accounts (TSPAs). Together with agency cash balances held at Treasury, the total of these accounts forms the Public Bank Account.
Table 3.1 PUBLIC LEDGER BALANCES AT 31 MARCH
(a) The balance of the Consolidated Account at 31 March 2020 includes non-cash appropriations of $14,195 million
(31 March 2019: $12,789 million), representing the funding of non-cash costs of agency services. These appropriations are credited to agency Holding Accounts that are included in the TSPAs balance. In cash terms, the Consolidated Account recorded a deficit of $2,669 million at 31 March 2020 (compared with a deficit position of $4,667 million at 31 March 2019).
Note: Columns/rows may not add due to rounding.
Consolidated Account
The Constitution Act 1889 requires that all revenue of the Crown that is not permanently appropriated by legislation to another entity, shall be credited to the Consolidated Account. The Act also requires that payments out of the Account must be appropriated by the Parliament.
Accordingly, Consolidated Account revenue is not available for use by agencies that collect it, and such receipts must be paid directly to the credit of the Account. Expenditure is authorised by the Parliament, with both the amount and the expressed purpose of each appropriation clearly specified.
The Consolidated Account accrual deficit at 31 March 2020 was $16,865 million, $591 million lower than the accumulated deficit at 31 March 2019. This included $14,195 million associated with accrual (non-cash) appropriations for depreciation and leave entitlements, matched by equivalent non-cash balances in agency Holding Accounts.
2020 2019 Variance$m $m $m
THE PUBLIC LEDGER
Consolidated Account (a) -16,865 -17,456 591Treasurer's Special Purpose Accounts 16,519 15,360 1,159Treasurer’s Advance Account – Net Advances and Overdraw n Trusts -14 -25 11TOTAL -360 -2,121 1,761
Agency Special Purpose Accounts 6,289 6,907 -618TOTAL PUBLIC BANK ACCOUNT 5,929 4,786 1,143

2019-20 Quarterly Financial Results Report
34
In cash terms, the Consolidated Account had a deficit balance of $2,669 million at 31 March 2020, $1,997 million lower than the $4,667 million deficit balance at 31 March 2019.
Borrowings held by the Consolidated Account decreased by $69 million in the March 2020 quarter, and totalled $24.6 billion compared with $26.2 billion in March 2019. Debt repayments for the first nine months of 2020-21 totalled $1.3 billion, which includes the application of $1.2 billion in GST ‘top-up’ funding.
Total proceeds from gross borrowings (i.e. excluding debt repayment) stood at $26.6 billion at 31 March 2020, which remains below the $34.5 billion cumulative limit approved by the Loan Act 2017 and preceding Loan Acts1. The Consolidated Account last drew down new borrowings in April 2018.
1 Proceeds of borrowings by the Consolidated Account (i.e. gross borrowings excluding debt repayments) cannot exceed
the cumulative limit authorised by the Loan Acts.

Appendix 3
35
Table 3.2 CONSOLIDATED ACCOUNT TRANSACTIONS
For the nine months ended 31 March
(a) Amount less than $500,000.
Note: Columns/rows may not add due to rounding.
2020 2019 Variance$m $m $m
REVENUEOperating Activities
Taxation 5,382 5,385 -2Commonw ealth grants 3,181 3,169 12Government enterprises 2,278 944 1,335Revenue from other agencies 7,695 5,035 2,660Other receipts 1,179 470 709
Total Operating Activities 19,716 15,002 4,713
Financing ActivitiesRepayments of recoverable advances 5 5 -(a)
Borrow ings - - -Other receipts 8 10 -3
Total Financing Activities 13 15 -2TOTAL REVENUE 19,729 15,018 4,711EXPENDITURERecurrent
Authorised by other statutes 1,925 2,035 -110Appropriation Act (No. 1) 15,255 14,704 551Recurrent expenditure under the Treasurer’s Advance 20 191 -171
Total Recurrent Expenditure 17,200 16,931 269
Investing ActivitiesAuthorised by other statutes 218 242 -24Appropriation Act (No. 2) 1,221 1,178 43Investing expenditure under the Treasurer’s Advance -(a) 4 -4
Total Investing Activities 1,439 1,424 14
Financing ActivitiesLoan repayments 1,318 242 1,076Other f inancing 7 9 -3
Total Financing Activities 1,324 251 1,073
TOTAL EXPENDITURE 19,963 18,606 1,357NET MOVEMENT (REVENUE LESS EXPENDITURE) -234 -3,588 3,354Consolidated Account Balance
Opening balance at 1 July -16,630 -13,868 -2,763Closing balance at 31 March -16,865 -17,456 591
Of w hich:Appropriations payable -14,195 -12,789 -1,406Cash balance at 31 March -2,669 -4,667 1,997

2019-20 Quarterly Financial Results Report
36
Treasurer’s Special Purpose Accounts
The Treasurer’s Special Purpose Accounts (TSPAs) consist of:
• any account established by the Treasurer as a TSPA for the purposes determined by the Treasurer;
• suspense accounts established for the purposes of section 26 of the FMA;
• any account established to hold money transferred under section 39(5) of the FMA;
• the Public Bank Account Interest Earned Account, established for the purpose of holding money credited to that account under section 38(9) of the FMA pending its allocation and payment as required or permitted under the FMA or another written law;
• any account established under written law and determined by the Treasurer to be a TSPA; and
• any other account established to hold other money and determined by the Treasurer to be a TSPA.
Aggregate TSPA balances at 31 March 2020 were $1,159 million higher than at the same time last year. This mainly reflects:
• higher Holding Account balances for non-cash accrual appropriations to agencies for depreciation and accrued leave entitlements (up $1,406 million);
• a net decrease in the Royalties for Regions Fund (down $296 million), reflecting the timing of appropriation payments to the Fund, and draw downs for approved spending on individual programs;
• an increase in the balance of the Western Australian Future Fund reflecting appropriation of 1% of forecast annual royalty receipts ($64 million) and interest earnings on the balance of the Fund over the last twelve months ($35 million);
• a decrease in the balance of the Commonwealth Grants for Specific Purposes Account (down $92 million), mainly reflecting the return of surplus ‘MyWay’ trial funds to the Consolidated Account and the provision of National Disability Specific Purpose Payment funding to the Department of Communities for on-payment to the National Disability Insurance Agency (for the Commonwealth-administered NDIS); and
• an increase in the balance of agency accounts that hold cash for the cost of an extra pay period which falls due every 11 years (up $44 million).
A number of TSPAs and other agency accounts are discussed in Appendix 4: Special Purpose Accounts.

Appendix 3
37
Table 3.3 TREASURER’S SPECIAL PURPOSE ACCOUNTS
At 31 March
(a) Amount less than $500,000. Note: Columns/rows may not add due to rounding.
Treasurer’s Advance
The Treasurer’s Advance allows for repayable advances to agencies for working capital purposes (known as ‘net recoverable advances’), a short-term advance for any overdrawn agency Special Purpose Accounts, and the provision of supplementary appropriation funding for unforeseen and/or extraordinary events during the year (known as ‘excesses and new items’).
A limit of $658.4 million was authorised under section 29 of the FMA for the year ended 30 June 2020, compared with a total of $652.2 million authorised limit applying at the same time last year. The Treasurer’s Advance Authorisation Act 2020 came into force in April 2020 and increased the limit to $1,658.4 million for the remainder of 2019-20. This Act was passed by the Parliament to deal with the anticipated impact on the Treasurer’s Advance expected to emerge during the June quarter of 2020 in response to the COVID-19 pandemic.
Table 3.4 TREASURER’S ADVANCE AT 31 MARCH
Note: Columns/rows may not add due to rounding.
2020 2019 Variance$m $m $m
Agency Holding Accounts 14,195 12,789 1,406Royalties for Regions Fund 542 838 -296Western Australian Future Fund 1,403 1,304 99National Redress Scheme and Civil Litigation for Survivors of Institutional Child Sexual 150 153 -3 Abuse AccountAgency 27th Pay Accounts 137 93 44Commonw ealth Grants for Specif ic Purposes - 92 -92Other Special Purpose Accounts 91 90 -(a)
TREASURER'S SPECIAL PURPOSE ACCOUNTS AT 31 MARCH 16,519 15,360 1,159
2020 2019 Variance$m $m $m
AUTHORISED LIMIT 658.4 652.2 6.2Total Drawn Against Treasurer’s Advance Account 33.6 220.7 -187.0Comprising:
Net recoverable advances as at 31 March (see below ) 13.7 25.0 -11.3Overdraw n Special Purpose Accounts - - -Excesses and New Items - recurrent 19.8 191.3 -171.5- capital 0.1 4.4 -4.3
NET RECOVERABLE ADVANCESMines Safety 8.0 16.5 -8.5Petroleum and Geothermal Energy Safety 2.0 2.0 -Sport and Recreation 1.1 1.1 -Suitors Fund 2.5 2.5 -Sundry Debtors 0.1 2.7 -2.7Western Australian Energy Disputes Arbitrator - 0.1 -0.1TOTAL RECOVERABLE TREASURER’S ADVANCES 13.7 25.0 -11.3

2019-20 Quarterly Financial Results Report
38
Transfers, Excesses and New Items
Table 3.5 summarises transfers of appropriations between agencies, authorised under section 25 of the FMA (and which have no impact on the Treasurer’s Advance), and excesses and/or new items approved by the Treasurer under the authority of section 27 of the FMA.
Transfers of appropriation funds are for the provision of an approved service which is now delivered by an alternative agency. These transfers are authorised either under section 25 of the FMA or specific enabling legislation.
In the nine months to 31 March 2020, appropriation transfers included:
• $20.4 million (including both recurrent and capital appropriation) has been transferred from the Department of Treasury to Energy Policy WA (EPWA) following the transfer of the functions of the former Public Utilities Office and the Energy Transformation Implementation Unit from Treasury to EPWA. EPWA was established as a sub-department of the Department of Mines, Industry Regulation and Safety on 5 September 2019; and
• $0.6 million from WA Health to the Parliamentary Commissioner for Administrative Investigations (the Ombudsman) to enable the Ombudsman to undertake the Expanded Child Death Review Function in 2019-20.
Approved excesses and new items during the nine months to 31 March 2020 included:
• $35 million for Department of Transport to fund settlement of an outstanding claim against the State;
• $6.2 million for the Western Australian Land Authority for the relocation and accelerated decommissioning of electrical and gas infrastructure, and for security, maintenance and project management costs for the East Perth Power Station project;
• $4.2 million for Infrastructure WA, following establishment of this statutory authority in July 2019;
• $2.7 million for the Chemistry Centre (WA) to continue to provide essential scientific services to government and non-government clients, and to support the Centre’s scientific education, and research and development functions; and
• $0.6 million to the Metropolitan Redevelopment Authority to complete preliminary investigative works for the East Perth Power Station project.

Appendix 3
39
Table 3.5 TRANSFERS, EXCESSES AND NEW ITEMS
For the nine months to 31 March
Note: Columns/rows may not add due to rounding.
NewItems
$m $m $m $m $m $mRecurrent Appropriations
Parliamentary Commissioner for Administrative InvestigationsItem 4: Delivery of Services 7.4 0.6 - - 8.1 -
TreasuryItem 14: Delivery of Services 79.6 -20.3 - - 59.3 -Item 23: Western Australian Land Authority 79.1 - - 6.2 85.3 -Item 27: Metropolitan Redevelopment Authority 20.9 - - 0.6 21.5 -
WA HealthItem 51: Delivery of Services 4,979.4 -0.6 - - 4,978.8 -
Chemistry Centre (WA)Item 66: Delivery of Services 5.0 - - 2.7 7.8 0.5
TransportItem 79: Delivery of Services 204.7 - - 35.0 239.7 16.4
Energy Policy WANew Item: Delivery of Services - 20.3 - - 20.3 -
Infrastructure WANew Item: Delivery of Services - - 4.1 - 4.1 2.9
Total Recurrent - 4.1 44.5 19.8
Capital Appropriations
TreasuryItem 101: Capital Appropriation 0.3 -0.1 - - 0.3 -
Energy Policy WANew Item : Capital Appropriation - 0.1 - - 0.1 -
Infrastructure WANew Item : Capital Appropriation - - 0.1 - 0.1 0.1
Total Capital - 0.1 - 0.1
TOTAL 19.9
Budget Transfers (a)
Treasurer's Advance
Revised Appropriation
Approved Excesses
Draw n against
Treasurer's Advance to
date

2019-20 Quarterly Financial Results Report
40
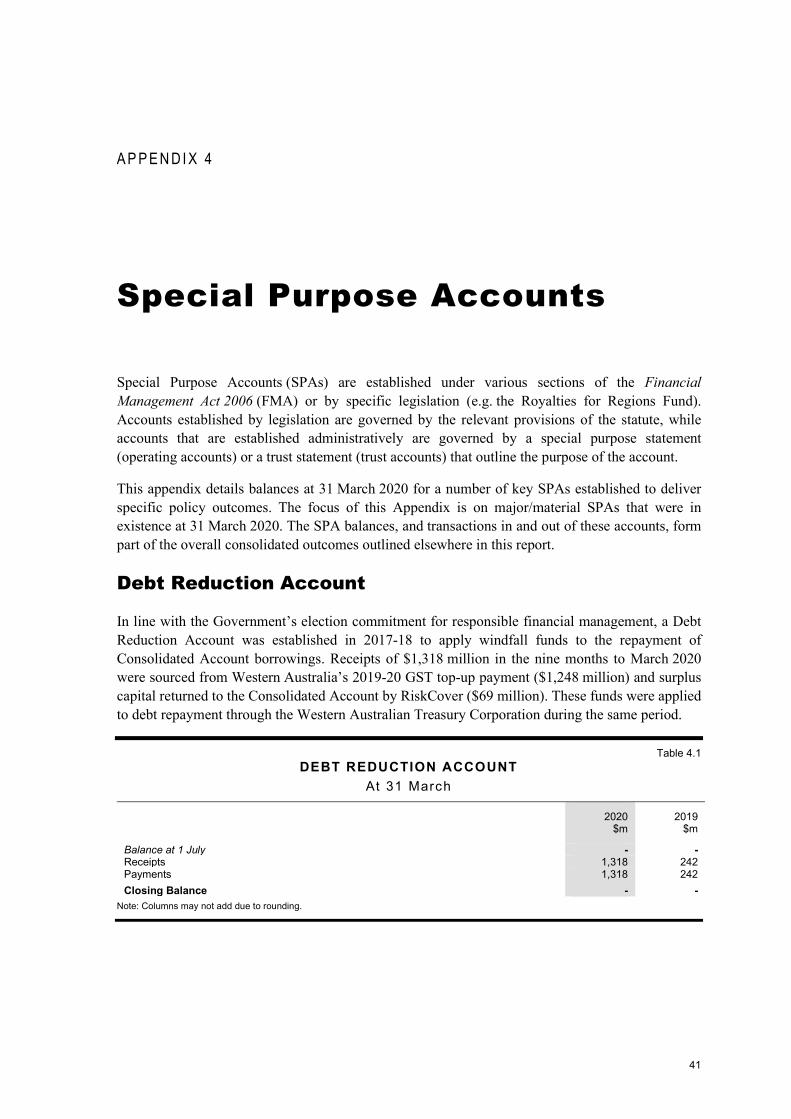
41
A P P E N D I X 4
Special Purpose Accounts
Special Purpose Accounts (SPAs) are established under various sections of the Financial Management Act 2006 (FMA) or by specific legislation (e.g. the Royalties for Regions Fund). Accounts established by legislation are governed by the relevant provisions of the statute, while accounts that are established administratively are governed by a special purpose statement (operating accounts) or a trust statement (trust accounts) that outline the purpose of the account.
This appendix details balances at 31 March 2020 for a number of key SPAs established to deliver specific policy outcomes. The focus of this Appendix is on major/material SPAs that were in existence at 31 March 2020. The SPA balances, and transactions in and out of these accounts, form part of the overall consolidated outcomes outlined elsewhere in this report.
Debt Reduction Account
In line with the Government’s election commitment for responsible financial management, a Debt Reduction Account was established in 2017-18 to apply windfall funds to the repayment of Consolidated Account borrowings. Receipts of $1,318 million in the nine months to March 2020 were sourced from Western Australia’s 2019-20 GST top-up payment ($1,248 million) and surplus capital returned to the Consolidated Account by RiskCover ($69 million). These funds were applied to debt repayment through the Western Australian Treasury Corporation during the same period.
Table 4.1 DEBT REDUCTION ACCOUNT
At 31 March
2020 $m
2019 $m
Balance at 1 July - - Receipts 1,318 242 Payments 1,318 242 Closing Balance - -
Note: Columns may not add due to rounding.

2019-20 Quarterly Financial Results Report
42
METRONET Account
This SPA was established in 2017-18 to support the planning and construction of METRONET transport infrastructure projects.
Receipts for the third quarter ending 31 March 2020 reflect capital appropriation of $134.7 million for METRONET projects and an operating subsidy of $1.9 million for the METRONET Office. Payments of $116.9 million were for transport infrastructure planning and delivery and for METRONET Office operating expenses ($1 million).
Table 4.2 METRONET ACCOUNT
At 31 March
2020 $m
2019 $m
Balance at 1 July (a) 274 10 Receipts 137 274 Payments 118 31 Closing Balance 293 253
(a) Payments during 2018-19 were restated from the $46 million reported in the 2018-19 Annual Report on State Finances (ARSF), resulting in a revised closing balance at 30 June 2019 of $274 million.
Note: Columns may not add due to rounding.
METRONET Roads Account
This SPA was established in December 2018 to hold motor vehicle licence revenue allocated to METRONET road works, including projects under development.
During the nine months ending 31 March 2020 receipts of $58.3 million, that represent motor vehicle licence revenue, was allocated to this account. Payments of $12.4 million have been made during the same period for road works associated with the Forrestfield-Airport Link project.
Table 4.3 METRONET ROADS ACCOUNT
At 31 March
2020 $m
2019 $m
Balance at 1 July - - Receipts 58 - Payments 12 - Closing Balance 46 -
Note: Columns may not add due to rounding.

Appendix 4
43
Metropolitan Region Improvement Account
This account was established under the Metropolitan Region Improvement Tax Act 1959 to hold funds for the management of the Metropolitan Region Scheme, including receipts from the Metropolitan Region Improvement Tax (MRIT).
Receipts for the nine months to the end of March 2020 reflect MRIT collections ($67 million), proceeds from the sale of land and buildings ($6.3 million), rental revenue ($5.1 million), receipts from the Australian Taxation Office for refunds of GST on purchases ($4.8 million) and interest revenue ($4.8 million). Payments from the account were for the acquisition of land and buildings ($37.2 million), service delivery costs associated with the Metropolitan Region Improvement Fund ($19.8 million), compensation for injurious affection ($3 million) and to progress a range of smaller infrastructure and works ($1.1 million).
Table 4.4 METROPOLITAN REGION IMPROVEMENT ACCOUNT
At 31 March
2020 $m
2019 $m
Balance at 1 July 440 399 Receipts 89 86 Payments 61 33 Closing Balance 468 453
Note: Columns may not add due to rounding.
Mining Rehabilitation Fund
The Mining Rehabilitation Fund was established in July 2013 to hold levy collections under the Mining Rehabilitation Fund Act 2012. Receipts for the March quarter reflect levy contributions by mining operators ($33 million) and interest earnings ($1 million). Payments for the year to date were for administration costs ($0.6 million).
Table 4.5 MINING REHABILITATION FUND
At 31 March
2020 $m
2019 $m
Balance at 1 July 150 122 Receipts 34 32
Payments 1 6
Closing Balance 183 148
Note: Columns may not add due to rounding.

2019-20 Quarterly Financial Results Report
44
National Redress Scheme and Civil Litigation for Survivors of Institutional Child Sexual Abuse Account
This account was established in December 2018 to meet the cost of payments associated with the State’s participation in the National Redress Scheme and for civil litigation claims by victims of historical child sexual abuse.
During the nine-month period ending 31 March 2020, payments totalling $1 million were made in line with the State’s obligations under the National Redress Scheme.
Table 4.6 NATIONAL REDRESS SCHEME AND CIVIL LITIGATION FOR SURVIVORS OF
INSTITUTIONAL CHILD SEXUAL ABUSE ACCOUNT At 31 March
2020 $m
2019 $m
Balance at 1 July 151 - Receipts - 153 Payments 1 - Closing Balance 150 153
Note: Columns may not add due to rounding.
Perth Children’s Hospital Account
This SPA was established in October 2010 to hold money for the construction and establishment of the Perth Children’s Hospital.
The Hospital achieved practical completion in April 2017 and fully opened on 10 June 2018. Project closure arrangements for the hospital are expected to be finalised in 2020 to accommodate the extended defect liability period, with any remaining funds in the account to be returned to the Consolidated Account at that time.
Table 4.7 PERTH CHILDREN’S HOSPITAL ACCOUNT
At 31 March
2020 $m
2019 $m
Balance at 1 July 13 13 Receipts - - Payments - - Closing Balance 13 13
Note: Columns may not add due to rounding.

Appendix 4
45
Perth Parking Licensing Account
This SPA was established in July 1999 under section 23(1) of the Perth Parking Management Act 1999 to set aside funds to be used to encourage a balanced transport system for access to the Perth city area. Money credited to the account reflects licence fees, penalties and money appropriated by the Parliament for the purposes of the Act.
Funds drawn from the account are used to support the Central Area Transit bus system, the Free Transit Zone public transport services in the Perth Central Business District, improvements to public transport access, enhancements to the pedestrian environment, support for bicycle access, other transport system initiatives and for the administration of the Act.
Table 4.8 PERTH PARKING LICENSING ACCOUNT
At 31 March
2020 $m
2019 $m
Balance at 1 July 93 54 Receipts 55 56 Payments 12 13 Closing Balance 136 97
Note: Columns may not add due to rounding.
Perth Stadium Account
This SPA was established in October 2011 to hold funds in support of the construction of Perth Stadium and associated transport infrastructure. The stadium commenced operations in early 2018.
There were no payments or receipts during the nine months to 31 March 2020.
Table 4.9 PERTH STADIUM ACCOUNT
At 31 March
2020 $m
2019 $m
Balance at 1 July (a) 12 13 Receipts - - Payments - 3 Closing Balance 12 11
(a) The opening balance of $12 million at 1 July 2019 has been restated from the $11 million closing balance as reported in the 2018-19 Annual Report on State Finances. This restatement incorporates a correction to the rounding of the closing balance at 30 June 2019.
Note: Columns may not add due to rounding.

2019-20 Quarterly Financial Results Report
46
Road Trauma Trust Account
This account was established to provide for road safety initiatives. Receipts reflect collections from prescribed penalties paid during the first three quarters of 2019-20 ($71.5 million), interest revenue received on the account balance ($0.8 million) and other miscellaneous funds collected under the Road Traffic (Administration) Act 2008.
Projects funded from the Account are focused on achieving reductions in serious road trauma as part of the Government’s Towards Zero Strategy for 2008 to 2020. A total of $53 million drawn from the account in the nine months to the 31 March 2020 supported the following initiatives and programs:
• regional run-off crashes ($17.9 million);
• speed management ($13.9 million);
• vulnerable road users ($5.7 million);
• reduction in road death and serious injury from impaired driving from alcohol and/or drugs ($4.7 million); and
• the ongoing operational cost of the Road Safety Commission and a range of smaller road safety initiatives and support programs ($10.4 million).
Table 4.10 ROAD TRAUMA TRUST ACCOUNT
At 31 March
2020 $m
2019 $m
Balance at 1 July (a) 60 53 Receipts 72 73 Payments 53 50 Closing Balance 80 76
(a) The closing balance of $60 million at 30 June 2019 (opening balance at 1 July) has been restated from the $61 million (reported in the 2018-19 Annual Report on State Finances. The restatement incorporates a correction to the rounding of the closing balance at 30 June 2019.
Note: Columns may not add due to rounding.
Royalties for Regions Fund
The Royalties for Regions Fund was established in December 2008 to set aside a share of the State’s annual royalty income to fund investment in regional Western Australia. Under the Royalties for Regions Act 2009, the balance held in the Fund at any time cannot exceed $1 billion.
Receipts during the first nine months of 2019-20 reflect the draw down of moneys appropriated by the Parliament ($159.5 million), interest revenue earned on the account balance ($8.9 million), and unused funds from regional projects returned to the Fund by agencies ($6.6 million). A total of $632.8 million was disbursed from the Fund to support infrastructure, business and economic development and other regional initiatives (detailed in the 2019-20 Budget Paper No. 3 and updated in the 2019-20 Mid-year Review).

Appendix 4
47
Table 4.11 ROYALTIES FOR REGIONS FUND
At 31 March
2020 $m
2019 $m
Balance at 1 July 1,000 1,000 Receipts 175 262 Payments 633 425 Closing Balance 542 838
Note: Columns may not add due to rounding.
Royalties for Regions Regional Reform Fund
This SPA was established in June 2015 to fund strategic reform initiatives in regional Western Australia. Payment of $2 million was made in the March quarter to the Department of Education for the Kimberley Schools Project.
Table 4.12 ROYALITES FOR REGIONS REGIONAL REFORM FUND
At 31 March
2020 $m
2019 $m
Balance at 1 July 80 96 Receipts - - Payments 2 10 Closing Balance 78 86
Note: Columns may not add due to rounding.
Waste Avoidance and Resource Recovery Account
The Waste Avoidance and Resource Recovery Account was established under the Waste Avoidance and Resource Recovery Act 2007 to hold revenue allocated from the landfill levy. Funds are drawn from the Account to support programs and other initiatives related to the management, reduction, reuse, recycling, monitoring or measurement of waste. Landfill levy receipts of $15.6 million were allocated to the account by Ministerial determination under the Act in the nine months to 31 March 2020. Draw downs totalling $13.5 million over the same period were for waste programs and the repayment of administration costs incurred by the Department of Water and Environmental Regulation.

2019-20 Quarterly Financial Results Report
48
Table 4.13 WASTE AVOIDANCE AND RESOURCE RECOVERY ACCOUNT
At 31 March
2020 $m
2019 $m
Balance at 1 July) 40 39 Receipts 16 16 Payments 14 11 Closing Balance 42 44
Note: Columns may not add due to rounding.
Western Australian Future Fund
The Western Australian Future Fund was established under the Western Australian Future Fund Act 2012. The Act provides for an accruing balance over 20 years to 2032, after which the annual interest earnings can be drawn down to fund economic or social infrastructure projects across Western Australia.
Receipts for the nine months ending 31 March 2020 totalled $90.1 million and included appropriation of 1% of annual forecast royalty revenue in the 2019-20 Budget ($63.7 million) and interest receipts ($26.4 million).
Table 4.14 WESTERN AUSTRALIAN FUTURE FUND
At 31 March
2020 $m
2019 $m
Balance at 1 July 1,313 1,215 Receipts 90 89 Payments - - Closing Balance 1,403 1,304
Note: Columns may not add due to rounding.

49
A P P E N D I X 5
General Government Salaries
Introduction
Salaries represent the single largest component of general government sector expenses (43.6% in the first nine months of 2019-20).
Relative to the same period in 2018-19, general government salaries grew by $402 million (or 4.4%) over the first three quarters of 2019-20, to total $9,499 million. Salaries in the health, education, law and order, and community services sectors account for over 83% of general government salaries costs in the March outcome. Higher salary costs included increases under the Government’s Wages Policy and other prevailing industrial agreements, the impact of the Government’s commitment to convert eligible casual and fixed-term contract staff to permanent employees across the sector, and other movements in the sector’s workforce.
The following table summarises salaries outcomes for general government agencies for the nine months to 31 March 2020.

2019-20 Quarterly Financial Results Report
50
Table 5.1 SALARIES COSTS
General Government Sector
(a) Consistent with the estimated outcome published in the 2019-20 Mid-year Review, released on 18 December 2019. (b) Consistent with the final audited data contained in the 2018-19 Annual Report on State Finances, released on 27 September 2019. Note: Columns may not add due to rounding.
Nine Months Estimated Nine Monthsto 31 Mar Outurn (a) to 31 Mar Actual (b)
$m $m $m $m
WA Health 3,527 4,730 3,380 4,608Education 2,688 3,535 2,586 3,449Western Australia Police Force 716 931 708 932Justice 530 656 492 657Communities 438 529 415 525Fire and Emergency Services 150 193 140 191Biodiversity Conservation and Attractions 141 184 136 181Primary Industries and Regional Development 124 170 119 167Mines, Industry Regulation and Safety 118 154 106 149Transport 94 131 90 122North Metropolitan TAFE 86 117 84 114South Metropolitan TAFE 80 110 75 105Finance 72 104 71 93Water and Environmental Regulation 69 86 60 81Premier and Cabinet 62 80 60 81Local Government, Sport and Cultural Industries 62 86 59 78Planning, Lands and Hertiage 61 81 55 77Commissioner of Main Roads 42 60 37 58Western Australian Sports Centre Trust 39 47 40 55Land Information Authority 37 54 37 48Training and Workforce Development 32 45 33 43South Regional TAFE 26 37 26 36Jobs, Tourism, Science and Innovation 26 35 23 32Central Regional TAFE 25 33 24 33Office of the Director of Public Prosecutions 24 32 22 31Legal Aid Commission of WA 24 33 23 31North Regional TAFE 24 32 24 31Mental Health Commission 24 31 23 31Treasury 23 33 25 33Legislative Assembly 17 23 17 22Office of the Auditor General 12 19 11 16Legislative Council 12 17 12 16Corruption and Crime Commission 12 16 11 14Public Sector Commission 11 16 9 13Parliamentary Services Department 8 11 8 10Chemistry Centre (WA) 10 14 10 14WorkCover WA 10 13 9 12All other agencies (w ith annual salaries costs below $10 million) 41 117 39 78Total salaries 9,499 12,595 9,097 12,269
2019-20 2018-19

2019
-20 Q
UA
RT
ER
LY F
INA
NC
IAL R
ES
ULTS
RE
PO
RT
- MA
RC
H 20
20