quarterly financial statements (january 1 to june 30, … excerpt from quarterly report...
TRANSCRIPT

1/26
Excerpt from Quarterly Report
(Consolidated Financial Statements)
(January 1 to June 30, 2017)
Part 4. Financial Section
1. Preparation Method of Condensed Quarterly Consolidated Financial Statements
(1) The condensed quarterly consolidated financial statements of Dentsu Inc.
(hereinafter referred to as “the Company”) are prepared in accordance with
International Accounting Standards 34 “Interim Financial Reporting” (hereinafter
referred to as “IAS 34”) under the provisions of Article 93 of the “Ordinance on
Terminology, Forms and Preparation Methods of Quarterly Consolidated Financial
Statements” (Cabinet Office Ordinance No. 64, 2007; hereinafter referred to as “the
Ordinance”).
(2) In the condensed quarterly consolidated financial statements, figures less than one
million yen are rounded down to the nearest million yen.
2. Audit Certificate
Pursuant to Article 193-2, Paragraph 1 of the Financial Instruments and Exchange Act,
the Company’s condensed quarterly consolidated financial statements for the second
quarter ended June 30, 2017 (from April 1 to June 30, 2017) and the condensed
consolidated financial statements for the first six months (from January 1 to June 30,
2017) of fiscal year 2017, which were compiled in Japanese, were subject to a
quarterly review by KPMG AZSA LLC.
2/26
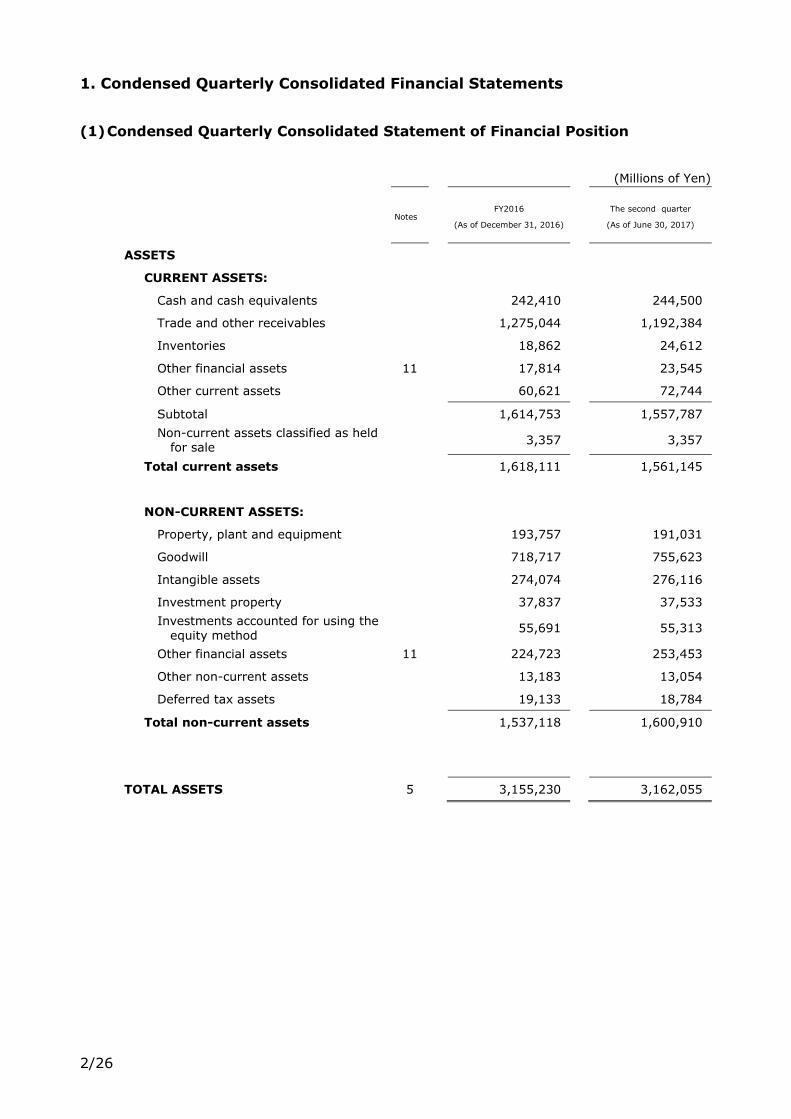
1. Condensed Quarterly Consolidated Financial Statements
(1) Condensed Quarterly Consolidated Statement of Financial Position
(Millions of Yen)
Notes FY2016
(As of December 31, 2016)
The second quarter
(As of June 30, 2017)
ASSETS
CURRENT ASSETS:
Cash and cash equivalents 242,410 244,500
Trade and other receivables 1,275,044 1,192,384
Inventories 18,862 24,612
Other financial assets 11 17,814 23,545
Other current assets
60,621 72,744
Subtotal 1,614,753 1,557,787
Non-current assets classified as held for sale
3,357 3,357
Total current assets 1,618,111 1,561,145
NON-CURRENT ASSETS:
Property, plant and equipment 193,757 191,031
Goodwill 718,717 755,623
Intangible assets 274,074 276,116
Investment property 37,837 37,533
Investments accounted for using the equity method
55,691 55,313
Other financial assets 11 224,723 253,453
Other non-current assets 13,183 13,054
Deferred tax assets 19,133 18,784
Total non-current assets 1,537,118 1,600,910
TOTAL ASSETS 5 3,155,230 3,162,055

3/26
(Millions of Yen)
Notes FY2016
(As of December 31, 2016)
The second quarter
(As of June 30, 2017)
LIABILITIES AND EQUITY
LIABILITIES:
CURRENT LIABILITIES:
Trade and other payables 1,230,496 1,158,542
Borrowings 11 130,490 82,312
Other financial liabilities 11 26,781 40,814
Income tax payables 34,248 18,905
Provisions 1,179 1,193
Other current liabilities 176,030 170,657
Subtotal 1,599,226 1,472,425
Liabilities directly associated with non-current assets classified as held for sale
8 8
Total current liabilities 1,599,235 1,472,434
NON-CURRENT LIABILITIES:
Borrowings 11 273,108 369,129
Other financial liabilities 11 166,216 169,470
Liability for retirement benefits 31,377 32,649
Provisions 4,295 4,121
Other non-current liabilities 20,141 20,663
Deferred tax liabilities 78,893 89,201
Total non-current liabilities
574,033 685,235
Total liabilities 2,173,269 2,157,670
EQUITY:
Share capital 74,609 74,609
Share premium account 99,751 99,751
Treasury shares (20,168) (40,178)
Other components of equity 121,346 151,864
Retained earnings 657,203 670,748
Total equity attributable to owners of the parent
932,742 956,796
Non-controlling interests 49,218 47,589
Total equity 981,961 1,004,385
TOTAL LIABILITIES AND EQUITY
3,155,230 3,162,055

4/26
(2) Condensed Quarterly Consolidated Statement of Income
For the six months ended June 30, 2016 and June 30, 2017
(Millions of Yen)
Notes
Six months ended
June 30, 2016
(From January 1
to June 30, 2016)
Six months ended
June 30, 2017
(From January 1
to June 30, 2017)
Turnover (Note 1) 5 2,371,963 2,464,653
Revenue 5 393,167 439,485
Cost 24,548 24,875
Gross profit 5 368,619 414,610
Selling, general and administrative expenses
313,910 368,379
Other income 7 7,274 4,327
Other expenses 8 3,331 5,251
Operating profit 58,651 45,307
Share of results of associates 1,437 1,661
Profit before interest and tax 60,088 46,969
Finance income 9 4,029 8,718
Finance costs 9 7,309 7,270
Profit before tax 56,808 48,417
Income tax expense 17,753 15,364
Profit for the period 39,054 33,053
Profit attributable to:
Owners of the parent 35,785 30,712
Non-controlling interests 3,269 2,340
Earnings per share
Basic earnings per share (Yen) 10 125.50 108.33
Diluted earnings per share (Yen) 10 125.50 108.33

5/26
Reconciliation from operating profit to underlying operating profit
(Millions of Yen)
Notes
Six months ended
June 30, 2016
(From January 1
to June 30, 2016)
Six months ended
June 30, 2017
(From January 1
to June 30, 2017)
Operating profit 58,651 45,307
Amortization of intangible assets incurred in acquisitions
10,736 16,258
Other adjusting items (selling, general and administrative expenses)
721 856
Other adjusting items (other income) (2,670) (660)
Other adjusting items (other expenses) 1,173 2,592
Underlying operating profit (Note 2) 5 68,612 64,354
6/26
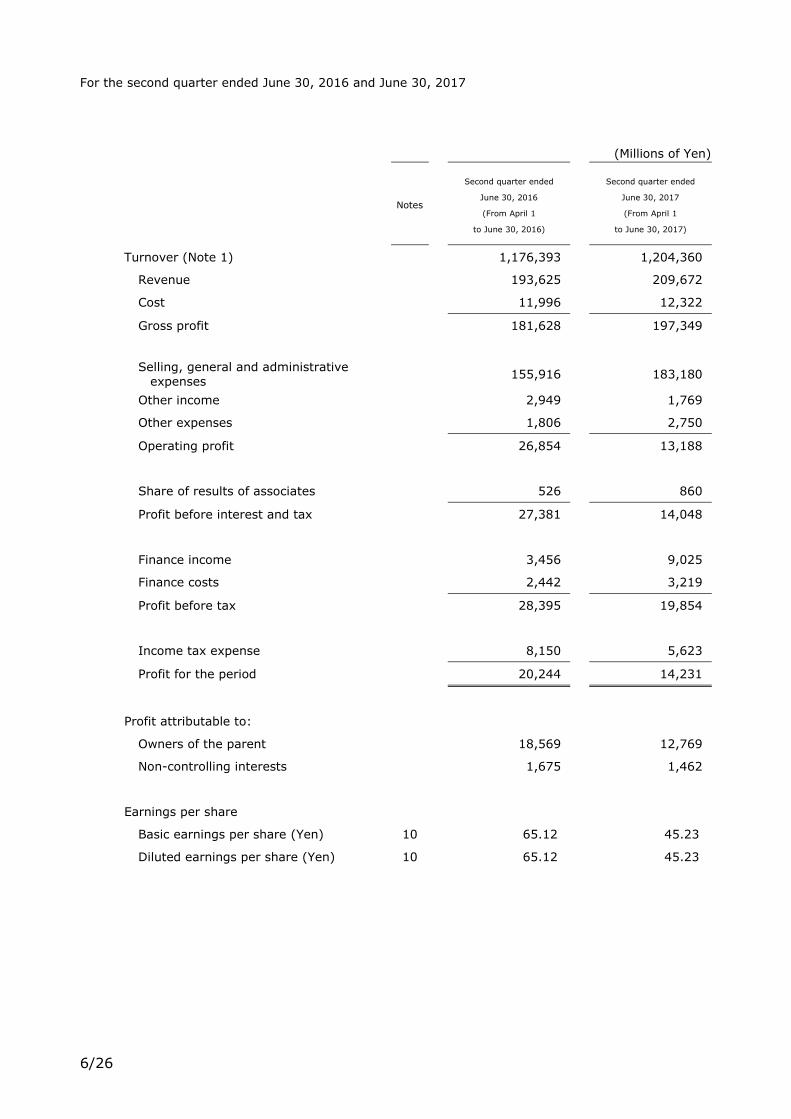
For the second quarter ended June 30, 2016 and June 30, 2017
(Millions of Yen)
Notes
Second quarter ended
June 30, 2016
(From April 1
to June 30, 2016)
Second quarter ended
June 30, 2017
(From April 1
to June 30, 2017)
Turnover (Note 1) 1,176,393 1,204,360
Revenue 193,625 209,672
Cost 11,996 12,322
Gross profit 181,628 197,349
Selling, general and administrative expenses
155,916 183,180
Other income 2,949 1,769
Other expenses 1,806 2,750
Operating profit 26,854 13,188
Share of results of associates 526 860
Profit before interest and tax 27,381 14,048
Finance income 3,456 9,025
Finance costs 2,442 3,219
Profit before tax 28,395 19,854
Income tax expense 8,150 5,623
Profit for the period 20,244 14,231
Profit attributable to:
Owners of the parent 18,569 12,769
Non-controlling interests 1,675 1,462
Earnings per share
Basic earnings per share (Yen) 10 65.12 45.23
Diluted earnings per share (Yen) 10 65.12 45.23
7/26
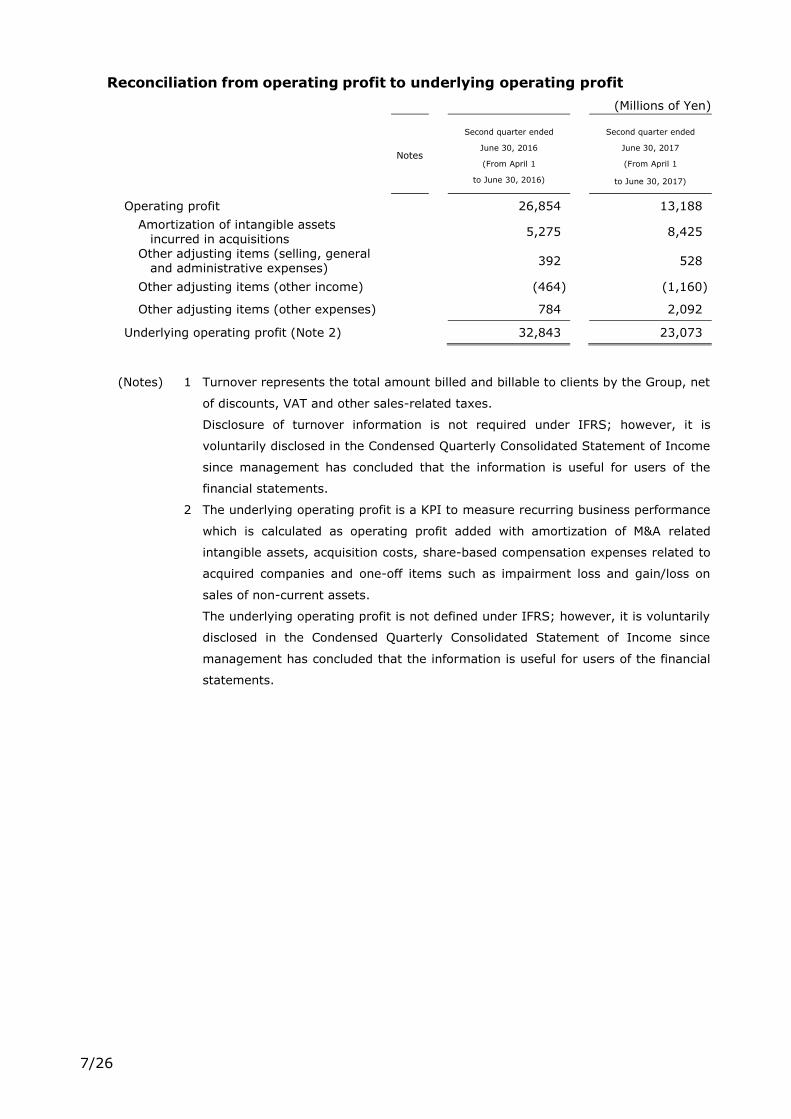
Reconciliation from operating profit to underlying operating profit
(Millions of Yen)
Notes
Second quarter ended
June 30, 2016
(From April 1
to June 30, 2016)
Second quarter ended
June 30, 2017
(From April 1
to June 30, 2017)
Operating profit 26,854 13,188
Amortization of intangible assets incurred in acquisitions
5,275 8,425
Other adjusting items (selling, general and administrative expenses)
392 528
Other adjusting items (other income) (464) (1,160)
Other adjusting items (other expenses) 784 2,092
Underlying operating profit (Note 2) 32,843 23,073
(Notes) 1 Turnover represents the total amount billed and billable to clients by the Group, net
of discounts, VAT and other sales-related taxes.
Disclosure of turnover information is not required under IFRS; however, it is
voluntarily disclosed in the Condensed Quarterly Consolidated Statement of Income
since management has concluded that the information is useful for users of the
financial statements.
2 The underlying operating profit is a KPI to measure recurring business performance
which is calculated as operating profit added with amortization of M&A related
intangible assets, acquisition costs, share-based compensation expenses related to
acquired companies and one-off items such as impairment loss and gain/loss on
sales of non-current assets.
The underlying operating profit is not defined under IFRS; however, it is voluntarily
disclosed in the Condensed Quarterly Consolidated Statement of Income since
management has concluded that the information is useful for users of the financial
statements.
8/26
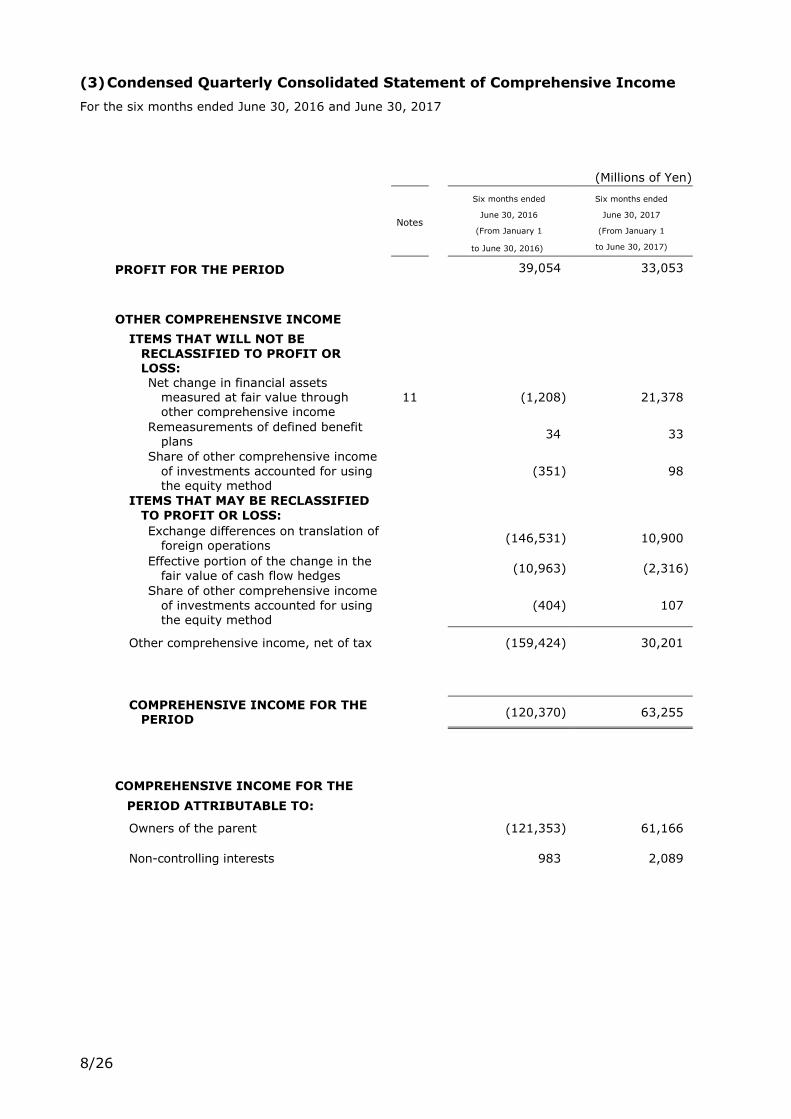
(3) Condensed Quarterly Consolidated Statement of Comprehensive Income
For the six months ended June 30, 2016 and June 30, 2017
(Millions of Yen)
Notes
Six months ended
June 30, 2016
(From January 1
to June 30, 2016)
Six months ended
June 30, 2017
(From January 1
to June 30, 2017)
PROFIT FOR THE PERIOD
(1,283
(1,053
(1,139
3,663
187
(48
516
(565Income (loss) before minority interests
39,054 33,053
OTHER COMPREHENSIVE INCOME
ITEMS THAT WILL NOT BE
RECLASSIFIED TO PROFIT OR LOSS:
Net change in financial assets measured at fair value through other comprehensive income
11 (1,208) 21,378
Remeasurements of defined benefit plans
34 33
Share of other comprehensive income
of investments accounted for using the equity method
(351) 98
ITEMS THAT MAY BE RECLASSIFIED
TO PROFIT OR LOSS:
Exchange differences on translation of foreign operations
(146,531) 10,900
Effective portion of the change in the fair value of cash flow hedges
(10,963) (2,316)
Share of other comprehensive income
of investments accounted for using the equity method
(404) 107
Other comprehensive income, net of tax (159,424) 30,201
COMPREHENSIVE INCOME FOR THE PERIOD
(120,370) 63,255
COMPREHENSIVE INCOME FOR THE
PERIOD ATTRIBUTABLE TO:
Owners of the parent (121,353) 61,166
Non-controlling interests 983 2,089
9/26
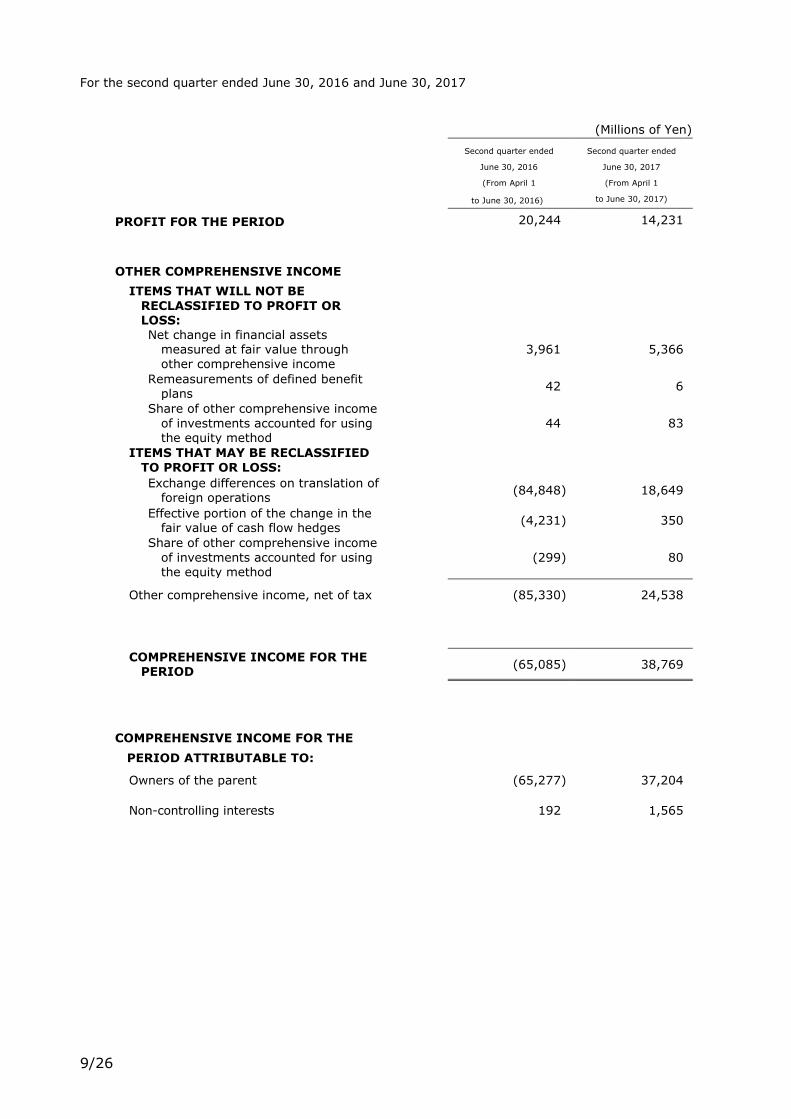
For the second quarter ended June 30, 2016 and June 30, 2017
(Millions of Yen)
Second quarter ended
June 30, 2016
(From April 1
to June 30, 2016)
Second quarter ended
June 30, 2017
(From April 1
to June 30, 2017)
PROFIT FOR THE PERIOD
(1,283
(1,053
(1,139
3,663
187
(48
516
(565Income (loss) before minority interests
20,244 14,231
OTHER COMPREHENSIVE INCOME
ITEMS THAT WILL NOT BE
RECLASSIFIED TO PROFIT OR LOSS:
Net change in financial assets measured at fair value through
other comprehensive income
3,961 5,366
Remeasurements of defined benefit plans
42 6
Share of other comprehensive income
of investments accounted for using the equity method
44 83
ITEMS THAT MAY BE RECLASSIFIED
TO PROFIT OR LOSS:
Exchange differences on translation of foreign operations
(84,848) 18,649
Effective portion of the change in the fair value of cash flow hedges
(4,231) 350
Share of other comprehensive income
of investments accounted for using the equity method
(299) 80
Other comprehensive income, net of tax (85,330) 24,538
COMPREHENSIVE INCOME FOR THE PERIOD
(65,085) 38,769
COMPREHENSIVE INCOME FOR THE
PERIOD ATTRIBUTABLE TO:
Owners of the parent (65,277) 37,204
Non-controlling interests 192 1,565

10/26
(4) Condensed Quarterly Consolidated Statement of Changes in Equity
For the six months ended June 30, 2016 (From January 1 to June 30, 2016)
(Millions of Yen)
Notes
Total equity attributable to owners of the parent
Share
capital
Share
premium
account
Treasury
shares
Other components of equity
Share options
Exchange
differences on translation of
foreign operations
Effective portion
of the
change in the
fair value of
cash flow hedges
As of January 1, 2016 74,609 99,751 (20,155) 48 171,132 10,222
Profit for the period
Other comprehensive income (144,697) (10,963)
Comprehensive income for the
period ― ― ― ― (144,697) (10,963)
Repurchase of treasury shares (4)
Disposal of treasury shares (0) 0
Dividends 6
Transactions with non-
controlling interests in
subsidiaries that do not result
in a loss of control
Transfer from other components
of equity to retained earnings
Other changes (0)
Transactions with owners-total ― (0) (4) (0) ― ―
As of June 30, 2016 74,609 99,751 (20,160) 48 26,435 (741)
(Millions of Yen)
Notes
Total equity attributable to owners of the parent
Non-
controlling
interests
Total equity
Other components of equity
Retained
earnings
Total
Net change in
financial
assets measured at
fair value
through other
comprehensive income
Remeasurements
of defined
benefit plans Total
As of January 1, 2016 83,639 (4,003) 261,039 652,972 1,068,216 34,526 1,102,743
Profit for the period ― 35,785 35,785 3,269 39,054
Other comprehensive income (1,512) 34 (157,139) (157,139) (2,285) (159,424)
Comprehensive income for the
period (1,512) 34 (157,139) 35,785 (121,353) 983 (120,370)
Repurchase of treasury shares ― (4) (4)
Disposal of treasury shares ― 0 0
Dividends 6 6 ― (11,405) (11,405) (2,946) (14,351)
Transactions with non-
controlling interests in
subsidiaries that do not result in a loss of control
― (2,255) (2,255) (1,264) (3,520)
Transfer from other components
of equity to retained earnings 310 310 (310) ― ―
Other changes (0) (0) (0)
Transactions with owners-total 310 ― 310 (13,972) (13,666) (4,210) (17,876)
As of June 30, 2016 82,437 (3,969) 104,210 674,785 933,196 31,299 964,496
11/26
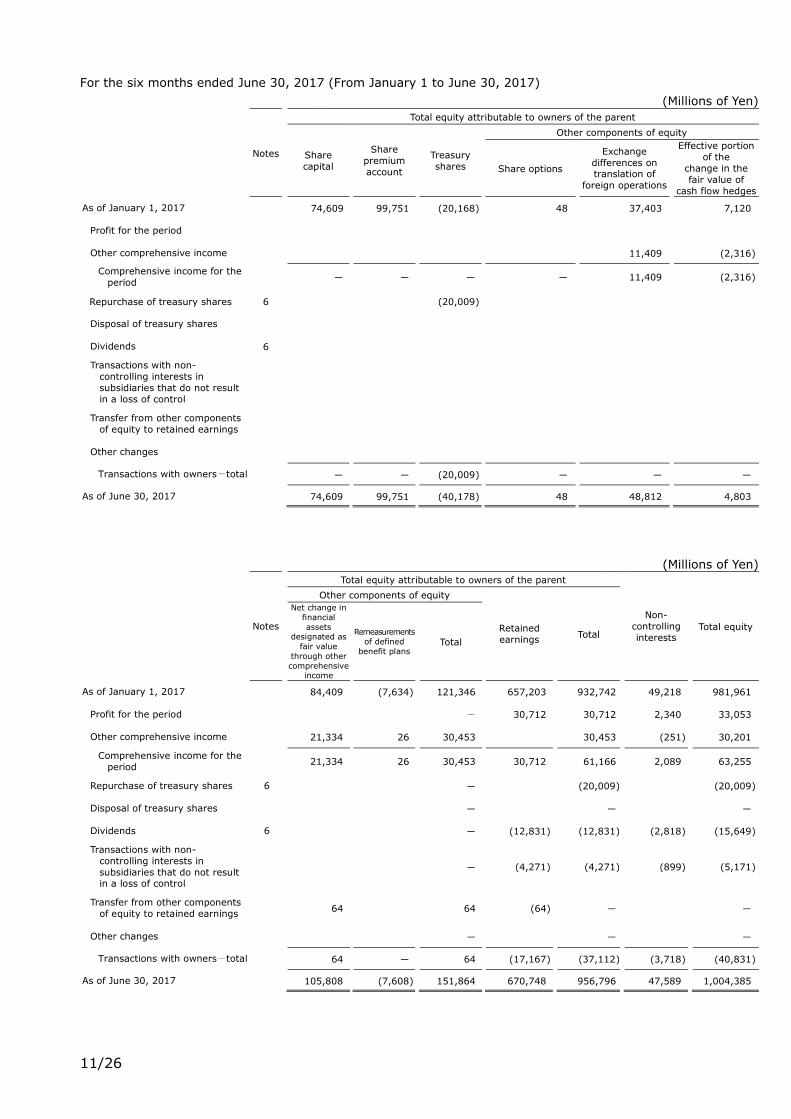
For the six months ended June 30, 2017 (From January 1 to June 30, 2017)
(Millions of Yen)
Notes
Total equity attributable to owners of the parent
Share
capital
Share
premium
account
Treasury
shares
Other components of equity
Share options
Exchange
differences on translation of
foreign operations
Effective portion
of the
change in the
fair value of
cash flow hedges
As of January 1, 2017 74,609 99,751 (20,168) 48 37,403 7,120
Profit for the period
Other comprehensive income 11,409 (2,316)
Comprehensive income for the
period ― ― ― ― 11,409 (2,316)
Repurchase of treasury shares 6 (20,009)
Disposal of treasury shares
Dividends 6
Transactions with non-
controlling interests in
subsidiaries that do not result
in a loss of control
Transfer from other components
of equity to retained earnings
Other changes
Transactions with owners-total ― ― (20,009) ― ― ―
As of June 30, 2017 74,609 99,751 (40,178) 48 48,812 4,803
(Millions of Yen)
Notes
Total equity attributable to owners of the parent
Non-
controlling
interests
Total equity
Other components of equity
Retained
earnings
Total
Net change in
financial
assets designated as
fair value
through other
comprehensive income
Remeasurements
of defined
benefit plans Total
As of January 1, 2017 84,409 (7,634) 121,346 657,203 932,742 49,218 981,961
Profit for the period - 30,712 30,712 2,340 33,053
Other comprehensive income 21,334 26 30,453 30,453 (251) 30,201
Comprehensive income for the
period 21,334 26 30,453 30,712 61,166 2,089 63,255
Repurchase of treasury shares 6 ― (20,009) (20,009)
Disposal of treasury shares ― ― ―
Dividends 6 6 ― (12,831) (12,831) (2,818) (15,649)
Transactions with non-
controlling interests in
subsidiaries that do not result in a loss of control
― (4,271) (4,271) (899) (5,171)
Transfer from other components
of equity to retained earnings 64 64 (64) ― ―
Other changes ― ― ―
Transactions with owners-total 64 ― 64 (17,167) (37,112) (3,718) (40,831)
As of June 30, 2017 105,808 (7,608) 151,864 670,748 956,796 47,589 1,004,385
12/26
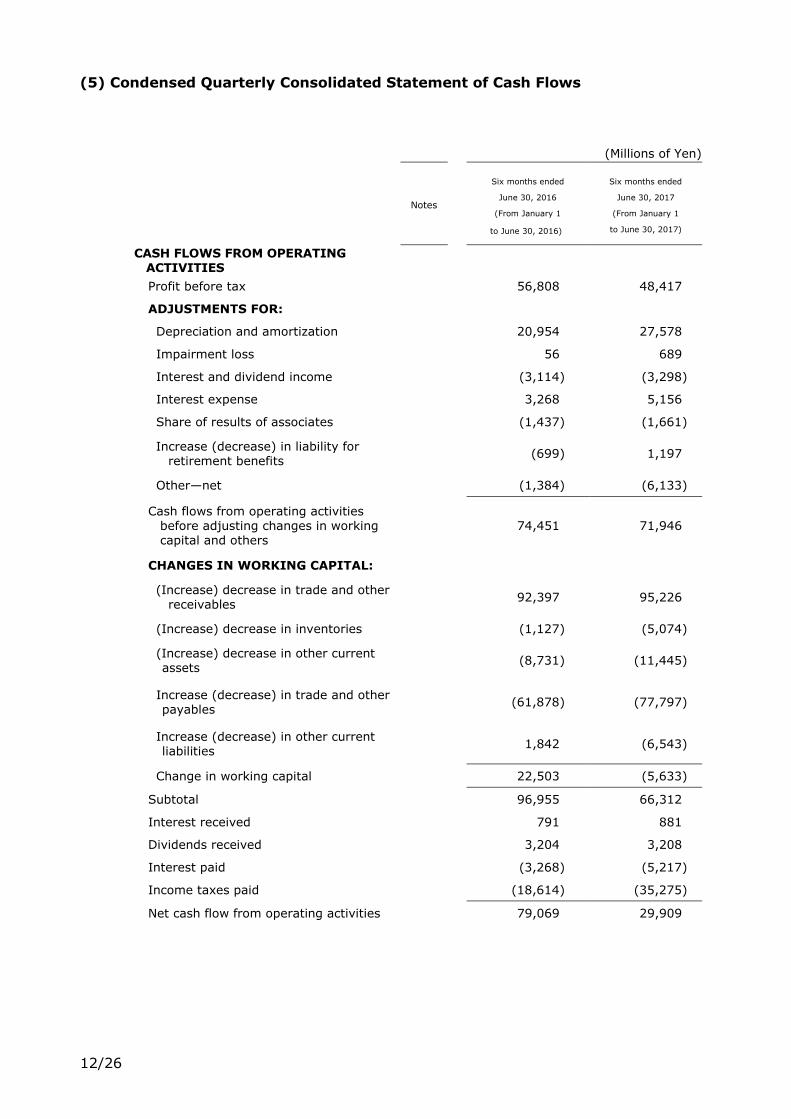
(5) Condensed Quarterly Consolidated Statement of Cash Flows
(Millions of Yen)
Notes
Six months ended
June 30, 2016
(From January 1
to June 30, 2016)
Six months ended
June 30, 2017
(From January 1
to June 30, 2017)
CASH FLOWS FROM OPERATING ACTIVITIES
Profit before tax 56,808 48,417
ADJUSTMENTS FOR:
Depreciation and amortization 20,954 27,578
Impairment loss 56 689
Interest and dividend income (3,114) (3,298)
Interest expense 3,268 5,156
Share of results of associates (1,437) (1,661)
Increase (decrease) in liability for retirement benefits
(699) 1,197
Other—net (1,384) (6,133)
Cash flows from operating activities before adjusting changes in working capital and others
74,451 71,946
CHANGES IN WORKING CAPITAL:
(Increase) decrease in trade and other receivables
92,397 95,226
(Increase) decrease in inventories (1,127) (5,074)
(Increase) decrease in other current assets
(8,731) (11,445)
Increase (decrease) in trade and other payables
(61,878) (77,797)
Increase (decrease) in other current liabilities
1,842 (6,543)
Change in working capital 22,503 (5,633)
Subtotal 96,955 66,312
Interest received 791 881
Dividends received 3,204 3,208
Interest paid (3,268) (5,217)
Income taxes paid (18,614) (35,275)
Net cash flow from operating activities 79,069 29,909

13/26
(Millions of Yen)
Notes
Six months ended
June 30, 2016
(From January 1
to June 30, 2016)
Six months ended
June 30, 2017
(From January 1
to June 30, 2017)
CASH FLOWS FROM INVESTING ACTIVITIES
Payment for purchase of property, plant and equipment, intangible assets and investment property
(10,083) (10,149)
Proceeds from sale of property, plant and equipment, intangible assets and investment property
4,687 2,056
Net cash (paid) received on acquisition of subsidiaries
(24,802) (30,919)
Net cash (paid) received on disposal of subsidiaries
(24) 55
Payments for purchases of securities (1,704) (11,361)
Proceeds from sales of securities 6,648 4,356
Other—net (307) (407)
Net cash flow from investing activities (25,585) (46,370)
CASH FLOWS FROM FINANCING ACTIVITIES
Net increase (decrease) in short-term borrowings
7,203 (95,255)
Proceeds from long-term borrowings – 150,835
Repayment of long-term borrowings (2,543) (1,360)
Payment for acquisition of interest in a subsidiary from non-controlling interests
(4,022) (608)
Payments for purchase of treasury shares 6 (4) (20,009)
Dividends paid 6 (11,405) (12,831)
Dividends paid to non-controlling interests (2,734) (1,877)
Other—net (2,842) (538)
Net cash flow from financing activities (16,350) 18,354
EFFECT OF EXCHANGE RATE CHANGES ON CASH AND CASH EQUIVALENTS
(20,246) 196
NET INCREASE (DECREASE) IN CASH AND CASH EQUIVALENTS 16,886 2,089
CASH AND CASH EQUIVALENTS AT BEGINNING OF PERIOD 263,322 242,410
CASH AND CASH EQUIVALENTS AT END OF PERIOD
280,209 244,500
14/26
Notes on the Condensed Quarterly Consolidated Financial Statements
1. Reporting Entity
Dentsu Inc. (hereinafter referred to as “the Company”) is a joint stock corporation
under the Companies Act of Japan located in Japan.
The addresses of the Company’s registered corporate headquarters and principal
business offices are available on the Company’s website (http://www.dentsu.co.jp/).
The details of businesses and principal business activities of the Company and its
subsidiaries (hereinafter referred to as “the Group”) are stated in “5. Segment
Information.”
The condensed quarterly consolidated financial statements for the second quarter
ended June 30, 2017 were approved by Toshihiro Yamamoto, Representative
Director and President & CEO, and Shoichi Nakamoto, Representative Director and
Senior Executive Vice President & CFO, on August 9, 2017.
2. Basis of Preparation
Compliance with the International Financial Reporting Standards (hereinafter
referred to as “IFRS”)
The Company’s condensed quarterly consolidated financial statements meet all
requirements of Article 1-2 “Specified Company for Designated IFRS” stipulated in
the Ordinance and are prepared in accordance with IAS 34 under the provisions of
Article 93 of the Ordinance.
The condensed quarterly consolidated financial statements do not include all the
information that must be disclosed in the annual consolidated financial statements,
and therefore should be used in conjunction with the consolidated financial
statements for the previous fiscal year.
3. Significant Accounting Policies
Significant accounting policies applied to the condensed quarterly consolidated
financial statements for the second quarter ended June 30, 2017 are identical to
those applied to the consolidated financial statements for the previous fiscal year.
Meanwhile, income taxes for the six months (second quarter) ended June 30, 2017
15/26
are calculated based on the estimated annual effective tax rate.
4. Significant Accounting Judgments, Estimates and Assumptions
The preparation of the condensed quarterly consolidated financial statements
requires management to make judgments, estimates and assumptions that affect
the application of accounting policies and the reported amounts of revenues,
expenses, assets and liabilities. These estimates and assumptions are based on the
best judgment of management in light of historical experience and various factors
deemed to be reasonable as of the fiscal year-end date. However, given their nature,
actual results may differ from those estimates and assumptions.
The estimates and underlying assumptions are continuously reviewed. The effects of
a change in estimates are recognized in the period of the change and future periods.
Estimates and assumptions that may have a material effect on the amounts in the
condensed quarterly consolidated financial statements for the second quarter ended
June 30, 2017 are identical to those for the consolidated financial statements for the
previous fiscal year.
5. Segment Information
(1) Description of reportable segments
The Group’s reportable segments are those for which discrete financial information is
available, and for which the Board of Directors conducts regular reviews to make
decisions about resources to be allocated and to assess performance.
The Group is mainly engaged in providing communications-related services focusing
on advertising, and manages its Japan business and international business
separately.
Accordingly, the Group has two reportable segments: Japan business segment and
international business segment.

16/26
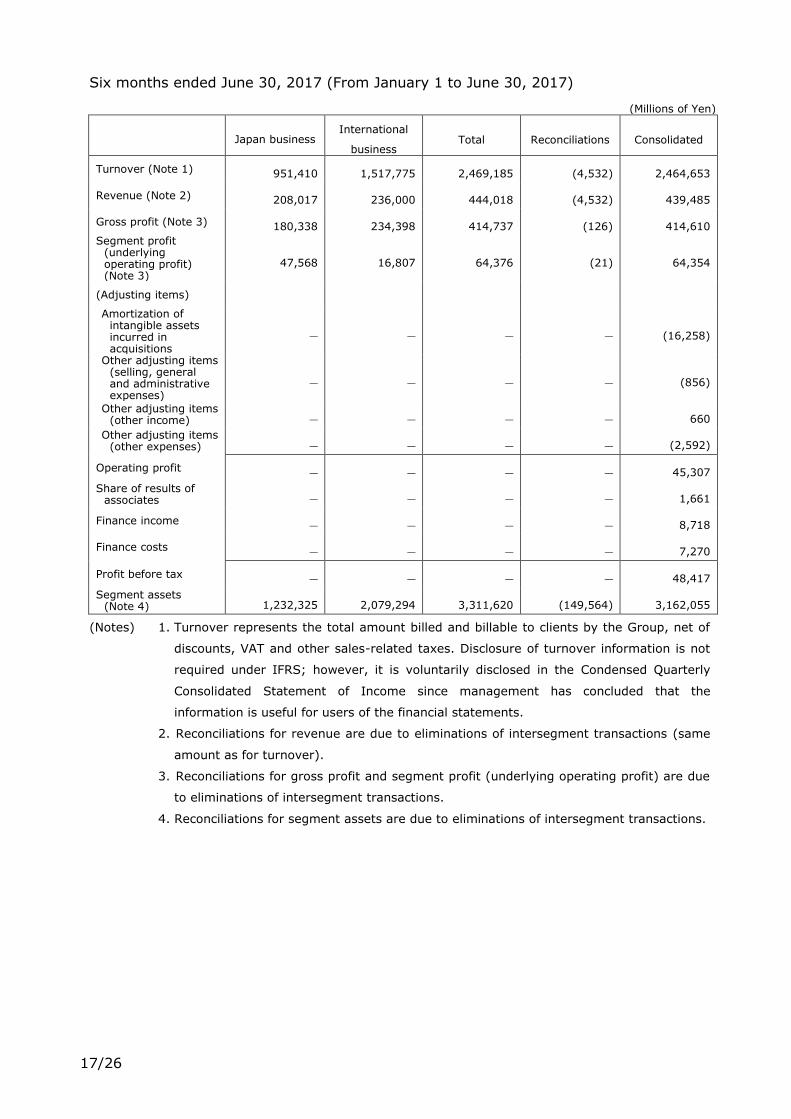
(2) Information on reportable segments
Segment profit is based on operating profit net of “Amortization of intangible assets
incurred in acquisitions” and “Other adjusting items.”
Intersegment revenues are based on the prevailing market price.
Six months ended June 30, 2016 (From January 1 to June 30, 2016)
(Millions of Yen)
Japan business
International
business Total Reconciliations Consolidated
Turnover (Note 1) 952,128 1,425,352 2,377,480 (5,516) 2,371,963
Revenue (Note 2) 210,834 187,849 398,683 (5,516) 393,167
Gross profit (Note 3) 182,467 186,231 368,698 (79) 368,619
Segment profit (underlying operating profit) (Note 3)
52,399 16,222 68,622 (9) 68,612
(Adjusting items)
Amortization of intangible assets incurred in acquisitions
― ― ― ― (10,736)
Other adjusting items (selling, general and administrative expenses)
― ― ― ― (721)
Other adjusting items (other income) ― ― ― ― 2,670
Other adjusting items (other expenses) ― ― ― ― (1,173)
Operating profit ― ― ― ― 58,651
Share of results of associates ― ― ― ― 1,437
Finance income ― ― ― ― 4,029
Finance costs ― ― ― ― 7,309
Profit before tax ― ― ― ― 56,808
Segment assets (Note 4) 1,242,302 1,575,608 2,817,910 (116,023) 2,701,887
17/26
Six months ended June 30, 2017 (From January 1 to June 30, 2017)
(Millions of Yen)
Japan business
International
business Total Reconciliations Consolidated
Turnover (Note 1) 951,410 1,517,775 2,469,185 (4,532) 2,464,653
Revenue (Note 2) 208,017 236,000 444,018 (4,532) 439,485
Gross profit (Note 3) 180,338 234,398 414,737 (126) 414,610
Segment profit (underlying operating profit) (Note 3)
47,568 16,807 64,376 (21) 64,354
(Adjusting items)
Amortization of intangible assets incurred in acquisitions
― ― ― ― (16,258)
Other adjusting items (selling, general and administrative expenses)
― ― ― ― (856)
Other adjusting items (other income) ― ― ― ― 660
Other adjusting items (other expenses) ― ― ― ― (2,592)
Operating profit ― ― ― ― 45,307
Share of results of associates ― ― ― ― 1,661
Finance income ― ― ― ― 8,718
Finance costs ― ― ― ― 7,270
Profit before tax ― ― ― ― 48,417
Segment assets (Note 4) 1,232,325 2,079,294 3,311,620 (149,564) 3,162,055
(Notes) 1. Turnover represents the total amount billed and billable to clients by the Group, net of
discounts, VAT and other sales-related taxes. Disclosure of turnover information is not
required under IFRS; however, it is voluntarily disclosed in the Condensed Quarterly
Consolidated Statement of Income since management has concluded that the
information is useful for users of the financial statements.
2. Reconciliations for revenue are due to eliminations of intersegment transactions (same
amount as for turnover).
3. Reconciliations for gross profit and segment profit (underlying operating profit) are due
to eliminations of intersegment transactions.
4. Reconciliations for segment assets are due to eliminations of intersegment transactions.
18/26
6. Capital
(1) Dividends
Dividends paid are as follows:
Six months ended June 30, 2016 (From January 1 to June 30, 2016)
Resolution Class of shares Total dividends
(Millions of Yen)
Dividends per
share
(Yen)
Basis date Effective date
Annual Shareholders
Meeting
(March 30, 2016)
Ordinary
shares 11,405 40.00
December 31,
2015
March 31,
2016
Six months ended June 30, 2017 (From January 1 to June 30, 2017)
Resolution Class of shares Total dividends
(Millions of Yen)
Dividends per
share
(Yen)
Basis date Effective date
Board of Directors
(February 14, 2017)
Ordinary
shares 12,831 45.00
December 31,
2016
March 9,
2017
Dividends for which the basis date falls within the first six months of each fiscal
year and the effective date is after the end of the second quarter of each fiscal
year are as follows:
Six months ended June 30, 2016 (From January 1 to June 30, 2016)
Resolution Class of shares Total dividends
(Millions of Yen)
Dividends per
share
(Yen)
Basis date Effective date
Board of Directors
(August 12, 2016)
Ordinary
shares 11,405 40.00 June 30, 2016
September 2,
2016
Six months ended June 30, 2017 (From January 1 to June 30, 2017)
Resolution Class of shares Total dividends
(Millions of Yen)
Dividends per
share
(Yen)
Basis date Effective date
Board of Directors
(August 9, 2017)
Ordinary
shares 12,685 45.00 June 30, 2017
September 1,
2017
(2) Purchase of treasury shares
The Company conducted a share repurchase by resolution at its meeting of the
Board of Directors held on February 14, 2017, pursuant to the Company’s Articles
of Incorporation in accordance with Article 156 of the Companies Act, as applied by
replacing certain terms under the provisions of Article 165, Paragraph 3 of the Act,
in the following manner.
1) Class of shares repurchased: Common shares of the Company
2) Total number of shares repurchased: 3,235,300 shares
3) Total repurchase cost: 19,999 million yen
4) Repurchase period: February 20, 2017 to May 17, 2017
5) Method of repurchase: Open market purchase on the Tokyo
Stock Exchange

19/26
7. Other Income
The breakdown of other income is as follows:
(Millions of Yen)
Six months ended
June 30, 2016
(From January 1
to June 30, 2016)
Six months ended
June 30, 2017
(From January 1
to June 30, 2017)
Profit distributions 3,881 2,844
Gain on sale of property, plant and equipment, intangible
assets and investment property 1,533 660
Gain on sale of subsidiaries and associates shares 747 ―
Other 1,112 821
Total 7,274 4,327
8. Other Expenses
The breakdown of other expenses is as follows:
(Millions of Yen)
Six months ended
June 30, 2016
(From January 1
to June 30, 2016)
Six months ended
June 30, 2017
(From January 1
to June 30, 2017)
Amortization of long-term prepaid expenses 1,753 1,934
Foreign exchange losses 134 185
Loss on sale of property, plant and equipment, intangible
assets and investment property 8 17
Impairment losses 56 689
Share-based compensation expenses settled in cash ― 1,473
Other 1,378 951
Total 3,331 5,251
9. Finance Income and Finance Costs
(1) The breakdown of finance income is as follows:
(Millions of Yen)
Six months ended
June 30, 2016
(From January 1
to June 30, 2016)
Six months ended
June 30, 2017
(From January 1
to June 30, 2017)
Interest income 1,032 993
Dividend income 2,081 2,305
Changes in fair value of contingent consideration ― 4,981
Other 915 438
Total 4,029 8,718

20/26
(2) The breakdown of finance costs is as follows:
(Millions of Yen)
Six months ended
June 30, 2016
(From January 1
to June 30, 2016)
Six months ended
June 30, 2017
(From January 1
to June 30, 2017)
Interest expense 3,366 5,224
Changes in fair value of contingent consideration 2,541 ―
Remeasurements of stock purchase obligations ― 1,623
Foreign exchange losses 1,111 279
Other 290 142
Total 7,309 7,270
10. Earnings Per Share
(1) Basic earnings per share and diluted earnings per share
Six months ended
June 30, 2016
(From January 1
to June 30, 2016)
Six months ended
June 30, 2017
(From January 1
to June 30, 2017)
Basic earnings per share (Yen) 125.50 108.33
Diluted earnings per share (Yen) 125.50 108.33
Second quarter ended
June 30, 2016
(From April 1
to June 30, 2016)
Second quarter ended
June 30, 2017
(From April 1
to June 30, 2017)
Basic earnings per share (Yen) 65.12 45.23
Diluted earnings per share (Yen) 65.12 45.23

21/26
(2) Basis of calculating basic earnings per share and diluted earnings per share
Six months ended
June 30, 2016
(From January 1
to June 30, 2016)
Six months ended
June 30, 2017
(From January 1
to June 30, 2017)
Profit for the period used for calculation of basic earnings
per share and diluted earnings per share
Profit for the period attributable to owners of the parent
(Millions of Yen) 35,785 30,712
Amounts not attributable to ordinary equity holders of
the parent (Millions of Yen) ― ―
Profit for the period used for calculation of basic earnings
per share (Millions of Yen) 35,785 30,712
Adjustment
Share-based payment held by associates (Millions of
Yen) (1) (0)
Profit for the period used for calculation of diluted
earnings per share (Millions of Yen) 35,783 30,712
Weighted average number of ordinary shares outstanding
used for the calculation of basic earnings per share and
diluted earnings per share
Weighted average number of ordinary shares outstanding
used for the calculation of basic earnings per share
(Thousands of shares)
285,138 283,518
Effect of dilutive potential ordinary shares (Thousands
of shares) ― ―
The weighted average number of ordinary shares
outstanding used for the calculation of diluted
earnings per share (Thousands of shares)
285,138 283,518
Second quarter ended
June 30, 2016
(From April 1
to June 30, 2016)
Second quarter ended
June 30, 2017
(From April 1
to June 30, 2017)
Profit for the period used for calculation of basic earnings
per share and diluted earnings per share
Profit for the period attributable to owners of the parent
(Millions of Yen) 18,569 12,769
Amounts not attributable to ordinary equity holders of
the parent (Millions of Yen) ― ―
Profit for the period used for calculation of basic earnings
per share (Millions of Yen) 18,569 12,769
Adjustment
Share-based payment held by associates (Millions of
Yen) (0) (0)
Profit for the period used for calculation of diluted
earnings per share (Millions of Yen) 18,568 12,768
Weighted average number of ordinary shares outstanding
used for the calculation of basic earnings per share and
diluted earnings per share
Weighted average number of ordinary shares outstanding
used for the calculation of basic earnings per share
(Thousands of shares)
285,138 282,299
Effect of dilutive potential ordinary shares (Thousands
of shares) ― ―
The weighted average number of ordinary shares
outstanding used for the calculation of diluted
earnings per share (Thousands of shares)
285,138 282,299
22/26
11. Financial Instruments
(1) The carrying amount and fair value of financial instruments
The breakdown of the carrying amount and fair value of financial instruments as of
December 31, 2016 and June 30, 2017 is as follows:
The fair value of financial assets and financial liabilities measured at amortized cost
approximates their carrying amount, except for long-term borrowings.
(Millions of Yen)
FY2016
(As of December 31, 2016)
The second quarter
(As of June 30, 2017)
Carrying amount Fair value Carrying amount Fair value
Long-term borrowings 275,831 277,518 416,630 419,348
(Note) Current portion that is scheduled for repayment within one year is included.
The fair value of long-term borrowings is determined by discounting the total of the
principal and interest by the interest rate assumed in a case where the same loan is
newly made.
The fair value hierarchy of long-term borrowings is categorized within Level 3.
(2) Fair value hierarchy of financial instruments
Financial instruments measured at fair value on a recurring basis after initial
recognition are categorized into the three levels of the fair value hierarchy according
to observability and significance of input used in measurements. The fair value
hierarchy is defined as follows:
Level 1: Fair value measured at the quoted price in the active market
Level 2: Fair value that is measured using the observable price other than
categorized in Level 1 directly or indirectly
Level 3: Fair value that is measured based on unobservable inputs
When multiple inputs are used to measure fair value, fair value levels are determined
based on the lowest level input that is significant to the entire fair value
measurement.
Transfers between levels of the fair value hierarchy are deemed to have occurred at
the beginning of each quarter.
23/26
There are no transfers between Level 1 and Level 2 for the six months ended June
31, 2016 and the six months ended June 30, 2017.
FY2016 (As of December 31, 2016)
(Millions of Yen)
Level 1 Level 2 Level 3 Total
Financial assets
Derivative assets ― 26,240 ― 26,240
Equity securities 168,406 ― 12,314 180,720
Other 514 2,397 9,337 12,250
Total 168,920 28,637 21,652 219,211
Financial liabilities
Derivative liabilities ― 4,478 ― 4,478
Stock purchase
obligations ― ― 107,568 107,568
Other (mainly
contingent
consideration)
― ― 66,021 66,021
Total ― 4,478 173,589 178,067
The second quarter (As of June 30, 2017)
(Millions of Yen)
Level 1 Level 2 Level 3 Total
Financial assets
Derivative assets ― 20,464 ― 20,464
Equity securities 201,057 ― 15,904 216,962
Other 520 2,830 11,259 14,610
Total 201,577 23,295 27,164 252,037
Financial liabilities
Derivative liabilities ― 5,084 ― 5,084
Stock purchase
obligations ― ― 112,330 112,330
Other (mainly
contingent
consideration)
― ― 78,259 78,259
Total ― 5,084 190,589 195,674
The fair values of interest rate swap contracts and foreign exchange contracts
included in derivative assets and derivative liabilities are categorized within Level 2
as they are valuated using price estimates obtained from financial institutions or
24/26
observable market data.
The fair values of stocks included in equity securities and other (financial assets) for
which active markets exist are categorized within Level 1 as they are determined
based on market prices. For stocks in which active markets do not exist, the stocks
valuated using observable market data are categorized within Level 2, while stocks
valuated based mainly on market approaches using unobservable inputs are
categorized within Level 3. Significant unobservable inputs mainly include the
price/net asset value multiples, and fair value increases (decreases) based on the
increase (decrease) of the price/net asset value multiples. The price/net asset value
multiples used as of December 31, 2016 and June 30, 2017 are both 0.68.
The fair values of stock purchase obligations and other (financial liabilities) are
categorized within Level 3 as they are valuated based on the discounted cash flow
method using unobservable inputs. As the major unobservable inputs used in the
valuation of other (financial liabilities) are mainly future profit levels, their fair values,
etc. will increase (decrease) in line with the improvement (deterioration) of profit
levels.
The fair values of assets and liabilities categorized within Level 3 are measured using
asset and liability valuation methods determined by the department in charge in
accordance with fair value measurement valuation policies and procedures. Fair
value measurement results are approved by the appropriate personnel in charge.
The schedule of financial instruments categorized within Level 3 is as follows:
(Millions of Yen)
Financial assets
Six months ended
June 30, 2016
(From January 1
to June 30, 2016)
Six months ended
June 30, 2017
(From January 1
to June 30, 2017)
Balance at the beginning of the period 19,984 21,652
Other comprehensive income (Note 1) (1,317) 467
Purchases 1,564 5,196
Sales or settlements (790) (128)
Transfers out of Level 3 (Note 2) ― (21)
Other (458) (2)
Balance at the end of the period 18,981 27,164

25/26
(Millions of Yen)
Financial liabilities
Six months ended
June 30, 2016
(From January 1
to June 30, 2016)
Six months ended
June 30, 2017
(From January 1
to June 30, 2017)
Balance at the beginning of the period 90,421 173,589
Profit or loss (Note 3) 1,920 (3,357)
Purchases 14,866 25,726
Sales or settlements (20,870) (4,921)
Other (10,227) (446)
Balance at the end of the period 76,109 190,589
(Notes) 1 “Other comprehensive income” is associated with financial assets measured at fair value
through other comprehensive income and included in “Net change in financial assets
measured at fair value through other comprehensive income.”
2 “Transfers out of Level 3” for the six months ended June 30, 2017 are due to investees
listed on exchanges.
3 “Profit or loss” is associated with financial liabilities measured at fair value through profit
or loss and included in finance income or finance costs. Profit or loss arising from financial
instruments held at the end of the quarter amounted to ¥1,920 million (finance costs)
and ¥3,357 million (finance income) for the six months ended June 30, 2016 and the six
months ended June 30, 2017, respectively.
12. Subsequent Events
No items to report
2. Other Information
(1) Dividends from surplus
With regard to the interim dividend for the fiscal year ending December 31, 2017
(from January 1, 2017 to December 31, 2017), the Company resolved at its meeting
of the Board of Directors held on August 9, 2017 that dividends shall be paid to the
shareholders whose names are recorded in the last register of shareholders as of
June 30, 2017, in the following manner.
1) Total amount of dividends: JPY 12,685 million
2) Dividend per share: JPY 45.00
3) Effective date of the right to collect payment and commencement date of
dividend payment:
September 1, 2017
26/26
(2) Significant lawsuits, etc.
Although there are pending lawsuits, etc. involving the Group, their impact on the
Group’s financial position and financial results is deemed to be insignificant.