quarterly progress report the kansas geological survey · pdf filethe kansas geological survey...
TRANSCRIPT


2
QUARTERLY PROGRESS REPORT
Award Number: DE-FE0004566
Recipient
University of Kansas Center for Research and The Kansas Geological Survey
1930 Constant Avenue Lawrence, Kansas 66047
Title
“Prototyping and testing a new volumetric curvature tool for modeling
reservoir compartments and leakage pathways in the Arbuckle saline aquifer: reducing uncertainty in CO2 storage and permanence”
Project Director/Principal Investigator: Jason Rush Joint Principal Investigator: Lynn Watney
7th Quarter Progress Report
Date of Report: 8/9/2012
Authors: Jason Rush and W. Lynn Watney
Period Covered by this Report: April 1, 2012 through July 30, 2012

1
Executive Summary
The contract for the project, “Prototyping and testing a new volumetric curvature tool for modeling reservoir compartments and leakage pathways in the Arbuckle saline aquifer: reducing uncertainty in CO2 storage and permanence,” was signed with U.S. DOE on October 1, 2010. The project is collaboration between the Kansas Geological Survey (KGS) and its industry partner MVP LLC (a partnership between Murfin Drilling Company and Vess Oil Corporation). The project study area is located in Ellis County, Kansas.
Major results from this quarter include: (1) simulation and history matching of the pre-spud geocellular model; (2) completion of the petrophysical evaluation for the McCord-A 20H logs; (3) inclusion of the seismic inversion volume into the porosity modeling workflow; and (4) delivery of thin sections corresponding to the L. Hadley-4 core analyses, which will be used to constrain rock fabric-petrophysical relationships (i.e., facies model). A numerical simulation model has been created for the Bemis Shutts Arbuckle formation to evaluate flux between fracture blocks and the applicability of directional wells in this style of reservoir. The simulation model focused on the fault block including or adjacent to the McCord-A 20H well. The model has been validated as a predictive tool by history matching individual well production history. The Leases in the study area have been on production from 1937, but the principal validation is based on well tests and historical water cut performance over the period September 1990 through December 2011. The history match is not a unique solution. Several suitable matches were derived under different values for the uncertainty parameters. The next phase of these models will be to analyze the effect of uncertain on the flux between fault blocks. Structural interpretation of the McCord-A 20H image log is ongoing. Structural heterogeneities identifiable in the image log consist of fault or paleokarst breccias, to shale-filled faults, solution-enlarged vugs, and faults/fractures having a disparate apertures and orientations. Work on the revised fault model is ongoing. We are investigating whether Petrel’s seismic-based automatic fault extraction can identify faults/fractures consistent with the volumetric curvature interpretation. Different seismic pre-processing routines have been carried-out raging from variance, vertical smoothing, chaos, and ant-tracking. Such processed volumes are then used by automatic fault extraction to quickly identify potential faults. Next quarter objectives are: (1) to acquire fluid samples from boreholes offsetting the McCord-A 20H; (2) complete seismic attribute conditioning volumes; (3) finalize facies model; (4) complete image log interpretation; (5); continue simulation-based sensitivity studies; and (6) import remote sensing interpretations (ArcGIS shape file format). Research results to date will be presented in August at the DOE’s Carbon Storage R&D Project Review Meeting and again in October during the DOE’s Carbon Storage Peer Review.

2
DISCUSSION Approach:
Pre-spud Simulation—Simulation studies are being undertaken by Gene Williams. As discussed in earlier reports, a pre-spud, static geocellular model was created in Petrel. Specific reservoir structure and data were exported from the static model for use in the dynamic numerical simulation models. For these studies, numerical simulation modeling is carried out utilizing the Computer Modeling Group simulation tools “IMEX”, a black oil simulation tool. The static model data was exported in RESCUE format. The RESCUE file was imported into the CMG software program BUILDER. The total grid as imported is illustrated in Figure 1. The static model covered a larger volume of the reservoir than necessary for analysis of the fault blocks relevant to the McCord-A 20 H lateral wells. Using BUILDER, a sub-grid was extracted from the static model data for use in dynamic modeling. This sub-grid and the relevant fault block ID is presented in Figure 2. The McCord-A 20H well is located in Fault Block 11. The specific parameters imported from the static model were:
• Rescue grid: corner point geometry o 166×169×60 – total cells:1,683,240 (active cells: 793,080) o Each cell is 25m by 25m (82 ft by 82 ft) areally and 4-ft thick o Several no-throw faults are present throughout the model
• Dynamic model sub-grid (only modeling fault blocks of interest) o 70×57×60 – total cells: 239,400 (active cells:74,640) o Each cell is 25m by 25m (82 ft by 82 ft) areally and 4 ft thick o Several no-throw faults are present throughout the model
• Cell porosity – Figure 3 illustrates the porosity distribution in the sub-grid model and in fault block 11
• Cell permeability – Figure 4 illustrates the permeability distribution in the sub-grid model and in fault block 11
• Null (inactive) cells • Initial water saturation • Well trajectories
Other relevant simulation grid values assigned to the dynamic model are:
• A pseudo steady state (Fetkovich) aquifer function is connected to the bottom of the model o Aquifer parameters (height, area, porosity, permeability, etc) are history matching
variables • Rock compressibility 5.0E-6 psi-1 at 1500 psi
The reservoir fluid properties were determined from correlations and the oil PVT report for the Peavy No B-1 well which is located in the Bemis-Shutts Field. PVT values for gas oil ratio, formation volume factor and viscosity are illustrated in Figures 5 and 6. For simulation modeling the oil at initial conditions, in the reservoir, was assumed to be under-saturated with a bubble point pressure of 1000 psi.

3
SCAL was not available for the Bemis Shutts reservoir but typical values for similar reservoirs were taken from the available literature. For the reference case a residual oil saturation of 35%, a connate water saturation of 27%, and a Krw at residual oil of 0.25 were assumed (Figure 7). Note that these endpoints are history matching variables and the values assumed were selected to ensure that they would serve as limiting values. The water saturation for the reservoir model was taken from static model. However at time 0, the simulation model is initialized assuming capillary equilibrium. For this, a capillary pressure curve is estimated from the saturation versus height above free water level as illustrated in Figure 8 (the capillary pressure function is the black line with the yellow markers). This capillary pressure function was applied to an uncertain original oil water contact (OWC) near 1550 ft SS. For capillary equilibrium, IMEX calculates first an initial cell pressure based on height above the contact and density differences between the oil and water. With this pressure the software then calculates a capillary pressure shift from the capillary pressure curve to match the input water saturation. This process ensures that the model is initially in equilibrium. The initialized model and water saturation are illustrated in Figure 9. The initial in place volumes calculated are presented in Table 1. Well locations relative to the selected sub-grid are shown in the various images of the simulation grid. The relevant wells are listed in Table 2. The perforation history of each well was review to determine when and which layers in the model will be open to flow for each well. Oil production data, by lease was available on an annual basis from 1937 to 1970 and monthly from 1970 to 2011 as illustrated in Figure 10. Also, the number of wells available for production in each lease was available over this period. However, allocated production by well was not available. For purposes of these models, the indicated lease production was assumed to be divided equally by the number of wells shown as available for production. For history matching, data was available monthly and from test separator for a period from 1994 to 2011. It is this monthly data, especially the water cut information, that is used to validate the simulation model. Production test data was available for:
• Figure 11: McCord A-11 • Figure 12: McCord A-17 • Figure 13: Colahan B-28 • Figure 14: Hall B-15
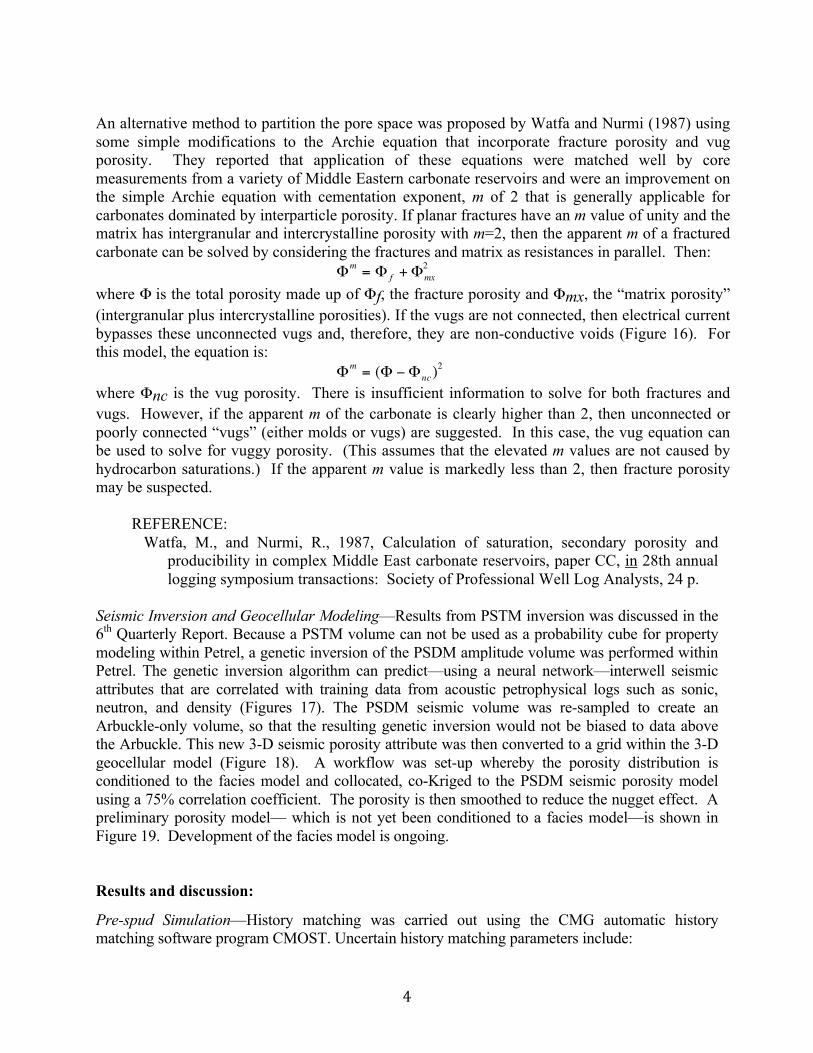
For the producing period, well control uses estimated oil rate by well. Petrophysical evaluation— The total porosity of the Arbuckle was estimated using a multi-mineral model of dolomite, quartz, calcite, and shale applied to photoelectric factor, gamma-ray, density and neutron porosity curves (Figure 15). This porosity was then partitioned between “primary” and “secondary” porosity by comparing sonic porosity (calibrated to the multi-mineral matrix transit time) to the total volumetric porosity. Many empirical studies have suggested that the sonic porosity is primarily sensitive to interparticle porosity (“primary”) and that the difference with total porosity reflects vugs (“secondary porosity”), although the explanatory physical model is mildly controversial.
4
An alternative method to partition the pore space was proposed by Watfa and Nurmi (1987) using some simple modifications to the Archie equation that incorporate fracture porosity and vug porosity. They reported that application of these equations were matched well by core measurements from a variety of Middle Eastern carbonate reservoirs and were an improvement on the simple Archie equation with cementation exponent, m of 2 that is generally applicable for carbonates dominated by interparticle porosity. If planar fractures have an m value of unity and the matrix has intergranular and intercrystalline porosity with m=2, then the apparent m of a fractured carbonate can be solved by considering the fractures and matrix as resistances in parallel. Then: Φm = Φ f +Φmx
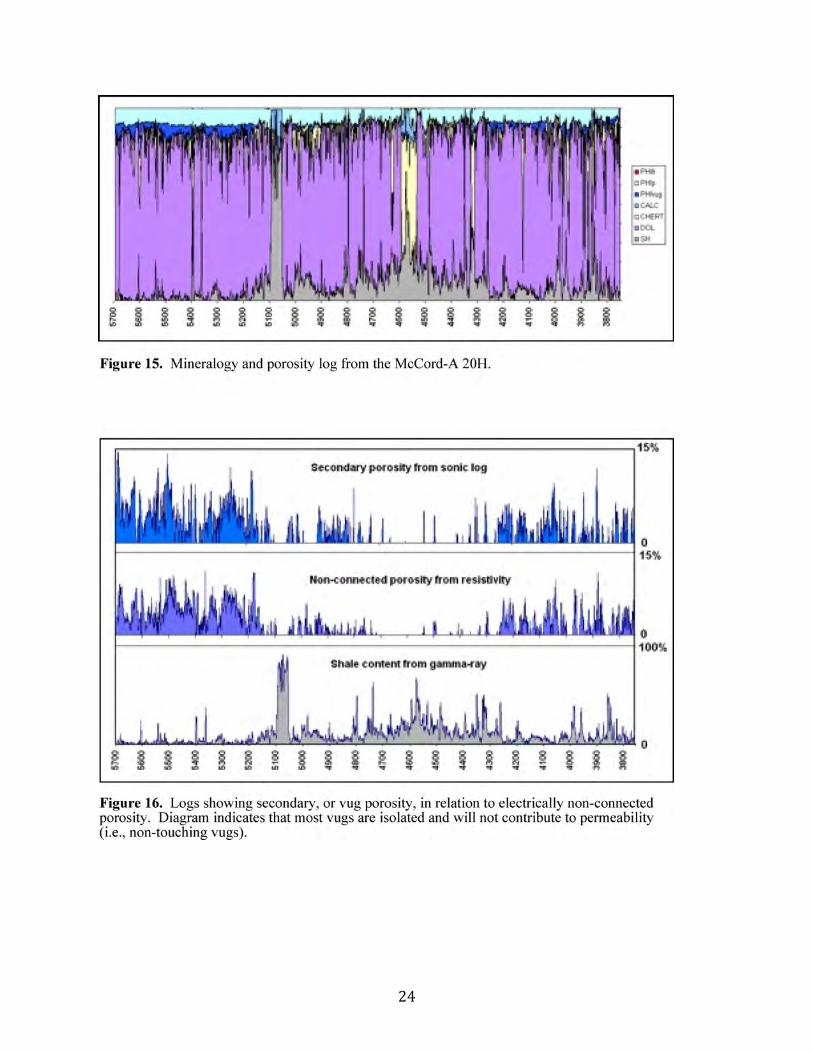
2 where Φ is the total porosity made up of Φf, the fracture porosity and Φmx, the “matrix porosity” (intergranular plus intercrystalline porosities). If the vugs are not connected, then electrical current bypasses these unconnected vugs and, therefore, they are non-conductive voids (Figure 16). For this model, the equation is: Φm = (Φ −Φnc)
2 where Φnc is the vug porosity. There is insufficient information to solve for both fractures and vugs. However, if the apparent m of the carbonate is clearly higher than 2, then unconnected or poorly connected “vugs” (either molds or vugs) are suggested. In this case, the vug equation can be used to solve for vuggy porosity. (This assumes that the elevated m values are not caused by hydrocarbon saturations.) If the apparent m value is markedly less than 2, then fracture porosity may be suspected.
REFERENCE: Watfa, M., and Nurmi, R., 1987, Calculation of saturation, secondary porosity and
producibility in complex Middle East carbonate reservoirs, paper CC, in 28th annual logging symposium transactions: Society of Professional Well Log Analysts, 24 p.
Seismic Inversion and Geocellular Modeling—Results from PSTM inversion was discussed in the 6th Quarterly Report. Because a PSTM volume can not be used as a probability cube for property modeling within Petrel, a genetic inversion of the PSDM amplitude volume was performed within Petrel. The genetic inversion algorithm can predict—using a neural network—interwell seismic attributes that are correlated with training data from acoustic petrophysical logs such as sonic, neutron, and density (Figures 17). The PSDM seismic volume was re-sampled to create an Arbuckle-only volume, so that the resulting genetic inversion would not be biased to data above the Arbuckle. This new 3-D seismic porosity attribute was then converted to a grid within the 3-D geocellular model (Figure 18). A workflow was set-up whereby the porosity distribution is conditioned to the facies model and collocated, co-Kriged to the PSDM seismic porosity model using a 75% correlation coefficient. The porosity is then smoothed to reduce the nugget effect. A preliminary porosity model— which is not yet been conditioned to a facies model—is shown in Figure 19. Development of the facies model is ongoing. Results and discussion:
Pre-spud Simulation—History matching was carried out using the CMG automatic history matching software program CMOST. Uncertain history matching parameters include:

5
• Aquifer Parameters o Angle, radius, thickness
• Depth to Oil Water Contact • Reference Pressure (at the oil water contact) • Relative Permeability shape and end-points
o Gravity Stable or Corey o Critical water saturation o Residual oil saturation
• Transmissibility (i.e. Connectivity or Tortuousity) o Variable by fault block o I-Direction versus J-Direction anisotropy
• Pore volume modifiers by fault block The objective functions for the history matching were the water cut match for the 4 wells. The history matching process involved numerous simulation runs and used both CMOST DECE and Latin Hypercube with proxy approximation objective methods. During the process, response surface modeling using the software program JMP was applied to evaluate the significance of the uncertainty parameters and to accelerate the history matching process. The results of the history match showing an oil production and water cut case for the combined wells is illustrated in Figure 20. The dark green line represents cumulative oil production, the lighter green line represents oil rate in STB/day. The black line shows the water cut—which is very high throughout the productive life of these wells. Individual well matches are provided in Figures 21–24. The historical water cut is represented by the blue circles, and the calculated water cut is represented by the red line. Petrophysical evaluation—There is an excellent visual match between the sonic secondary porosity and the non-connected vuggy porosity calculated by the Watfa-Nurmi equation, which is a mutually supportive confirmation that both approaches are sensitive measures of larger pores, even though they are based on different physical properties (review Figure 16). The close match in values also suggests that the majority of the vugs are non-connected, at least in the electrical sense, rather that there are both connected and non-connected vugs. These results will be incorporated into the final geocellular model. Seismic Inversion and Geocellular Modeling— Because bore-hole data represent only a fraction of a percent of the volume of oil & gas reservoirs, seismic attributes are frequently used by industry to predict inter-well, petrophysical trends. Geocellular porosity models that only model petrophysical properties measured from wire-line logs appear can appear almost random if not conditioned to facies and stratigraphic models and/or seismically derived probability volumes. Results from the PSDM genetic inversion for 3-D porosity trends is encouraging and cross-correlation to “blind wells” is 78%. Despite the current lack of a facies model, conditioning provided by the 3-D PSDM seismic porosity attribute during the porosity modeling routine results in a spatial distribution of porosity that is stratigraphically realistic (review Figure 20).

6
Conclusions:
Results from the simulation, petrophysical evaluation, and PSDM genetic inversion are promising and will aid the evaluation of seismic volumetric curvature for structural characterization and seal risk assessment. We should complete the integrative image interpretation (e.g., with petrophysical evaluation and seismic attributes) next quarter. The interpretation will also be integrated with observations made from the L. Hadley-4 core description, routine core analyses, and thin section descriptions. Observations from core, image logs, and the petrophysical evaluation will permit us to build a robust facies model not only includes depositional facies, but also paleokarst-related facies. With the delivery of Petrel 2012, we can now move forward with importing remote sensing interpretation results, which are in ArcGIS shape file format.
Cost Status
Please refer to Attachment 1
Schedule/Milestone Status
Please refer to Attachment 2 BP1 Milestone Status: BP1–BP2 milestone status is as follows:
• Milestone 1.1 (completed): obtain field data including 3-D seismic, gravity magnetic, satellite imagery, production records, and well logs
• Milestone 1.2 (completed): seismic processing and interpretation, VC-analysis, surface mapping, generate pre-spud geocellular model
• Milestone 1.3 (completed): history match well performance using pre-spud geocellular model
• Milestone 1.4 (completed): locate, permit, drill, and log horizontal borehole (i.e., McCord-A 20H)
• Milestone 2.1 (in progress): complete formation evaluation: log analysis, XRD, core analysis, and water geochemistry
• Milestone 2.2 (completed): VC and seismic interpretation remain unchanged. Inversion completed.
• Milestone 2.3 (in progress): will constrain fault model to image interpretation and simulation results.
Changes in Approach or Aims
There are no changes to the post-Continuation SOPO for BP2. However, we are investigating using Petrel seismic processing tools and conditioning techniques for improving and streamlining structural, facies, and petrophysical modeling workflows as well as top and lateral seal assessment.
Actual or Anticipated Problems

7
There are no updates regarding actual or anticipated problems since the last quarterly report.
Absence or Key Personnel Changes
There are no updates regarding absence or key personnel changes since the last report. Some promising news is that the Energy Research Section at the KGS has hired a replacement simulation engineer, Eugene Holubnyak. He has prior characterization experience working on DOE carbon sequestration studies.
Technology Transfer
The project website (http://www.kgs.ku.edu/PRS/Bemis/index.html) has been constructed and is available for public access. The project web site will display all results and interpretations obtained from this study and will be maintained by the KGS. Technology transfer activities are anticipated to begin during the final half of the last year, when all data collection has been completed, and analysis, interpretation, and modeling are in progress to demonstrate and validate the feasibility of using volumetric curvature analysis to characterize paleokarst reservoir compartmentalization to better model of CO2 storage and permanence in saline aquifers such as the Arbuckle in Kansas. Research results to date will be presented in August at the DOE’s Carbon Storage R&D Project Review Meeting and again in October during the DOE’s Carbon Storage Peer Review.

8

9

10

11

12

13

14

15

16

17

18

19

20

21

22

23
24

25

26

27

28

29

30

31

32

33

34