quarterly report - european commission · quarterly report. disclaimer: this report prepared by the...
TRANSCRIPT

Energy
on European Electricity MarketsMarket Observatory for EnergyDG EnergyVolume 8 (issue 3; third quarter of 2015)
Quarterly Report

DISCLAIMER: This report prepared by the Market Observatory for Energy of the European Commission aims at enhancing public access to information about prices of electricity in the Members States of the European Union. Our goal is to keep this information timely and accurate. If errors are brought to our attention, we will try to correct them. However the Commission accepts no responsibility or liability whatsoever with regard to the information contained in this publication.
Copyright notice: Reproduction is authorised provided the source is acknowledged. © European Commission, Directorate-General for Energy, Market Observatory for Energy, 2015
Commission européenne, B-1049 Bruxelles / Europese Commissie, B-1049 Brussel – Belgium
E-mail: [email protected]

ContentHighlights of the report 2
Executive summary 3
1. Electricity demand drivers 4
2. Evolution of commodity and power prices 6
2.1. Evolution of power prices, and the main factors affecting power generation costs 6
2.2. Comparisons of monthly electricity baseload prices on electricity markets 10
3. Traded volumes, market liquidity and cross border trade of electricity 16
3.1. Comparison of wholesale market trading platforms and the over-the-counter (OTC) markets 16
3.2. Cross border trade of electricity 18
4. Regional wholesale electricity markets 20
4.1. Central Western Europe (Austria, Belgium, France, Germany, the Netherlands, Switzerland) 20
4.2. British Isles (UK, Ireland) 22
4.3. Northern Europe (Denmark, Estonia, Finland, Latvia, Lithuania, Norway, Sweden) 23
4.4. Apennine Peninsula (Italy) 24
4.5. Iberian Peninsula (Spain and Portugal) 25
4.6. Central Eastern Europe (Czech Republic, Hungary, Poland, Romania, Slovakia, Slovenia) 26
4.7. South Eastern Europe (Greece) 28
5. International outlook – comparing EU power prices with international peers 30
6. Retail electricity prices in the EU 32
7. Glossary 38

2
Highlights of the report• Wholesale electricity prices were generally up at the beginning of Q3 2015, in the consequence of high temperatures
and increasing electricity consumption in many EU countries.
• In July 2015 high temperatures in Spain and Italy have led to the highest monthly electricity consumption in the last fifteen years.
• Meanwhile in the Nordpoolspot market the average wholesale system price fell below 10 €/MWh, which was the lowest in the last ten years.
• Low prices in northern markets and high prices in southern markets have led to price divergences, reflecting the need of further reinforcement of the European internal electricity market.
• Although the share of renewable power generation (wind, solar and biomass) slightly decreased in Q3 2015, over the last few years renewables gradually diminished the share of fossil fuels (especially natural gas) in EU power genera-tion.
• Wholesale power market liquidity was the highest in the German and Nordic markets over the last few quarters; some other markets (e.g.: France and Central Eastern Europe) managed to increase their liquidity.
• In September 2015 there was a threefold difference between the retail household electricity prices of the cheapest and the most expensive EU capital cities.

3
Executive summary• Electricity consumption in the EU increased by 1.1% in June-August 2015, compared to the same period of the pre-
vious year, whereas economic growth in the EU-28 continued and GDP was up 1.9% in year-on year comparison in the third quarter of 2015. Decoupling of the evolution of electricity consumption from the economic growth in the EU continued in the third quarter of 2015, pointing to decreasing energy intensity of the EU economy.
• The Platts’ European Power Index (PEP), expressing the average evolution of the wholesale power prices in the European markets showed a sharp increase in July 2015, as high temperatures increased demand the for electricity in order to satisfy residential cooling needs in EU many countries. Besides the increasing electricity demand high temperatures impacted nuclear power generation in many countries, putting an upward pressure on wholesale electricity prices. In Spain and Italy heat waves resulted in the highest monthly electricity consumption in the last fifteen years. In August and Septem-ber the PEP index slightly decreased, as the period of high temperatures and the excess demand for power was over.
• The Nordpoolspot wholesale electricity system price fell below 10 €/MWh in July 2015 on monthly average, which was the lowest in the last ten years. Abundant hydro generation, especially in Norway and Sweden assured very low wholesale prices in July, however, this cheap power could not be transported to all areas of the Nordic region, in the consequence of insufficient interconnector capacities, leading to diverging area prices across the Nordic region, which varied between 8 €/MWh in Norway and 44-45 €/MWh in Latvia and Lithuania.
• Over the last few years the role of fossil fuels gradually decreased in the EU power generation mix. As the share of wind, solar and biomass kept on increasing, the importance of natural gas decreased significantly in most of the EU countries, as it can be seen from the dwindling quantity of natural gas delivered to power generation. Clean spark spreads, measuring the profitability of gas fired generation, fell below zero in many markets. The role of coal in power generation has also been gradually decreasing, though not so intensely as the share of natural gas.
• European wholesale electricity markets differ substantially regarding the liquidity of electricity trade and the
role of exchange platforms and over the counter bilateral trade contracts. Market liquidity, defined as the ratio of the volume of traded power and the consumption of electricity, is highest in Germany, followed by the Nordic market, the UK and other continental markets. In Germany, France and the UK over the counter trade and bilateral contracts make up the bulk of power trade as opposed to organised exchange platforms.
• Over the last few years industrial retail electricity prices showed signs of gradual convergence across the EU, especially in the case of customers having high annual electricity consumption, while in the case of households not too much convergence could be observed. Looking at household retail electricity prices in European capital cities, in Septem-ber 2015 there was a threefold price difference between the cheapest and the most expensive capitals. Behind the change in the final retail prices over the last twelve months there were significant structural shifts within cost components (energy costs, network costs and taxes) in some capital cities, as a result of the implementation of energy policy or other general policy objectives.
4
1. Electricity demand drivers
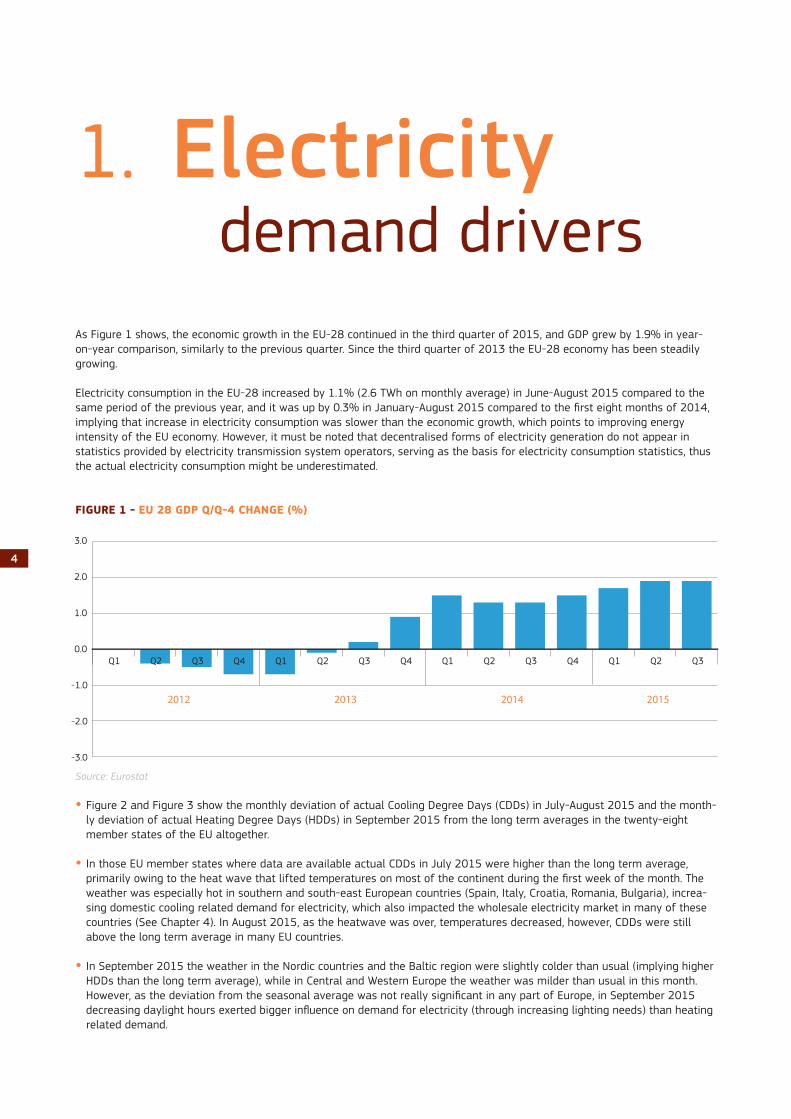
As Figure 1 shows, the economic growth in the EU-28 continued in the third quarter of 2015, and GDP grew by 1.9% in year-on-year comparison, similarly to the previous quarter. Since the third quarter of 2013 the EU-28 economy has been steadily growing.
Electricity consumption in the EU-28 increased by 1.1% (2.6 TWh on monthly average) in June-August 2015 compared to the same period of the previous year, and it was up by 0.3% in January-August 2015 compared to the first eight months of 2014, implying that increase in electricity consumption was slower than the economic growth, which points to improving energy intensity of the EU economy. However, it must be noted that decentralised forms of electricity generation do not appear in statistics provided by electricity transmission system operators, serving as the basis for electricity consumption statistics, thus the actual electricity consumption might be underestimated.
FIGURE 1 - EU 28 GDP Q/Q-4 CHANGE (%)
Source: Eurostat
• Figure 2 and Figure 3 show the monthly deviation of actual Cooling Degree Days (CDDs) in July-August 2015 and the month-ly deviation of actual Heating Degree Days (HDDs) in September 2015 from the long term averages in the twenty-eight member states of the EU altogether.
• In those EU member states where data are available actual CDDs in July 2015 were higher than the long term average, primarily owing to the heat wave that lifted temperatures on most of the continent during the first week of the month. The weather was especially hot in southern and south-east European countries (Spain, Italy, Croatia, Romania, Bulgaria), increa-sing domestic cooling related demand for electricity, which also impacted the wholesale electricity market in many of these countries (See Chapter 4). In August 2015, as the heatwave was over, temperatures decreased, however, CDDs were still above the long term average in many EU countries.
• In September 2015 the weather in the Nordic countries and the Baltic region were slightly colder than usual (implying higher HDDs than the long term average), while in Central and Western Europe the weather was milder than usual in this month. However, as the deviation from the seasonal average was not really significant in any part of Europe, in September 2015 decreasing daylight hours exerted bigger influence on demand for electricity (through increasing lighting needs) than heating related demand.
-3.0
-2.0
-1.0
0.0
1.0
2.0
3.0
Q1 Q2 Q3 Q4 Q1 Q2 Q3 Q4 Q1 Q2 Q3 Q4 Q1 Q2 Q3
2012 2013 2014 2015

5
FIGURE 2 - DEVIATION OF ACTUAL COOLING DEGREE DAYS (CDDS) FROM THE LONG TERM AVERAGE, IN JULY AND AUGUST 2015
FIGURE 3 - DEVIATION OF ACTUAL HEATING DEGREE DAYS (HDDS) FROM THE LONG TERM AVERAGE, IN SEPTEMBER 2015
Source: Eurostat/JRC. The colder is the weather, the higher is the number of HDDs; the warmer is the weather the higher is the number of CDDs.
0 20 40 60 80 100 120
ATBEBGCYCZDEDKEEESEUFIFRGRHRHUIEITLTLULVMTNLPLPTROSESISKUKATBEBGCYCZDEDKEEESEUFIFRGRHRHUIEITLTLULVMTNLPLPTROSESISKUK
July
Augu
st
-80 -60 -40 -20 0 20 40 60 80
ATBEBGCYCZDEDKEEESEUFIFRGRHRHUIEITLTLULVMTNLPLPTROSESISKUK
Septem
ber
6
2. Evolution of commodity and power prices
2.1 Evolution of power prices, and the main factors affecting power generation costs
• Coal prices (as represented by CIF ARA contracts, an import price benchmark widely used in North-Western Europe), fell to six-year lows in September 2015 (48.2 €/Mt), as Figure 4 shows, owing to amongst other factors, decreasing demand for coal in electriciry generation in Europe and in many other regions of the world. In the last few years abundant coal supplies could not adapt to decreasing demand, which has resulted in a continous price slide since the beginning of 2011.
• Natural gas prices (measured as import prices on the German border) were quite stable during the third quarter of 2015, being close to 20 €/MWh. Most of North-Western European natural gas hub prices were also close 19-21 €/MWh in Q3 2015, which was still too high to be a competitive generation source alternative to coal or renewable energy sources in most of the EU countries.
• Looking at the monthly eletrcity generation mix in the EU, Figure 5 shows that the overall electricity generation has been fol-lowing a decreasing trend over the last few years, as a result of dwindling fossil fuel generation (mainly coal and gas), with stagnating shares of nuclear and hydro, and permanently increasing renewable contribution. However, marginal electricity generation costs are still set by coal and gas in most of the EU countries, though increasing renewable contribution gradually diminshed the importance of fossil fuels in the generation mix.
• The share of renewable energy sources, though temporarily recededed in July and August 2015 in the EU (in August 28% of all generated power came from renewables, as Figure 4 shows, as opposed to 35% in May), still managed to exert a downward pressure on wholesale electricity prices in many EU markets and fossil fuel generation also became less costlier due to cheaper coal and gas.
• Decreasing conventional generation costs and abundant renewable supplies resulted in wholesale electricity prices remianing in narrow ranges (40-45 €/MWh) during the third quarter of 2015 in the EU markets on average, as the red curve in Figure 4 shows, representing the Platts Pan-European Power Index (PEP) used as an electricity price benchmark in Europe. However, due to.a heatwave at the beginning of July 2015, resulting in sudden increases in demand for electricity in most of the Euro-pean continent, the PEP index showed a measurable increase.

7
FIGURE 4 - EVOLUTION OF EUROPEAN AVERAGE WHOLESALE POWER PRICE COMPARED WITH COAL AND GAS PRICES AND THE SHARE OF RENEWABLES IN POWER GENERATION
Source: Source: Platts, BAFA, ENSTO-EPlatts PEP: Pan European Power Index (in €/MWh)Coal CIF ARA: Principal coal import price benchmark in North Western Europe (in €/Mt)DE border imp. stands for long term contract based import natural gas price on the German border (in €/MWh)RES (renewables) includes hydro, wind, solar and biomass; RES share in the total power generation estimation for the EU-28 as a whole (right hand scale)
FIGURE 5 - EXTRA-EU STEAM COAL IMPORT SOURCES AND MONTHLY IMPORTED QUANTITIES IN THE EU-28
Source: ENTSO-E, own computations
• In spite of decreasing coal prices, demand for coal in the EU were decreasing, as Figure 6 on coal imports from the major import sources shows. In June-August 2015 coal imports from extra-EU sources decreased by 11% compared to the same period of 2014 and the total monthly imports fell to five year low in August 2015. Russia assured 32% of the extra-EU coal imports in June-August 2015, followed by Colombia (26%), United States (15%), Austrailia (12%), South Africa (5%) and Indonesia (4%).
• Compared to June-August 2014, coal imports from Colombia and Australia respectively increased by 18% and 11%, while from the United States and South Africa they decreased significantly (by 34% and 40%) in June-August 2015. As the US had a decreasing share in dwindling EU coal imports in recent times, it seems that the incremental coal export supply, which appeared as the consequence of the ‘shale gas revolution’ in the US, is not shipped to the EU in such big quantities, as the European coal markets became saturated and prices are lower than a few years ago.
0.0%
5.0%
10.0%
15.0%
20.0%
25.0%
30.0%
35.0%
40.0%
10 €
20 €
30 €
40 €
50 €
60 €
70 €
80 €
90 €
100 €
Jan-
12
Feb-
12
Mar
-12
Apr
-12
May
-12
Jun-
12
Jul-1
2
Aug
-12
Sep-
12
Oct
-12
Nov
-12
Dec
-12
Jan-
13
Feb-
13
Mar
-13
Apr
-13
May
-13
Jun-
13
Jul-1
3
Aug
-13
Sep-
13
Oct
-13
Nov
-13
Dec
-13
Jan-
14
Feb-
14
Mar
-14
Apr
-14
May
-14
Jun-
14
Jul-1
4
Aug
-14
Sep-
14
Oct
-14
Nov
-14
Dec
-14
Jan-
15
Feb-
15
Mar
-15
Apr
-15
May
-15
Jun-
15
Jul-1
5
Aug
-15
Sep-
15
Platts PEP ( € /MWh) Coal CIF ARA (€/t) DE border imp. (€/MWh) RES share (% - rhs)
0 TWh
50 TWh
100 TWh
150 TWh
200 TWh
250 TWh
300 TWh
350 TWh
01 02 03 04 05 06 07 08 09 10 11 12 01 02 03 04 05 06 07 08 09 10 11 12 01 02 03 04 05 06 07 08 09 10 11 12 01 02 03 04 05 06 07 08
2012 2013 2014 2015
Other Renewables Hydro Nuclear Fossil fuels

8
FIGURE 6 – THE MOST IMPORTANT EXTRA-EU COAL IMPORT SOURCES AND MONTHLY IMPORTED QUANTITY IN THE EU-28
Source: Eurostat, COMEXT database
European emission allowance prices continued to follow their slow upward trend in the third quarter of 2015 and were above 8 €/tCO2e during most of the quarter, as presented on Figure 6. In August-September 2015 the monthly average price of the spot emission allowance contract reached 8.1 €/tCO2e, being the highest since February 2012. Increasing carbon prices might have contributed to decreasing coal imports during the last few years, as higher emission prices negatively impact coal fire generation.
FIGURE 7 – EVOLUTION OF ETS EMISSION ALLOWANCE PRICES
Source: Platts
0 Mt
2,000 Mt
4,000 Mt
6,000 Mt
8,000 Mt
10,000 Mt
12,000 Mt
14,000 Mt
16,000 Mt
18,000 Mt
20,000 Mt
Jan.
201
2
Feb.
201
2
Mar
. 201
2
Apr
. 201
2
May
. 201
2
Jun.
201
2
Jul.
2012
Aug
. 201
2
Sep.
201
2
Oct
. 201
2
Nov
. 201
2
Dec
. 201
2
Jan.
201
3
Feb.
201
3
Mar
. 201
3
Apr
. 201
3
May
. 201
3
Jun.
201
3
Jul.
2013
Aug
. 201
3
Sep.
201
3
Oct
. 201
3
Nov
. 201
3
Dec
. 201
3
Jan.
201
4
Feb.
201
4
Mar
. 201
4
Apr
. 201
4
May
. 201
4
Jun.
201
4
Jul.
2014
Aug
. 201
4
Sep.
201
4
Oct
. 201
4
Nov
. 201
4
Dec
. 201
4
Jan.
201
5
Feb.
201
5
Mar
. 201
5
Apr
. 201
5
May
. 201
5
Jun.
201
5
Jul.
2015
Aug
. 201
5
2012 2013 2014 2015
Other Ukraine Canada Indonesia South Africa Australia United States Colombia Russia
5.0 € /t CO2e
6.0 € /t CO2e
7.0 € /t CO2e
8.0 € /t CO2e
9.0 € /t CO2e
01/1
0/20
14
15/1
0/20
14
29/1
0/20
14
12/1
1/20
14
26/1
1/20
14
10/1
2/20
14
24/1
2/20
14
07/0
1/20
15
21/0
1/20
15
04/0
2/20
15
18/0
2/20
15
04/0
3/20
15
18/0
3/20
15
01/0
4/20
15
15/0
4/20
15
29/0
4/20
15
13/0
5/20
15
27/0
5/20
15
10/0
6/20
15
24/0
6/20
15
08/0
7/20
15
22/0
7/20
15
05/0
8/20
15
19/0
8/20
15
02/0
9/20
15
16/0
9/20
15
30/0
9/20
15
Spot Emission allowances Year-ahead Emission allowances Two year-ahead Emission allowances

9
• The next two charts (Figure 8 and Figure 9) show the monthly evolution of clean spark spreads and clean dark spreads, measuring the profitability of gas-fired and coal-fired power generation. With the exception of the UK, clean spark spreads were in the negative range during most of the time since 2013, implying that gas-fired generation was not profitable in the continetal markets presented on the chart (Germany, the Netherlands and Belgium, as available data on Figure 8 show). Consequently, natural gas deliveries to power generation facilities followed a decreasing trend in the EU, and natural gas was gradually squeezed out from the power mix in most of the EU countries. In the third quarter of 2015 clean spark spreads were in the positive range only in the UK and Belgium, mainly due to high local wholesale electricity prices.
• The difference in the wholesale electricity price level between the UK and Germany also impacted the local profitability of coal fired generation: while in the UK high clean dark spreads signalled the competitiveness of coal in the country (though signficiant coal-fired capacities had to be decommissioned(1) in the recent years, primarily owing to power generatrion emis-sion standards, which has also contributed to high UK wholesale electricity prices), in Germany clean dark spreads fell close to zero in 2015 (in Q3 2015 they were in a range of 0-5 €/MWh).
• Coal deliveries to power plants in the EU also showed a highly seasonal and gradually decreasing trend over the last few years, implying that increasing share of renewable generation can also diminish the role of coal in many EU countries. In spite of coal’s competitive advantage to natural gas, owing to cost differentials of these two fossil generation feedstocks for power plants, low emission allowance prices were not able to give incentives to switch from coal to less emission intensive natural gas in power generation.
FIGURE 8 – EVOLUTION OF CLEAN SPARK SREADS IN SELECTED MARKETS AND GAS DELIVERIES TO POWER GENERATION IN THE EU
Source: Platts, Eurostat
40 TWh
50 TWh
60 TWh
70 TWh
80 TWh
90 TWh
100 TWh
-25 € /MWh
-20 € /MWh
-15 € /MWh
-10 € /MWh
-5 € /MWh
0 € /MWh
5 € /MWh
10 € /MWh
15 € /MWh
20 € /MWh
1 2 3 4 5 6 7 8 9 10 11 12 1 2 3 4 5 6 7 8 9 10 11 12 1 2 3 4 5 6 7 8 92013 2014 2015
UK clean spark spot DE clean spark spot NL clean spark spot BE clean spark spot
Gas deliveries to power generation (rhs)
1. As Platts Power Vision data show, between 2011 and 2015 8.6 GW coal fired power generation capacities were decommissioned

10
FIGURE 9 – EVOLUTION OF CLEAN DARK SREADS IN SELECTED MARKETS AND COAL DELIVERIES TO POWER GENERATION IN THE EU
Source: Platts, Eurostat
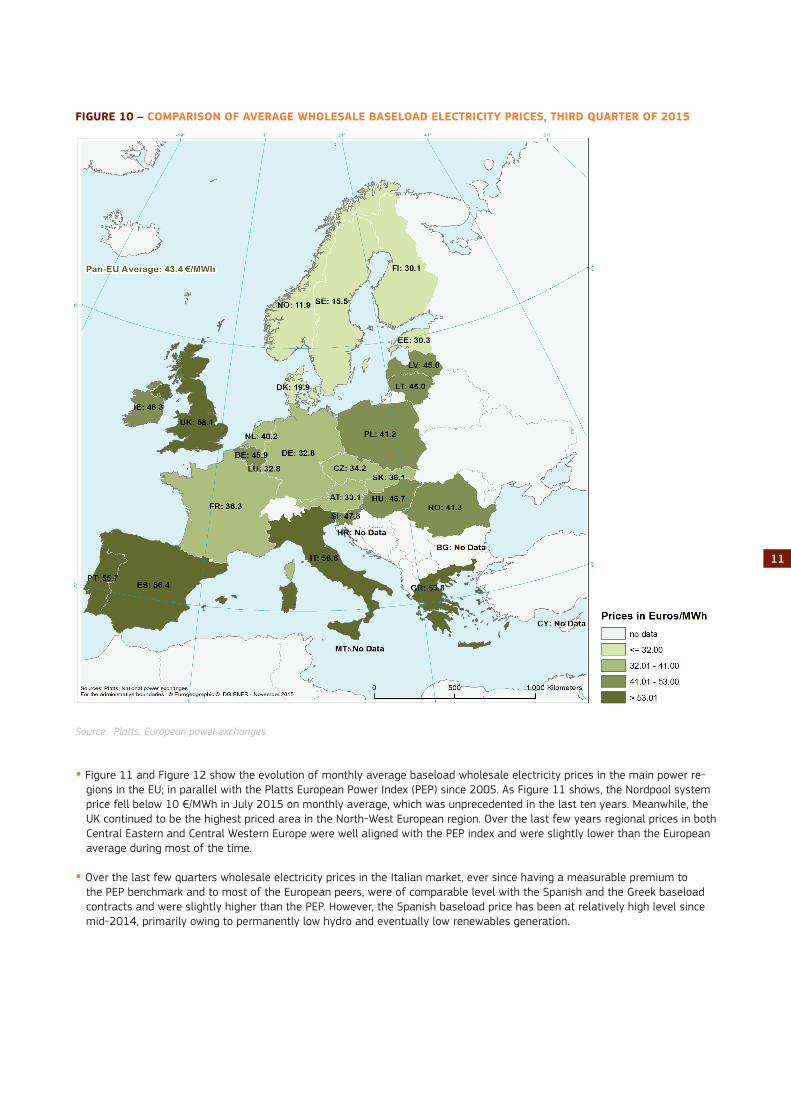
2.2 Comparisons of monthly electricity baseload prices on electricity markets • As the next map (Figure 10) shows, there were significant price differences in the wholesale electricity prices across the EU
in the third quarter of 2015, ranging from 16 €/MWh measured in Sweden to 58 €/MWh in the UK on quarterly average. In Norway, being not an EU member state but an important power source within the Nordpool market the quarterly average price was even lower (11 €/MWh), due to abundant hydro generation.
• In comparison to the previous quarter the average wholesale electricity price increased in most of the European markets; in the biggest extent in Hungary, Slovenia (in both by 44%) and Romania (by 43%) In contrast, there were price decreases, mainly in the Nordic markets (in Sweden by 28% and in Denmark by 13%). In a year-on-year comparison, quarterly average wholesale electricity prices increased in Q3 2015 by the most in Romania (31%), France (27%) and Slovenia (22%). In Swe-den the quarterly average price in Q3 21015 fell to less than the half of that in Q3 2014, while in Denmark it decreased by 41% in the same period. More details on the drivers behind price changes in each market can be found in Chapter 4.
• The existence of significant price differentials between regions and national wholesale electricity markets across the EU countries reveals that the functioning of the internal electricity market should still be improved, and the necessary infras-tructure developments, enabling sufficient interconnections between neighbouring markets and cheap import power alterna-tives, could contribute to enhancing the economic welfare of electricity consumers. The European Commission has recently updated its list on the so-called Projects of Common Interest(2), aiming at implementing specific energy projects in order to complement the European internal energy market and for achieving the Union’s energy policy objective of affordable, secure and sustainable energy.
10 Mt
11 Mt
12 Mt
13 Mt
14 Mt
15 Mt
16 Mt
17 Mt
18 Mt
19 Mt
20 Mt
-5 € /MWh
0 € /MWh
5 € /MWh
10 € /MWh
15 € /MWh
20 € /MWh
25 € /MWh
30 € /MWh
35 € /MWh
40 € /MWh
1 2 3 4 5 6 7 8 9 10 11 12 1 2 3 4 5 6 7 8 9 10 11 12 1 2 3 4 5 6 7 8 9
2013 2014 2015
UK Clean Dark DE Clean Dark Coal deliveries to power plants (rhs)
2. http://ec.europa.eu/priorities/energy-union/state-energy-union/docs/pci-annex1_en.pdf
11
FIGURE 10 – COMPARISON OF AVERAGE WHOLESALE BASELOAD ELECTRICITY PRICES, THIRD QUARTER OF 2015
Source: Platts, European power exchanges
• Figure 11 and Figure 12 show the evolution of monthly average baseload wholesale electricity prices in the main power re-gions in the EU; in parallel with the Platts European Power Index (PEP) since 2005. As Figure 11 shows, the Nordpool system price fell below 10 €/MWh in July 2015 on monthly average, which was unprecedented in the last ten years. Meanwhile, the UK continued to be the highest priced area in the North-West European region. Over the last few years regional prices in both Central Eastern and Central Western Europe were well aligned with the PEP index and were slightly lower than the European average during most of the time.
• Over the last few quarters wholesale electricity prices in the Italian market, ever since having a measurable premium to the PEP benchmark and to most of the European peers, were of comparable level with the Spanish and the Greek baseload contracts and were slightly higher than the PEP. However, the Spanish baseload price has been at relatively high level since mid-2014, primarily owing to permanently low hydro and eventually low renewables generation.

12
FIGURE 11 – COMPARISONS OF THE PLATTS PEP AND MONTHLY ELECTRICITY BASELOAD PRICES IN REGIONAL ELECTRICITY MARKETS (CWE, CEE, NORDPOOL AND THE UK)
Source: Platts, European power exchanges
FIGURE 12 – COMPARISONS OF THE PLATTS PEP AND MONTHLY ELECTRICITY BASELOAD PRICES IN REGIONAL ELECTRICITY MARKETS (SPAIN, ITALY AND GREECE)
Source: Platts, European power exchanges
• In the consequence of these market developments, in Q3 2015 the price difference between the cheapest and the most expen-sive European regional markets reached the highest level since mid-2012, as it can be followed on Figure 13. This temporary price divergence is primarily owing to local generation factors (abundant hydro power in the Nordic region), however, it also points to the imperfection of the infrastructure side of the EU internal electricity market, as it has already been mentioned in this chapter.
0 € /MWh
10 € /MWh
20 € /MWh
30 € /MWh
40 € /MWh
50 € /MWh
60 € /MWh
70 € /MWh
80 € /MWh
90 € /MWh
100 € /MWh
110 € /MWh
120 € /MWh
1 3 5 7 9 11 1 3 5 7 9 11 1 3 5 7 9 11 1 3 5 7 9 11 1 3 5 7 9 11 1 3 5 7 9 11 1 3 5 7 9 11 1 3 5 7 9 11 1 3 5 7 9 11 1 3 5 7 9 11 1 3 5 7 9
2005 2006 2007 2008 2009 2010 2011 2012 2013 2014 2015
Platts PEP CWE baseload CEE - baseload Nordpool -system basload UK baseload
0 € /MWh
10 € /MWh
20 € /MWh
30 € /MWh
40 € /MWh
50 € /MWh
60 € /MWh
70 € /MWh
80 € /MWh
90 € /MWh
100 € /MWh
110 € /MWh
120 € /MWh
1 3 5 7 9 11 1 3 5 7 9 11 1 3 5 7 9 11 1 3 5 7 9 11 1 3 5 7 9 11 1 3 5 7 9 11 1 3 5 7 9 11 1 3 5 7 9 11 1 3 5 7 9 11 1 3 5 7 9 11 1 3 5 7 9
2005 2006 2007 2008 2009 2010 2011 2012 2013 2014 2015
Platts PEP Spain baseload Italy baseload Greece baseload

• Regional price differentials are also reflected on Figure 14, showing the weekly evolution of regional price premiums or dis-counts to the PEP benchmark index in Q3 2015. In July 2015 the Southern European benchmarks, especially Italy, had a short lived divergence from the PEP in the consequence of a heat wave not seen in the last ten years. At the end of July 2015 the Nordic benchmark, affected by abundant power supply, had a discount reaching nearly 40 €/MWh to the PEP.
FIGURE 13 – DIFFERENCE BETWEEN THE HIGHEST AND THE LOWEST REGIONAL WHOLESALE ELECTRICITY PRICE
Source: European power exchanges, own computations. In July-September 2015 the cheapest market was Sweden in the EU, while the highest wholesale electrcity prices could be observed in the UK. It is important to note that not only the price range, but the location of the cheapest and the most expensive markets within the EU might change over the timespan presented on this chart.
FIGURE 14 – DIFFERENCE BETWEEN THE PEP INDEX AND THE WEEKLY REGIONAL WHOLESALE ELECTRICITY PRICES
Source: Platts, European power exchanges, own computations
0 € /MWh
10 € /MWh
20 € /MWh
30 € /MWh
40 € /MWh
50 € /MWh
60 € /MWh
70 € /MWh
80 € /MWh
90 € /MWh
100 € /MWh
1 3 5 7 9 11 1 3 5 7 9 11 1 3 5 7 9 11 1 3 5 7 9 11 1 3 5 7 9 11 1 3 5 7 9 11 1 3 5 7 9 11 1 3 5 7 9 11 1 3 5 7 9 11 1 3 5 7 9
2006 2007 2008 2009 2010 2011 2012 2013 2014 2015
-50 € /MWh
-40 € /MWh
-30 € /MWh
-20 € /MWh
-10 € /MWh
0 € /MWh
10 € /MWh
20 € /MWh
30 € /MWh
40 € /MWh
50 € /MWh
03/0
7/20
15
10/0
7/20
15
17/0
7/20
15
24/0
7/20
15
31/0
7/20
15
07/0
8/20
15
14/0
8/20
15
21/0
8/20
15
28/0
8/20
15
04/0
9/20
15
11/0
9/20
15
18/0
9/20
15
25/0
9/20
15
CWE Nordpool UK CEE OMEL_Spain GME_Italy DESMIE_Greece

14
• Figure 15 shows the monthly ratio of actual hydro generation compared to the domestic consumption in three regions (or country groups: Nordic region, Austria and Switzerland, the Iberian region) where hydro generation is an important factor in affecting wholesale electricity prices.
• In Spain the ratio of hydro generation to electricity consumption fell to three year low in September 2015, resulting in high whole-sale electricity prices in the Iberian region. In the Nordic region high level of hydro reserves and generation resulted in extremely low wholesale prices at the beginning of Q3 2015. In Austria and Switzerland abundant power generation from hydro sources also contributed to keeping wholesale electricity prices low.
FIGURE 15 – THE RATIO OF HYDRO COMPARED TO THE POWER CONSUMPTION IN DIFFERENT EU REGIONS
Source: ENTSO-E
0%
10%
20%
30%
40%
50%
60%
70%
80%
2010
-01
2010
-03
2010
-05
2010
-07
2010
-09
2010
-11
2011
-01
2011
-03
2011
-05
2011
-07
2011
-09
2011
-11
2012
-01
2012
-03
2012
-05
2012
-07
2012
-09
2012
-11
2013
-01
2013
-03
2013
-05
2013
-07
2013
-09
2013
-11
2014
-01
2014
-03
2014
-05
2014
-07
2014
-09
2014
-11
2015
-01
2015
-03
2015
-05
2015
-07
Nordpoolspot Iberia Austria and Switzerland


16
3. Traded volumes, market liquidity
and cross border trade of
electricity
3.1 Comparison of wholesale market trading platforms and the over-the-counter (OTC) markets
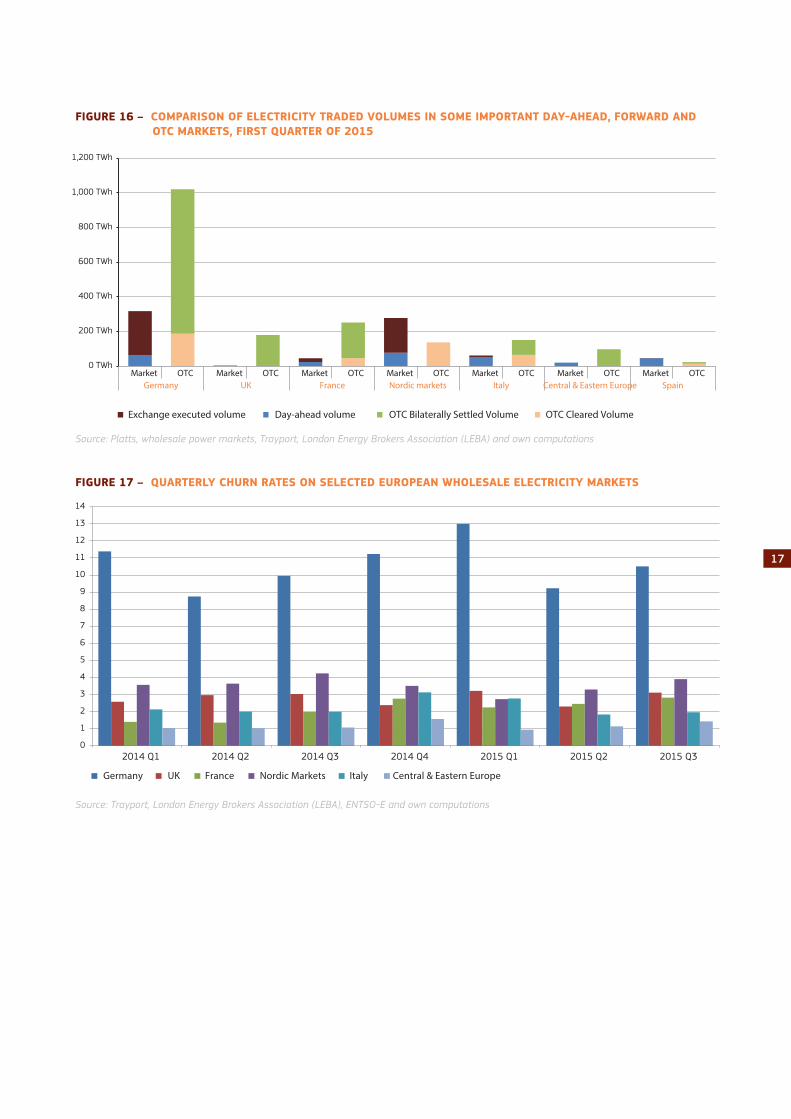
• Figure 16 shows the comparison of traded volumes in different market segments in electricity trading on the most liquid electricity trading platforms in the EU. As traded volumes of day-ahead contracts cover only a minor part of the whole trade in many wholesale electricity markets in Europe, for the full analysis of the wholesale electricity trade we also look at the whole forward curve and the traded volumes on the so-called over-the-counter (OTC) markets, also providing information on bilateral trade contracts.
• In year-on-year comparison the combined traded volume (market trade and OTC together) significantly increased in France (by 41%) in the third quarter of 2015. Markets in Central and Eastern Europe also registered a double-digit increase in this period. In contrast, the Spanish combined traded volume practically halved. All other observed markets showed slight increases or decreases in the Q3 2015 compared to the same quarter of 2014.
• Market liquidity can be measured by the so-called churn rates, providing information on the ratio of the total volume of power trade (including exchange executed and OTC markets) and electricity consumption in a given time period. Figure 17 shows the evolution of the quarterly churn rates in some selected electricity markets in the EU. According to this calcula-tion Germany proved to be the most liquid electricity market in the EU during the last few quarters, followed by the Nordic markets. Liquidity has gradually increased in France and Central Eastern Europe, while in other markets (e.g.: UK, Italy) churn rates proved to be stable over the last two years. In some markets (e.g.: Germany) churn rates follow a seasonal pattern; peaking during the winter period, when the electricity consumption is highest within the year.
• The relation between the magnitudes of traded volumes on the organised markets (day-ahead and forward contracts) and on OTC markets can also influence the significance of different wholesale electricity prices observed in different forms of trade. If the volume of bilateral power trade is significantly higher in a given country than what we can see on the orga-nised market, OTC prices, often based on confidential bilateral agreements, may differ from observable market prices, and thus other forms of price estimations (e.g.: OTC price assessments) might prove to be better proxies for wholesale electricity prices in the given country or market.
17
FIGURE 16 – COMPARISON OF ELECTRICITY TRADED VOLUMES IN SOME IMPORTANT DAY-AHEAD, FORWARD AND OTC MARKETS, FIRST QUARTER OF 2015
Source: Platts, wholesale power markets, Trayport, London Energy Brokers Association (LEBA) and own computations
FIGURE 17 – QUARTERLY CHURN RATES ON SELECTED EUROPEAN WHOLESALE ELECTRICITY MARKETS
Source: Trayport, London Energy Brokers Association (LEBA), ENTSO-E and own computations
0 TWh
200 TWh
400 TWh
600 TWh
800 TWh
1,000 TWh
1,200 TWh
Market OTC Market OTC Market OTC Market OTC Market OTC Market OTC Market OTCGermany UK France Nordic markets Italy Central & Eastern Europe Spain
Exchange executed volume Day-ahead volume OTC Bilaterally Settled Volume OTC Cleared Volume
0
1
2
3
4
5
6
7
8
9
10
11
12
13
14
2014 Q1 2014 Q2 2014 Q3 2014 Q4 2015 Q1 2015 Q2 2015 Q3
Germany UK France Nordic Markets Italy Central & Eastern Europe

18
3.2 Cross border trade of electricity• As Figure 18 shows, the Central Western Europe (CWE) power region could still be characterised by a strong net electricity
exporter position in the third quarter of 2015.
• As electricity prices in the Nordic region fell to lows not seen since several years, price discounts to most of the continental European markets assured perfect opportunities to export electricity from the Nordic region. In July 2015 exports rose from the region to the highest since July 2012, while in August-September, as local market prices increased, it slightly receded.
• The net power flow position of the Central Eastern Europe (CEE) region, which could be characterised as increasingly net impor-ter during the last couple of quarters, stabilised in Q3 2015 at levels seen in the previous quarter. The region’s net position depends on the availability of domestic generation capacities and power imports from the CWE region (electricity mainly gene-rated from renewables), from South-East Europe (depending on hydro availability), and from some additional sources, such as Ukraine.
• In the consequence of its significant wholesale electricity price premium to the continent the UK continued to be in a strong net importer position, importing 2 GWh more than its power export on monthly average in Q3 2015. Having the highest wholesale electricity prices in Europe, the UK needs to rely on competitive power imports, mainly from France and the Netherlands. Italy was also a net electricity importer country in Q3 2015, however, during the summer imports fell back as domestic renewable based electricity generation increased.
FIGURE 18 – EU CROSS BORDER MONTHLY PHYSICAL FLOWS BY REGION
Source: ENTSO-EEuropean countries are grouped in the following regions:Central Western Europe DE, NL, FR, LU, BE, AT, CH Nordic SE, FI, DK, NOCentral Eastern Europe PL, CZ, HU, SK, HR, SI British Isles UK, IE Iberian-Peninsula ES, PT Apennine Peninsula ITSouth Eastern Europe RO, BG, GR, RS, BA, ME, FYROM, AL Baltic EE, LT, LV
-6,000 GWh
-4,000 GWh
-2,000 GWh
0 GWh
2,000 GWh
4,000 GWh
6,000 GWh
8,000 GWh
1
20122 3 4 5 6 7 8 9 10 11 12 1
20132 3 4 5 6 7 8 9 10 11 12 1
20142 3 4 5 6 7 8 9 10 11 12 1
20152 3 4 5 6 7 8 9
CWE CEE Nordic British Isles Baltic Italy Iberia SEE


20
4. Regional wholesale electricity
markets4.1 Central Western Europe (Austria, Belgium, France, Germany,
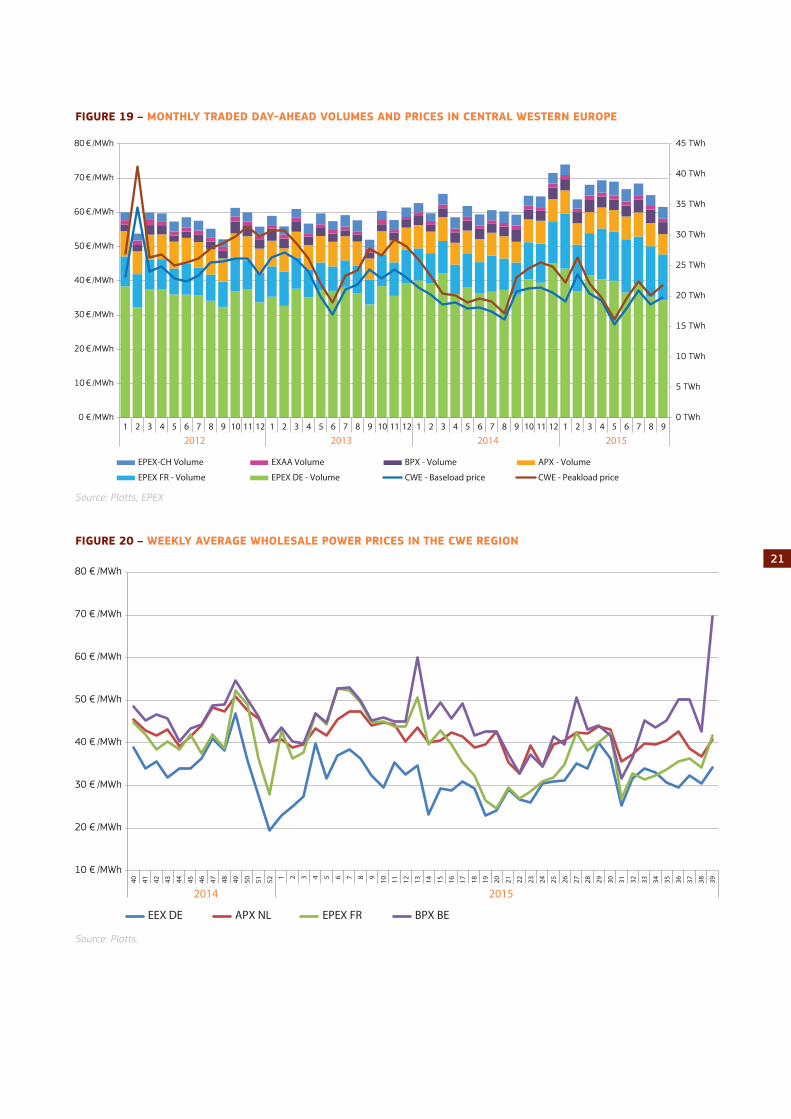
the Netherlands, Switzerland)• As Figure 19 shows, in July 2015 both the monthly averages of baseload and peakload day-ahead power prices in the CWE
region rose significantly, adding 5-6 €/MWh to the averages measured in June 2015. The main reason behind this sudden increase was the heat wave that reached the region at the beginning of July. High temperatures impacted residential elec-tricity demand for cooling needs and reduced the availability of some nuclear generation capacities, owing to lower level of river waters used for cooling purposes in power generation. In Q3 2015 the monthly regional average day-ahead baseload contract flucuated a narrow range of 33-37 €/MWh, while the peakload was around 36-40 €/MWh in the same period.
• Besides the high tempeartures induced reduction in nuclear availability, several nuclear plants were offline during the third quarter of the year in the region. In July 2015 only five reactors were avilable in Germany, due to ongoing planned main-tenance activites and to the final decommissioning of the Grafenrheinfeld reactor. In Belgium planned maintenances and an unplanned outage reduced the avilalble nuclear generation capacities in August, while in France nuclear generation was lower both in August and September 2015, if compared to the same period of the previous year.
• In the consequence of an unplanned outage of the Tihange-1 nuclear power plant in Belgium, due to a technical failure, the wholesale electricity price spiked in the country, reaching 188 €/MWh on the 22nd of September on daily average; in some trading hours being close to 450 €/MWh. This was an unprecedentedly high price since March 2011 in the Belgian wholesale electricity market.
• In periods of low demand and abundant renewable power generation (for example, on the 26th of July and on the 6th of September 2015) negative hourly prices occurred again in the German market, which reinforces the need of better inte-gration of intermittent generation soruces, in order to prevent prices falling below zero amid permanently functioning less flexible baseload power generation capacities.
• Wholesale electricity prices in the region were well aligned after the end of the heatwave in the region in July 2015, as Figure 20 shows. However, as nuclear availability in Belgium was suddenly reduced, wholesale prices in the country became permanently higher than in the rest of the CWE region. Belgium, and to the lesser extent, the Netherlands, had to rely on power imports from Germany and France within the region. In August-September 2015 Belgium had to import more than 30% of its electricity consumption, which was the highest share in the last five years.
• In July and August 2015 the increase in cross border electricity flows between Germany/Austria, France and the Benelux states, gathering momentum after the implementation of the flow based market coupling in May 2015, continued, as Figure 21 shows, however, in the second half of September total intra-regional power flows decreased. Power flows between Ger-many and the Netherlands grew dynamically thorughout the whole Q3 2015. French power flows to Germany increased rapi-dly until mid-August, as French prices became aligned with German peers or in some periods they were even lower. Belgium tended to increasingly import power from Germany through the Netherlands, while direct imports from France receded in the second half of Q3 2015.
21
FIGURE 19 – MONTHLY TRADED DAY-AHEAD VOLUMES AND PRICES IN CENTRAL WESTERN EUROPE
Source: Platts, EPEX
FIGURE 20 – WEEKLY AVERAGE WHOLESALE POWER PRICES IN THE CWE REGION
Source: Platts.
0 TWh
5 TWh
10 TWh
15 TWh
20 TWh
25 TWh
30 TWh
35 TWh
40 TWh
45 TWh
0 € /MWh
10 € /MWh
20 € /MWh
30 € /MWh
40 € /MWh
50 € /MWh
60 € /MWh
70 € /MWh
80 € /MWh
1 2 3 4 5 6 7 8 9 10 11 12 1 2 3 4 5 6 7 8 9 10 11 12 1 2 3 4 5 6 7 8 9 10 11 12 1 2 3 4 5 6 7 8 9
2012 2013 2014 2015
EPEX-CH Volume EXAA Volume BPX - Volume APX - Volume
EPEX FR - Volume EPEX DE - Volume CWE - Baseload price CWE - Peakload price
10 € /MWh
20 € /MWh
30 € /MWh
40 € /MWh
50 € /MWh
60 € /MWh
70 € /MWh
80 € /MWh
40 41 42 43 44 45 46 47 48 49 50 51 52 1 2 3 4 5 6 7 8 9 10 11 12 13 14 15 16 17 18 19 20 21 22 23 24 25 26 27 28 29 30 31 32 33 34 35 36 37 38 39
2014 2015
EEX DE APX NL EPEX FR BPX BE

22
FIGURE 21 – WEEKLY CROSS BORDER PHYSICAL POWER FLOWS IN THE CENTRAL WEST EUROPEAN REGION
Source: ENTSO-E, own computations
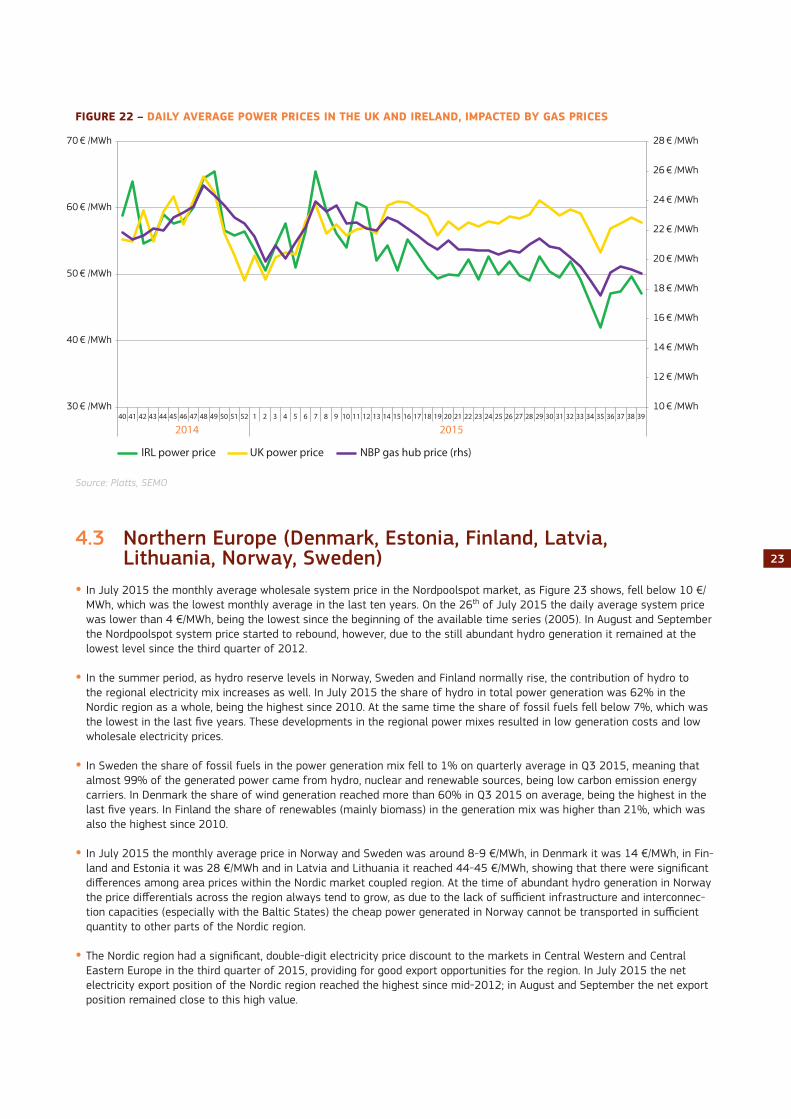
4.2 British Isles (UK, Ireland)• In the third quarter of 2015 the average monthly day-ahead wholesale electricity price in the UK was in the range of 57-60
€/MWh. As Figure 22 shows, baseload power prices in the UK were quite stable during July 2015. Unlike the continental part of Europe, temperatures in the UK remained cooler and this put a lid on residential power demand.
• In August 2015 the wholesale electricity price started to decrease and reached its lowest daily average during Q3 2015 on the 25th of August (52.7 €/MWh). The daily wholesale electricity price closely tracked the evolution of natural gas prices on the NBP hub, being impacted by abundant LNG inflows that pushed gas prices lower. As from September gas prices started to rebound, wholesale prices in the UK also rose, adding up to the usual seasonal impacts (end of the holiday season and increasing lighting needs at the beginning of the autumn).
• In the UK power generation mix the share of fossil fuels rose slightly (from 48% to 51%) between July and September 2015, in parallel with the decreasing share of nuclear and renewables, which resulted in a shift towards costlier power sources in the generation mix, also supporting the increase in wholesale electricity prices.
• More or less the same factors affected wholesale electricity prices in Ireland as in the UK in the third quarter of 2015. Irish electricity price contracts also closely tracked the evolution of gas prices, and the share of renewables in the Irish generation mix decreased from 24% to 19% between July and September 2015, while costlier fossil fuels increased their share by 5% during the same period, supporting the rebound of electricity prices in September. However, wholesale electricity prices in the UK retained their premium to Ireland, mainly owing to the impact of the climate levy in the UK prices(3).
• As the UK wholesale electricity market had a significant price premium to the continent (17-19 €/MWh on average to France and to the Netherlands), the combined volume of power inflow from France and the Netherlands amounted to 2 TWh on monthly average in the third quarter of 2015. However, it is worth to mention here that in spite of having significant diffe-rences between the UK prices and its continental peers, the amount of power imports could not grow further compared to the previous quarter, which might point to the need of enhancing electricity interconnection capacities between the UK and its neighbours.
0.0 GWh
100.0 GWh
200.0 GWh
300.0 GWh
400.0 GWh
500.0 GWh
600.0 GWh
700.0 GWh
800.0 GWh
900.0 GWh
1000.0 GWh
1 2 3 4 5 6 7 8 9 10 11 12 13 14 15 16 17 18 19 20 21 22 23 24 25 26 27 28 29 30 31 32 33 34 35 36 37 38 39Week
FR=>BE NL=>BE FR=>DE NL=>DE BE=>FR DE=>FR BE=>NL DE=>NL
3. See Quarterly Report on European Electricity Markets, Vol. 8 Issue 2.
23
FIGURE 22 – DAILY AVERAGE POWER PRICES IN THE UK AND IRELAND, IMPACTED BY GAS PRICES
Source: Platts, SEMO
4.3 Northern Europe (Denmark, Estonia, Finland, Latvia, Lithuania, Norway, Sweden)• In July 2015 the monthly average wholesale system price in the Nordpoolspot market, as Figure 23 shows, fell below 10 €/
MWh, which was the lowest monthly average in the last ten years. On the 26th of July 2015 the daily average system price was lower than 4 €/MWh, being the lowest since the beginning of the available time series (2005). In August and September the Nordpoolspot system price started to rebound, however, due to the still abundant hydro generation it remained at the lowest level since the third quarter of 2012.
• In the summer period, as hydro reserve levels in Norway, Sweden and Finland normally rise, the contribution of hydro to the regional electricity mix increases as well. In July 2015 the share of hydro in total power generation was 62% in the Nordic region as a whole, being the highest since 2010. At the same time the share of fossil fuels fell below 7%, which was the lowest in the last five years. These developments in the regional power mixes resulted in low generation costs and low wholesale electricity prices.
• In Sweden the share of fossil fuels in the power generation mix fell to 1% on quarterly average in Q3 2015, meaning that almost 99% of the generated power came from hydro, nuclear and renewable sources, being low carbon emission energy carriers. In Denmark the share of wind generation reached more than 60% in Q3 2015 on average, being the highest in the last five years. In Finland the share of renewables (mainly biomass) in the generation mix was higher than 21%, which was also the highest since 2010.
• In July 2015 the monthly average price in Norway and Sweden was around 8-9 €/MWh, in Denmark it was 14 €/MWh, in Fin-land and Estonia it was 28 €/MWh and in Latvia and Lithuania it reached 44-45 €/MWh, showing that there were significant differences among area prices within the Nordic market coupled region. At the time of abundant hydro generation in Norway the price differentials across the region always tend to grow, as due to the lack of sufficient infrastructure and interconnec-tion capacities (especially with the Baltic States) the cheap power generated in Norway cannot be transported in sufficient quantity to other parts of the Nordic region.
• The Nordic region had a significant, double-digit electricity price discount to the markets in Central Western and Central Eastern Europe in the third quarter of 2015, providing for good export opportunities for the region. In July 2015 the net electricity export position of the Nordic region reached the highest since mid-2012; in August and September the net export position remained close to this high value.
10 € /MWh
12 € /MWh
14 € /MWh
16 € /MWh
18 € /MWh
20 € /MWh
22 € /MWh
24 € /MWh
26 € /MWh
28 € /MWh
30 € /MWh
40 € /MWh
50 € /MWh
60 € /MWh
70 € /MWh
40 41 42 43 44 45 46 47 48 49 50 51 52 1 2 3 4 5 6 7 8 9 10 11 12 13 14 15 16 17 18 19 20 21 22 23 24 25 26 27 28 29 30 31 32 33 34 35 36 37 38 39
2014 2015
IRL power price UK power price NBP gas hub price (rhs)

24
FIGURE 23 – MONTHLY TRADED DAY-AHEAD VOLUMES AND PRICES IN NORTHERN EUROPE
Source: Nordpool spot market
4.4 Apennine Peninsula (Italy)• In July 2015, similarly to many European markets and especially to the Southern European countries, the Italian monthly
average day-ahead baseload electricity price, impacted by the highest temperatures in the last ten years, showed a signifi-cant turn-up compared to the price of the previous month: while in June 2015 the average baseload price was 49 €/MWh, in July it reached 68 €/MWh, being the highest since December 2013. Later in the quarter, in August and September, as the excess demand for power decreased, the average wholesale price returned to the levels measured in the first half of 2015. The average September price fell below 50 €/MWh.
• In July 2015 electricity consumption in Italy was close to 32 TWh, which was even higher than the previous record set in July 2008 since the beginning of the available time series (January 2000).
• On the supply side the Italian power generation mix shifted towards fossil fuels (mainly natural gas) at the beginning of the third quarter of 2015, as both the share of hydro and renewables receded in July 2015, implying that generation costs increased compared to the previous month. This shift in the power mix also gave a support to high wholesale electricity prices.
• In August 2015 the share of renewables rose back to 25% and in September it was still 24%. However, the share of fossil fuels still remained around 60%, as the dry weather did not favour hydro generation.
• During the high-priced month of July 2015 electricity imports from France increased substantially as domestic generation could not satisfy increasing power needs. In this month almost 13% of the country’s electricity consumption had to be satis-fied from import sources, which was the highest ratio measured in the month of July since 2010.
0 TWh
5 TWh
10 TWh
15 TWh
20 TWh
25 TWh
30 TWh
35 TWh
40 TWh
0 €/MWh
10 €/MWh
20 €/MWh
30 €/MWh
40 €/MWh
50 €/MWh
60 €/MWh
1 2 3 4 5 6 7 8 9 10 11 12 1 2 3 4 5 6 7 8 9 10 11 12 1 2 3 4 5 6 7 8 9 10 11 12 1 2 3 4 5 6 7 8 9
2012 2013 2014 2015
Nordpool - Volume Nordpool - DA system baseload price

25
FIGURE 24 – MONTHLY TRADED DAY-AHEAD VOLUMES AND PRICES IN ITALY
Source: GME (IPEX)
4.5 Iberian Peninsula (Spain and Portugal)• Similarly to Italy, in July 2015 temperature-driven increasing demand for electricity resulted in significant increases in the
Spanish and Portuguese monthly wholesale electricity market prices; in both countries the baseload contract was 60 €/MWh, being the highest since December 2013. In August, however, the average wholesale electricity price started to decrease and in September it fell until 51-52 €/MWh.
• Electricity consumption in Spain reached more than 25 TWh, which was the highest monthly figure since the beginning of available time series (January 2000). In Portugal electricity consumption also increased in July 2015, though the increase was not so exceptional, as in the case of Spain.
• On the supply side higher electricity generation costs were supported by the shift in the Spanish power generation mix towards costlier fossil fuels in July 2015; the share of natural gas and coal together amounted to 51% in this month, being the highest since September 2014. Meanwhile, the share of nuclear was only 19% amid the summer maintenance period and the share of hydro fell to 8% in July, implying the retreat of cheaper generation sources in the power mix. On the top of this, the share of wind also receded in July. In August and September the share of nuclear and wind started to increase again and the share of fossil fuels decreased, enabling lower power generation costs.
• In Portugal similar developments could be observed in the electricity generation mix in Q3 2015. In the lack of nuclear gene-ration capacities the shifts between hydro, fossil and renewable sources were even more amplified than in the case of Spain. The share of hydro in the combined Spanish and Portuguese markets was below 10%, the lowest since the summer of 2012 (See Figure 15).
• In the third quarter of 2015 the Spanish price premium to France was more than 20 €/MWh, however, electricity flows from France could not really help in reducing the wholesale electricity price in Spain in the lack of sufficient interconnection capa-cities between the two countries.
0 TWh
5 TWh
10 TWh
15 TWh
20 TWh
25 TWh
0 € /MWh
10 € /MWh
20 € /MWh
30 € /MWh
40 € /MWh
50 € /MWh
60 € /MWh
70 € /MWh
80 € /MWh
90 € /MWh
100 € /MWh
1 2 3 4 5 6 7 8 9 10 11 12 1 2 3 4 5 6 7 8 9 10 11 12 1 2 3 4 5 6 7 8 9 10 11 12 1 2 3 4 5 6 7 8 9
2012 2013 2014 2015
IPEX volume IPEX DA system baseload price

26
FIGURE 25 – MONTHLY TRADED DAY-AHEAD VOLUMES AND PRICES IN THE IBERIAN PENINSULA
Source: GM
4.6 Central Eastern Europe (Czech Republic, Hungary, Poland, Romania, Slovakia, Slovenia)
• Similarly to Central Western Europe, the regional average monthly baseload and peakload price showed a significant increase (8-9 €/MWh) compared to June 2015, as Figure 26 shows. The main factors behind the increase in electricity prices can be found both on the supply side (reduced availability of generation capacities) and on the demand side (increasing cooling needs during the summer) of the electricity market. In August and September 2015 the monthly baseload and peakload averages, in spite of registering slight decreases, remained close to the July averages.
• In July 2015 Hungarian day-ahead baseload prices had a significant premium to Germany and to other regional peers, as Figure 27 shows. The daily average wholesale electricity price rose to three year high, reaching 130 €/MWh on the 23rd of July 2015 in the consequence of low domestic generation capacity availability and high temperatures. Hungary had to import more than 40% of its domestic electricity consumption in July, which reflects the tightness of the supply margins in the electricity system of the country in this period. Later the Hungarian price premium started to shrink, however, in Septem-ber 2015 it rose again due to cross border capacity curtailments in several countries of the region.
• The Polish wholesale electricity market was also influenced by the excessive temperature-related demand in early August, however, as the country did not have to rely on significant power imports, the price level was not so high as in Hungary. Com-pared to other regional markets (e.g.; Czech Republic or Slovakia) the price level was higher due to plant outages and decrea-sing renewable generation. The Czech and Slovak prices were closely following the German peers, however, in September the aforementioned cross border capacity curtailments also impacted the wholesale electricity prices in these two countries.
• Hydro generation in Romania and the Balkan countries generally decreased during the third quarter of 2015, resulting in a shift towards costlier generation sources in domestic power mixes and decreasing competitiveness of electricity imports from the Balkans to the CEE region. Lower hydro availability also put an upward pressure on electricity prices.
0 TWh
5 TWh
10 TWh
15 TWh
20 TWh
25 TWh
0 € /MWh
10 € /MWh
20 € /MWh
30 € /MWh
40 € /MWh
50 € /MWh
60 € /MWh
70 € /MWh
1 2 3 4 5 6 7 8 9 10 11 12 1 2 3 4 5 6 7 8 9 10 11 12 1 2 3 4 5 6 7 8 9 10 11 12 1 2 3 4 5 6 7 8 9
2012 2013 2014 2015
Volume - PT Volume - ES Baseload - ES Baseload - PT

27
0 TWh
1 TWh
2 TWh
3 TWh
4 TWh
5 TWh
6 TWh
7 TWh
8 TWh
0 € /MWh
10 € /MWh
20 € /MWh
30 € /MWh
40 € /MWh
50 € /MWh
60 € /MWh
70 € /MWh
80 € /MWh
1 2 3 4 5 6 7 8 9 10 11 12 1 2 3 4 5 6 7 8 9 10 11 12 1 2 3 4 5 6 7 8 9 10 11 12 1 2 3 4 5 6 7 8 9
2012 2013 2014 2015
Volume - SI Volume - HU Volume - SK Volume - CZVolume - RO Volume - PL CEE - Baseload price CEE - Peakload price
FIGURE 26 – MONTHLY TRADED DAY-AHEAD VOLUMES AND PRICES IN CENTRAL EASTERN EUROPE
Source: Regional power exchanges, Central and Eastern Europe (CEE)
FIGURE 27 – REGIONAL WEEKLY BASELOAD PRICE PREMIUMS OR DISCOUNTS TO THE GERMAN MARKET
Source: Platts (EPEX), CEE Regional power exchanges
-20 € /MWh
-10 € /MWh
0 € /MWh
10 € /MWh
20 € /MWh
30 € /MWh
40 € /MWh
40 41 42 43 44 45 46 47 48 49 50 51 52 1 2 3 4 5 6 7 8 9 10 11 12 13 14 15 16 17 18 19 20 21 22 23 24 25 26 27 28 29 30 31 32 33 34 35 36 37 38 39
2014 2015
PL-DE RO-DE CZ/SK-DE HU-DE

28
4.7 South Eastern Europe (Greece)• Contrarily to other Southern European markets, where both baseload and peakload monthly average wholesale power prices
showed a significant increase in July 2015 compared to the previous month, in Greece the increase remained moderate; the baseload monthly average was 53 €/MWh, and the peakload monthly average was 55 €/MWh, both were up by 5 €/MWh compared to the June 2015. As Figure 2 shows, in July and August 2015, though temperatures were higher than the seaso-nal average, the weather was not so hot in Greece as in other Mediterranean countries, implying that incremental demand for power, arising from residential cooling needs, was not so big to significantly impact the wholesale electricity price level.
• Changes in the Greek power generation mix at the beginning of the third quarter of 2015 led to higher wholesale prices, as the share of hydro, solar and wind generation decreased, whereas the share of fossil fuels (mainly natural gas) increased, making domestic power generation costlier.
• However, in July-August 2015 Greece managed to satisfy a higher share of its electricity consumption from domestic generation sources as in the previous quarter: while in Q2 2015 it had to import more than 24% of its power needs, in July-August 2015 the share of imports within the total consumption fell to 12% (1,158 GWh). The country imported electricity mostly from Bulgaria, the Former Yugoslav Republic of Macedonia and Turkey.
FIGURE 28 – MONTHLY TRADED DAY-AHEAD VOLUMES AND PRICES IN GREECE
Source: DESMIE
0 TWh
1 TWh
2 TWh
3 TWh
4 TWh
5 TWh
6 TWh
7 TWh
0 €/MWh
20 €/MWh
40 €/MWh
60 €/MWh
80 €/MWh
100 €/MWh
120 €/MWh
1 2 3 4 5 6 7 8 9 10 11 12 1 2 3 4 5 6 7 8 9 10 11 12 1 2 3 4 5 6 7 8 9 10 11 12 1 2 3 4 5 6 7 8 9
2012 2013 2014 2015
Volume - GR Baseload - GR Peakload - GR


30
5. International outlook comparing EU power prices with international peers • Figure 29 shows the European wholesale electricity benchmark index (PEP) in comparison with wholesale price benchmarks
in some important international trading partners (United States, Japan and Australia). Putting EU wholesale electricity prices into international comparison is important from the aspect of analysing the competitiveness of the EU economy, especially in the case of those products and industrial activities where energy costs make a significant part of total production cost (the so-called energy intensive industries). Energy intensive industries are normally large energy consumers and the wholesale market price is a good proxy for the price these industries purchase their electricity needs.
• Wholesale electricity prices in the US were generally below the European power benchmark, the PEP index over the last few years. However, as in last two years wholesale electricity prices in Europe became lower, the difference between EU and US price benchmarks significantly decreased. In Q3 2015 the PEP was around 1.7 times as high as the average US electri-city price, while a few years before the ratio between the two was 2.5-3. US price benchmarks highly depend on the price of natural gas, and depending on weather conditions (increasing heating needs during low winter temperatures or cooling needs during summer heat waves) can result in extremely high short term gas price volatility, almost immediately impacting wholesale electricity prices.
• In Japan wholesale electricity prices in Q3 2015 practically returned to the low ranges last seen before the Fukushima nuclear incident in March 2011. The average wholesale electricity price in September 2015 was about one and a half times higher than the PEP index in Europe. In Australia the average wholesale electricity price level was slightly higher than in the US in Q3 2015.
FIGURE 29 – COMPARISON OF THE AVERAGE US, JAPANESE, AUSTRALIAN AND THE EUROPEAN WHOLESALE ELECTRICITY PRICES
Source: Platts, PEP: Pan-European Power index US electricity hubs including PJM West: Pennsylvania-Jersey-Massachusetts hub (Western part); ERCOT: Texas hub, JPEX, (Japan) and AEMO: Australian wholesale power market
0 € /MWh
20 € /MWh
40 € /MWh
60 € /MWh
80 € /MWh
100 € /MWh
120 € /MWh
140 € /MWh
160 € /MWh
180 € /MWh
200 € /MWh
1 3 5 7 9 11 1 3 5 7 9 11 1 3 5 7 9 11 1 3 5 7 9 11 1 3 5 7 9 11 1 3 5 7 9
2010 2011 2012 2013 2014 2015
Japan Platts PEP US price Australia

32
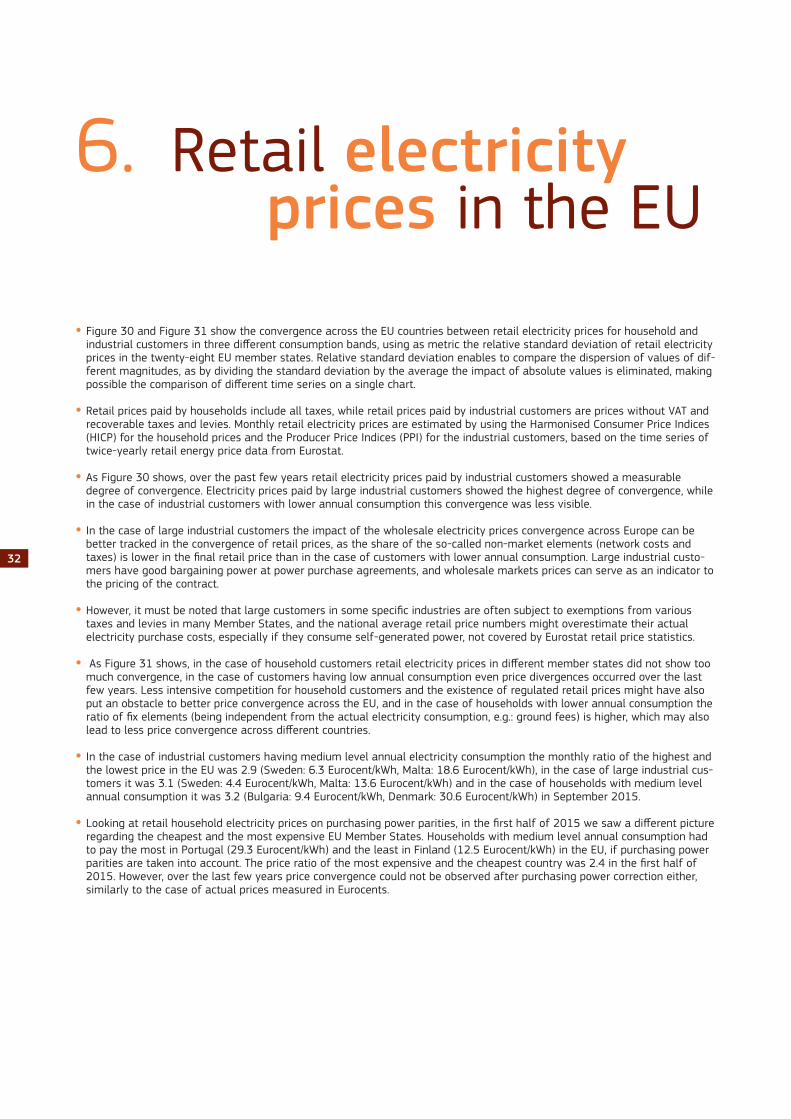
6. Retail electricity prices in the EU
• Figure 30 and Figure 31 show the convergence across the EU countries between retail electricity prices for household and industrial customers in three different consumption bands, using as metric the relative standard deviation of retail electricity prices in the twenty-eight EU member states. Relative standard deviation enables to compare the dispersion of values of dif-ferent magnitudes, as by dividing the standard deviation by the average the impact of absolute values is eliminated, making possible the comparison of different time series on a single chart.
• Retail prices paid by households include all taxes, while retail prices paid by industrial customers are prices without VAT and recoverable taxes and levies. Monthly retail electricity prices are estimated by using the Harmonised Consumer Price Indices (HICP) for the household prices and the Producer Price Indices (PPI) for the industrial customers, based on the time series of twice-yearly retail energy price data from Eurostat.
• As Figure 30 shows, over the past few years retail electricity prices paid by industrial customers showed a measurable degree of convergence. Electricity prices paid by large industrial customers showed the highest degree of convergence, while in the case of industrial customers with lower annual consumption this convergence was less visible.
• In the case of large industrial customers the impact of the wholesale electricity prices convergence across Europe can be better tracked in the convergence of retail prices, as the share of the so-called non-market elements (network costs and taxes) is lower in the final retail price than in the case of customers with lower annual consumption. Large industrial custo-mers have good bargaining power at power purchase agreements, and wholesale markets prices can serve as an indicator to the pricing of the contract.
• However, it must be noted that large customers in some specific industries are often subject to exemptions from various taxes and levies in many Member States, and the national average retail price numbers might overestimate their actual electricity purchase costs, especially if they consume self-generated power, not covered by Eurostat retail price statistics.
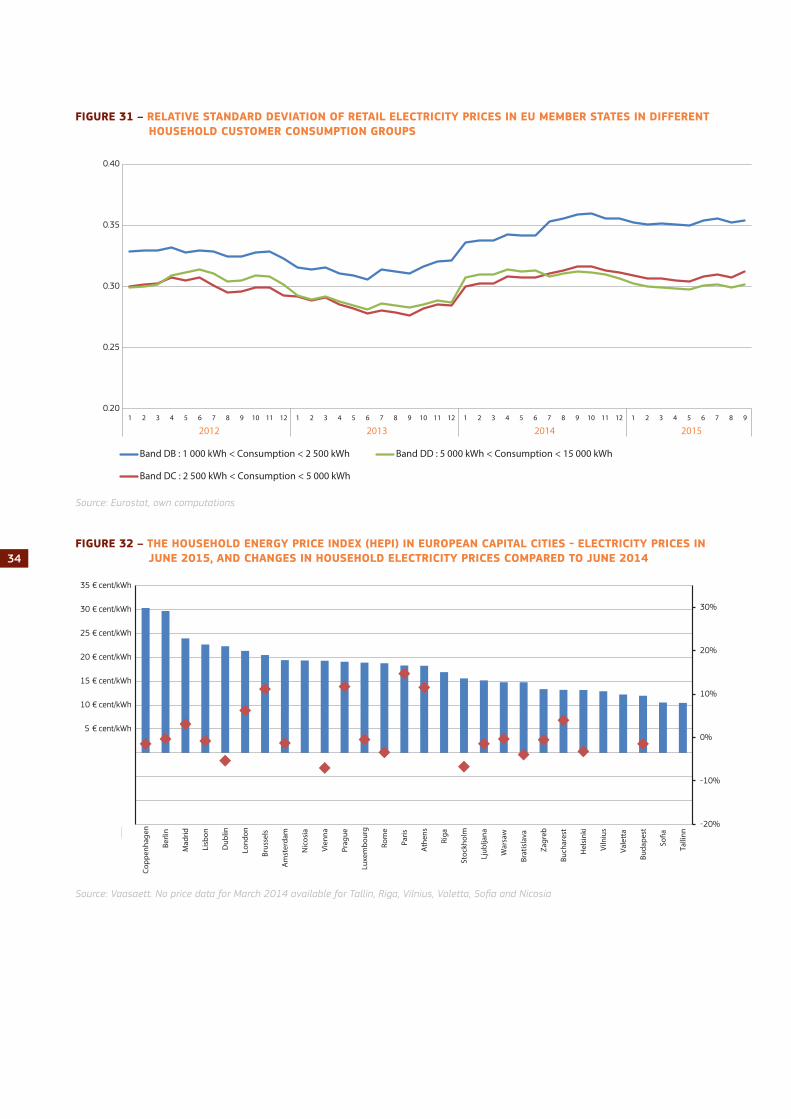
• As Figure 31 shows, in the case of household customers retail electricity prices in different member states did not show too much convergence, in the case of customers having low annual consumption even price divergences occurred over the last few years. Less intensive competition for household customers and the existence of regulated retail prices might have also put an obstacle to better price convergence across the EU, and in the case of households with lower annual consumption the ratio of fix elements (being independent from the actual electricity consumption, e.g.: ground fees) is higher, which may also lead to less price convergence across different countries.
• In the case of industrial customers having medium level annual electricity consumption the monthly ratio of the highest and the lowest price in the EU was 2.9 (Sweden: 6.3 Eurocent/kWh, Malta: 18.6 Eurocent/kWh), in the case of large industrial cus-tomers it was 3.1 (Sweden: 4.4 Eurocent/kWh, Malta: 13.6 Eurocent/kWh) and in the case of households with medium level annual consumption it was 3.2 (Bulgaria: 9.4 Eurocent/kWh, Denmark: 30.6 Eurocent/kWh) in September 2015.
• Looking at retail household electricity prices on purchasing power parities, in the first half of 2015 we saw a different picture regarding the cheapest and the most expensive EU Member States. Households with medium level annual consumption had to pay the most in Portugal (29.3 Eurocent/kWh) and the least in Finland (12.5 Eurocent/kWh) in the EU, if purchasing power parities are taken into account. The price ratio of the most expensive and the cheapest country was 2.4 in the first half of 2015. However, over the last few years price convergence could not be observed after purchasing power correction either, similarly to the case of actual prices measured in Eurocents.

33
• Figure 32 shows the retail electricity price element of the so-called Household Energy Price Index (HEPI), calculated with a methodology developed by Vaasaett on the basis of monthly collection of electricity invoices in the capital cities of the EU. In September 2015 the highest retail electricity price paid by households could be observed in Copenhagen (30.3 Eurocent/kWh), while the cheapest capital in the EU was Tallinn (10.5 Eurocent/kWh). Compared with September 2014, the biggest price increase could be observed in Paris (14.7%) and Prague (11.8%), while retail electricity prices decreased the most in Vienna (7%), Stockholm (6.7%) and Dublin (5.3%).
• Figure 33 shows the change in household retail electricity prices between September 2014 and 2015, expressed in Eurocent/kWh, and the contribution of cost components (energy costs, transmission and distribution costs, energy taxes and VAT) to the price change in most of European capital cities. Energy costs decreased by the most in Madrid, Vienna and Dublin while they rose significantly in Paris. Energy taxes went up significantly in Rome and Copenhagen, while transmission and distribu-tion had the biggest impact on price increase in Madrid and Prague, while they decreased the most in Rome and Copenha-gen.
• The two maps (Figure 34 and Figure 35 ) show the estimated quarterly average retail electricity prices paid by households and industrial customers, having medium level of annual electricity consumption, in the third quarter of 2015.
FIGURE 30 – RELATIVE STANDARD DEVIATION OF RETAIL ELECTRICITY PRICES IN EU MEMBER STATES IN DIFFERENT INDUSTRIAL CUSTOMER CONSUMPTION GROUPS
Source: Eurostat, own computations
0.20
0.25
0.30
0.35
0.40
1 2 3 4 5 6 7 8 9 10 11 12 1 2 3 4 5 6 7 8 9 10 11 12 1 2 3 4 5 6 7 8 9 10 11 12 1 2 3 4 5 6 7 8 92012 2013 2014 2015
Band IB : 20 MWh < Consumption < 200 MWh
Band IF : 70 000 MWh < Consumption < 150 000 MWh
Band ID : 2 000 MWh < Consumption < 20 000 MWh
34
FIGURE 31 – RELATIVE STANDARD DEVIATION OF RETAIL ELECTRICITY PRICES IN EU MEMBER STATES IN DIFFERENT HOUSEHOLD CUSTOMER CONSUMPTION GROUPS
Source: Eurostat, own computations
FIGURE 32 – THE HOUSEHOLD ENERGY PRICE INDEX (HEPI) IN EUROPEAN CAPITAL CITIES - ELECTRICITY PRICES IN JUNE 2015, AND CHANGES IN HOUSEHOLD ELECTRICITY PRICES COMPARED TO JUNE 2014
Source: Vaasaett. No price data for March 2014 available for Tallin, Riga, Vilnius, Valetta, Sofia and Nicosia
0.20
0.25
0.30
0.35
0.40
1 2 3 4 5 6 7 8 9 10 11 12 1 2 3 4 5 6 7 8 9 10 11 12 1 2 3 4 5 6 7 8 9 10 11 12 1 2 3 4 5 6 7 8 9
2012 2013 2014 2015
Band DB : 1 000 kWh < Consumption < 2 500 kWh
Band DC : 2 500 kWh < Consumption < 5 000 kWh
Band DD : 5 000 kWh < Consumption < 15 000 kWh
-20%
-10%
0%
10%
20%
30%
-15 €cent/kWh
-10 €cent/kWh
-5 €cent/kWh
0 €cent/kWh
5 € cent/kWh
10 € cent/kWh
15 € cent/kWh
20 € cent/kWh
25 € cent/kWh
30 € cent/kWh
35 € cent/kWh
Copp
enha
gen
Berli
n
Mad
rid
Lisb
on
Dub
lin
Lond
on
Brus
sels
Am
ster
dam
Nic
osia
Vien
na
Prag
ue
Luxe
mbo
urg
Rom
e
Paris
Ath
ens
Riga
Stoc
khol
m
Ljub
ljana
War
saw
Brat
isla
va
Zagr
eb
Buch
ares
t
Hel
sink
i
Viln
ius
Vale
tta
Buda
pest
So�a
Talli
nn

35
FIGURE 33 – CHANGE IN ELECTRICITY PRICES AND THEIR COST COMPONENTS IN EUROPEAN CAPITAL CITIES, BETWEEN JUNE 2014 AND JUNE 2015, IN EUROCENT/KWH
Source: Vaasaett No data were alvailable for Nicosia, Riga, Sofia ,Tallinn, Vilnius and Valetta in June 2014
-6 € cent/kWh
-4 € cent/kWh
-2 € cent/kWh
0 € cent/kWh
2 € cent/kWh
4 € cent/kWh
6 € cent/kWh Vi
enna
Dub
lin
Stoc
khol
m
Rom
e
Brat
isla
va
Copp
enha
gen
Hel
sink
i
Am
ster
dam
Ljub
ljana
Lisb
on
Buda
pest
Berli
n
Luxe
mbo
urg
Zagr
eb
War
saw
Buch
ares
t
Mad
rid
Lond
on
Ath
ens
Prag
ue
Brus
sels
Paris
Energy Distribution / Transmission Energy Taxes VAT Total

36
FIGURE 34 – ELECTRICITY PRICES (INCLUSIVE OF TAXES) – HOUSEHOLDS
Source: data computed from Eurostat half-yearly retail electricity prices and consumper price indices

37
FIGURE 35 – ELECTRICITY PRICES (WITHOUT VAT AND NON-RECOVERABLE TAXES) – INDUSTRIAL CONSUMERS
Source: data computed from Eurostat half-yearly retail electricity prices and consumper price indices
38
7. GlossaryBackwardation occurs when the closer-to-maturity contract is priced higher than the contract which matures at a later stage.
Clean dark spreads are defined as the average difference between the price of coal and carbon emission, and the equivalent price of electricity. If the level of dark spreads is above 0, coal power plant operators are competitive in the observed period. See dark spreads.
Clean spark spreads are defined as the average difference between the cost of gas and emissions, and the equivalent price of electricity. If the level of spark spreads is above 0, gas power plant operators are competitive in the observed period. See spark spreads.
Contango: A situation of contango arises in the when the closer to maturity contract has a lower price than the contract which is longer to maturity on the forward curve.
Cooling degree days (CDDs) are defined in a similar manner as Heating Degree Days (HDDs); the higher the outdoor tempe-rature is, the higher is the number of CDDs. On those days, when the daily average outdoor temperature is higher than 21°C, CDD values are in the range of positive numbers, otherwise CDD equals zero.
Dark spreads are reported as indicative prices giving the average difference between the cost of coal delivered ex-ship and the power price. As such, they do not include operation, maintenance or transport costs. Spreads are defined for a coal-fired plant with 35 % efficiency. Dark spreads are given in this publication for UK and Germany, with the coal and power reference price as reported by Platts.
Flow against price differentials (FAPDs): By combining hourly price and flow data, FAPDs are designed to give a measure of the consistency of economic decisions of market participants in the context of close to real time operation of electrical systems.With the closure of the day-ahead markets (D-1), the prices for each hourly slot of day D are known by market participants. Based on the information from the power exchanges of two neighbouring areas, market participants can establish hourly price differentials. Later in D-1, market participants also nominate commercial schedules for day D. An event named ‘flow against price differentials’ (FAPD) occurs when commercial nominations for cross border capacities are such that power is set to flow from a higher price area to a lower price area. The FAPD chart in this quarterly report provides detailed information on adverse flows, presenting the ratio of the number of hours with adverse flows to the number of total trading hours in a quarter.
Heating degree days (HDDs) express the severity of a meteorological condition for a given area and in a specific time period. HDDs are defined relative to the outdoor temperature and to what is considered as comfortable room temperature. The colder is the weather, the higher is the number of HDDs. These quantitative indices are designed to reflect the demand for energy needed to heat a building.
Spark spreads are reported as indicative prices giving the average difference between the cost of natural gas delivered ex-ship and the power price. As such, they do not include operation, maintenance or transport costs. Spreads are defined for a gas-fired plant with 50 % efficiency. Spark spreads are given for UK and Germany in this publication, with the gas and power reference price as reported by Platts.
Tariff deficit expresses the difference between the price (called a tariff) that a regulated utility, such as an electricity producer is allowed to charge and its generation cost per unit..
