quarterly report - proximus.com · offers addressing the needs of music streaming and social...
TRANSCRIPT
Sensitivity: Confidential
Quarterly Report
2 Sensitivity: Confidential
Table of contents
Highlights Q2 2018 ......................................................................................................................................... 3
Proximus Group financial review ............................................................................................................. 5
Consumer .......................................................................................................................................................... 13
Enterprise ........................................................................................................................................................... 19
Wholesale .......................................................................................................................................................... 23
BICS (International Carrier Services).................................................................................................... 23
Condensed interim consolidated financial statements ............................................................. 26
Additional information ................................................................................................................................ 36

3 Proximus Group
Sensitivity: Confidential
Highlights Q2 20181
• Continued net customer gain for Consumer Internet and TV, in competitive setting.
• Solid mobile Postpaid growth for Consumer and Enterprise, +45,000 in Q2 2018.
• Ongoing traction for Tuttimus and Bizz All-In, 439,000 subscribers end-June 2018.
• Domestic operations achieved 0.8% revenue and 5.5% EBITDA growth.
• BICS, including TeleSign2, posted firm EBITDA, +12.7% on higher Direct margin.
• Reiterating full-year guidance.
• •
▪ Proximus posted for the second quarter of 2018 a Domestic underlying revenue of EUR 1,114 million, 0.8%
above that of the same period of 2017. This resulted from higher Fixed Data and TV revenue, compensating
for the steady erosion in Fixed Voice. Revenue from Mobile Postpaid was up, driven by the enlarging customer
base over the past year, which more than compensated for the “Roam-like-at-Home” price pressure.
Furthermore, Proximus posted for the second quarter 2018 a solid 6.2% revenue growth for ICT.
Proximus’ carrier services, BICS, posted a solid second-quarter revenue of EUR 340 million, 8.9% above
that of the comparable period in 2017, TeleSign included. In aggregate, the Proximus Group ended the second
quarter of 2018 with a 2.6% revenue growth, totaling EUR 1,454 million.
▪ For its Domestic operations, Proximus posted second-quarter 2018 direct margin of EUR 853 million.
The year-on-year increase by 2.3%, in spite of the “Roam-like-at-Home” impact, was driven by the Consumer
segment, benefitting from its customer growth and one-off tailwinds. BICS’ direct margin progressed to
EUR 79 million, a year-on-year increase of 18.5%, resulting from boosting A2P messaging volumes and direct
cost synergies following the TeleSign acquisition. In aggregate, the Proximus Group underlying direct margin
grew by 3.5%, totaling EUR 932 million for the second quarter of 2018.
▪ Proximus’ Group underlying operating expenses for the second quarter 2018 were up by 0.7%. This was
mainly attributable to the consolidation of TeleSign in BICS. Proximus’ Domestic expenses were down year-
on-year by 1.2%, driven by a lower headcount.
▪ The underlying EBITDA of the Proximus Group for the second quarter 2018 totaled EUR 493 million, a 6.1%
increase compared with the same period of 2017. This includes a 5.5% increase for Proximus’ Domestic
operations, totaling EUR 454 million, and a 12.7% increase for BICS, including TeleSign.
▪ Proximus invested in the second quarter of 2018 EUR 238 million, bringing the capex over the first six months
of 2018 to EUR 459 million. This covers Proximus’ extensive investments in enhancing its networks, with the
ongoing roll-out of Fiber and continued investments in its mobile network to maintain high-quality standards
while data traffic volumes are boosted. With its focus on improving the overall customer experience, Proximus
also invests in its IT systems and ensures attractive content for its TV customers.
▪ Proximus’ second quarter 2018 FCF totaled EUR 80 million, bringing the year-to-date June FCF to EUR 159
million, or EUR 180 million when excluding the cash-out related to the acquisition of subsidiaries in the ICT
domain. The remaining decrease compared to 2017 was mainly the consequence of higher cash paid for Capex,
partially offset by a growth in underlying EBITDA and lower Income Tax payments.
1 All financials and like for like comparisons in this report related to the Group and Segments are provided under IAS 18, unless otherwise stated.
2 Consolidated in BICS as of 1 November 2017
Brussels, 27 July 2018
7.00 (CET)
Regulated Information

Proximus Group 4
Sensitivity: Confidential
▪ In a generally slow second quarter for broadband and
TV growth, Proximus continued to enlarge its customer
base for both products, supported by the ongoing success
of Tuttimus/Bizz All-In offers and Proximus’ no frills brand
Scarlet. Proximus achieved solid growth in its Mobile
Postpaid base, driven by lower churn and its successful
World Cup campaign for mobile, and ongoing mobile
customer growth for the Enterprise segment.
Dominique Leroy, CEO of Proximus Group
I’m very satisfied we realized a strong second quarter, showing continued customer growth and a solid set of financials in spite of a highly competitive market, and as such we close a solid first half of the year. Through our dual-brand strategy, we have been able to continue to grow our customer base for TV and Internet, in a generally slow
commercial quarter for Fixed. Nonetheless we continued to see good traction for our all-in offers, reaching 439,000
Tuttimus/Bizz all-in customers by end-June. We also achieved a strong growth in Mobile Postpaid, adding in total 45,000 cards to
our Postpaid base, driven by a sequentially improved churn, a successful Red Devils mobile campaign, and continued growth in the
Enterprise segment. On the 25th of June we expanded our Consumer mobile offers with two EPIC price plans, fully digital mobile
offers addressing the needs of music streaming and social network loving millennials, with some first promising results.
Our Enterprise segment sustained its solid position, with a further growing Mobile customer base and achieving a strong growth in
ICT. On top of the firm progress made organically, our ICT business is also benefitting from the investments we have made to
strengthen our ICT portfolio, offering services that go well beyond pure connectivity. Over the past year, we have acquired small but
highly specialized companies, offering meaningful solutions for the digital transformation of our business customers. Fitting this
strategy, we have more recently announced the acquisition of Codit, a Belgian IT services company and a market leader in business
application integration, API6 Management, Microsoft Azure and Internet of Things. This will enable us to further support Corporate
customers from the infrastructure layer up to the application layer.
The sound commercial achievements have led to a positive revenue evolution for our Domestic operations by 0.8%. At the same
time we continued to manage our direct and operational costs, leading to a strong Domestic EBITDA performance, growing by 5.5%
for the second quarter. This includes a EUR 13 million loss in Roaming Direct margin following the Roam like at Home regulation.
BICS closed a firm second quarter, with a year-over year growth in direct margin by 18.5% and EBITDA by 12.7%. This was strongly
supported by TeleSign’s consolidation which accelerates BICS’ strategic ambitions in the growing Application to Person market, and
delivering meaningful synergies.
With both Domestic and BICS achieving solid EBITDA growth, we closed the second quarter with a 6.1% increase for our Group
EBITDA. This brings us to a 3.6% growth for the Group EBITDA over the first-half of 2018, slightly ahead of our expectations,
including some one-off tailwinds in direct margin. Based on our estimates for the remainder of the year, we reiterate our full-year
guidance of slight EBITDA growth for the Group, and nearly stable Domestic revenue. We also reconfirm that the Capex for 2018 is
estimated to be around EUR 1 billion, and that we intend to return a EUR 1.50 gross dividend per share over the result of 2018.
As a final point, we have taken note of the agreement of the federal government to open the upcoming spectrum auctions to a
fourth mobile operator under discriminatory conditions. In the coming months we will work hard on elaborating different scenarios
anticipating the possible arrival of the fourth entrant and the potential consequences for Proximus.
3 Not including second or third TV settop boxes.
4 Group (Consumer, Enterprise and Tango) figure, only paying, active cards, excluding M2M.
5 Households/Small Office, with Small Office being all customers of Consumer-SE. These are small enterprises with up to 10 employees.
6 Application Programming Interfaces
+9,0003 TV-customers, total of 1,584,000
+6,000 Fixed Internet lines, total of 2,002,000
-25,000 Fixed Voice lines, total of 2,569,000
+45,0004 Mobile Postpaid cards, 3,952,000 in total
-39,000 Mobile Prepaid cards, 886,000 in total
+9,000 3 & 4-Play HH/SO5, total of 1,452,000
i.e. 48.8% of total base
57.2% Convergent HH/S0, +1.6 p.p. YoY
5 Proximus Group
Sensitivity: Confidential
Proximus Group financial review
2.1.1 Underlying Group revenue
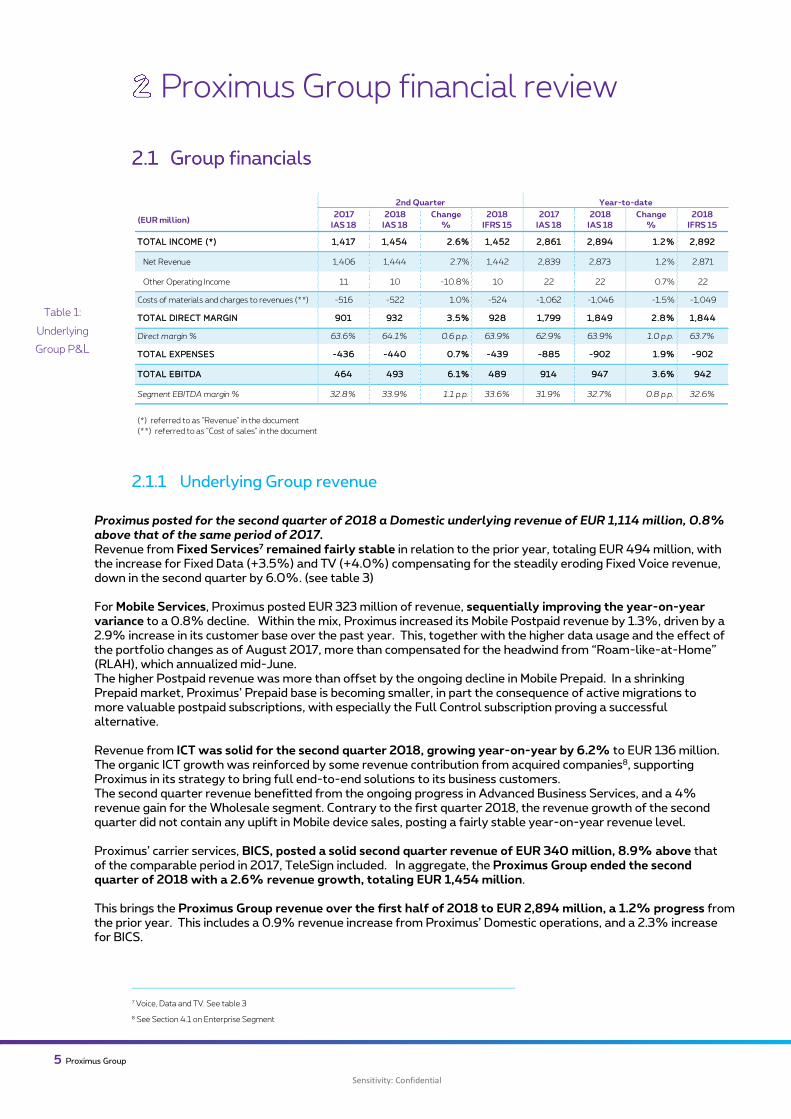
Proximus posted for the second quarter of 2018 a Domestic underlying revenue of EUR 1,114 million, 0.8% above that of the same period of 2017. Revenue from Fixed Services7 remained fairly stable in relation to the prior year, totaling EUR 494 million, with the increase for Fixed Data (+3.5%) and TV (+4.0%) compensating for the steadily eroding Fixed Voice revenue, down in the second quarter by 6.0%. (see table 3) For Mobile Services, Proximus posted EUR 323 million of revenue, sequentially improving the year-on-year variance to a 0.8% decline. Within the mix, Proximus increased its Mobile Postpaid revenue by 1.3%, driven by a 2.9% increase in its customer base over the past year. This, together with the higher data usage and the effect of the portfolio changes as of August 2017, more than compensated for the headwind from “Roam-like-at-Home” (RLAH), which annualized mid-June. The higher Postpaid revenue was more than offset by the ongoing decline in Mobile Prepaid. In a shrinking Prepaid market, Proximus’ Prepaid base is becoming smaller, in part the consequence of active migrations to more valuable postpaid subscriptions, with especially the Full Control subscription proving a successful alternative.
Revenue from ICT was solid for the second quarter 2018, growing year-on-year by 6.2% to EUR 136 million. The organic ICT growth was reinforced by some revenue contribution from acquired companies8, supporting Proximus in its strategy to bring full end-to-end solutions to its business customers. The second quarter revenue benefitted from the ongoing progress in Advanced Business Services, and a 4% revenue gain for the Wholesale segment. Contrary to the first quarter 2018, the revenue growth of the second quarter did not contain any uplift in Mobile device sales, posting a fairly stable year-on-year revenue level. Proximus’ carrier services, BICS, posted a solid second quarter revenue of EUR 340 million, 8.9% above that of the comparable period in 2017, TeleSign included. In aggregate, the Proximus Group ended the second quarter of 2018 with a 2.6% revenue growth, totaling EUR 1,454 million. This brings the Proximus Group revenue over the first half of 2018 to EUR 2,894 million, a 1.2% progress from the prior year. This includes a 0.9% revenue increase from Proximus’ Domestic operations, and a 2.3% increase for BICS.
7 Voice, Data and TV. See table 3
8 See Section 4.1 on Enterprise Segment
(EUR million)2017
IAS 18
2018
IAS 18
Change
%
2018
IFRS 15
2017
IAS 18
2018
IAS 18
Change
%
2018
IFRS 15
TOTAL INCOME (*) 1,417 1,454 2.6% 1,452 2,861 2,894 1.2% 2,892
Net Revenue 1,406 1,444 2.7% 1,442 2,839 2,873 1.2% 2,871
Other Operating Income 11 10 -10.8% 10 22 22 0.7% 22
Costs of materials and charges to revenues (**) -516 -522 1.0% -524 -1,062 -1,046 -1.5% -1,049
TOTAL DIRECT MARGIN 901 932 3.5% 928 1,799 1,849 2.8% 1,844
Direct margin % 63.6% 64.1% 0.6 p.p. 63.9% 62.9% 63.9% 1.0 p.p. 63.7%
TOTAL EXPENSES -436 -440 0.7% -439 -885 -902 1.9% -902
TOTAL EBITDA 464 493 6.1% 489 914 947 3.6% 942
Segment EBITDA margin % 32.8% 33.9% 1.1 p.p. 33.6% 31.9% 32.7% 0.8 p.p. 32.6%
(*) referred to as "Revenue" in the document
(**) referred to as "Cost of sales" in the document
2nd Quarter Year-to-date
Table 1:
Underlying
Group P&L
Proximus Group 6
Table 2: Group revenue by segment
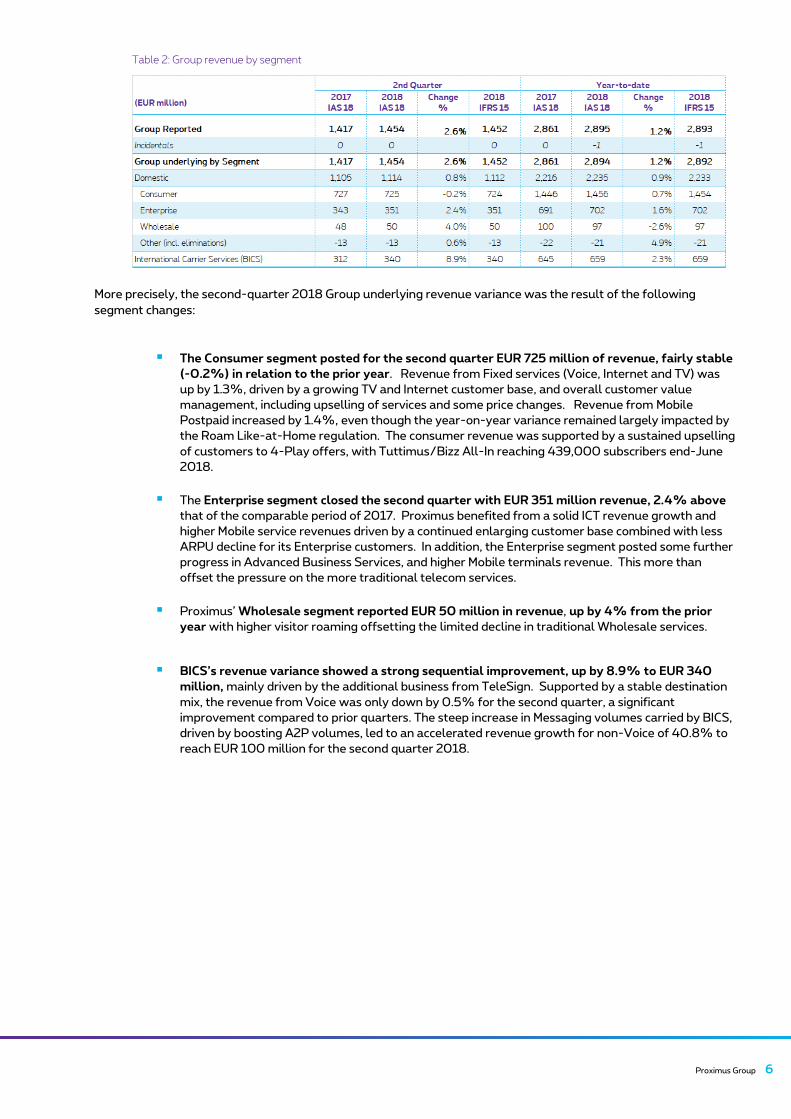
More precisely, the second-quarter 2018 Group underlying revenue variance was the result of the following
segment changes:
▪ The Consumer segment posted for the second quarter EUR 725 million of revenue, fairly stable
(-0.2%) in relation to the prior year. Revenue from Fixed services (Voice, Internet and TV) was
up by 1.3%, driven by a growing TV and Internet customer base, and overall customer value
management, including upselling of services and some price changes. Revenue from Mobile
Postpaid increased by 1.4%, even though the year-on-year variance remained largely impacted by
the Roam Like-at-Home regulation. The consumer revenue was supported by a sustained upselling
of customers to 4-Play offers, with Tuttimus/Bizz All-In reaching 439,000 subscribers end-June
2018.
▪ The Enterprise segment closed the second quarter with EUR 351 million revenue, 2.4% above
that of the comparable period of 2017. Proximus benefited from a solid ICT revenue growth and
higher Mobile service revenues driven by a continued enlarging customer base combined with less
ARPU decline for its Enterprise customers. In addition, the Enterprise segment posted some further
progress in Advanced Business Services, and higher Mobile terminals revenue. This more than
offset the pressure on the more traditional telecom services.
▪ Proximus’ Wholesale segment reported EUR 50 million in revenue, up by 4% from the prior
year with higher visitor roaming offsetting the limited decline in traditional Wholesale services.
▪ BICS’s revenue variance showed a strong sequential improvement, up by 8.9% to EUR 340
million, mainly driven by the additional business from TeleSign. Supported by a stable destination
mix, the revenue from Voice was only down by 0.5% for the second quarter, a significant
improvement compared to prior quarters. The steep increase in Messaging volumes carried by BICS,
driven by boosting A2P volumes, led to an accelerated revenue growth for non-Voice of 40.8% to
reach EUR 100 million for the second quarter 2018.

7 Proximus Group
2.1.2 Underlying Group direct margin
For its Domestic operations, Proximus posted a second-quarter 2018 direct margin of EUR 853 million, up
by 2.3% from the same period of 2017, in spite of EUR -13 million net decrease in roaming margin triggered by
RLAH.
The second quarter progress in direct margin was driven by the higher direct margin posted by the Consumer
segment, up by 2.7% compared with the prior year. About half was driven by one-off tailwinds, including a
significant benefit following the renegotiation of several supplier contracts. The direct margin of both the
Enterprise and Wholesale segment remained stable.
For the second quarter of 2018, BICS’ direct margin progressed to EUR 79 million, a year-on-year increase
of 18.5%, including TeleSign’s9 contribution, resulting from boosting A2P messaging volumes and direct cost
synergies. In aggregate, the Proximus Group underlying direct margin grew by 3.5%, totaling EUR 932
million for the second quarter of 2018.
Over the first six months of 2018, the direct margin of the Proximus Group totaled EUR 1,849 million, +2.8%
from the prior year, with Domestic operations posting a 1.5% progress and BICS +18.7%. Over the first six
months of 2018, roaming regulation has caused a EUR 26 million decrease in roaming margin.
9 Consolidated in BICS as of 1 November 2017
(EUR million)2017
IAS 18
2018
IAS 18
Change
%
2018
IFRS 15
2017
IAS 18
2018
IAS 18
Change
%
2018
IFRS 15
Group Reported 901 932 3.5% 928 1,799 1,850 2.8% 1,845
Incidentals 0 0 0 0 -1 -1
Group underl y ing by Segment 901 932 3.5% 928 1,799 1,849 2.8% 1,844
Domestic 834 853 2.3% 849 1,667 1,693 1.5% 1,688
Consumer 551 566 2.7% 563 1,098 1,122 2.2% 1,118
Enterprise 239 239 0.0% 238 477 476 -0.2% 475
Wholesale 41 41 -0.5% 41 86 82 -5.3% 82
Other (incl. eliminations) 2 7 >100% 7 6 13 >100% 13
International Carrier Services (BICS) 67 79 18.5% 79 132 156 18.7% 156
2nd Quarter Year-to-date
Table 3:
Underlying Group
revenue by product
group
Table 4:
Group direct margin
by segment

Proximus Group 8
2.1.3 Underlying Group expenses10
Table 5: Workforce versus non- workforce expenses / Domestic expenses by nature
(*) Restated: split workforce - non workforce has been aligned for all subsidiaries, no impact on total expenses.
Proximus’ Group underlying operating expenses for the second quarter 2018 were up by 0.7%, driven by
higher costs for BICS, including the consolidation of TeleSign. Following this acquisition in November 2017, BICS’
total headcount increased, totaling 710 FTEs end-June 2018. The year-on-year increase of 184 FTEs is reflected in
BICS’ workforce expenses.
Proximus’ Domestic expenses were down by 1.2% compared to the second quarter of 2017, including higher
expenses fueling the ICT growth, partly related to new acquisitions in this domain. The year-on-year decrease is
driven by a 2.5% reduction in workforce expenses, with the positive impact from a lower headcount in part offset by
the impact of an inflation-based salary increase in July 2017 and the natural wage drift.
Proximus’ Domestic workforce ended 207 FTEs below that of one year ago, totaling 12,375 FTEs end-June 2018.
The headcount decrease was largely the consequence of the voluntary early leave plan ahead of retirement, with in
addition some legal retirements and natural attrition. This was however partly offset by external hiring of business
critical profiles and the impact of acquired ICT subsidiaries, in total adding 99 FTEs.
2.1.4 Group EBITDA
(1) Underlying Group EBITDA
As a result of the higher margin achieved for its Domestic operations in the second quarter 2018, combined with
lower expenses, Proximus posted a 5.5% increase in underlying Domestic EBITDA, totaling EUR 454 million.
This includes a net regulatory impact of EUR -13 million11. This loss in roaming margin aside, the second-quarter
2018 Domestic EBITDA would have grown by 8.6%.
BICS posted a second-quarter 2018 EBITDA of EUR 39 million, a year-on-year increase of 12.7% including
TeleSign.
10 Before D&A; excluding Cost of Sales; excluding incidentals.
11 See section 2.2 on Regulation
Table 6:
Operating income
before depreciation
and amortization
* *
9 Proximus Group
In aggregate, the Proximus Group’s second quarter 2018 underlying EBITDA totaled EUR 493 million, a 6.1%
increase compared with the same period of 2017, or +8.9% excluding the regulatory-driven loss in roaming
margin.
Over the first-half of 2018, the Proximus Group posted EUR 947 million EBITDA, a 3.6% year-on-year increase.
This includes a 3.2% growth in its Domestic EBITDA, and a 9.0% increase for BICS.
(2) Total Reported Group EBITDA (incidentals included) In the second quarter of 2018, the Proximus Group recorded EUR 33 million negative EBITDA incidentals, mainly
related to the ongoing early leave plan prior to retirement and revised provisions for pylon taxes. The latter is the
consequence of the court decision on 7 June in the Schaerbeek case leading Proximus to review the impact of this
broad interpretation by the court on outstanding related cases. As a result, Proximus accounted for EUR 21 million
additional liabilities for all Brussels municipalities related to the period 2004 to 2017.
The incidentals included, the Proximus Group’s reported EBITDA totaled EUR 460 million for the second
quarter 2018, compared to EUR 445 million the year before, i.e. a 3.2% increase. See section 8.2 for more
information on the incidentals.
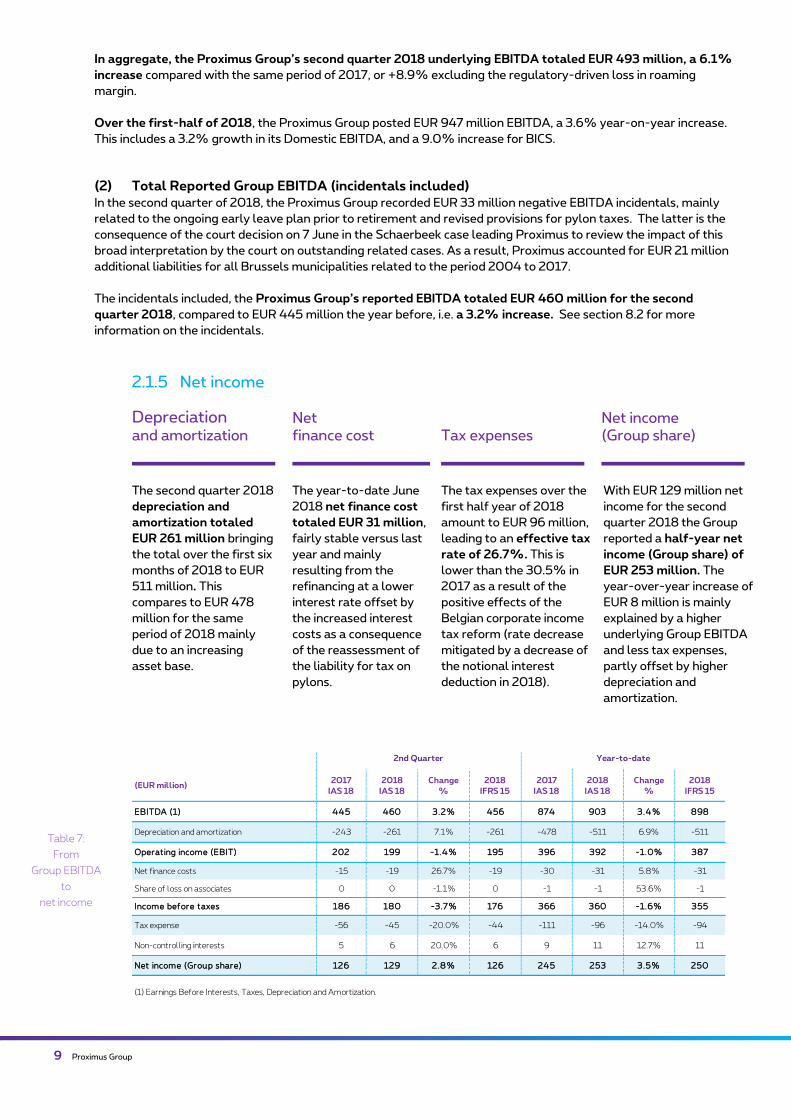
2.1.5 Net income
Depreciation and amortization
Net finance cost Tax expenses
Net income (Group share)
The second quarter 2018
depreciation and
amortization totaled
EUR 261 million bringing
the total over the first six
months of 2018 to EUR
511 million. This
compares to EUR 478
million for the same
period of 2018 mainly
due to an increasing
asset base.
The year-to-date June
2018 net finance cost
totaled EUR 31 million,
fairly stable versus last
year and mainly
resulting from the
refinancing at a lower
interest rate offset by
the increased interest
costs as a consequence
of the reassessment of
the liability for tax on
pylons.
The tax expenses over the
first half year of 2018
amount to EUR 96 million,
leading to an effective tax
rate of 26.7%. This is
lower than the 30.5% in
2017 as a result of the
positive effects of the
Belgian corporate income
tax reform (rate decrease
mitigated by a decrease of
the notional interest
deduction in 2018).
With EUR 129 million net
income for the second
quarter 2018 the Group
reported a half-year net
income (Group share) of
EUR 253 million. The
year-over-year increase of
EUR 8 million is mainly
explained by a higher
underlying Group EBITDA
and less tax expenses,
partly offset by higher
depreciation and
amortization.
(EUR million)2017
IAS 18
2018
IAS 18
Change
%
2018
IFRS 15
2017
IAS 18
2018
IAS 18
Change
%
2018
IFRS 15
EBITDA (1) 445 460 3.2% 456 874 903 3.4% 898
Depreciation and amortization -243 -261 7.1% -261 -478 -511 6.9% -511
Operat ing income (EBIT) 202 199 -1.4% 195 396 392 -1.0% 387
Net finance costs -15 -19 26.7% -19 -30 -31 5.8% -31
Share of loss on associates 0 0 -1.1% 0 -1 -1 53.6% -1
Income before taxes 186 180 -3.7% 176 366 360 -1.6% 355
Tax expense -56 -45 -20.0% -44 -111 -96 -14.0% -94
Non-controlling interests 5 6 20.0% 6 9 11 12.7% 11
Net income (Group share) 126 129 2.8% 126 245 253 3.5% 250
2nd Quarter Year-to-date
(1) Earnings Before Interests, Taxes, Depreciation and Amortization.
Table 7:
From
Group EBITDA
to
net income
Proximus Group 10
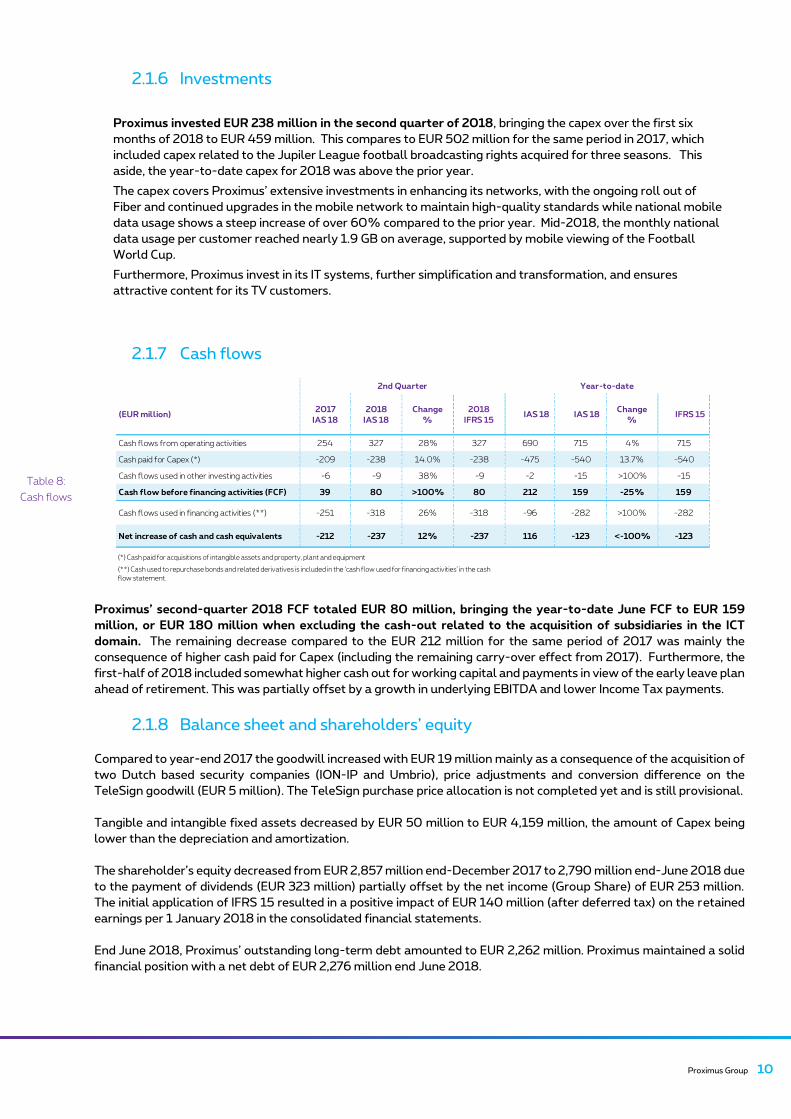
2.1.6 Investments
Proximus invested EUR 238 million in the second quarter of 2018, bringing the capex over the first six
months of 2018 to EUR 459 million. This compares to EUR 502 million for the same period in 2017, which
included capex related to the Jupiler League football broadcasting rights acquired for three seasons. This
aside, the year-to-date capex for 2018 was above the prior year.
The capex covers Proximus’ extensive investments in enhancing its networks, with the ongoing roll out of
Fiber and continued upgrades in the mobile network to maintain high-quality standards while national mobile
data usage shows a steep increase of over 60% compared to the prior year. Mid-2018, the monthly national
data usage per customer reached nearly 1.9 GB on average, supported by mobile viewing of the Football
World Cup.
Furthermore, Proximus invest in its IT systems, further simplification and transformation, and ensures
attractive content for its TV customers.
2.1.7 Cash flows
Proximus’ second-quarter 2018 FCF totaled EUR 80 million, bringing the year-to-date June FCF to EUR 159
million, or EUR 180 million when excluding the cash-out related to the acquisition of subsidiaries in the ICT
domain. The remaining decrease compared to the EUR 212 million for the same period of 2017 was mainly the
consequence of higher cash paid for Capex (including the remaining carry-over effect from 2017). Furthermore, the
first-half of 2018 included somewhat higher cash out for working capital and payments in view of the early leave plan
ahead of retirement. This was partially offset by a growth in underlying EBITDA and lower Income Tax payments.
2.1.8 Balance sheet and shareholders’ equity
Compared to year-end 2017 the goodwill increased with EUR 19 million mainly as a consequence of the acquisition of
two Dutch based security companies (ION-IP and Umbrio), price adjustments and conversion difference on the
TeleSign goodwill (EUR 5 million). The TeleSign purchase price allocation is not completed yet and is still provisional.
Tangible and intangible fixed assets decreased by EUR 50 million to EUR 4,159 million, the amount of Capex being
lower than the depreciation and amortization.
The shareholder’s equity decreased from EUR 2,857 million end-December 2017 to 2,790 million end-June 2018 due
to the payment of dividends (EUR 323 million) partially offset by the net income (Group Share) of EUR 253 million.
The initial application of IFRS 15 resulted in a positive impact of EUR 140 million (after deferred tax) on the retained
earnings per 1 January 2018 in the consolidated financial statements.
End June 2018, Proximus’ outstanding long-term debt amounted to EUR 2,262 million. Proximus maintained a solid
financial position with a net debt of EUR 2,276 million end June 2018.
(EUR million)2017
IAS 18
2018
IAS 18
Change
%
2018
IFRS 15 IAS 18 IAS 18
Change
% IFRS 15
Cash flows from operating activities 254 327 28% 327 690 715 4% 715
Cash paid for Capex (*) -209 -238 14.0% -238 -475 -540 13.7% -540
Cash flows used in other investing activities -6 -9 38% -9 -2 -15 >100% -15
Cash flow before financing activities (FCF) 39 80 >100% 80 212 159 -25% 159
Cash flows used in financing activities (**) -251 -318 26% -318 -96 -282 >100% -282
Net increase of cash and cash equivalents -212 -237 12% -237 116 -123 <-100% -123
(*) Cash paid for acquisitions of intangible assets and property, plant and equipment
Year-to-date2nd Quarter
(**) Cash used to repurchase bonds and related derivatives is included in the ‘cash flow used for financing activities’ in the cash
flow statement.
Table 8:
Cash flows

11 Proximus Group
Table 9: Net financial position
International Roaming
The lowered roaming prices following the EU roaming regulation impacted Proximus’ Mobile services revenue
and margin. For the first half of 2018, the net roaming margin decreased year-on-year by EUR 26 million. This
includes the impact from Roam like at Home pricing, the decrease in roaming options for the Enterprise
segment, and a positive impact from visitor roaming traffic. The Roam like at Home pricing annualized 12 June
2018.
Fixed Termination Rates (FTR)
Following the annulment of the decision to lower the Fixed Termination Rates as from 1 November 2016, the
previous, higher, FTRs were reintroduced early 2017. This increased the revenue and EBITDA in the first
quarter of 2017 by respectively EUR 4 million and EUR 2 million, and hence negatively impacted the year-on-
year variance for the first quarter 2018. Comparing year-on-year an equal FTRs for the second quarter, the
year-to-date impact was limited to the first-quarter effect. BIPT announced it will publish its final decision for
the third quarter 2018.
Broadband and TV market analysis
After the green light granted by the European Commission end-May, the Belgian regulators published on 29 June
2018 their final decisions on the review of the broadband and television market analysis. The final texts remain
unchanged as compared to the version notified to the European Commission end April. Overall the outcome is in
line with Proximus’ expectations. The new decisions confirm the deepening of the cable regulation and the
extension of Proximus’ regulation from its copper to its fiber network. It is also confirmed that there is no impact
on Proximus planned network topology.
Overall the new regulation for Fiber is in line with the wholesale strategy of Proximus to open its networks to
other operators, and therefore no negative implications are expected in the near term. During the past years
Proximus developed and evolved its wholesale offer and in the course of last year and this year it signed several
As of 31 December As of 30 June
(EUR million) 2017 2018
Investments, Cash and cash equivalents (*) 338 214
Derivatives 5 5
Assets 342 219
Non-current liabilities (**) -1,860 -2,260
Current liabilities (**) -570 -235
Liabil it ies -2,430 -2,496
Net financial position -2,088 -2,276
(*) investments included
(**) LT bonds related derivatives included
Regulation impact on YoY variance RevenueDirect
MarginRevenue
Direct
MarginRevenue
Direct
Margin
Overal l net impact on Roaming
(pr ice and vol ume impact of roaming-out &
roaming-in)
-12 -13 -22 -26 -34 -35
Among which regulated price impact on Roaming-Out -13 -13 -26 -26 -26 -26
Fixed Terminat ion Rates 0 0 -4 -2 -12 -5
FY 2018 estimate(EUR million) Q2 2018 YTD'18
˜˜
Roaming-Out price impact is defined as: Volumes of year-1 multiplied by the year-on-year price decrease as set by the regulator.
Table 10:
Estimated
year-on-year
impact from
regulation
Proximus Group 12
commercial agreements with its main broadband wholesale customers, today already representing 80% of the
bitstream market (excluding cable).
In terms of pricing, the regulators maintain the proposed “fair pricing” (i.e. price based on current costs, increased
with a reasonable profit margin) for fiber, be it as a controlling measure to identify excessive pricing. Today the
wholesale fiber pricing for the two first speed tiers is set based on the commercial agreements Proximus has
closed.
Finally, Proximus is satisfied that there is now a clear framework for reciprocal access between cable and
copper/fiber, meaning that also in the business market there is a more level playing field. It was also confirmed
that Proximus is allowed to access cable where there is no own coverage (and no viable business case to build).
The ‘high quality broadband services’ (leased lines/connectivity) are not addressed in this decision (planned in the
course of 2018).
EU Telecom Review – regulation of international calls
On 5 June 2018, the EU institutions reached a final compromise on the European Electronic Communications
Code and in particular on the regulation of international calls and SMS. The agreement foresees a capping of the
retail intra-EU calls to 19 cents/min and of the SMS to 6 cents/SMS. The tariffs will apply to consumer pricing
only. The offering of alternative tariffs would be possible based on an opt-in by the customer. A sustainability
derogation is also foreseen: in case regulation makes the “domestic charging model” of the provider
“unsustainable”, the regulators could allow higher tariffs. The obligation will enter into force on 15 May 2019 and
will end after five years.
The deal also includes minimum 15-year spectrum licenses (with optional five-year extension) as well as the
access package, in particular an agreement to relax regulation for operators that co-invest and on instruments in
case of oligopoly markets.
Formal adoption of the Code by the Parliament and the Council is expected in the second half of 2018. Member
States will then have two years to transpose the Code into their national legislations.
Upcoming spectrum auction
Belgian authorities are currently preparing a multi-band spectrum auction. The auctions will include the renewal
of licenses in the existing bands (900, 1800 and 2100 MHz licenses due to expire on 25 March 2021) and the
granting of spectrum in new bands, i.e. 700 MHz and 3.5 GHz . All licenses will be valid for 20 years with the
possibility to extend by 5-year periods. The total reserve price (minimum price) is around EUR 660 million for the
whole market, with the final outcome fully depending on the result of the auctions. On 23 July 2018, the Belgian
Government approved the principle of favouring the entry of a 4th mobile player on the market. The auction is
not expected to start before the third quarter of 2019.
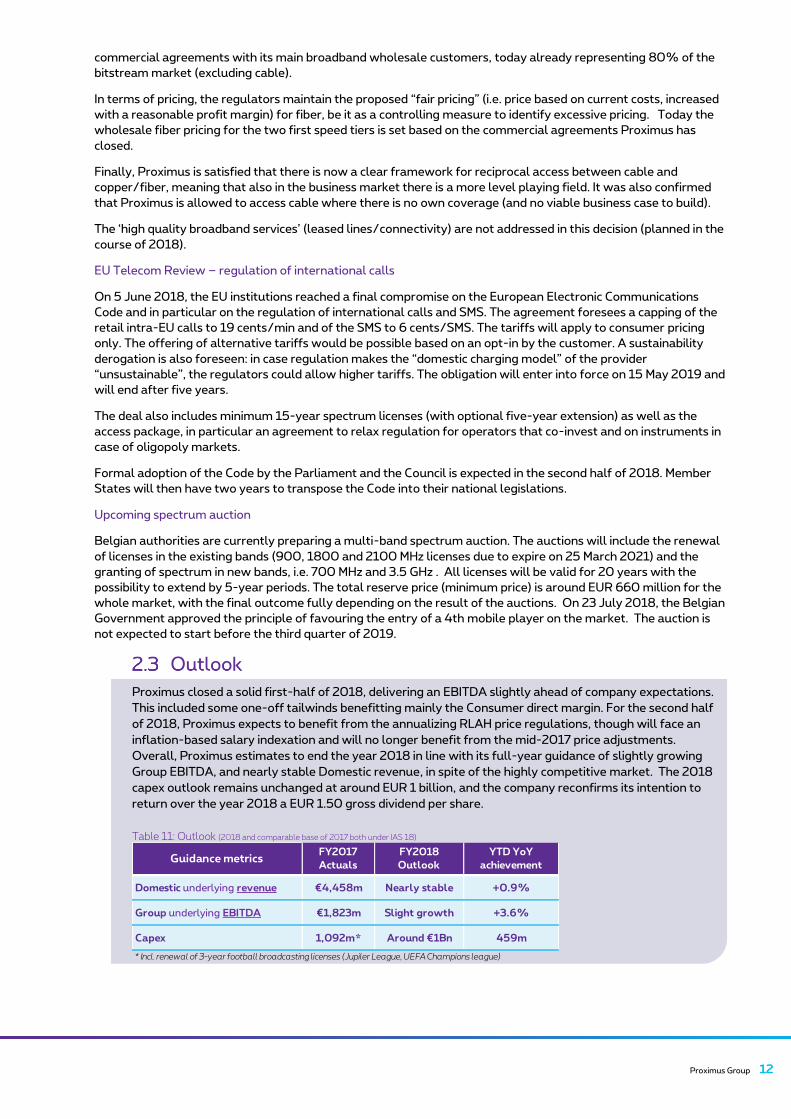
Proximus closed a solid first-half of 2018, delivering an EBITDA slightly ahead of company expectations.
This included some one-off tailwinds benefitting mainly the Consumer direct margin. For the second half
of 2018, Proximus expects to benefit from the annualizing RLAH price regulations, though will face an
inflation-based salary indexation and will no longer benefit from the mid-2017 price adjustments.
Overall, Proximus estimates to end the year 2018 in line with its full-year guidance of slightly growing
Group EBITDA, and nearly stable Domestic revenue, in spite of the highly competitive market. The 2018
capex outlook remains unchanged at around EUR 1 billion, and the company reconfirms its intention to
return over the year 2018 a EUR 1.50 gross dividend per share.
Table 11: Outlook (2018 and comparable base of 2017 both under IAS 18)
Domestic underlying revenue €4,458m Nearly stable +0.9%
Group underlying EBITDA €1,823m Slight growth +3.6%
Capex 1,092m* Around €1Bn 459m
YTD YoY
achievementGuidance metrics
FY2017
Actuals
FY2018
Outlook
* Incl. renewal of 3-year football broadcasting licenses (Jupiler League, UEFA Champions league)
13 Consumer
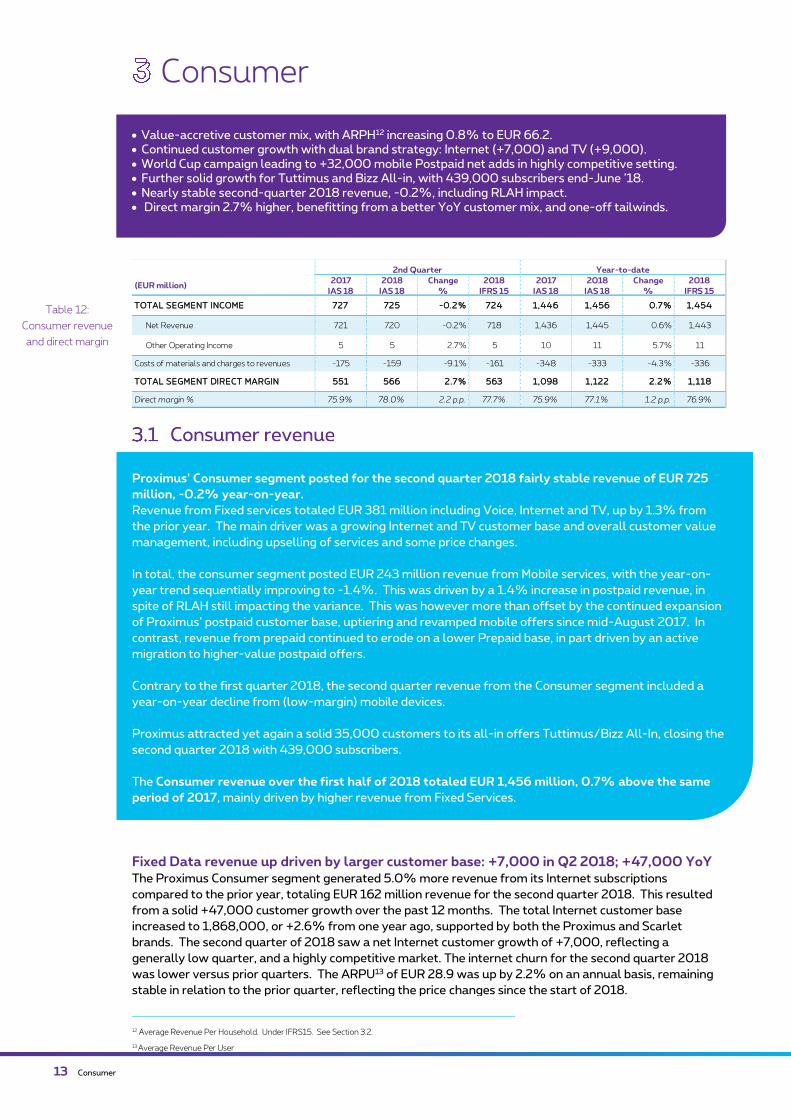
Consumer • Value-accretive customer mix, with ARPH12 increasing 0.8% to EUR 66.2. • Continued customer growth with dual brand strategy: Internet (+7,000) and TV (+9,000). • World Cup campaign leading to +32,000 mobile Postpaid net adds in highly competitive setting. • Further solid growth for Tuttimus and Bizz All-in, with 439,000 subscribers end-June ’18. • Nearly stable second-quarter 2018 revenue, -0.2%, including RLAH impact. • Direct margin 2.7% higher, benefitting from a better YoY customer mix, and one-off tailwinds.
Fixed Data revenue up driven by larger customer base: +7,000 in Q2 2018; +47,000 YoY The Proximus Consumer segment generated 5.0% more revenue from its Internet subscriptions
compared to the prior year, totaling EUR 162 million revenue for the second quarter 2018. This resulted
from a solid +47,000 customer growth over the past 12 months. The total Internet customer base
increased to 1,868,000, or +2.6% from one year ago, supported by both the Proximus and Scarlet
brands. The second quarter of 2018 saw a net Internet customer growth of +7,000, reflecting a
generally low quarter, and a highly competitive market. The internet churn for the second quarter 2018
was lower versus prior quarters. The ARPU13 of EUR 28.9 was up by 2.2% on an annual basis, remaining
stable in relation to the prior quarter, reflecting the price changes since the start of 2018.
12 Average Revenue Per Household. Under IFRS15. See Section 3.2.
13 Average Revenue Per User
(EUR million)2017
IAS 18
2018
IAS 18
Change
%
2018
IFRS 15
2017
IAS 18
2018
IAS 18
Change
%
2018
IFRS 15
TOTAL SEGMENT INCOME 727 725 -0.2% 724 1,446 1,456 0.7% 1,454
Net Revenue 721 720 -0.2% 718 1,436 1,445 0.6% 1,443
Other Operating Income 5 5 2.7% 5 10 11 5.7% 11
Costs of materials and charges to revenues -175 -159 -9.1% -161 -348 -333 -4.3% -336
TOTAL SEGMENT DIRECT MARGIN 551 566 2.7% 563 1,098 1,122 2.2% 1,118
Direct margin % 75.9% 78.0% 2.2 p.p. 77.7% 75.9% 77.1% 1.2 p.p. 76.9%
2nd Quarter Year-to-date
Proximus’ Consumer segment posted for the second quarter 2018 fairly stable revenue of EUR 725
million, -0.2% year-on-year.
Revenue from Fixed services totaled EUR 381 million including Voice, Internet and TV, up by 1.3% from
the prior year. The main driver was a growing Internet and TV customer base and overall customer value
management, including upselling of services and some price changes.
In total, the consumer segment posted EUR 243 million revenue from Mobile services, with the year-on-
year trend sequentially improving to -1.4%. This was driven by a 1.4% increase in postpaid revenue, in
spite of RLAH still impacting the variance. This was however more than offset by the continued expansion
of Proximus’ postpaid customer base, uptiering and revamped mobile offers since mid-August 2017. In
contrast, revenue from prepaid continued to erode on a lower Prepaid base, in part driven by an active
migration to higher-value postpaid offers.
Contrary to the first quarter 2018, the second quarter revenue from the Consumer segment included a
year-on-year decline from (low-margin) mobile devices.
Proximus attracted yet again a solid 35,000 customers to its all-in offers Tuttimus/Bizz All-In, closing the
second quarter 2018 with 439,000 subscribers.
The Consumer revenue over the first half of 2018 totaled EUR 1,456 million, 0.7% above the same
period of 2017, mainly driven by higher revenue from Fixed Services.
Table 12:
Consumer revenue
and direct margin
Consumer 14
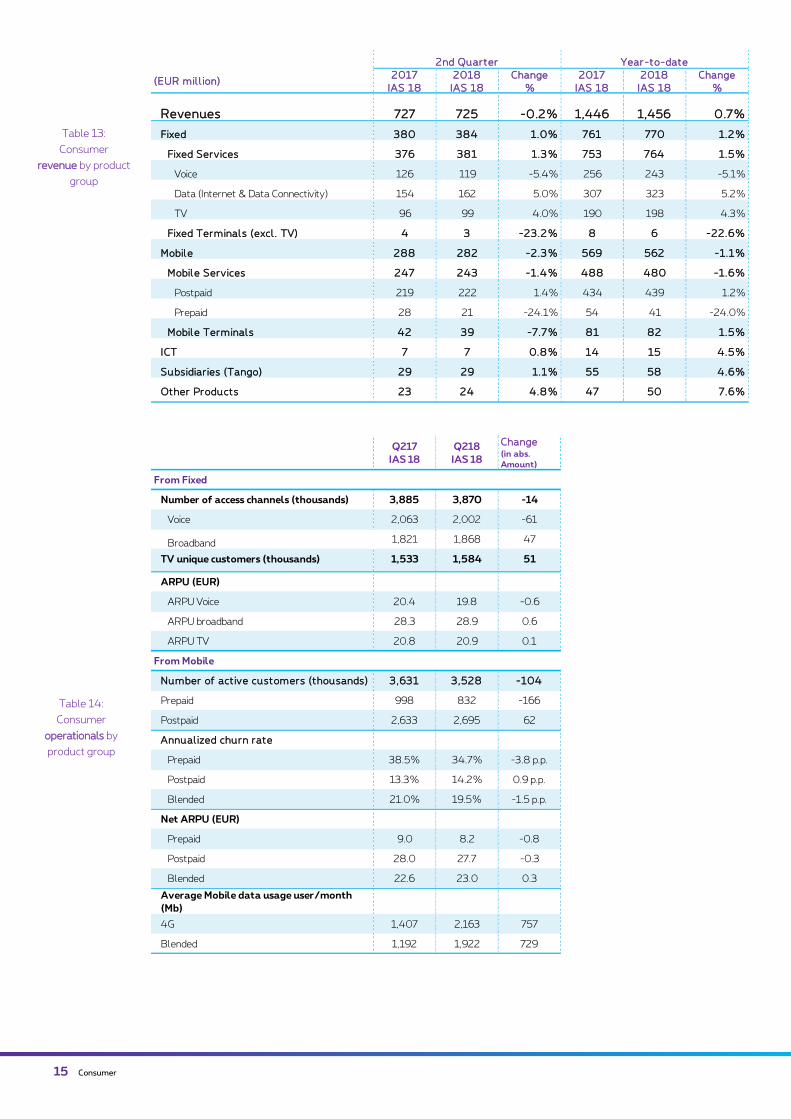
TV customer base grew by 9,000 households in the second quarter, +51,000 YoY In one year, the Proximus and Scarlet brands combined grew their TV customer base by 51,000 TV
households, or +3.3%, ending the second quarter of 2018 with 1,584,000 TV customers14. Proximus
attracted a net number of 9,000 customers on its TV platform in the second quarter, with TV ARPU
sequentially stable at EUR 20.9 and slightly up from the prior year (+0.4%). The growing TV subscriber
base remains an important revenue driver for the Consumer segment, with TV revenues up by 4.0% year-
on-year to total EUR 99 million for the second quarter of 2018.
The customer growth was well supported by the Proximus branded Tuttimus and Familus offers, providing
customers with more extensive TV content. Proximus continued to strengthen its entertainment offer
through a partnership with BeTV, and launched an innovative e-sports offer. Proximus also launched a
new content-centric mobile TV app, which gained good traction strengthened by the World Cup. Thereby
the Proximus TV offer was expanded and better responds to the desires of our customers.
Fixed Voice line erosion and lower traffic driving Fixed Voice revenue decline By end-June 2018 the total Fixed Voice customer base totaled 2,002,000, down -3.0% from one year
ago, including a net line loss of 17,000 in the second quarter of 2018.
The Fixed Voice ARPU for the second quarter of 2018 was EUR 19.8, i.e. a decline of 2.9% compared to the
previous year. This was due to an ongoing decline in the use of Voice traffic, partly offset by the 1 January
2018 price changes for single-play Fixed Voice.
A lower Fixed Voice customer base compared to a year ago, combined with a lower ARPU, resulted in a
-5.4% year-on-year revenue decline for Fixed Voice, reaching EUR 119 million in the second quarter of
2018.
Mobile Postpaid revenue up on growth in customer base; +32,000 cards in Q2. In total, the Mobile Services revenue of the Consumer segment totaled EUR 243 million for the second quarter
of 2018, or -1.4%. This included a continued growth for Postpaid services, with revenue up by 1.4%, in spite of
the RLAH headwinds (annualized 12 June 2018). The fading regulatory price impact was reflected in the EUR
27.7 Postpaid ARPU, with the year-on-year decrease sequentially improving to -1.2% for the second quarter
2018.
The regulatory price impact was more than offset by the increase in Proximus’ Consumer Postpaid base, up by
2.4% from the prior year, and by some uptiering and price changes. End-June 2018 the Postpaid base totaled
2,695,000 cards, 62,000 more compared to one year ago.
In a more competitive setting, the Mobile postpaid churn improved well from the prior quarters, remaining
slightly higher compared to one year back. Improved churn rates, combined with a successful mobile
marketing campaign around the Red Devils, led to solid growth of +32,000 Postpaid subscriptions in the
second quarter.
Over the same time period, the loss of Prepaid cards remained elevated, with the Prepaid base reduced by
-38,000, totaling 832,000 Prepaid cards end-June 2018. The continued erosion in an already declining
market, is partly driven by the strategy to migrate customers to similar Postpaid pricing plans, at higher value.
As a consequence, the combined Prepaid-Postpaid Mobile customer base totaled 3,528,000 Mobile cards end-
June 2018, with a blended mobile ARPU of EUR 23.0, up 1.4% from a year ago due to a better customer mix.
The Mobile “joint offers” further improved smartphone penetration, which rose to 75%, leading to an increase in
overall data usage. The blended monthly national data usage went up by 61% to an average of 1.9 GB,
strengthened by the Football World Cup.
Tango revenue15 Despite aggressive competitive market conditions and the application of the RLAH legislation, Tango
improved its consumer revenue by 1.1% to EUR 29 million for the second quarter 2018. This was driven by
a steady growth in its mobile base, and the successful execution of its convergence strategy with FttH
driving an increase in broadband revenue. Compared to prior quarters, the revenue uplift was more limited
with a 2017 price increase of the mobile portfolio annualizing.
14 Referring households and small-offices, not including multiple settop boxes
15 A minor change has been applied to the split of Tango’s revenue between the Consumer and Enterprise segments. The 2017 figures have been restated accordingly.
15 Consumer
(EUR mil l ion)2017
IAS 18
2018
IAS 18
Change
%
2017
IAS 18
2018
IAS 18
Change
%
Revenues 727 725 -0.2% 1,446 1,456 0.7%
Fixed 380 384 1.0% 761 770 1.2%
Fixed Serv ices 376 381 1.3% 753 764 1.5%
Voice 126 119 -5.4% 256 243 -5.1%
Data (Internet & Data Connectivity) 154 162 5.0% 307 323 5.2%
TV 96 99 4.0% 190 198 4.3%
Fixed Terminal s (excl . TV) 4 3 -23.2% 8 6 -22.6%
Mobil e 288 282 -2.3% 569 562 -1.1%
Mobil e Serv ices 247 243 -1.4% 488 480 -1.6%
Postpaid 219 222 1.4% 434 439 1.2%
Prepaid 28 21 -24.1% 54 41 -24.0%
Mobil e Terminal s 42 39 -7.7% 81 82 1.5%
ICT 7 7 0.8% 14 15 4.5%
Subsidiar ies (Tango) 29 29 1.1% 55 58 4.6%
Other Products 23 24 4.8% 47 50 7.6%Of which Installation & Activation 4 4 -8.5% 7 8 4.3%
2nd Quarter Year-to-date
Q217
IAS 18
Q218
IAS 18
Change (in abs.
Amount)
From Fixed
Number of access channels (thousands) 3,885 3,870 -14
Voice 2,063 2,002 -61
Broadband 1,821 1,868 47
TV unique customers (thousands) 1,533 1,584 51
ARPU (EUR)
ARPU Voice 20.4 19.8 -0.6
ARPU broadband 28.3 28.9 0.6
ARPU TV 20.8 20.9 0.1
From Mobile
Number of act ive customers (thousands) 3,631 3,528 -104
Prepaid 998 832 -166
Postpaid 2,633 2,695 62
Annual ized churn rate
Prepaid 38.5% 34.7% -3.8 p.p.
Postpaid 13.3% 14.2% 0.9 p.p.
Blended 21.0% 19.5% -1.5 p.p.
Net ARPU (EUR)
Prepaid 9.0 8.2 -0.8
Postpaid 28.0 27.7 -0.3
Blended 22.6 23.0 0.3
Average Mobile data usage user/month
(Mb)
4G 1,407 2,163 757
Blended 1,192 1,922 729
Table 14:
Consumer
operationals by
product group
Table 13:
Consumer
revenue by product
group

Consumer 16
The X-Play reporting provides a view on the progress of Proximus’ convergence strategy by reporting on Consumer
revenue and ARPU per Household/Small Office (ARPH HH/SO). The figures provided below are all under IFRS 15, with
a 2017 pro-forma comparison. For the Consumer reporting the main implication of applying IFRS 15 is related to
mobile joint-offers. Under IFRS 15, more revenue is allocated to “Terminals sales”, and less to the “X-play” revenue,
which represents the revenue retrieved from services. This is also reflected in the derived ARPH.
The application of GDPR16 has led to a limited impact on the reported household data for the Consumer segment with
some information no longer being available to define the composition of households. To ease comparison, the data of
the 5 prior quarters has been adjusted accordingly, assuming a stable impact of GDPR over this period. Therefore, the
total HH/SO serviced by Proximus increased (increase in 1-Play mobile and a limited reduction of 4-Play households).
The derived KPI’s such as ARPH and RGU have been restated as well.
Table 15: Consumer revenue by X-Play (IFRS 15)
*Unaudited company estimates of what 2017 would have been when applying IFRS 15 and GDPR, provided for information
Under IFRS15, the Consumer segment posted EUR 724 million revenue for the second quarter of 2018, a
1.4% decline from the prior year. While the revenue from X-Play remained stable at EUR 589 million,
revenue from Mobile terminals decreased. The second quarter 2017 included a higher mobile joint-offers
impact, which had especially a positive effect on revenue from “terminals sales".
Proximus increased its total base of Households/Small Office by + 2,000 in the second quarter 2018,
servicing end-June 2,979,000 HH/SO, and further improved its customer mix, with an increasing number
of its customers on 4-Play (see table 16). Over the past 12 months, the total household base ended
19,000 lower, mainly due to a lower single-play Fixed Voice base (-44,000).
Successful upselling led to an increase in the overall RGUs, up by 2.1% from the prior year, to reach 2.73.
This more than offset RLAH headwinds, and the erosion in Fixed Voice traffic, resulting in a 0.8% growth
in ARPH to EUR 66.2 for the second quarter. The overall annualized full churn rate for the second quarter
of 11.9% improved from prior quarters, for all Plays, and was only slightly up 0.4pp from one year ago.
16 General Data Protection Regulation. EU law enforced since 25 May 2018
(EUR mil l ion)
2017
IFRS15
(pro forma)
2018
IFRS15
Change
%
2017
IFRS15
(pro forma)
2018
IFRS15
Change
%
Revenues (underl y ing) 734 724 -1.4% 1,454 1,454 0.0%
Net Revenue (underl y ing) 729 718 -1.4% 1,443 1,443 0.0%
X-Pl ay Revenues 589 589 -0.1% 1,173 1,177 0.4%
4-Pl ay 220 236 7.2% 431 467 8.4%
3-Pl ay 172 166 -3.4% 346 334 -3.4%
Convergent 85 82 -3.7% 171 164 -4.2%
Fixed 87 84 -3.0% 174 170 -2.6%
2-Pl ay 74 70 -5.2% 150 143 -5.0%
Convergent 21 20 -6.5% 43 40 -6.7%
Fixed 53 50 -4.6% 107 102 -4.3%
1-Pl ay 123 116 -5.3% 246 233 -5.1%
1P Fixed Voice 26 24 -10.5% 54 49 -9.9%
1P internet 12 13 12.2% 24 27 11.7%
1P Mobile 84 79 -6.2% 168 158 -5.9%
Prepaid 28 21 -24.1% 54 41 -24.0%
Terminal s sal es 49 45 -8.5% 96 97 1.0%
Tango 28 28 -1.0% 55 56 2.3%
Other net revenues 34 35 2.9% 66 72 9.5%
Other operat ing Income (underl y ing) 5 5 2.7% 10 11 5.7%
2nd Quarter Year-to-date
Upselling increases
overall value per
HH/SO.
ARPH +0.8% YoY
+2,000 HH/SO
in Q2 2018
17 Consumer
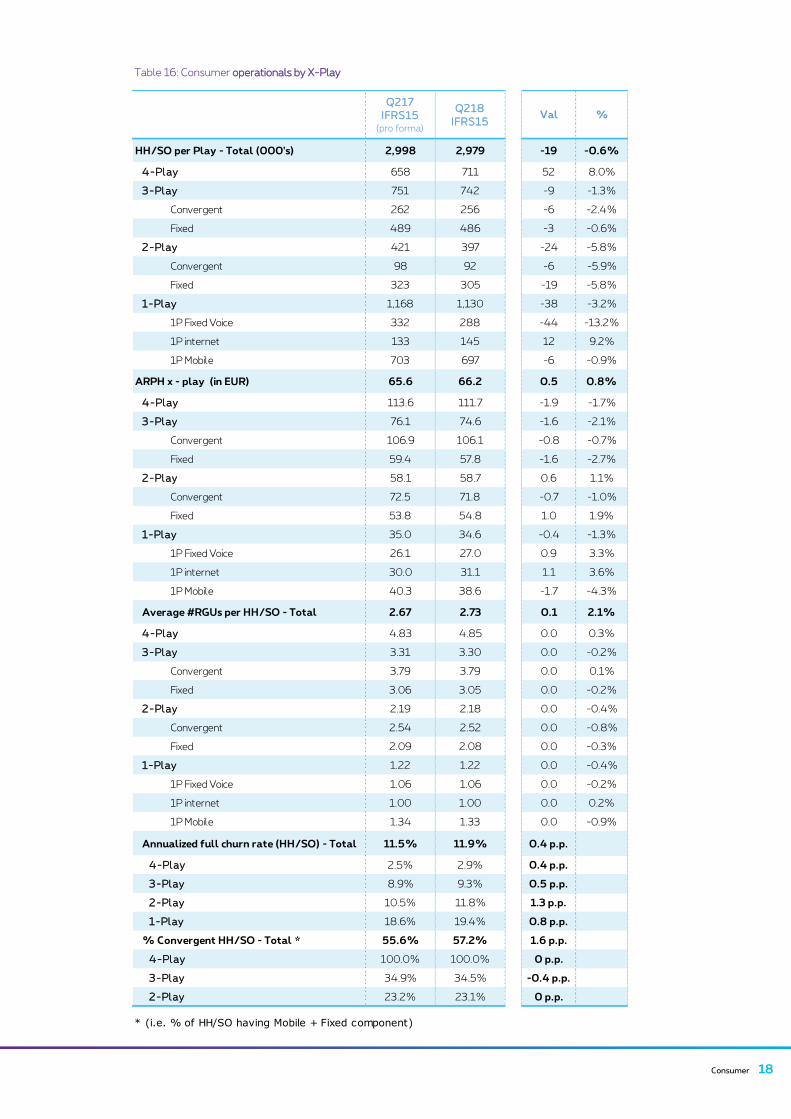
The success of the Proximus all-in offers Tuttimus and Bizz all-in resulted in another solid year-on-year
revenue increase by 7.2% for 4-Play HH/SO. By end-June 2018, Proximus serviced 711,000 4-Play
HH/SO, i.e. 24% of its total base. Over the past twelve months, 52,000 4-Play HH/SO were added,
+8.0%, including a net 4-Play HH/SO growth of + 13,000 in the second quarter 2018. The second-
quarter 2018 ARPH of a 4-Play HH/SO stood at EUR 111.7, -1.7% from the prior year, including the
regulatory pressure on Mobile roaming and lower Fixed Voice traffic. On average, a 4- Play HH/SO
counted 4.85 RGUs, with an annualized full-churn level of 2.9%.
With Proximus mainly upselling to 4-Play, the number of customers on a 2-Play of 3-Play decreases.
Within the mix, the number of 3-Play HH/SO with only Fixed services was down by -3,000 in the second
quarter, including the TRIO offer of Scarlet. The ongoing erosion of Fixed voice traffic, and the general
move to Packs, explains the lower 3-Play Fixed ARPH of EUR 57.8. The number of convergent 3-Play
HH/SO decreased in the quarter by 1,000, including the upselling to Tuttimus/Bizz all-in. The
Convergent 3-Play ARPH was down by -0.7% to EUR 106.1, with the roaming regulation impact more
than offsetting the more for more price changes.
The Single Play HH/SO base decreased by -2,000 over the second quarter 2018 due to a lower 1-Play
Fixed Voice base, -11,000 in the quarter. As a consequence, the erosion of revenue from standalone Fixed
Voice continued and totaled for the second quarter EUR 24 million, representing 3.3% of the total
Consumer revenue.
With 1-Play mobile HH/SO at 697,000 end-June 2018, the base increased by 7,000 over the second
quarter 2018. The single-Play Mobile ARPH was at EUR 38.6 for the second quarter 2018, i.e. a year-on-
year decrease of -4.3%, including the impact from the RLAH regulation. These impacts were in part offset
by the more-for-more price change in August 2017, and by uptiering of Mobile subscriptions.
Proximus’ single-Play Internet HH/SO base increased to 145,000. Over the second quarter 2018
+2,000 1-Play Internet HH/SO were added, including the effect of Scarlet’s successful standalone
broadband offers. The corresponding ARPH of EUR 31.1 was up 3.6% from the prior year, including the
price increase of the Proximus standalone broadband offers.
Direct margin up driven by growing customer base and one-off tailwinds. The Consumer segment posted for the second quarter 2018 a solid year-on-year direct margin growth
of 2.7%, totaling EUR 566 million. About half of the EUR 15 million direct margin increase was driven by
the enlarging customer base for Fixed and Mobile postpaid, further supported by price changes (July 2017,
January 2018 and the August 2017 more-for-more price adjustment for mobile), and by a better
acquisition cost. The other half of the direct margin increase was driven by some one-off tailwinds,
including a significant benefit following the renegotiation of various supplier contracts.
In spite of the RLAH impact, the Consumer direct margin over the first half of 2018 grew by 2.2% to
EUR 1,122 million, or EUR 24 million above that of the comparable period of 2017. This resulted from the
growing customer base, with improved mix, and the benefit from price changes. Moreover, the first half of
2018 was supported by some substantial one-off tailwinds.
4-Play
revenue +7.2% YoY.
Growing base to
711,000 HH/SO.
ARPH of EUR 112
Upselling strategy
leads to lower 2-
Play and 3-Play.
.
RLAH impact partly
offset by Mobile price
changes and
uptiering.
Consumer 18
Table 16: Consumer operationals by X-Play
Q217
IFRS15 (pro forma)
Q218
IFRS15 Val %
HH/SO per Play - Total (000's) 2,998 2,979 -19 -0.6%
4-Pl ay 658 711 52 8.0%
3-Pl ay 751 742 -9 -1.3%
Convergent 262 256 -6 -2.4%
Fixed 489 486 -3 -0.6%
2-Pl ay 421 397 -24 -5.8%
Convergent 98 92 -6 -5.9%
Fixed 323 305 -19 -5.8%
1-Pl ay 1,168 1,130 -38 -3.2%
1P Fixed Voice 332 288 -44 -13.2%
1P internet 133 145 12 9.2%
1P Mobile 703 697 -6 -0.9%
ARPH x - play (in EUR) 65.6 66.2 0.5 0.8%
4-Pl ay 113.6 111.7 -1.9 -1.7%
3-Pl ay 76.1 74.6 -1.6 -2.1%
Convergent 106.9 106.1 -0.8 -0.7%
Fixed 59.4 57.8 -1.6 -2.7%
2-Pl ay 58.1 58.7 0.6 1.1%
Convergent 72.5 71.8 -0.7 -1.0%
Fixed 53.8 54.8 1.0 1.9%
1-Pl ay 35.0 34.6 -0.4 -1.3%
1P Fixed Voice 26.1 27.0 0.9 3.3%
1P internet 30.0 31.1 1.1 3.6%
1P Mobile 40.3 38.6 -1.7 -4.3%
Average #RGUs per HH/SO - Total 2.67 2.73 0.1 2.1%
4-Pl ay 4.83 4.85 0.0 0.3%
3-Pl ay 3.31 3.30 0.0 -0.2%
Convergent 3.79 3.79 0.0 0.1%
Fixed 3.06 3.05 0.0 -0.2%
2-Pl ay 2.19 2.18 0.0 -0.4%
Convergent 2.54 2.52 0.0 -0.8%
Fixed 2.09 2.08 0.0 -0.3%
1-Pl ay 1.22 1.22 0.0 -0.4%
1P Fixed Voice 1.06 1.06 0.0 -0.2%
1P internet 1.00 1.00 0.0 0.2%
1P Mobile 1.34 1.33 0.0 -0.9%
Annualized full churn rate (HH/SO) - Total 11.5% 11.9% 0.4 p.p.
4-Pl ay 2.5% 2.9% 0.4 p.p.
3-Pl ay 8.9% 9.3% 0.5 p.p.
2-Pl ay 10.5% 11.8% 1.3 p.p.
1-Pl ay 18.6% 19.4% 0.8 p.p.
% Convergent HH/SO - Total * 55.6% 57.2% 1.6 p.p.
4-Pl ay 100.0% 100.0% 0 p.p.
3-Pl ay 34.9% 34.5% -0.4 p.p.
2-Pl ay 23.2% 23.1% 0 p.p.
* (i.e. % of HH/SO having Mobile + Fixed component)
19 Enterprise
Enterprise
Table 17: Enterprise revenue and direct margin
17 Definition see Section 8.4
18 Call Connect solutions
(EUR million)2017
IAS 18
2018
IAS 18
Change
%
2018
IFRS 15
2017
IAS 18
2018
IAS 18
Change
%
2018
IFRS 15
TOTAL SEGMENT INCOME 343 351 2.4% 351 691 702 1.6% 702
Net Revenue 341 350 2.8% 350 687 700 1.9% 700
Other Operating Income 2 1 -63.9% 1 4 2 -42.7% 2
Costs of materials and charges to revenues -104 -112 8.0% -113 -215 -227 5.7% -228
TOTAL SEGMENT DIRECT MARGIN 239 239 0.0% 238 477 476 -0.2% 475
Direct margin % 69.7% 68.0% -1.7 p.p. 67.9% 69.0% 67.7% -1.2 p.p. 67.6%
2nd Quarter Year-to-date
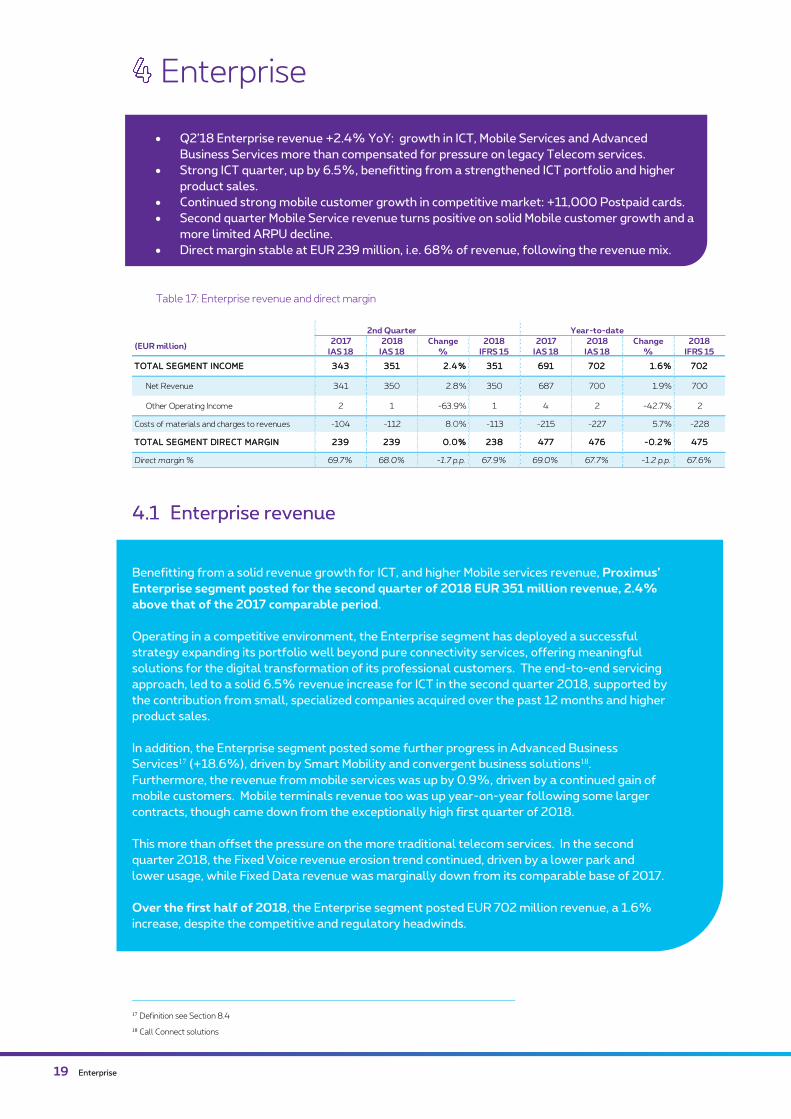
• Q2’18 Enterprise revenue +2.4% YoY: growth in ICT, Mobile Services and Advanced
Business Services more than compensated for pressure on legacy Telecom services.
• Strong ICT quarter, up by 6.5%, benefitting from a strengthened ICT portfolio and higher
product sales.
• Continued strong mobile customer growth in competitive market: +11,000 Postpaid cards.
• Second quarter Mobile Service revenue turns positive on solid Mobile customer growth and a
more limited ARPU decline.
• Direct margin stable at EUR 239 million, i.e. 68% of revenue, following the revenue mix.
Benefitting from a solid revenue growth for ICT, and higher Mobile services revenue, Proximus’
Enterprise segment posted for the second quarter of 2018 EUR 351 million revenue, 2.4%
above that of the 2017 comparable period.
Operating in a competitive environment, the Enterprise segment has deployed a successful
strategy expanding its portfolio well beyond pure connectivity services, offering meaningful
solutions for the digital transformation of its professional customers. The end-to-end servicing
approach, led to a solid 6.5% revenue increase for ICT in the second quarter 2018, supported by
the contribution from small, specialized companies acquired over the past 12 months and higher
product sales.
In addition, the Enterprise segment posted some further progress in Advanced Business
Services17 (+18.6%), driven by Smart Mobility and convergent business solutions18.
Furthermore, the revenue from mobile services was up by 0.9%, driven by a continued gain of
mobile customers. Mobile terminals revenue too was up year-on-year following some larger
contracts, though came down from the exceptionally high first quarter of 2018.
This more than offset the pressure on the more traditional telecom services. In the second
quarter 2018, the Fixed Voice revenue erosion trend continued, driven by a lower park and
lower usage, while Fixed Data revenue was marginally down from its comparable base of 2017.
Over the first half of 2018, the Enterprise segment posted EUR 702 million revenue, a 1.6%
increase, despite the competitive and regulatory headwinds.

Enterprise 20
Lower Fixed Voice revenue on line erosion and lower usage
The Enterprise segment posted EUR 51 million in Fixed Voice revenue for the second quarter of 2018,
showing a year-on-year decline of 7.3%. The Enterprise segment faces an ongoing rationalization by
customers on Fixed line connections, lower usage, technology migrations to VoIP and competitive
pressure. The line loss in the second quarter was limited to -8,000, bringing the Enterprise total Fixed
Voice Line base to 559,000 at end-June 2018, i.e. a year-on-year line loss of -6.6%. The Fixed Voice
ARPU of EUR 30.3 ended 0.6% below that of the previous year, with the decrease in traffic per line and a
higher penetration of unlimited call options for a large part compensated for by some price indexations
since 1 January 2018.
Ongoing migration of legacy Data products to new solutions at more attractive pricing. Internet
customer base maintained fairly stable at 133,000 in competitive environment.
The second-quarter 2018 revenue from Fixed Data totaled EUR 62 million, i.e. nearly stable in relation
to last year (-0.4%).
For Data Connectivity, by far the largest part in this product category, Proximus posted a fairly steady
revenue. The Enterprise segment continued to migrate customers to Proximus’ VPN flagship ‘Explore’,
benefitting from the further roll-out of P2P fiber, while legacy products are being outphased and migrated
in the context of simplification programs, offering customers new solutions at more attractive pricing.
The Enterprise segment continues to face high competition on the low and medium Internet markets.
Nonetheless, Proximus managed to mitigate its net line loss to -1,000 Internet lines for the second
quarter 2018, bringing the total to 133,000 by end-June 2018, or a 2.6% decrease from one year back.
The lower Internet base was partly compensated for by a 0.6% increase in Broadband ARPU to EUR 43.5,
supported by price indexation effects.
ICT revenue of EUR 129 million, up by 6.5% In the second quarter 2018, Proximus’ Enterprise segment posted higher revenue from Security and
Outsourcing services, including growing recurring services, as well as higher revenue from products.
Furthermore, the Enterprise segment benefitted from its strengthened ICT portfolio. Over the past year,
Proximus has acquired some small-sized but highly specialized companies19, supporting the cornerstone of
Proximus' strategy to help its enterprise customers in their digital transformation journey. The acquired
skills are highly complementary to Proximus’ established leadership in network connectivity, IT and
managed services. This contributed to a solid 6.5% revenue increase for ICT, totaling EUR 129 million.
Continued solid customer growth drives 0.9% increase in Mobile Services revenue For the second quarter of 2018, the Enterprise segment posted Mobile Services revenue of EUR 80
million, up by 0.9% from the previous year.
The Enterprise segment closed a strong second quarter in terms of customer acquisition, +11,000 Mobile
Voice cards, leading to a further growing Mobile customer base. The net growth in the Mobile Voice
customer base remains supported by a low Mobile churn, improving further to 8.9% in the second quarter
2018, in a highly competitive market.
The good customer experience provided by Proximus’ mobile network and service levels is supportive to
the growing customer base, increasing by 4.7% in a one-year period (M2M cards excluded), and reaching
1,010,000 cards. Besides the growing mobile customer base, the mobile revenue also benefits from the
growing data usage per customer.
The benefit from the customer growth was only partly offset by a lower Postpaid ARPU of EUR 25.5. For
the second quarter 2018, the year-on-year ARPU decrease improved to -4.1%, after an exceptionally low
first quarter. With regulatory price pressure from RLAH annualizing mid-June, the negative impact is
limited to the ongoing decrease in subscriptions for Roaming Options. Moreover, the second-quarter
national ARPU was positively impacted by increasing data usage. For the second quarter 2018, the
average national data usage reached 1.7 GB/user/month, up by 48% compared to a year ago.
19 Umbrio, Dutch IT & network operations company acquired by Proximus on 31 May 2018; ION-IP, a Dutch company specialized in Managed Security services, acquired
on 27 March 2018; Unbrace, an application development company on 1 October 2017; and Davinsi Labs, a cybersecurity company acquired 4 May 2017.

21 Enterprise
Proximus’ Enterprise segment maintained its leadership position on the M2M market. Over the second
quarter of 2018, a net amount of 18,000 M2M cards were added, bringing the total number of M2M cards
to 1,241,000 at end-June 2018, or a year-on-year growth of 4.3%.
Table 18: Enterprise revenue by product group under IAS 18 (reference table for variances explanations)
Table 19: Enterprise revenue by product group under IFRS 15
Unaudited company estimates of what 2017 would have been when applying IFRS 15, provided for information.
(EUR mil l ion)2017
IAS 18
2018
IAS 18
Change
%
2017
IAS 18
2018
IAS 18
Change
%
Revenues 343 351 2.4% 691 702 1.6%
Fixed 122 118 -3.7% 246 237 -3.8%
Fixed Serv ices 118 113 -3.6% 237 228 -3.8%
Voice 55 51 -7.3% 113 105 -7.2%
Data (Internet & Data Connectivity) 62 62 -0.4% 124 123 -0.6%
Fixed Terminal s (excl . TV) 5 5 -4.2% 10 9 -4.1%
Mobil e 85 89 5.1% 170 179 5.4%
Mobil e Serv ices 79 80 0.9% 158 157 -0.9%
Mobil e Terminal s 5 9 66.7% 12 22 90.8%
ICT 121 129 6.5% 247 256 3.7%
Advanced Business Serv ices 6 7 18.6% 12 14 13.1%
Subsidiar ies (Tango) 4 4 2.1% 8 9 12.3%
Other Products 4 3 -18.0% 8 7 -6.5%
2nd Quarter Year-to-date
(EUR mil l ion)2017
IFRS 15
2017
IFRS 15 (pro forma) (pro forma)
Revenues (underl y ing) 343 351 2.4% 691 702 1.6%
Net Revenue (underl y ing)341 350 2.8% 687 700 1.8%
Fixed 122 118 -3.7% 246 237 -3.8%
Fixed Serv ices 118 113 -3.6% 237 228 -3.8%
Voice 55 51 -7.3% 113 105 -7.2%
Data (Internet & Data Connectivity) 62 62 -0.4% 124 123 -0.6%
Fixed Terminal s (excl . TV) 5 5 -4.2% 10 9 -4.1%
Mobil e 85 89 5.1% 170 179 5.4%
Mobil e Serv ices 79 80 0.9% 158 157 -0.9%
Mobil e Terminal s 6 9 65.0% 12 22 89.7%
ICT 121 130 7.2% 246 256 4.1%
Advanced Business Serv ices 6 7 18.8% 12 14 14.5%
Subsidiar ies (Tango) 4 4 -2.7% 8 9 9.0%
Other Products 3 2 -6.1% 5 5 5.5%
Other Operat ing Income2 1 -63.9% 4 2 -42.7%
2nd Quarter Year-to-date
2018
IFRS 15
2018
IFRS 15
Change
%
Change
%
Enterprise 22
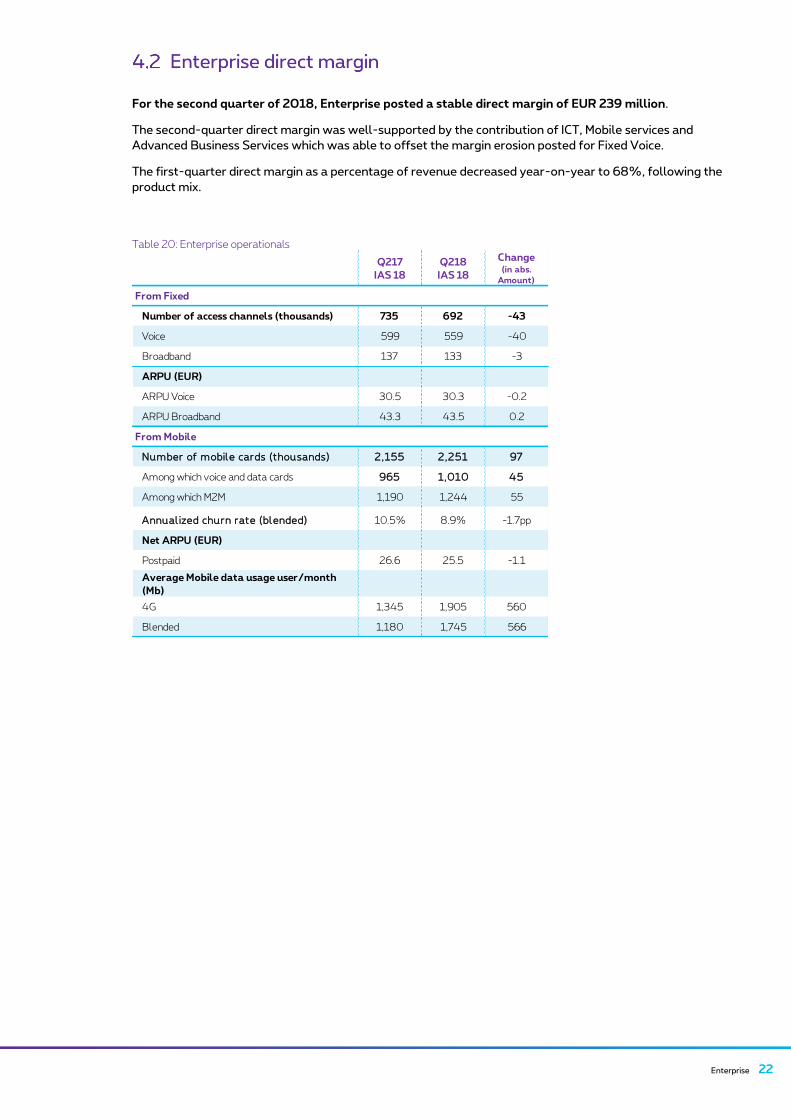
For the second quarter of 2018, Enterprise posted a stable direct margin of EUR 239 million.
The second-quarter direct margin was well-supported by the contribution of ICT, Mobile services and
Advanced Business Services which was able to offset the margin erosion posted for Fixed Voice.
The first-quarter direct margin as a percentage of revenue decreased year-on-year to 68%, following the
product mix.
Table 20: Enterprise operationals
Q217
IAS 18
Q218
IAS 18
Change (in abs.
Amount)
From Fixed
Number of access channels (thousands) 735 692 -43
Voice 599 559 -40
Broadband 137 133 -3
ARPU (EUR)
ARPU Voice 30.5 30.3 -0.2
ARPU Broadband 43.3 43.5 0.2
From Mobile
Number of mobil e cards (thousands) 2,155 2,251 97
Among which voice and data cards 965 1,010 45
Among which M2M 1,190 1,244 55
Annual ized churn rate (bl ended) 10.5% 8.9% -1.7pp
Net ARPU (EUR)
Postpaid 26.6 25.5 -1.1
Average Mobile data usage user/month
(Mb)
4G 1,345 1,905 560
Blended 1,180 1,745 566

23 Wholesale & BICS
Wholesale
Table 21: Wholesale revenue and direct margin
Proximus’ Wholesale segment reported EUR 50 million in revenue and a direct margin of EUR 41 million
for the second quarter of 2018. Wholesale revenue was up year-on-year by 4.0% with the revenue
increase related to higher visitor roaming traffic only slightly offset by a decline in traditional Wholesale
services. The Direct margin remained fairly stable. Contrary to the first quarter, the year-on-year
variance was not affected by Fixed Termination Rates impacts.
BICS (International Carrier Services)
Table 22: BICS P&L
(EUR million)2017
IAS 18
2018
IAS 18
Change
%
2017
IAS 18
2018
IAS 18
Change
%
TOTAL SEGMENT INCOME 48 50 4.0% 100 97 -2.6%
Net Revenue 48 50 3.9% 100 97 -2.7%
Other Operating Income 0 0 NR 0 0 NR
Costs of materials and charges to revenues -7 -9 31.9% -14 -16 14.1%
TOTAL SEGMENT DIRECT MARGIN 41 41 -0.5% 86 82 -5.3%
Direct margin % 86.2% 82.5% -3.7 p.p. 86.3% 83.9% -2.4 p.p.
2nd Quarter Year-to-date
(EUR million)2017
IAS 18
2018
IAS 18
Change
%
2017
IAS 18
2018
IAS 18
Change
%
TOTAL SEGMENT INCOME 312 340 8.9% 645 659 2.3%
Net Revenue 312 341 9.2% 644 659 2.4%
Other Operating Income 0 0 NR 1 0 NR
Costs of materials and charges to revenues -245 -261 6.2% -513 -503 -1.9%
TOTAL SEGMENT DIRECT MARGIN 67 79 18.5% 132 156 18.7%
Direct margin % 21.5% 23.4% 1.9 p.p. 20.4% 23.7% 3.3 p.p.
TOTAL EXPENSES -33 -41 24.6% -64 -83 28.9%
Workforce expenses -17 -23 34.9% -35 -46 31.9%
Non Workforce expenses -16 -18 13.2% -29 -37 25.2%
TOTAL SEGMENT RESULT 34 39 12.7% 67 74 9.0%
Segment contribution margin 11.0% 11.4% 0.4 p.p. 10.5% 11.2% 0.7 p.p.
2nd Quarter Year-to-date
• Steep growth in SMS A2P volumes, strongly supported by TeleSign’s consolidation which
accelerates BICS’ strategic ambitions in this growing market.
• Voice volumes slightly up YoY, breaking the declining trend from the past 4 quarters.
• Q2’18 direct margin +18.5% YoY, TeleSign contribution and synergies increasing Direct
margin to 23.4% of revenue.
• Q2’18 Segment result up by 12.7% YoY, Segment contribution margin of 11.4%; +0.4pp
YoY.
BICS 24
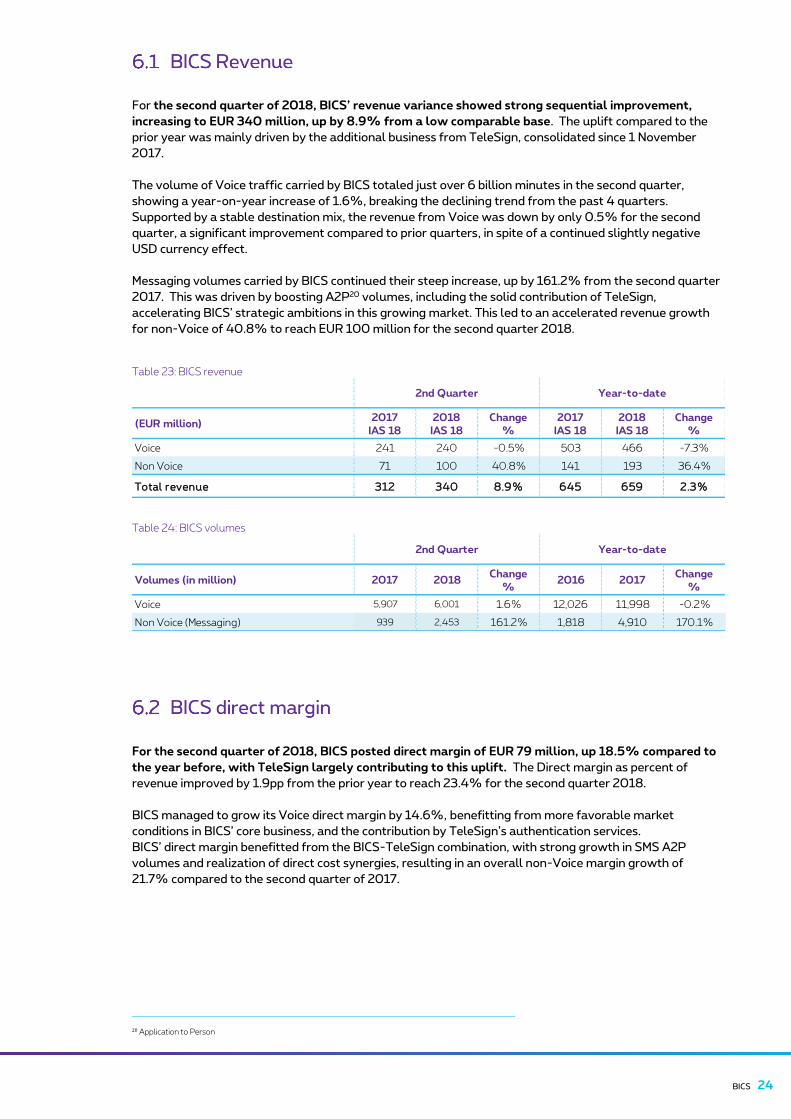
For the second quarter of 2018, BICS’ revenue variance showed strong sequential improvement,
increasing to EUR 340 million, up by 8.9% from a low comparable base. The uplift compared to the
prior year was mainly driven by the additional business from TeleSign, consolidated since 1 November
2017.
The volume of Voice traffic carried by BICS totaled just over 6 billion minutes in the second quarter,
showing a year-on-year increase of 1.6%, breaking the declining trend from the past 4 quarters.
Supported by a stable destination mix, the revenue from Voice was down by only 0.5% for the second
quarter, a significant improvement compared to prior quarters, in spite of a continued slightly negative
USD currency effect.
Messaging volumes carried by BICS continued their steep increase, up by 161.2% from the second quarter
2017. This was driven by boosting A2P20 volumes, including the solid contribution of TeleSign,
accelerating BICS’ strategic ambitions in this growing market. This led to an accelerated revenue growth
for non-Voice of 40.8% to reach EUR 100 million for the second quarter 2018.
Table 23: BICS revenue
Table 24: BICS volumes
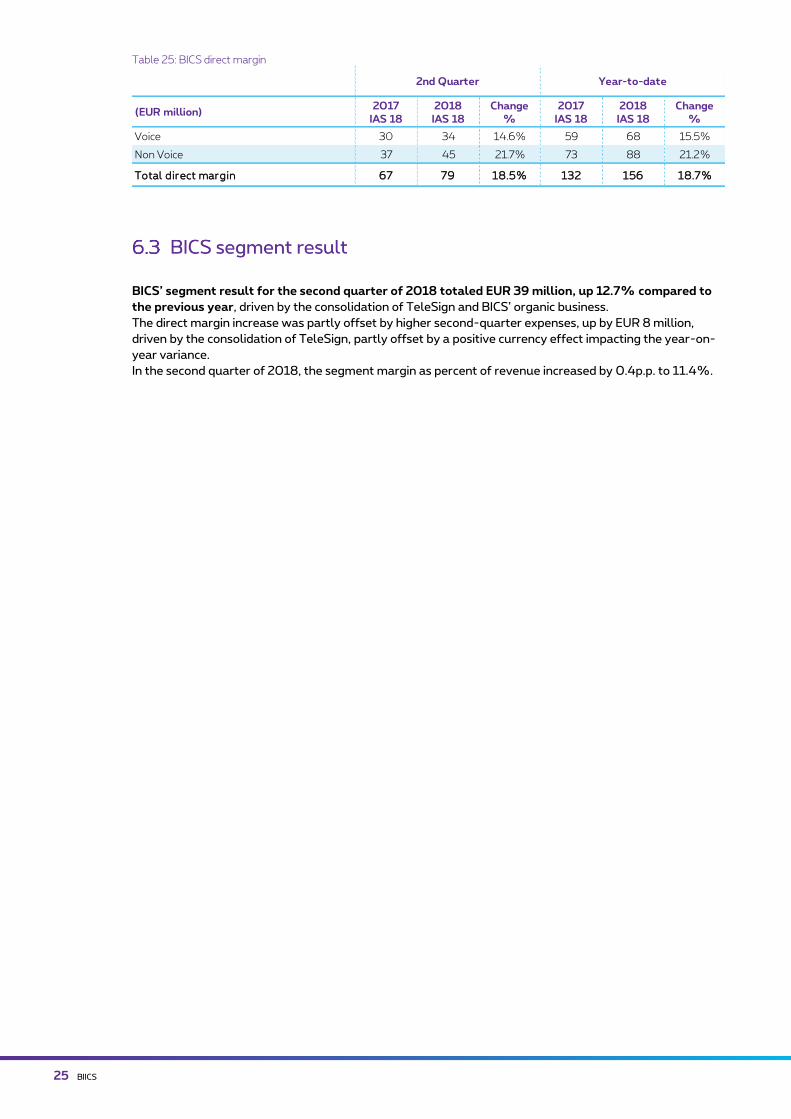
For the second quarter of 2018, BICS posted direct margin of EUR 79 million, up 18.5% compared to
the year before, with TeleSign largely contributing to this uplift. The Direct margin as percent of
revenue improved by 1.9pp from the prior year to reach 23.4% for the second quarter 2018.
BICS managed to grow its Voice direct margin by 14.6%, benefitting from more favorable market
conditions in BICS’ core business, and the contribution by TeleSign’s authentication services.
BICS’ direct margin benefitted from the BICS-TeleSign combination, with strong growth in SMS A2P
volumes and realization of direct cost synergies, resulting in an overall non-Voice margin growth of
21.7% compared to the second quarter of 2017.
20 Application to Person
(EUR million)2017
IAS 18
2018
IAS 18
Change
%
2017
IAS 18
2018
IAS 18
Change
%
Voice 241 240 -0.5% 503 466 -7.3%
Non Voice 71 100 40.8% 141 193 36.4%
Total revenue 312 340 8.9% 645 659 2.3%
2nd Quarter Year-to-date
Volumes (in million) 2017 2018Change
%2016 2017
Change
%
Voice 5,907 6,001 1.6% 12,026 11,998 -0.2%
Non Voice (Messaging) 939 2,453 161.2% 1,818 4,910 170.1%
2nd Quarter Year-to-date
25 BIICS
Table 25: BICS direct margin
BICS’ segment result for the second quarter of 2018 totaled EUR 39 million, up 12.7% compared to
the previous year, driven by the consolidation of TeleSign and BICS’ organic business.
The direct margin increase was partly offset by higher second-quarter expenses, up by EUR 8 million,
driven by the consolidation of TeleSign, partly offset by a positive currency effect impacting the year-on-
year variance.
In the second quarter of 2018, the segment margin as percent of revenue increased by 0.4p.p. to 11.4%.
(EUR million)2017
IAS 18
2018
IAS 18
Change
%
2017
IAS 18
2018
IAS 18
Change
%
Voice 30 34 14.6% 59 68 15.5%
Non Voice 37 45 21.7% 73 88 21.2%
Total direct margin 67 79 18.5% 132 156 18.7%
2nd Quarter Year-to-date
Condensed consolidated financial statements & Additional information 26
Condensed interim consolidated financial statements
The condensed interim consolidated financial statements have been prepared in accordance with the
International Financial Reporting Standards (IFRS) as adopted for use in the European Union. Cumulative half
year figures have been subject to a limited review by the independent auditor.
The accounting policies and methods of the Group used as of 2018 are consistent with those applied in the 31
December 2017 consolidated financial statements, with the exception that the Group applied the new standards,
interpretations and revisions that become mandatory for the Group on 1 January 2018.
As from 1 January 2018 the Group adopted IFRS 15 and 9 which resulted in the changes in accounting policies
described below.
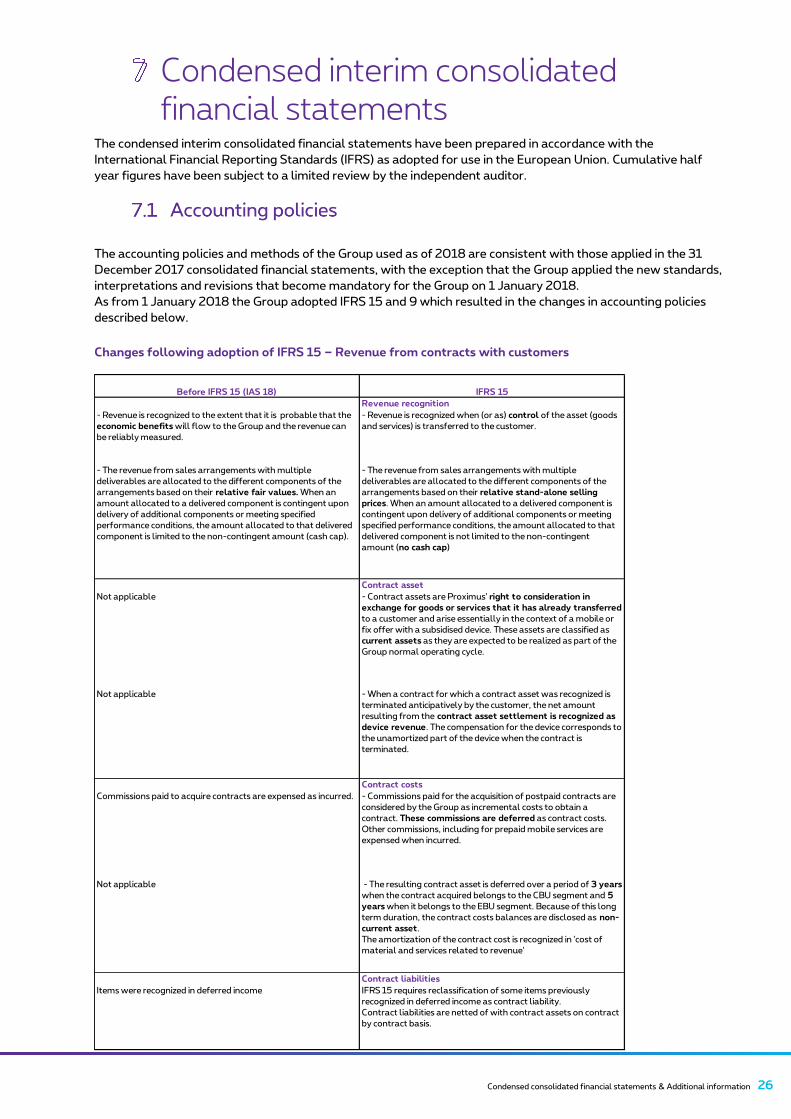
Changes following adoption of IFRS 15 – Revenue from contracts with customers
Before IFRS 15 (IAS 18) IFRS 15
Revenue recognition
- Revenue is recognized to the extent that it is probable that the
economic benefits will flow to the Group and the revenue can
be reliably measured.
- Revenue is recognized when (or as) control of the asset (goods
and services) is transferred to the customer.
- The revenue from sales arrangements with multiple
deliverables are allocated to the different components of the
arrangements based on their relative fair values. When an
amount allocated to a delivered component is contingent upon
delivery of additional components or meeting specified
performance conditions, the amount allocated to that delivered
component is limited to the non-contingent amount (cash cap).
- The revenue from sales arrangements with multiple
deliverables are allocated to the different components of the
arrangements based on their relative stand-alone selling
prices. When an amount allocated to a delivered component is
contingent upon delivery of additional components or meeting
specified performance conditions, the amount allocated to that
delivered component is not limited to the non-contingent
amount (no cash cap)
Contract asset
Not applicable - Contract assets are Proximus' right to consideration in
exchange for goods or services that it has already transferred
to a customer and arise essentially in the context of a mobile or
fix offer with a subsidised device. These assets are classified as
current assets as they are expected to be realized as part of the
Group normal operating cycle.
Not applicable - When a contract for which a contract asset was recognized is
terminated anticipatively by the customer, the net amount
resulting from the contract asset settlement is recognized as
device revenue. The compensation for the device corresponds to
the unamortized part of the device when the contract is
terminated.
Contract costs
Commissions paid to acquire contracts are expensed as incurred. - Commissions paid for the acquisition of postpaid contracts are
considered by the Group as incremental costs to obtain a
contract. These commissions are deferred as contract costs.
Other commissions, including for prepaid mobile services are
expensed when incurred.
Not applicable - The resulting contract asset is deferred over a period of 3 years
when the contract acquired belongs to the CBU segment and 5
years when it belongs to the EBU segment. Because of this long
term duration, the contract costs balances are disclosed as non-
current asset.
The amortization of the contract cost is recognized in 'cost of
material and services related to revenue'
Contract liabilities
Items were recognized in deferred income IFRS 15 requires reclassification of some items previously
recognized in deferred income as contract liability.
Contract liabilities are netted of with contract assets on contract
by contract basis.

27 Consolidated Financial Statements & Additional information
The Group has decided to apply the cumulative catch-up method for transition with the application of practical
expedient for commissions other than those for postpaid contracts as they are expensed when incurred.
The initial application of IFRS 15 resulted in a positive impact of EUR 140 million (after deferred tax) on the
retained earnings per 1 January 2018 in the consolidated financial statements.
The net revenue by segment is disclosed in the table below. The disaggregation of this net revenue in categories
can be found for the Consumer segment in item 3.2, for the Enterprise segment in item 4.1, for Wholesale in item
5 and for BICS in item 6.1.
Changes following adoption of IFRS 9 – Financial instruments
In the context of the first application of IFRS 9, the Group identified the following changes:
• Participating interests in non-quoted companies, previously recognized at cost less impairment, are
measured at fair value and classified on a case by case basis either as fair value through other
comprehensive income (FVTOCI) or fair value through the income statement (FVTPL). No impact from
this accounting policy change on these financial assets value is identified.
• The application of the IFRS 9 expected credit loss model on the contract asset recognized in application
of IFRS 15, (although not financial instruments), resulted in a negative impact on retained earnings of
EUR 3 million (after deferred tax) as per 1 January 2018.
The Group took advantage of the exemption allowing it not to restate comparative information for prior periods
with respect to the classification and measurement changes.
The impacts of the changes to accounting policies are as follows:
IFRS 16
IFRS 16 will become applicable as of 1 January 2019 and replaces IAS 17 Leases, IFRIC 4 Determining whether an
Arrangement contains a Lease, SIC-15 Operating Leases-Incentives and SIC-27 Evaluating the Substance of
Transactions Involving the Legal Form of a Lease.
IFRS 16 sets out the principles for the recognition, measurement, presentation and disclosure of leases. Under
the current standard IAS 17, the Group is required to classify its leases as either finance or operating leases.
Under this new standard, lessees are required to account for leasing under a single on-balance sheet model
similar to the accounting for finance leases under IAS 17. For lease out, whereby the Group acts as lessor, the
classification of leases as operating or finance remains substantially unchanged from IAS 17, except for
subleases.
(EUR million)
Group BICS
Domestic
(Group excl.
BICS)
Consumer Enterprise Wholesale Others
Net revenue (underl y ing) 2,871 659 2,212 1,443 700 97 -29
Net revenue (incidental s) 0 0 0 0 0 0 0
Net revenue (reported) 2,871 659 2,212 1,443 700 97 -29
Other operat ing income (underl y ing) 22 0 22 11 2 0 8
Other operat ing income (incidental s) 1 0 1 1 0 0 0
Other operat ing income (reported) 23 0 22 12 2 0 8
Revenue (underl y ing) 2,892 659 2,233 1,454 702 97 -21
Total income (incidental s) 1 0 1 1 0 0 0
Total income (reported) 2,893 659 2,234 1,455 702 97 -21
30 June 2018 (IFRS 15)
(EUR million)
IFRS 15
Contract assets 83
Contract costs 120
Deferred tax on initial application -60
IFRS 9
Contract assets -5
Deferred tax on initial application 1
Total 140
Adjustment from initial application on Opening Balance Sheet

Condensed consolidated financial statements & Additional information 28
Although the assessment of the impact is ongoing, the implementation of IFRS 16 will lead to an increase of the
balance sheet total as both a Right-of-use- asset and a lease liability are recognized for all leases conveying to
the Group the right to control the use of an identified asset for a period of time. Accordingly, the expenses
relating to the use of the leased asset currently presented in operating expenses will be capitalized and
depreciated. The discounting of lease liability will be periodically unwound into finance cost.
Proximus selected the simplified retrospective approach as a transition rule.
Judgments and estimates
The Group does not make any significant judgments and estimates other than those mentioned under note 2 in
the 31 December 2017 consolidated financial statements, and other than those mentioned below in this report.
Significant events or transactions in 2018
EUR 400 million loan from the European Investment Bank
In March 2018 the Group entered into a EUR 400 million loan from the European Investment Bank due 2028 at a
very attractive fixed interest rate. Proximus pre-hedged the underlying rate at end 2017 and managed to further
reduce the all-in interest cost of this transaction. The Group applied hedge accounting for this derivative.
Business combinations and sale of equity instruments
The Proximus subsidiary Telindus-ISIT BV acquired two Dutch based companies, ION –IP in March 2018 and
Umbrio in May 2018, both specialized in IT & network operations, monitoring and analytics for a total cash out of
EUR 21 million net of cash acquired.
In April 2017 the group acquired all shares of Davinsi labs BVBA. The purchase price allocation resulted in the
recognition in the second quarter 2018 of intangible fixed assets for EUR 3 million.
Per end of October 2017, Proximus’ subsidiary BICS acquired 100% of TeleSign. The allocation of the purchase
price per end of June 2018 is still provisional. TeleSign contributed to the EBITDA of the first half of 2018.
In the second quarter the Group sold its equity investment in HomeSend resulting in a loss on disposal recognized
through Other Comprehensive Income of EUR 2 million (Group’s share).
Tax on pylons
New evolutions in jurisprudence led the Group to reassess the liabilities related to Taxes on Pylons for past
litigations in the second quarter 2018. The related cost for the first half year amounts to EUR 21 million in
EBITDA incidental (+ EUR 9 million in financial expenses).

29 Consolidated Financial Statements & Additional information
( EUR million)
2017
IAS 18
restated (*)
2018
IAS 18
Change
%
2018
IFRS 15
Change
IAS 18 vs
IFRS 15
2017
IAS 18
restated (*)
2018
IAS 18
Change
%
2018
IFRS 15
Change
IAS 18 vs
IFRS 15
Net revenue 1,406 1,444 2.7% 1,442 -0.1% 2,839 2,873 1.2% 2,871 -0.1%
Other operating income 11 10 -12.4% 10 0.0% 22 23 3.3% 23 0.0%
TOTAL INCOME 1,417 1,454 2.6% 1,452 -0.1% 2,861 2,895 1.2% 2,893 -0.1%
Costs of materials and services related to revenue -516 -522 1.0% -524 0.5% -1,062 -1,046 -1.5% -1,049 0.3%
Workforce expenses -315 -305 -3.0% -305 0.0% -628 -614 -2.2% -614 0.0%
Non workforce expenses -141 -167 18.7% -167 0.0% -297 -332 11.6% -332 0.0%
TOTAL OPERATING EXPENSES before depreciation &
amortization-972 -994 2.3% -997 0.2% -1,987 -1,992 0.2% -1,995 0.2%
OPERATING INCOME before depreciation & amortization 445 460 3.2% 456 -0.9% 874 903 3.4% 898 -0.5%
Depreciation and amortization -243 -261 7.1% -261 0.0% -478 -511 6.9% -511 0.0%
OPERATING INCOME 202 199 -1.4% 195 -2.0% 396 392 -1.0% 387 -1.3%
Finance income 5 3 -40.0% 3 0.0% 6 4 -29.2% 4 0.0%
Finance costs -20 -22 9.9% -22 0.0% -35 -35 -0.1% -35 0.0%
Net finance costs -15 -19 26.7% -19 0.0% -30 -31 5.8% -31 0.0%
Share of loss on associates 0 0 -1.1% 0 0.0% -1 -1 53.6% -1 0.0%
INCOME BEFORE TAXES 186 180 -3.7% 176 -2.2% 366 360 -1.6% 355 -1.4%
Tax expense -56 -45 -20.0% -44 -2.6% -111 -96 -14.0% -94 -1.5%
NET INCOME 130 135 3.4% 132 -2.1% 254 264 3.8% 260 -1.3%
Attributable to:
Equity holders of the parent (Group share) 126 129 2.8% 126 -2.2% 245 253 3.5% 250 -1.4%
Non-controlling interests 5 6 20.0% 6 0.0% 9 11 12.7% 11 0.0%
Basic earnings per share 0.39 EUR 0.40 EUR 2.9% 0.38 EUR -4.2% 0.76 EUR 0.79 EUR 3.5% 0.77 EUR -1.4%
Diluted earnings per share 0.39 EUR 0.40 EUR 2.9% 0.38 EUR -4.2% 0.76 EUR 0.79 EUR 3.6% 0.77 EUR -1.4%
Weighted average number of outstanding shares 322,827,005 322,594,351 -0.1% 322,594,351 0.0% 322,743,059 322,594,351 0.0% 322,594,351 0.0%
Weighted average number of outstanding shares for diluted earnings
per share323,003,142 322,677,791 -0.1% 322,677,791 0.0% 322,953,893 322,691,018 -0.1% 322,691,018 0.0%
2nd Quarter Year-to-date
(*)Restated: Split workforce - non workforce has been aligned at group's level
(EUR million) 2017 IAS 18 2018 IAS 18 2018 IFRS 15
Net income 254 264 260
Other comprehensive income:
Items that may be reclassified to profit and loss
Exchange differences on translation of foreign operations 0 6 6
Cash flow hedges:
Gain/(Loss) taken to equity -6 6 6
Total before rel ated tax effects -6 12 12
Rel ated tax effects
Cash flow hedges:
Gain/(Loss) taken to equity -1 -2 -2
Income tax relating to items that may be reclassified -1 -2 -2
Total of items that may be reclassified to profit and loss, net of
related tax effects-7 10 10
Items that will not be reclassified to profit and loss
Change in the fair value of equity instruments 0 -6 -6
Total of items that will not be reclassified to profit and loss 0 -6 -6
Total comprehensive income 247 268 264
Attributable to:
Equity holders of the parent 242 257 253
Non-controlling interests 5 11 11
Half-year 2018
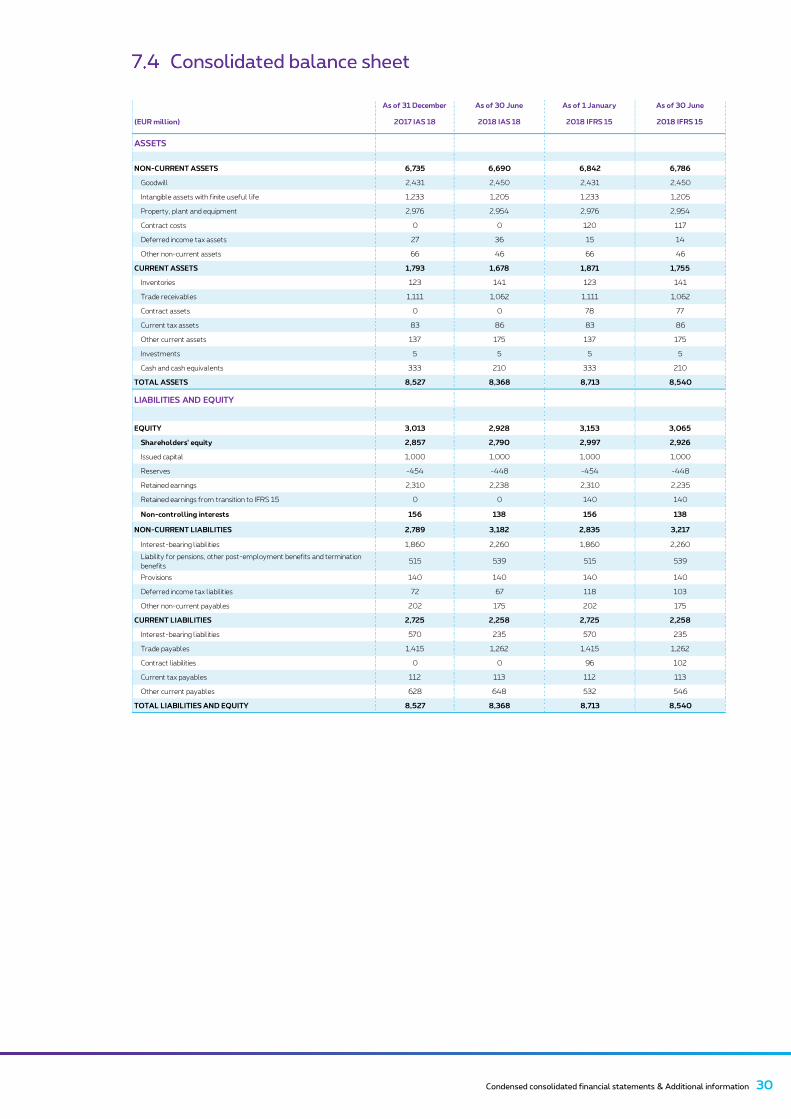
Condensed consolidated financial statements & Additional information 30
As of 31 December As of 30 June As of 1 January As of 30 June
(EUR million) 2017 IAS 18 2018 IAS 18 2018 IFRS 15 2018 IFRS 15
ASSETS
NON-CURRENT ASSETS 6,735 6,690 6,842 6,786
Goodwill 2,431 2,450 2,431 2,450
Intangible assets with finite useful life 1,233 1,205 1,233 1,205
Property, plant and equipment 2,976 2,954 2,976 2,954
Contract costs 0 0 120 117
Deferred income tax assets 27 36 15 14
Other non-current assets 66 46 66 46
CURRENT ASSETS 1,793 1,678 1,871 1,755
Inventories 123 141 123 141
Trade receivables 1,111 1,062 1,111 1,062
Contract assets 0 0 78 77
Current tax assets 83 86 83 86
Other current assets 137 175 137 175
Investments 5 5 5 5
Cash and cash equivalents 333 210 333 210
TOTAL ASSETS 8,527 8,368 8,713 8,540
LIABILITIES AND EQUITY
EQUITY 3,013 2,928 3,153 3,065
Shareholders' equity 2,857 2,790 2,997 2,926
Issued capital 1,000 1,000 1,000 1,000
Reserves -454 -448 -454 -448
Retained earnings 2,310 2,238 2,310 2,235
Retained earnings from transition to IFRS 15 0 0 140 140
Non-controlling interests 156 138 156 138
NON-CURRENT LIABILITIES 2,789 3,182 2,835 3,217
Interest-bearing liabilities 1,860 2,260 1,860 2,260
Liability for pensions, other post-employment benefits and termination
benefits515 539 515 539
Provisions 140 140 140 140
Deferred income tax liabilities 72 67 118 103
Other non-current payables 202 175 202 175
CURRENT LIABILITIES 2,725 2,258 2,725 2,258
Interest-bearing liabilities 570 235 570 235
Trade payables 1,415 1,262 1,415 1,262
Contract liabilities 0 0 96 102
Current tax payables 112 113 112 113
Other current payables 628 648 532 546
TOTAL LIABILITIES AND EQUITY 8,527 8,368 8,713 8,540

31 Consolidated Financial Statements & Additional information
(EUR million)2017
IAS 18
2018
IAS 18
Change
%
2018
IFRS 15
2017
IAS 18
2018
IAS 18
Change
%
2018
IFRS 15
Cash flow from operating activities
Net income 130 135 3.4% 132 254 264 3.8% 260
Adjustments for:
Depreciation and amortization on intangible assets and property, plant
and equipment243 261 7.1% 261 478 511 6.9% 511
Increase of impairment on intangible assets and property, plant and
equipment0 0 -76.6% 0 1 0 -84.2% 0
Increase/(decrease) in provisions -2 -2 22.5% -2 -2 1 >100% 1
Deferred tax income -11 -8 -26.7% -9 -13 -17 26.2% -18
Loss from investments accounted for using the equity method 0 0 -1.1% 0 1 1 53.6% 1
Fair value adjustments on financial instruments 1 0 <-100% 0 1 0 <-100% 0
Loans amortization 1 0 -26.6% 0 1 1 -14.4% 1
Loss/(gain) on disposal of property, plant and equipment 0 0 -46.7% 0 1 -1 <-100% -1
Operating cash flow before working capital changes 364 386 6.1% 382 722 760 5.2% 755
Decrease/ (Increase) in inventories -5 9 >100% 9 -11 -18 53.8% -18
Decrease/ (Increase) in trade receivables 5 47 >100% 47 64 63 -2.0% 63
Decrease/(increase) in contract costs 0 0 - 3 - 3
Decrease / (increase) in contract asset 0 0 - 1 - 2
Decrease/ (Increase) in current income tax assets -4 -3 -9.5% -3 27 -3 <-100% -3
Decrease/ (Increase) in other current assets 9 3 -60.2% 3 -21 -20 -6.9% -20
Decrease/(Increase) in other non current assets 0 0 - 0 0 0 - 0
(Decrease)/Increase in trade payables -28 -33 18.7% -33 -87 -86 -1.8% -86
(Decrease)/Increase in contract liability 0 0 - -3 - 6
(Decrease)/Increase in income tax payables -46 -61 32.6% -61 -25 0 >100% 0
(Decrease)/Increase in other current payables -48 -19 -59.4% -16 2 17 >100% 11
(Decrease)/Increase in net liability for pensions, other post-employment
benefits and termination benefits8 -3 <-100% -3 19 0 -99.6% 0
(Decrease)/Increase in other non-current payables and provisions 0 1 >100% 1 0 0 - 1
Decrease in working capital, net of acquisitions and disposals of
subsidiaries-109 -59 -45.8% -55 -32 -46 43.9% -41
Net cash flow provided by operating activities (1) 254 327 28.4% 327 690 714 3.6% 714
Cash flow from investing activities
Cash paid for acquisitions of intangible assets and property, plant and
equipment-209 -238 14.0% -238 -475 -540 13.7% -540
Cash paid for acquisitions of other participating interests -2 -1 -40.0% -1 -2 -3 49.5% -3
Cash paid for acquisition of consolidated companies, net of cash acquired -5 -16 >100% -16 -5 -22 >100% -22
Cash received from sales of intangible assets and property, plant and
equipment1 4 >100% 4 5 5 1.5% 5
Cash received from / (paid for) sales of other participating interests and
enterprises accounted for using the equity method0 5 >100% 4 -1 5 >100% 5
Net cash used in investing activities -215 -247 14.7% -247 -477 -555 16.3% -555
Cash flow before financing activities (FCF) 39 80 >100% 80 212 159 -25.0% 159
Cash f l ow f rom f inancing act iv it ies
Dividends paid to shareholders -325 -323 -0.5% -323 -326 -323 -0.8% -323
Dividends paid to non-controlling interests -32 -28 -10.1% -28 -32 -28 -10.1% -28
Net sale of treasury shares 0 0 <-100% 0 3 0 <-100% 0
Net sale of investments 0 0 <-100% 0 1 0 -94.0% 0
Decrease of shareholders' equity -1 -2 >100% -2 -1 -2 >100% -2
Cash received from cash flow hedge instrument related to long term
debt1 0 -99.2% 0 4 8 >100% 8
Issuance of long term debt -1 0 -74.4% 0 500 400 -20.0% 400
Repayment of long term debt (2) 0 -1 >100% -1 -1 -406 >100% -406
Issuance / (repayment) of short term debt 105 38 -64.3% 38 -245 70 >100% 70
Cash flows from financing activities -251 -318 26.3% -318 -96 -282 >100% -282
Net increase of cash and cash equivalents -212 -237 11.7% -237 116 -123 <-100% -123
Cash and cash equivalents at 1 January 297 333 333 297 333 333
Cash and cash equivalents at 30 June 413 210 210 413 210 210
(1) Net cash flow from operating activities includes the following cash
movements :
Interest paid -37 -40 -40
Interest received 1 0 0Income taxes paid -122 -115 -115
(2) The repayment of long term debt is the net of cash received and paid
for the debt and related derivatives
2nd Quarter Year-to-date
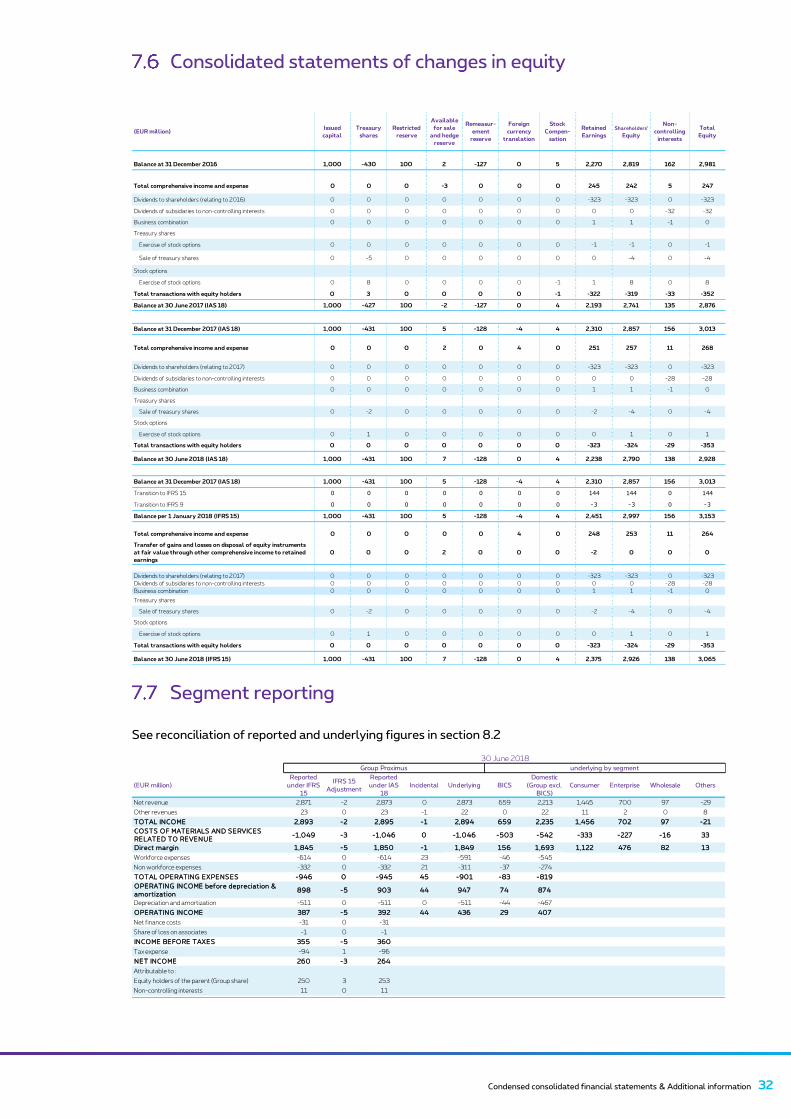
Condensed consolidated financial statements & Additional information 32
See reconciliation of reported and underlying figures in section 8.2
(EUR million)Issued
capital
Treasury
shares
Restricted
reserve
Available
for sale
and hedge
reserve
Remeasur-
ement
reserve
Foreign
currency
translation
Stock
Compen-
sation
Retained
Earnings
Shareholders'
Equity
Non-
controlling
interests
Total
Equity
Balance at 31 December 2016 1,000 -430 100 2 -127 0 5 2,270 2,819 162 2,981
Total comprehensive income and expense 0 0 0 -3 0 0 0 245 242 5 247
Dividends to shareholders (relating to 2016) 0 0 0 0 0 0 0 -323 -323 0 -323
Dividends of subsidiaries to non-controlling interests 0 0 0 0 0 0 0 0 0 -32 -32
Business combination 0 0 0 0 0 0 0 1 1 -1 0
Treasury shares
Exercise of stock options 0 0 0 0 0 0 0 -1 -1 0 -1
Sale of treasury shares 0 -5 0 0 0 0 0 0 -4 0 -4
Stock options
Exercise of stock options 0 8 0 0 0 0 -1 1 8 0 8
Total transactions with equity holders 0 3 0 0 0 0 -1 -322 -319 -33 -352
Balance at 30 June 2017 (IAS 18) 1,000 -427 100 -2 -127 0 4 2,193 2,741 135 2,876
Balance at 31 December 2017 (IAS 18) 1,000 -431 100 5 -128 -4 4 2,310 2,857 156 3,013
Total comprehensive income and expense 0 0 0 2 0 4 0 251 257 11 268
Dividends to shareholders (relating to 2017) 0 0 0 0 0 0 0 -323 -323 0 -323
Dividends of subsidiaries to non-controlling interests 0 0 0 0 0 0 0 0 0 -28 -28
Business combination 0 0 0 0 0 0 0 1 1 -1 0
Treasury shares
Sale of treasury shares 0 -2 0 0 0 0 0 -2 -4 0 -4
Stock options
Exercise of stock options 0 1 0 0 0 0 0 0 1 0 1
Total transactions with equity holders 0 0 0 0 0 0 0 -323 -324 -29 -353
Balance at 30 June 2018 (IAS 18) 1,000 -431 100 7 -128 0 4 2,238 2,790 138 2,928
Balance at 31 December 2017 (IAS 18) 1,000 -431 100 5 -128 -4 4 2,310 2,857 156 3,013
Transition to IFRS 15 0 0 0 0 0 0 0 144 144 0 144
Transition to IFRS 9 0 0 0 0 0 0 0 -3 -3 0 -3
Balance per 1 January 2018 (IFRS 15) 1,000 -431 100 5 -128 -4 4 2,451 2,997 156 3,153
Total comprehensive income and expense 0 0 0 0 0 4 0 248 253 11 264
Transfer of gains and losses on disposal of equity instruments
at fair value through other comprehensive income to retained
earnings
0 0 0 2 0 0 0 -2 0 0 0
Dividends to shareholders (relating to 2017) 0 0 0 0 0 0 0 -323 -323 0 -323
Dividends of subsidiaries to non-controlling interests 0 0 0 0 0 0 0 0 0 -28 -28
Business combination 0 0 0 0 0 0 0 1 1 -1 0
Treasury shares
Sale of treasury shares 0 -2 0 0 0 0 0 -2 -4 0 -4
Stock options
Exercise of stock options 0 1 0 0 0 0 0 0 1 0 1
Total transactions with equity holders 0 0 0 0 0 0 0 -323 -324 -29 -353
Balance at 30 June 2018 (IFRS 15) 1,000 -431 100 7 -128 0 4 2,375 2,926 138 3,065
(EUR million)
Reported
under IFRS
15
IFRS 15
Adjustment
Reported
under IAS
18
Incidental Underlying BICS
Domestic
(Group excl.
BICS)
Consumer Enterprise Wholesale Others
Net revenue 2,871 -2 2,873 0 2,873 659 2,213 1,445 700 97 -29
Other revenues 23 0 23 -1 22 0 22 11 2 0 8
TO TAL IN CO ME 2,893 -2 2,895 -1 2,894 659 2,235 1,456 702 97 -21
CO S TS O F MATE RIALS AN D S E RVICE S
RE LATE D TO RE VE N U E-1,049 -3 -1,046 0 -1,046 -503 -542 -333 -227 -16 33
Direct margin 1 ,845 -5 1,850 -1 1,849 156 1,693 1,122 476 82 13
Workforce expenses -614 0 -614 23 -591 -46 -545
Non workforce expenses -332 0 -332 21 -311 -37 -274
TO TAL O PE RATIN G E X PE N S E S -946 0 -945 45 -901 -83 -819
O PE RATIN G IN CO ME before depreciat ion &
amort izat ion898 -5 903 44 947 74 874
Depreciation and amortization -511 0 -511 0 -511 -44 -467
O PE RATIN G IN CO ME 387 -5 392 44 436 29 407
Net finance costs -31 0 -31
Share of loss on associates -1 0 -1
IN CO ME BE FO RE TAX E S 355 -5 360
Tax expense -94 1 -96
N E T IN CO ME 260 -3 264
Attributable to :
Equity holders of the parent (Group share) 250 3 253
Non-controlling interests 11 0 11
30 June 2018Group Proximus underlying by segment

33 Consolidated Financial Statements & Additional information
IAS 34 16 A (j) requires the interim reporting to provide specific fair value disclosures and in particular the
following information:
• The carrying amounts and fair values of the financial instruments at 31 December 2017;
• The categorization of the fair valued financial instruments within the fair value hierarchy;
• The fair valuation techniques used.
The Group’s main financial instruments comprise unsubordinated debentures, trade receivables and trade
payables. The Group has an interest rate and currency swap (IRCS) to manage its exposure to interest rate
risk and to foreign currency risk on its remaining non-current interest-bearing liability yielded in foreign
currency. The typical financial instruments used to hedge foreign currency risk are forward foreign
exchange contracts and currency options.
Fair Value and Fair Value Hierarchy
The following table shows the original measurement categories under IAS 39 and the new measurement
categories under IFRS 9 for each class of assets and financial liabilities at January 1, 2018. It also includes
the fair value hierarchy of the financial instruments and the valuation levels
(EUR million)
Reported
under IAS
18
Incidental Underlying BICS
Domestic
(Group excl.
BICS)
Consumer Enterprise Wholesale Others
Net revenue 2,839 0 2,839 644 2,195 1,437 686 100 -28
Other revenues 22 0 22 1 21 10 4 0 6
TO TAL IN CO ME 2,861 0 2,861 645 2,216 1,447 690 10 0 -22
CO S TS O F MATE RIALS AN D S E RVICE S
RE LATE D TO RE VE N U E-1,062 0 -1,062 -513 -549 -349 -214 -14 28
Direct margin 1 ,799 0 1,799 132 1,667 1,098 476 86 6
Workforce expenses (*) -628 38 -589 -35 -555
Non workforce expenses (*) -297 2 -296 -29 -266
TO TAL O PE RATIN G E X PE N S E S -925 40 -885 -64 -821
O PE RATIN G IN CO ME before depreciat ion &
amort izat ion874 40 914 68 846
Depreciation and amortization -478 0 -478 -38 -440
O PE RATIN G IN CO ME 396 40 436 30 406
Net finance costs -30
Share of loss on associates -1
IN CO ME BE FO RE TAX E S 366
Tax expense -111
N E T IN CO ME 254
Attributable to :
Equity holders of the parent (Group share) 245
Non-controlling interests 9
(*) Restated: split workforce - non workforce has been aligned at group's level
underlying by segmentGroup Proximus
30 June 2017
(EUR million)
As of 31
December 2017Cash flows
As of 30 June
2018
Long-term
Unsubordinated debentures 1,850 1 1,851
Leasing and similar obligations 6 -1 5
Credit institutions 0 400 400
Other loans 0 0 0
Derivatives held for trading 4 0 4
Current portion of amounts payable > one year
Unsubordinated debentures 405 -405 0
Leasing and similar obligations 2 0 2
Other financial debts
Credit institutions 164 70 234
Total l iabil it ies f rom f inancing act iv it ies 2,430 65 2,496
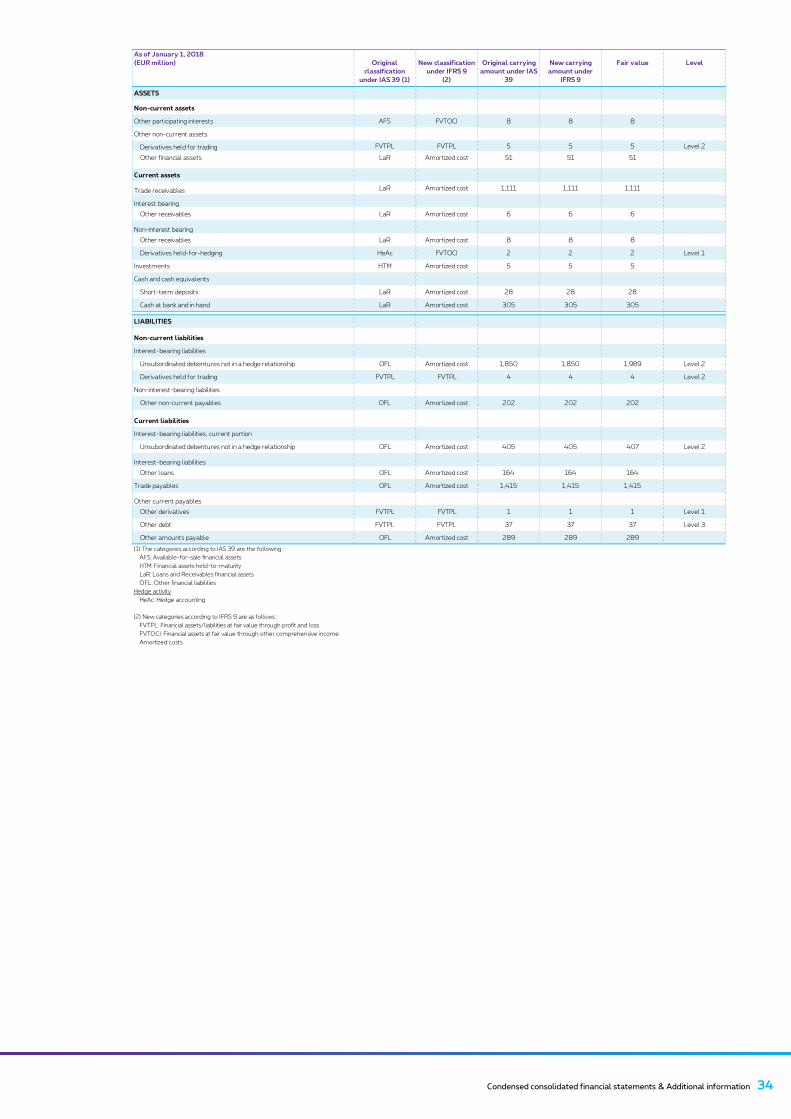
Condensed consolidated financial statements & Additional information 34
As of January 1, 2018
(EUR million)
ASSETS
Non-current assets
Other participating interests AFS FVTOCI 8 8 8
Other non-current assets
Derivatives held for trading FVTPL FVTPL 5 5 5 Level 2
Other financial assets LaR Amortized cost 51 51 51
Current assets
Trade receivables LaR Amortized cost 1,111 1,111 1,111
Interest bearing
Other receivables LaR Amortized cost 6 6 6
Non-interest bearing
Other receivables LaR Amortized cost 8 8 8
Derivatives held-for-hedging HeAc FVTOCI 2 2 2 Level 1
Investments HTM Amortized cost 5 5 5
Cash and cash equivalents
Short-term deposits LaR Amortized cost 28 28 28
Cash at bank and in hand LaR Amortized cost 305 305 305
LIABILITIES
Non-current liabilities
Interest-bearing liabilities
Unsubordinated debentures not in a hedge relationship OFL Amortized cost 1,850 1,850 1,989 Level 2
Derivatives held for trading FVTPL FVTPL 4 4 4 Level 2
Non-interest-bearing liabilities
Other non-current payables OFL Amortized cost 202 202 202
Current liabilities
Interest-bearing liabilities, current portion
Unsubordinated debentures not in a hedge relationship OFL Amortized cost 405 405 407 Level 2
Interest-bearing liabilities
Other loans OFL Amortized cost 164 164 164
Trade payables OFL Amortized cost 1,415 1,415 1,415
Other current payables
Other derivatives FVTPL FVTPL 1 1 1 Level 1
Other debt FVTPL FVTPL 37 37 37 Level 3
Other amounts payable OFL Amortized cost 289 289 289
(1) The categories according to IAS 39 are the following :
AFS: Available-for-sale financial assets
HTM: Financial assets held-to-maturity
LaR: Loans and Receivables financial assets
OFL: Other financial liabilities
Hedge activity
HeAc: Hedge accounting
(2) New categories according to IFRS 9 are as follows :
FVTPL: Financial assets/liabilities at fair value through profit and loss
FVTOCI: Financial assets at fair value through other comprehensive income
Amortized costs
Fair value LevelNew classification
under IFRS 9
(2)
New carrying
amount under
IFRS 9
Original
classification
under IAS 39 (1)
Original carrying
amount under IAS
39
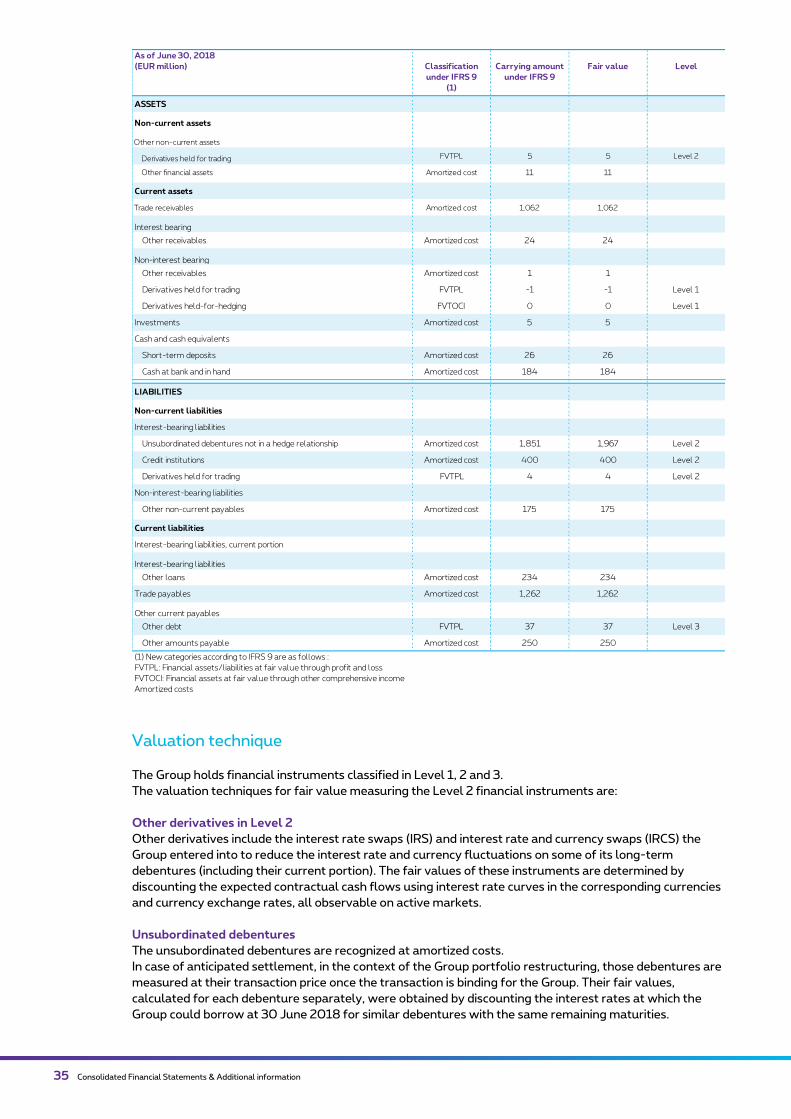
35 Consolidated Financial Statements & Additional information
Valuation technique
The Group holds financial instruments classified in Level 1, 2 and 3.
The valuation techniques for fair value measuring the Level 2 financial instruments are:
Other derivatives in Level 2
Other derivatives include the interest rate swaps (IRS) and interest rate and currency swaps (IRCS) the
Group entered into to reduce the interest rate and currency fluctuations on some of its long-term
debentures (including their current portion). The fair values of these instruments are determined by
discounting the expected contractual cash flows using interest rate curves in the corresponding currencies
and currency exchange rates, all observable on active markets.
Unsubordinated debentures
The unsubordinated debentures are recognized at amortized costs.
In case of anticipated settlement, in the context of the Group portfolio restructuring, those debentures are
measured at their transaction price once the transaction is binding for the Group. Their fair values,
calculated for each debenture separately, were obtained by discounting the interest rates at which the
Group could borrow at 30 June 2018 for similar debentures with the same remaining maturities.
As of June 30, 2018
(EUR million)
ASSETS
Non-current assets
Other non-current assets
Derivatives held for trading FVTPL 5 5 Level 2
Other financial assets Amortized cost 11 11
Current assets
Trade receivables Amortized cost 1,062 1,062
Interest bearing
Other receivables Amortized cost 24 24
Non-interest bearing
Other receivables Amortized cost 1 1
Derivatives held for trading FVTPL -1 -1 Level 1
Derivatives held-for-hedging FVTOCI 0 0 Level 1
Investments Amortized cost 5 5
Cash and cash equivalents
Short-term deposits Amortized cost 26 26
Cash at bank and in hand Amortized cost 184 184
LIABILITIES
Non-current liabilities
Interest-bearing liabilities
Unsubordinated debentures not in a hedge relationship Amortized cost 1,851 1,967 Level 2
Credit institutions Amortized cost 400 400 Level 2
Derivatives held for trading FVTPL 4 4 Level 2
Non-interest-bearing liabilities
Other non-current payables Amortized cost 175 175
Current liabilities
Interest-bearing liabilities, current portion
Interest-bearing liabilities
Other loans Amortized cost 234 234
Trade payables Amortized cost 1,262 1,262
Other current payables
Other debt FVTPL 37 37 Level 3
Other amounts payable Amortized cost 250 250
(1) New categories according to IFRS 9 are as follows :
FVTPL: Financial assets/liabilities at fair value through profit and loss
FVTOCI: Financial assets at fair value through other comprehensive income
Amortized costs
Classification
under IFRS 9
(1)
Fair valueCarrying amount
under IFRS 9
Level

Condensed consolidated financial statements & Additional information 36
Other debts in level 3
Level 3 financial instruments valuation is not based on observable market data. Instead, its fair value is
derived using financial models and other valuation methods. To the extent possible, the underlying
assumptions take into account market pricing information. Valuation changes due to new information could
impact the income statement.
BICS SA received withholding tax assessments and penalty orders from the Indian tax authorities in
relation to payments made by an Indian tax resident customer to BICS in the period 1 April 2007 to 31
March 2009 for an aggregate amount of INR 654 million (equivalent to EUR 8.2 million). BICS
filed appeals against the above assessments with the competent Indian Courts opposing the view of the
Indian tax authorities that Indian withholding taxes are due on the payments. Furthermore, BICS is
opposing the assessment in relation to the period 1 April 2008 to 31 March 2009 on procedural grounds.
BICS has not paid the assessed amounts and has not recorded a tax provision. Management assesses that
the position as recognized in these financial statements reflects the best estimate of the probable final
outcome.
On July 12, 2018 the Group acquired Codit, a Belgium-headquartered IT services company and a market
leader in business application integration, API Management, Microsoft Azure and Internet of Things. The
acquisition of Codit is in line with Proximus’ Fit for Growth strategy and the ambition to invest in key
strategic domains, enabling Proximus to become a Digital Service Provider for its enterprise customers.
Today, Codit is employing over 160 highly skilled people in Belgium, the Netherlands, France, Switzerland,
the United Kingdom, Portugal and Malta. The initial accounting of this transaction is currently being
prepared.
There has been no material change to the information disclosed in the most recent annual consolidated
financial statements in connection with related parties that would require disclosure under the Financial
Reporting Framework.
Additional information
IFRS 15 impact on reporting The main implications for Proximus relate to mobile joint offers and to commissions paid to acquire
contracts.
1. Under IFRS 15, as of 1 January 2018, revenue arising from customer contracts, is recognized at an
amount that reflects the consideration to which an entity expects to be entitled in exchange for
transferring goods or services to a customer.
The revenue allocation to Service revenue and Device revenue is based on the relative stand-alone
selling price of the device and services:
• More revenue is allocated to the device, and less to Service revenue
• Higher upfront revenue is recorded related to the device
2. Commissions paid for the acquisition of contracts are deferred whereas they were recognized
immediately under IAS 18.

37 Consolidated Financial Statements & Additional information
Rounding In general, all figures are rounded. Variances are calculated from the source data before rounding,
implying that some variances may not add up.
IAS 18IFRS 15
Variance IAS 18 IFRS 15 Variance
(EUR million) Q2'18 Q2'18 abs. YTD'18 YTD'18 abs.
Revenues 1,454 1,452 -1.6 2,894 2,892 -1.9
Net revenue 1,444 1,442 -1.6 2,873 2,870 -2.6
Services 817 801 -16.0 1,629 1,598 -31.4
Devices 55 73 17.8 119 157 37.2
Other (including Tango & penalties)
572 568 -3.8 1,124 1,116 -7.8 mainly within Consumer
Other operating income 10 9,73 0.0 22 22 0.0
Cost of Goods Sold -522 -524 -2.5 -1,046 -1,049 -3.1 equally split between Consumer and Enterprise
Direct Margin 932 928 -4.1 1,849 1,844 -5.0
direct margin % 64.1% 63.9% -0.2pp 63.9% 63.7%
Operating Expenses -440 -439 0.1 -902 -902 0.1
Workforce -295 -295 0.0 -591 -591 0.0
Non Workforce -145 -145 0.1 -311 -311 0.1
EBITDA 493 489 -4.0 947 942 -4.9
ebitda % 33.9% 33.6% -0.2pp 32.7% 32.6% -0.1pp
-0.1pp
nearly fully within Consumer
(EUR million) Q2'17 Q2'18 Q2'17 Q2'18 YTD '17 YTD '18 YTD '17 YTD '18
Reported 1,417 1,454 445 460 2,861 2,895 874 903
Underlying 1,417 1,454 464 493 2,861 2,894 914 947
Incidentals 0 0 -19 -33 0 1 -40 -44
Incidentals: 0 0 -19 -33 0 1 -40 -44
Capital gains on building sales - - - - - 1 - 1
Early Leave Plan and Collective Agreement - - -19 -11 - - -38 -22
M&A-related transaction costs - - -1 -1 - - -3 -2
Reversal UK rent provision 2014 - - 1 - - - 1
Pylon Tax provision update (<2018) - - - -21 - - - -21
GROUP
Revenue
GROUP
EBITDA
GROUP
Revenue
GROUP
EBITDA
Comparative table
IAS18/IFRS15
(underlying)

Condensed consolidated financial statements & Additional information 38
8.3.1 Group – Financials
Product view
(EUR mil l ion) Q117 Q217 Q317 Q417 2017 Q118 Q218
REPORTED
Revenues 1,444 1,417 1,463 1,478 5,802 1,441 1,454
EBITDA 428 445 468 431 1,772 443 460
UNDERLYING
Revenues per Segment 1,443 1,417 1,441 1,477 5,778 1,441 1,454
Domestic 1,111 1,105 1,105 1,137 4,458 1,121 1,114
Consumer 720 727 729 734 2,909 731 725
Enterprise 349 343 340 369 1,400 351 351
Wholesale 52 48 56 51 207 48 50
Other (incl. eliminations) -9 -13 -20 -17 -58 -8 -13
International Carrier Services (BICS) 332 312 336 339 1,320 319 340
Costs of materials and charges to revenues -545 -516 -539 -565 -2,166 -524 -522
Direct Margin 898 901 901 912 3,612 917 932
Direct Margin % 62.2% 63.6% 62.6% 61.7% 62.5% 63.6% 64.1%
Total expenses before D&A -449 -436 -437 -466 -1,789 -462 -440
EBITDA 449 464 464 445 1,823 454 493
Segment EBITDA margin % 31.1% 32.8% 32.2% 30.2% 31.6% 31.5% 33.9%
(EUR mil l ion) Q117 Q217 Q317 Q417 2017 Q118 Q218
Revenues 1,443 1,417 1,441 1,477 5,778 1,441 1,454
Domest ic 1,111 1,105 1,105 1,137 4,458 1,121 1,114
Fixed 505 502 500 500 2,007 506 502
Fixed Serv ices 496 494 491 491 1,972 498 494
Voice 188 182 177 175 721 177 171
Data (Internet & Data Connectivity) 214 216 217 219 866 222 224
TV 95 96 97 98 385 99 99
Fixed Terminal s (excl . TV) 9 9 9 8 34 8 8
Mobil e 366 373 374 381 1,493 371 371
Mobil e Serv ices 321 326 327 322 1,296 314 323
Postpaid 294 298 302 300 1,195 294 302
Prepaid 27 28 25 22 101 20 21
Mobil e Terminal s 45 47 47 58 198 56 48
ICT 133 128 128 149 538 135 136
Advanced Business Serv ices 6 6 7 9 28 7 7
Subsidiar ies (Tango) 31 33 31 35 131 34 33
Other Products 27 27 28 30 112 30 27
Whol esal e 52 48 56 51 207 48 50
Other segment (incl . el iminat ions) -9 -13 -20 -17 -58 -8 -13
Internat ional C arr ier Serv ices (BIC S) 332 312 336 339 1,320 319 340

39 Consolidated Financial Statements & Additional information
8.3.2 Consumer –Financials
X-Play view
Product view
(EUR million)
Q117
IFRS15
(pro forma)
Q217
IFRS15
(pro forma)
Q317
IFRS15
(pro forma)
Q417
IFRS15
(pro forma)
2017
IFRS15
(pro forma)
Q118
IFRS15
(pro forma)
Q218
IFRS15
Revenues (underl y ing) 719 734 730 744 2,928 730 724
Net Revenue (underl y ing) 714 729 725 740 2,908 725 718
X-Pl ay Revenues 583 589 586 585 2,343 588 589
4-Pl ay 211 220 224 227 882 231 236
3-Pl ay 174 172 169 168 682 168 166
Convergent 86 85 83 82 336 82 82
Fixed 87 87 86 86 346 85 84
2-Pl ay 76 74 73 72 294 72 70
Convergent 22 21 21 20 84 20 20
Fixed 54 53 52 51 210 52 50
1-Pl ay 123 123 120 118 485 117 116
1P Fixed Voice 28 26 26 25 105 25 24
1P internet 12 12 12 13 48 13 13
1P Mobile 83 84 83 81 331 79 79
Prepaid 27 28 25 22 101 20 21
Terminal s sal es 46 49 49 56 200 52 45
Tango 26 28 28 30 113 28 28
Other net revenues 32 34 39 46 151 37 35
Other operat ing Income (underl y ing) 5 5 5 5 20 5 5
Costs of material s & charges to revenues -172 -176 -181 -194 -722 -174 -161
Direct Margin 547 558 549 551 2,206 556 563
Direct Margin % 76.1% 76.1% 75.2% 74.0% 75.3% 76.1% 77.7%
(EUR million) Q117 Q217 Q317 Q417 2017 Q118 Q218
Revenues 720 727 729 734 2,909 731 725
Fixed 381 380 380 381 1,522 387 384
Fixed Serv ices 377 376 376 377 1,507 384 381
Voice 130 126 124 122 503 124 119
Data (Internet & Data Connectivity) 153 154 156 157 619 161 162
TV 95 96 97 98 385 99 99
Fixed Terminal s (excl . TV) 4 4 4 4 15 3 3
Mobil e 281 288 289 290 1,148 281 282
Mobil e Serv ices 242 247 248 243 979 237 243
Postpaid 215 219 223 221 878 217 222
Prepaid 27 28 25 22 101 20 21
Mobil e Terminal s 39 42 41 47 170 43 39
ICT 7 7 7 7 28 8 7
Subsidiar ies (Tango) 27 29 28 31 114 29 29
Other Products 24 23 24 25 96 26 24
Costs of materials & charges to revenues -173 -175 -178 -193 -720 -174 -159
Direct Margin 547 551 550 541 2,189 556 566
Direct Margin % 76.0% 75.9% 75.5% 73.7% 75.3% 76.2% 78.0%
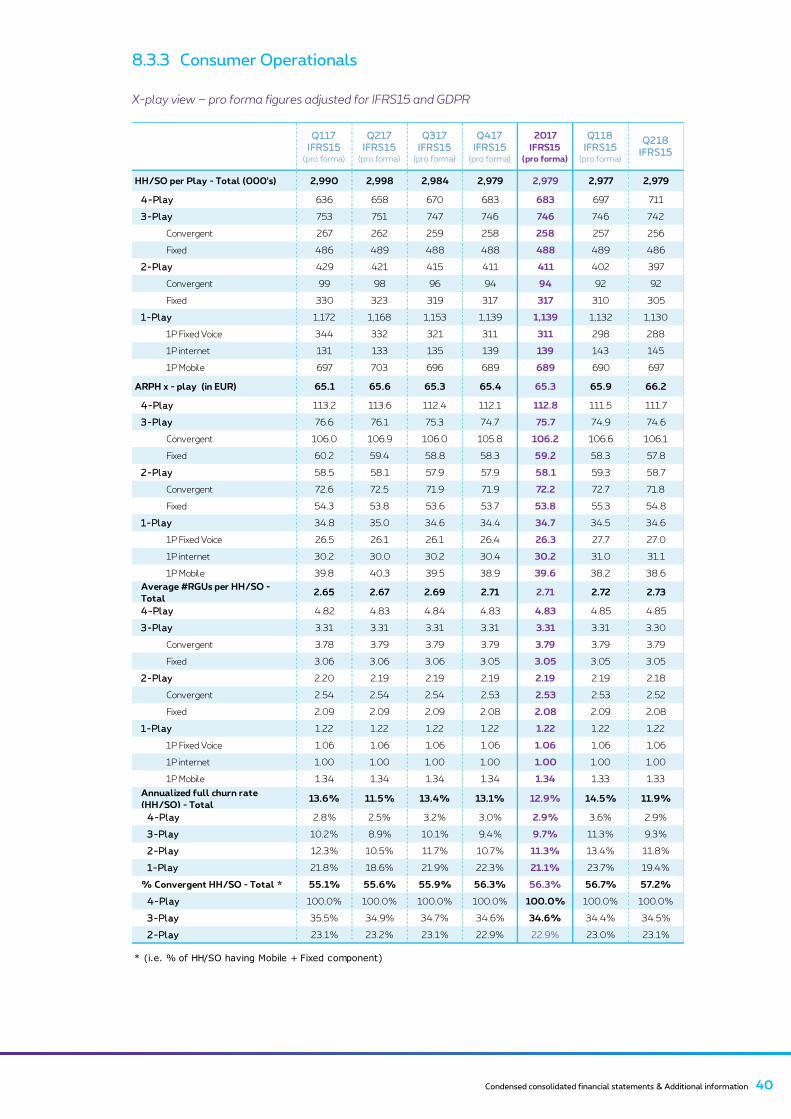
Condensed consolidated financial statements & Additional information 40
8.3.3 Consumer Operationals
X-play view – pro forma figures adjusted for IFRS15 and GDPR
Q117
IFRS15 (pro forma)
Q217
IFRS15 (pro forma)
Q317
IFRS15 (pro forma)
Q417
IFRS15 (pro forma)
2017
IFRS15 (pro forma)
Q118
IFRS15 (pro forma)
Q218
IFRS15
HH/SO per Play - Total (000's) 2,990 2,998 2,984 2,979 2,979 2,977 2,979
4-Pl ay 636 658 670 683 683 697 711
3-Pl ay 753 751 747 746 746 746 742
Convergent 267 262 259 258 258 257 256
Fixed 486 489 488 488 488 489 486
2-Pl ay 429 421 415 411 411 402 397
Convergent 99 98 96 94 94 92 92
Fixed 330 323 319 317 317 310 305
1-Pl ay 1,172 1,168 1,153 1,139 1,139 1,132 1,130
1P Fixed Voice 344 332 321 311 311 298 288
1P internet 131 133 135 139 139 143 145
1P Mobile 697 703 696 689 689 690 697
ARPH x - play (in EUR) 65.1 65.6 65.3 65.4 65.3 65.9 66.2
4-Pl ay 113.2 113.6 112.4 112.1 112.8 111.5 111.7
3-Pl ay 76.6 76.1 75.3 74.7 75.7 74.9 74.6
Convergent 106.0 106.9 106.0 105.8 106.2 106.6 106.1
Fixed 60.2 59.4 58.8 58.3 59.2 58.3 57.8
2-Pl ay 58.5 58.1 57.9 57.9 58.1 59.3 58.7
Convergent 72.6 72.5 71.9 71.9 72.2 72.7 71.8
Fixed 54.3 53.8 53.6 53.7 53.8 55.3 54.8
1-Pl ay 34.8 35.0 34.6 34.4 34.7 34.5 34.6
1P Fixed Voice 26.5 26.1 26.1 26.4 26.3 27.7 27.0
1P internet 30.2 30.0 30.2 30.4 30.2 31.0 31.1
1P Mobile 39.8 40.3 39.5 38.9 39.6 38.2 38.6
Average #RGUs per HH/SO -
Total 2.65 2.67 2.69 2.71 2.71 2.72 2.73
4-Pl ay 4.82 4.83 4.84 4.83 4.83 4.85 4.85
3-Pl ay 3.31 3.31 3.31 3.31 3.31 3.31 3.30
Convergent 3.78 3.79 3.79 3.79 3.79 3.79 3.79
Fixed 3.06 3.06 3.06 3.05 3.05 3.05 3.05
2-Pl ay 2.20 2.19 2.19 2.19 2.19 2.19 2.18
Convergent 2.54 2.54 2.54 2.53 2.53 2.53 2.52
Fixed 2.09 2.09 2.09 2.08 2.08 2.09 2.08
1-Pl ay 1.22 1.22 1.22 1.22 1.22 1.22 1.22
1P Fixed Voice 1.06 1.06 1.06 1.06 1.06 1.06 1.06
1P internet 1.00 1.00 1.00 1.00 1.00 1.00 1.00
1P Mobile 1.34 1.34 1.34 1.34 1.34 1.33 1.33
Annualized full churn rate
(HH/SO) - Total13.6% 11.5% 13.4% 13.1% 12.9% 14.5% 11.9%
4-Pl ay 2.8% 2.5% 3.2% 3.0% 2.9% 3.6% 2.9%
3-Pl ay 10.2% 8.9% 10.1% 9.4% 9.7% 11.3% 9.3%
2-Pl ay 12.3% 10.5% 11.7% 10.7% 11.3% 13.4% 11.8%
1-Pl ay 21.8% 18.6% 21.9% 22.3% 21.1% 23.7% 19.4%
% Convergent HH/SO - Total * 55.1% 55.6% 55.9% 56.3% 56.3% 56.7% 57.2%
4-Pl ay 100.0% 100.0% 100.0% 100.0% 100.0% 100.0% 100.0%
3-Pl ay 35.5% 34.9% 34.7% 34.6% 34.6% 34.4% 34.5%
2-Pl ay 23.1% 23.2% 23.1% 22.9% 22.9% 23.0% 23.1%
* (i.e. % of HH/SO having Mobile + Fixed component)

41 Consolidated Financial Statements & Additional information
Product view
8.3.4 Enterprise – Financials
Q117 Q217 Q317 Q417 2017 Q118 Q218
From Fixed
Number of access channel s (thousands) 3,872 3,885 3,877 3,883 3,883 3,881 3,870
Voice 2,066 2,063 2,048 2,036 2,036 2,020 2,002
Broadband 1,806 1,821 1,829 1,847 1,847 1,861 1,868
ARPU (EUR)
ARPU Voice 21.0 20.4 20.1 19.9 20.4 20.4 19.8
ARPU broadband 28.4 28.3 28.4 28.4 28.4 28.9 28.9
ARPU TV 20.9 20.8 20.9 21.0 20.9 20.9 20.9
From Mobil e
Number of act ive customers (thousands) 3,646 3,631 3,552 3,552 3,552 3,533 3,528
Prepaid 1,057 998 909 901 901 870 832
Postpaid 2,589 2,633 2,643 2,651 2,651 2,663 2,695
Annual ized churn rate
Prepaid 39.0% 38.5% n.r. 24.3% n.r. 29.0% 34.7%
Postpaid 15.1% 13.3% 16.3% 17.1% 15.6% 17.3% 14.2%
Blended 22.7% 21.0% 32.5% 19.1% 23.9% 20.4% 19.5%
Net ARPU (EUR)
Prepaid 8.1 9.0 8.7 8.2 8.5 7.6 8.2
Postpaid 27.9 28.0 28.3 27.8 28.0 27.3 27.7
Blended 22.0 22.6 23.1 22.8 22.6 22.4 23.0
Average Mobile data usage user/month (Mb)
4G 1,303 1,407 1,546 1,625 1,818 2,163
Blended 1,083 1,192 1,330 1,414 1,614 1,922
1,5331,516 1,584TV unique customers (thousands) 1,5751,5601,5601,543
(EUR million) Q117 Q217 Q317 Q417 2017 Q118 Q218
Revenues 349 343 340 369 1,400 351 351
Fixed 124 122 119 119 484 119 118
Fixed Serv ices 119 118 115 114 465 114 113
Voice 57 55 53 52 218 53 51
Data (Internet & Data Connectivity) 62 62 61 62 247 61 62
Fixed Terminal s (excl . TV) 5 5 5 5 19 5 5
Mobil e 85 85 85 90 345 90 89
Mobil e Serv ices 79 79 79 79 317 77 80
Mobil e Terminal s 6 5 6 11 28 13 9
ICT 126 121 121 141 509 127 129
Advanced Business Serv ices 6 6 7 9 28 7 7
Subsidiar ies (Tango) 4 4 3 5 17 5 4
Other Products 3 4 4 4 16 4 3
Costs of materials and charges to revenues -111 -104 -106 -125 -445 -115 -112
Direct Margin 238 239 234 244 955 237 239
Direct Margin % 68.3% 69.7% 68.8% 66.1% 68.2% 67.4% 68.0%

Condensed consolidated financial statements & Additional information 42
8.3.5 Enterprise – Operationals
8.3.6 Wholesale – Financials
8.3.7 Retail Operationals and MVNO customers reported in Wholesale
Q117 Q217 Q317 Q417 2017 Q118 Q218
From Fixed
Number of access channel s (thousands) 746 735 724 715 715 701 692
Voice 609 599 589 580 580 567 559
Broadband 137 137 135 135 135 134 133
ARPU (EUR)
ARPU Voice 31.2 30.5 29.9 29.8 30.4 31.0 30.3
ARPU Broadband 42.8 43.3 43.2 43.4 43.2 43.3 43.5
Q117 Q217 Q317 Q417 2017 Q118 Q218
From Mobil e
Number of mobil e cards (thousands) 2,132 2,155 2,173 2,197 2,197 2,222 2,251
Among which voice and data cards 952 965 975 988 988 999 1,010
Among which M2M 1,180 1,190 1,198 1,209 1,209 1,223 1,244
Annual ized churn rate (bl ended) 10.6% 10.5% 9.4% 10.4% 10.2% 9.7% 8.9%
Net ARPU (EUR)
Postpaid 26.9 26.6 26.3 26.1 26.5 24.8 25.5
Average Mobil e data usage user/month (Mb)
4G 1,266 1,345 1,412 1,480 1,647 1,905
Blended 1,094 1,180 1,254 1,328 1,499 1,745
(EUR million) Q117 Q217 Q317 Q417 2017 Q118 Q218
Revenues 52 48 56 51 207 48 50
Direct Margin 45 41 46 43 175 41 41
Direct Margin % 86.4% 86.2% 81.2% 85.4% 84.7% 85.4% 82.5%
Q117 Q217 Q317 Q417 2017 Q118 Q218
From Fixed
Number of access channel s (thousands)
Voice (1) 8 8 8 8 8 8 8
Broadband (1) 1 1 1 1 1 1 1
From Mobile
Number of act ive Mobil e customers
(thousands)
Retail (1) 9 9 9 8 8 8 9
MVNO 17 19 21 21 21 22 23
(1) i.e. Proximus retail products sold via Wholesale (OLO's own usage and reselling)

43 Consolidated Financial Statements & Additional information
8.3.8 BICS – Financials
8.3.9 BICS - Operationals
(EUR million) Q117 Q217 Q317 Q417 2017 Q118 Q218
REPORTED
Revenues 332 312 336 339 1,320 319 340
Segment Resul t 31 33 37 37 139 34 39
UNDERLYING
Revenues 332 312 336 339 1,320 319 340
Revenues from Voice 262 241 251 249 1,003 226 240
Revenues from non-Voice 70 71 85 90 317 93 100
Costs of materials and charges to revenues -268 -245 -266 -261 -1,041 -242 -261
Direct Margin 64 67 70 78 279 77 79
Direct Margin % 19.4% 21.5% 20.8% 23.0% 21.2% 24.0% 23.4%
Total expenses before D&A -31 -33 -32 -41 -137 -42 -41
Workforce expenses -18 -17 -17 -21 -72 -23 -23
Non Workforce expenses -14 -16 -15 -20 -65 -19 -18
Segment resul t 33 34 38 37 143 35 39
Segment contribution margin % 9.9% 11.0% 11.2% 11.0% 10.8% 10.9% 11.4%
Volumes in million Q117 Q217 Q317 Q417 2017 Q118 Q218
Voice 6,118 5,907 6,241 6,118 24,385 5,997 6,001
Non-Voice (Messaging) 879 939 1,101 1,909 4,828 2,457 2,453
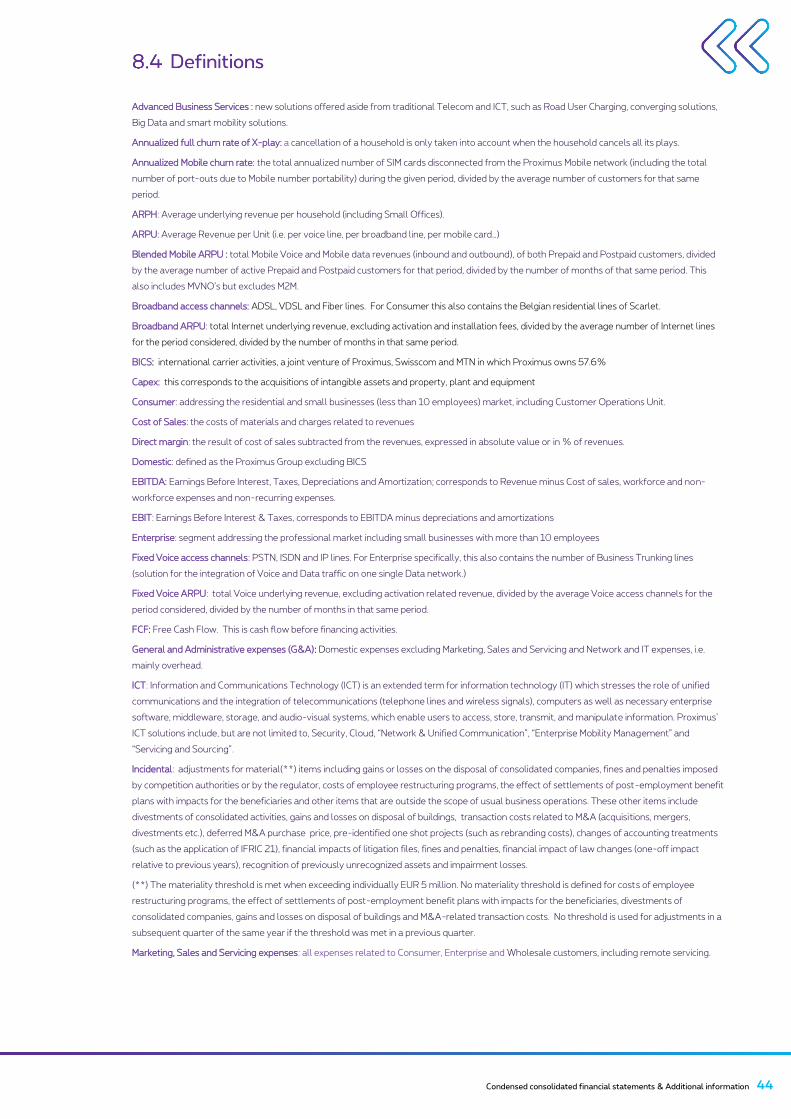
Condensed consolidated financial statements & Additional information 44
Advanced Business Services : new solutions offered aside from traditional Telecom and ICT, such as Road User Charging, converging solutions,
Big Data and smart mobility solutions.
Annualized full churn rate of X-play: a cancellation of a household is only taken into account when the household cancels all its plays.
Annualized Mobile churn rate: the total annualized number of SIM cards disconnected from the Proximus Mobile network (including the total
number of port-outs due to Mobile number portability) during the given period, divided by the average number of customers for that same
period.
ARPH: Average underlying revenue per household (including Small Offices).
ARPU: Average Revenue per Unit (i.e. per voice line, per broadband line, per mobile card…)
Blended Mobile ARPU : total Mobile Voice and Mobile data revenues (inbound and outbound), of both Prepaid and Postpaid customers, divided
by the average number of active Prepaid and Postpaid customers for that period, divided by the number of months of that same period. This
also includes MVNO’s but excludes M2M.
Broadband access channels: ADSL, VDSL and Fiber lines. For Consumer this also contains the Belgian residential lines of Scarlet.
Broadband ARPU: total Internet underlying revenue, excluding activation and installation fees, divided by the average number of Internet lines
for the period considered, divided by the number of months in that same period.
BICS: international carrier activities, a joint venture of Proximus, Swisscom and MTN in which Proximus owns 57.6%
Capex: this corresponds to the acquisitions of intangible assets and property, plant and equipment
Consumer: addressing the residential and small businesses (less than 10 employees) market, including Customer Operations Unit.
Cost of Sales: the costs of materials and charges related to revenues
Direct margin: the result of cost of sales subtracted from the revenues, expressed in absolute value or in % of revenues.
Domestic: defined as the Proximus Group excluding BICS
EBITDA: Earnings Before Interest, Taxes, Depreciations and Amortization; corresponds to Revenue minus Cost of sales, workforce and non-
workforce expenses and non-recurring expenses.
EBIT: Earnings Before Interest & Taxes, corresponds to EBITDA minus depreciations and amortizations
Enterprise: segment addressing the professional market including small businesses with more than 10 employees
Fixed Voice access channels: PSTN, ISDN and IP lines. For Enterprise specifically, this also contains the number of Business Trunking lines
(solution for the integration of Voice and Data traffic on one single Data network.)
Fixed Voice ARPU: total Voice underlying revenue, excluding activation related revenue, divided by the average Voice access channels for the
period considered, divided by the number of months in that same period.
FCF: Free Cash Flow. This is cash flow before financing activities.
General and Administrative expenses (G&A): Domestic expenses excluding Marketing, Sales and Servicing and Network and IT expenses, i.e.
mainly overhead.
ICT: Information and Communications Technology (ICT) is an extended term for information technology (IT) which stresses the role of unified
communications and the integration of telecommunications (telephone lines and wireless signals), computers as well as necessary enterprise
software, middleware, storage, and audio-visual systems, which enable users to access, store, transmit, and manipulate information. Proximus’
ICT solutions include, but are not limited to, Security, Cloud, “Network & Unified Communication”, “Enterprise Mobility Management” and
“Servicing and Sourcing”.
Incidental: adjustments for material(**) items including gains or losses on the disposal of consolidated companies, fines and penalties imposed
by competition authorities or by the regulator, costs of employee restructuring programs, the effect of settlements of post-employment benefit
plans with impacts for the beneficiaries and other items that are outside the scope of usual business operations. These other items include
divestments of consolidated activities, gains and losses on disposal of buildings, transaction costs related to M&A (acquisitions, mergers,
divestments etc.), deferred M&A purchase price, pre-identified one shot projects (such as rebranding costs), changes of accounting treatments
(such as the application of IFRIC 21), financial impacts of litigation files, fines and penalties, financial impact of law changes (one-off impact
relative to previous years), recognition of previously unrecognized assets and impairment losses.
(**) The materiality threshold is met when exceeding individually EUR 5 million. No materiality threshold is defined for costs of employee
restructuring programs, the effect of settlements of post-employment benefit plans with impacts for the beneficiaries, divestments of
consolidated companies, gains and losses on disposal of buildings and M&A-related transaction costs. No threshold is used for adjustments in a
subsequent quarter of the same year if the threshold was met in a previous quarter.
Marketing, Sales and Servicing expenses: all expenses related to Consumer, Enterprise and Wholesale customers, including remote servicing.
45 Consolidated Financial Statements & Additional information
Mobile customers: Voice and Data cards as well as Machine-to-Machine, and excludes all free Data cards. Active Prepaid customers are
customers who have made or received at least one call and/or sent or received at least one SMS message in the last three months. A M2M card
is considered active if at least one Data connection has been made in the last month. Postpaid customers paying a monthly subscription are per
default active.
Mobile ARPU: Monthly ARPU is equal to total Mobile Voice and Mobile Data revenues (inbound and outbound, visitor roaming excluded), divided
by the average number of Active Mobile Voice and Data customers for that period, divided by the number of months of that same period. This
also includes MVNO’s but excludes M2M.
Multi-play household (including Small Offices): two or more Plays, not necessarily in a Pack.
Net debt: refers to the total interest bearing debt (short term + long term) minus cash and cash equivalents.
Network and IT expenses: all IT and Network related expenses, including interventions at customer premises.
Non Workforce expenses: all operating expenses excluding workforce expenses, and excluding depreciation and amortization and non-recurring
expenses.
Play: a subscription to either Fixed Voice, Fixed Internet, dTV or Mobile Postpaid (paying Mobile cards). A 4-Play customer subscribes to all four
services.
Revenue-Generating Unit (RGU): for example, a household with Fixed Internet and 2 Mobile Postpaid cards is considered as a 2-Play household
with 3 RGUs.
Reported Revenues: this corresponds to the TOTAL INCOME.
TV ARPU: includes only customer-related underlying revenue and takes into account promotional offers, excluding activation and installation
fees, divided by the number of households with Proximus or Scarlet TV.
Underlying: refers to adjusted Revenue and EBITDA (Total Income and Operating Income before Depreciation and Amortization) for incidentals
in order to properly assess the ongoing business performance.
Wholesale: Proximus’ unit addressing the telecom wholesale market including other telecom operators (incl. MVNO) and ISP’s.
Workforce expenses: Expenses related to own employees (personnel expenses and pensions) as well as to external employees. For
subsidiaries, Workforce expenses include internal personnel expenses and pensions only.
X-Play: the sum of single play (1-play) and multi-play (2-play + 3-play + 4-play).
The Proximus Executive Committee declares that to the best of its knowledge, the interim condensed
consolidated financial statements, established in accordance with International Financial Reporting
Standards (“IFRS”) as adopted by the EU, give a true and fair view of the assets, financial position and
results of Proximus and of the entities included in the consolidation. The financial report gives an accurate
overview of the information that needs to be disclosed. The Executive Committee is represented by
Dominique Leroy, Chief Executive Officer, Sandrine Dufour, Chief Financial Officer, Bart Van Den
Meersche, Chief Enterprise Market Officer, Guillaume Boutin, Chief Consumer Market Officer, Geert
Standaert, Chief Technology Officer, Renaud Tilmans, Chief Customer Operations Officer, Jan Van
Acoleyen, Chief Human Resources Officer and Dirk Lybaert, Chief Corporate Affairs Officer.
8 October 2018 Start of quiet period ahead of Q3 2018 results 26 October 2018 Announcement of Q3 2018 results 21 January 2019 Start of quiet period ahead of Q4 2018 results 1 March 2019 Announcement of Q4 2018 results
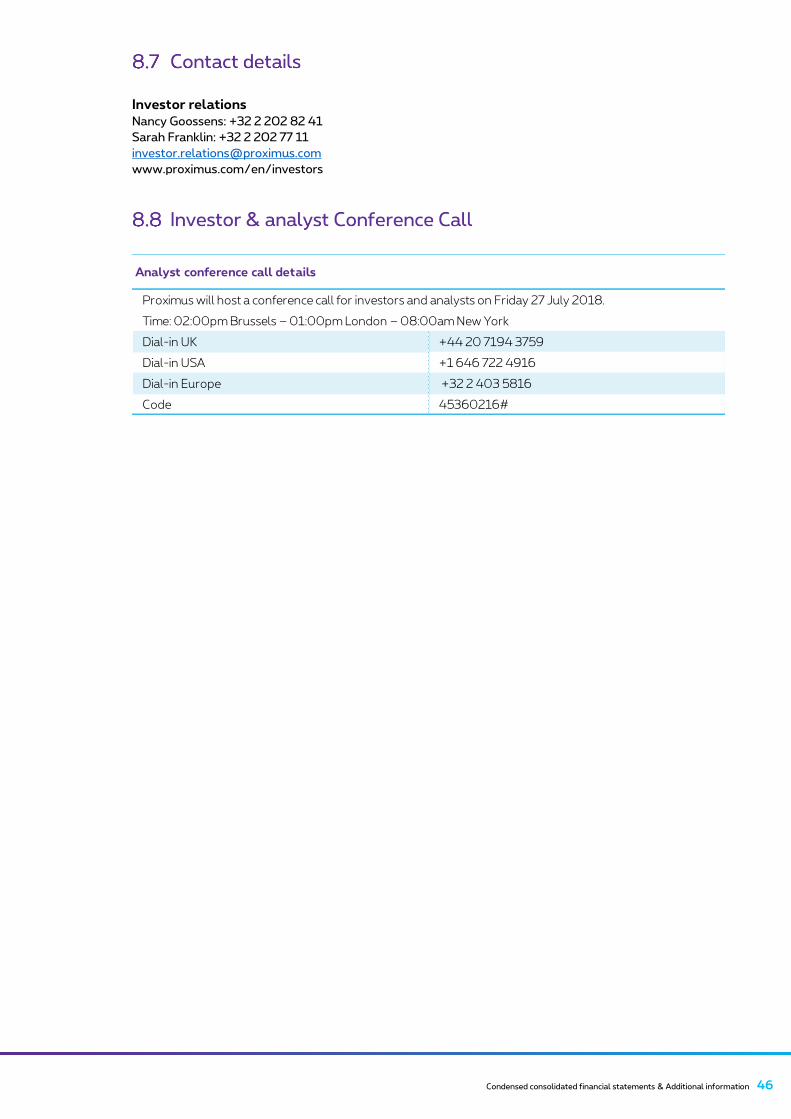
Condensed consolidated financial statements & Additional information 46
Investor relations Nancy Goossens: +32 2 202 82 41
Sarah Franklin: +32 2 202 77 11
www.proximus.com/en/investors
Analyst conference call details
Proximus will host a conference call for investors and analysts on Friday 27 July 2018.
Time: 02:00pm Brussels – 01:00pm London – 08:00am New York
Dial-in UK +44 20 7194 3759
Dial-in USA +1 646 722 4916
Dial-in Europe +32 2 403 5816
Code 45360216#