quarterly report on the results for the first quarter...
TRANSCRIPT

Quarterly report on the results for the second quarter and half year ended September 30, 2016
Bharti Infratel Limited (Incorporated as a public limited company on November 30, 2006 under the Companies Act, 1956)
Bharti Crescent, 1, Nelson Mandela Road, Vasant Kunj, Phase II, New Delhi – 110 070, India
October 24, 2016
The financial statements included in this quarterly report fairly present in all material respects the financial position, results of operations, cash flow of the Company as of and for the periods presented in this report.
`

Page 2 of 63
Supplemental Disclosures
Safe Harbor: - Some information in this report may contain forward-looking statements. We have based these forward-looking statements on our current beliefs, expectations and intentions as to facts, actions and events that will or may occur in the future. Such statements generally are identified by forward-looking words such as “believe,” “plan,” “anticipate,” “continue,” “estimate,” “expect,” “may,” “will” or other similar words. A forward-looking statement may include a statement of the assumptions or basis underlying the forward-looking statement. We have chosen these assumptions or basis in good faith, and we believe that they are reasonable in all material respects. However, we caution you that forward-looking statements and assumed facts or bases almost always vary from actual results, and the differences between the results implied by the forward-looking statements and assumed facts or bases and actual results can be material, depending on the circumstances. You should also keep in mind that any forward-looking statement made by us in this report or elsewhere speaks only as of the date on which we made it. New risks and uncertainties come up from time to time, and it is impossible for us to predict these events or how they may affect us. We have no duty to, and do not intend to, update or revise the forward-looking statements in this report after the date hereof. In light of these risks and uncertainties, any forward-looking statement made in this report or elsewhere may or may not occur and has to be understood and read along with this supplemental disclosure. General Risk: - Investment in equity and equity related securities involves a degree of risk and investors should not invest any funds in this Company without necessary diligence and relying on their own examination of Bharti Infratel Limited; along with the equity investment risk which doesn't guarantee capital protection. Use of Certain Non GAAP measures: - This result announcement contains certain information on the Company’s results of operations and cash flows that have been derived from amounts calculated in accordance with Indian Accounting Standards (IND AS) i.e. Non-GAAP measures. They should not be viewed in isolation as alternatives to the equivalent IND AS measures and should be read in conjunction with the equivalent IND AS measures.
Further, disclosures are also provided under “Use of Non – GAAP financial information” on page 24 Others: In this report, the term “Bharti Infratel” or “Infratel” or “the Company” refers to Bharti Infratel Limited, whereas references to “we”, “us”, “our”, “the Group” and other similar terms, unless otherwise specified or the context otherwise implies, refer to Bharti Infratel Limited taken together with its wholly owned subsidiary, Bharti Infratel Ventures Limited and Bharti Infratel’s 42% equity interest in Indus Towers Limited till FY12-13. Pursuant to filing the Order of Hon’ble High Court with Registrar of Companies (ROC) on June 11, 2013, Bharti Infratel Ventures Limited has been merged with Indus Towers Limited as of that date. With effect from FY 13-14, references to “we”, “us”, “our”, “the Group” and other similar terms, unless otherwise specified or the context otherwise implies, refer to Bharti Infratel Limited taken together with its wholly owned subsidiary, Bharti Infratel Services Limited (which was incorporated on June 4, 2013 and received Certificate for Commencement of Business on August 13, 2013) and Bharti Infratel’s 42% equity interest in Indus Towers Limited. With effect from January 2015, Bharti Infratel Employee Welfare Trust (incorporated for allotment of shares to employees as part of Employee Stock Option Plan) has been included as part of the group. With effect from September 2015, Smartx Services Ltd (incorporated on September 21, 2015 as a wholly owned subsidiary) has been included as a part of the group. Effective 29
th March 2016, Bharti Infratel Services
Limited has been closed pursuant to Board’s decision to initiate the process of striking off the name of the company from the register of ROC. Disclaimer: - This communication does not constitute an offer of securities for sale in the United States. Securities may not be sold in the United States absent registration or an exemption from registration under the U.S. Securities Act of 1933, as amended. Any public offering of securities to be made in the United States will be made by means of a prospectus and will contain detailed information about the Company and its management, as well as financial statements.
Page 3 of 63
TABLE OF CONTENTS
Section A Consolidated Results 4
Section 1 Bharti Infratel – Performance at a glance 5
Section 2 An Overview 6
Section 3 Proforma Financial Highlights
3.1 Summary of Proforma Consolidated Financial Statements 10
3.2 Summarized Statement of Proforma Group Consolidation- Statement of Operations 11
3.3 Summarized Statement of Proforma Group Consolidation- Statement of Financial Position 13
Section 4 Operating Highlights 14
Section 5 Management Discussion & Analysis
5.1
5.2
Key Industry Developments
Key Company Developments
16
16
5.3 Results of Operations 17
5.4 Three Line Graph 18
Section 6 Stock Market Highlights 19
Section 7
Detailed Proforma Financial and Related Information
21
Section 8 Trends & Ratios 26
Section B Interim Consolidated IND AS Financial Statements 31
Section 9 Financial Highlights 32
Section C Transition to IND AS 36
Section 10 Key Accounting Changes 37
Section 11 IGAAP to IND AS Reconciliation Statements 40
Section 12 Walk - IND AS Consolidated Results to Proforma Consolidated Results 44
Section D Key Accounting Policies and Glossary 46
Section 13 Basis of Preparation and Key Accounting Policies as per IND AS 47
Section 14 Glossary 59
Page 4 of 63
Section A
Consolidated Results
The Group has adopted IND AS w.e.f. April 1, 2016 with transition date being April 1, 2015 in accordance with the requirements under Section 133 of the Companies Act, 2013. Accordingly, the consolidated financial statements under IND AS include the share of Joint-Venture on the basis of Equity Method of accounting. In the past, we have been presenting our consolidated financial results based on proportionate consolidation approach as required under previous GAAP. To ensure continuity of comparison, this section A includes Proforma audited consolidated financial results as per proportionate consolidation method based on segment information in the audited consolidated financial statement of IND AS and underlying information.

Page 5 of 63
Section-1
BHARTI INFRATEL – PERFORMANCE AT A GLANCE 5
1. Revenue, EBITDA, EBIT, Operating free cash flow and Adjusted Fund from Operations (AFFO) are excluding other income. 2. EBITDA, EBIT and Net profit margin have been computed on revenue excluding other income. 3. Profit after tax excludes impact of Other Comprehensive Income 4. Previous periods’ figures have been regrouped/ rearranged wherever necessary to confirm to current period classifications 5. The Company has disclosed the above proforma consolidated financials (other than for FY2014 and FY2015) as per proportionate consolidation method based on
segment information in the audited consolidated financial statement of IND AS and underlying information. Proforma consolidated financials (using proportionate consolidation method) for FY2014 and FY2015 are based on agreed upon procedure report of the auditors on previous GAAP audited financial information adjusted with the impact of adjustments due to IND AS accounting policies for these years.
2014 2015 2016 Sep 2015 Dec 2015 Mar 2016 Jun 2016 Sep 2016
Consolidated Operating Highlights
Total Towers Nos 83,368 85,892 88,808 87,184 88,055 88,808 89,352 89,791
Total Co-locations Nos 167,202 182,294 195,035 188,636 191,921 195,035 196,401 198,795
Average Sharing factor Times 1.96 2.06 2.16 2.15 2.17 2.19 2.20 2.21
Closing Sharing factor Times 2.01 2.12 2.20 2.16 2.18 2.20 2.20 2.21
Sharing Revenue per Tower per month Rs 64,190 69,148 74,514 73,979 75,299 76,602 76,987 77,197
Sharing Revenue per Sharing Operator per month Rs 32,798 33,488 34,499 34,349 34,674 35,012 35,040 34,994
Financials
Revenue1 Rs Mn 106,199 115,646 123,314 30,410 31,056 31,817 32,107 32,919
EBITDA1 Rs Mn 42,106 49,215 54,480 13,167 13,680 14,687 14,082 14,537
EBIT1 Rs Mn 21,103 27,572 31,873 7,533 8,097 8,798 8,298 8,869
Finance Cost (Net) Rs Mn 3,347 (3,364) (1,847) (1,675) 292 (1,029) (1,282) (2,472)
Profit before Tax Rs Mn 22,177 36,074 35,768 9,772 8,292 10,260 9,931 11,674
Profit after Tax3 Rs Mn 13,332 22,027 22,474 5,917 4,950 7,184 7,562 7,738
Capex Rs Mn 15,547 20,492 21,243 5,916 5,417 5,007 4,416 5,112
-of Which Maintenance & General Corporate Capex Rs Mn 4,071 5,116 4,753 1,194 1,166 966 1,359 1,178
Operating Free Cash Flow1 Rs Mn 26,255 29,106 32,881 7,150 8,180 9,578 9,577 9,321
Adjusted Fund From Operations(AFFO)1
Rs Mn 37,730 44,482 49,371 11,872 12,431 13,618 12,633 13,255
Total Capital Employed Rs Mn 119,245 112,320 121,849 121,803 121,301 121,849 121,330 118,052
Net Debt / (Net Cash) Rs Mn (56,039) (63,981) (60,413) (49,327) (54,259) (60,413) (68,058) (52,009)
Shareholder's Equity Rs Mn 175,284 176,301 182,262 171,130 175,559 182,262 189,388 170,061
Key Ratios
EBITDA Margin2 % 39.6% 42.6% 44.2% 43.3% 44.0% 46.2% 43.9% 44.2%
EBIT Margin2 % 19.9% 23.8% 25.8% 24.8% 26.1% 27.7% 25.8% 26.9%
Net Profit Margin2 % 12.6% 19.0% 18.2% 19.5% 15.9% 22.6% 23.6% 23.5%
Net Debt / (Net Cash) to EBITDA (LTM) Times (1.33) (1.30) (1.11) (0.95) (1.02) (1.11) (1.22) (0.91)
Interest Coverage ratio (LTM) Times 8.94 13.65 18.50 15.63 17.01 18.50 19.93 20.76
Return on Capital Employed (LTM) Pre Tax % 15.1% 23.8% 27.2% 25.1% 26.1% 27.2% 26.0% 28.4%
Return on Shareholder's Equity (LTM) Pre Tax % 12.7% 20.5% 20.0% 22.2% 20.2% 20.0% 20.7% 23.5%
Return on Shareholder's Equity (LTM) Post tax % 7.6% 12.5% 12.5% 13.4% 12.0% 12.5% 13.9% 16.1%
Valuation Indicators
Market Capitalization Rs Bn 384 729 724 674 812 724 654 676
Enterprise Value Rs Bn 328 665 664 624 758 664 586 624
EV / EBITDA (LTM ) Times 7.80 13.51 12.19 12.02 14.29 12.19 10.54 10.94
EPS (Diluted) Rs 6.72 11.63 11.85 3.12 2.61 3.79 3.99 4.14
PE Ratio Times 30.25 33.10 32.23 29.94 38.93 32.23 25.55 25.14
Particulars UNITS
Full Year Ended4 Quarter Ended
4
Page 6 of 63
Section 2
AN OVERVIEW
2.1 Industry Overview
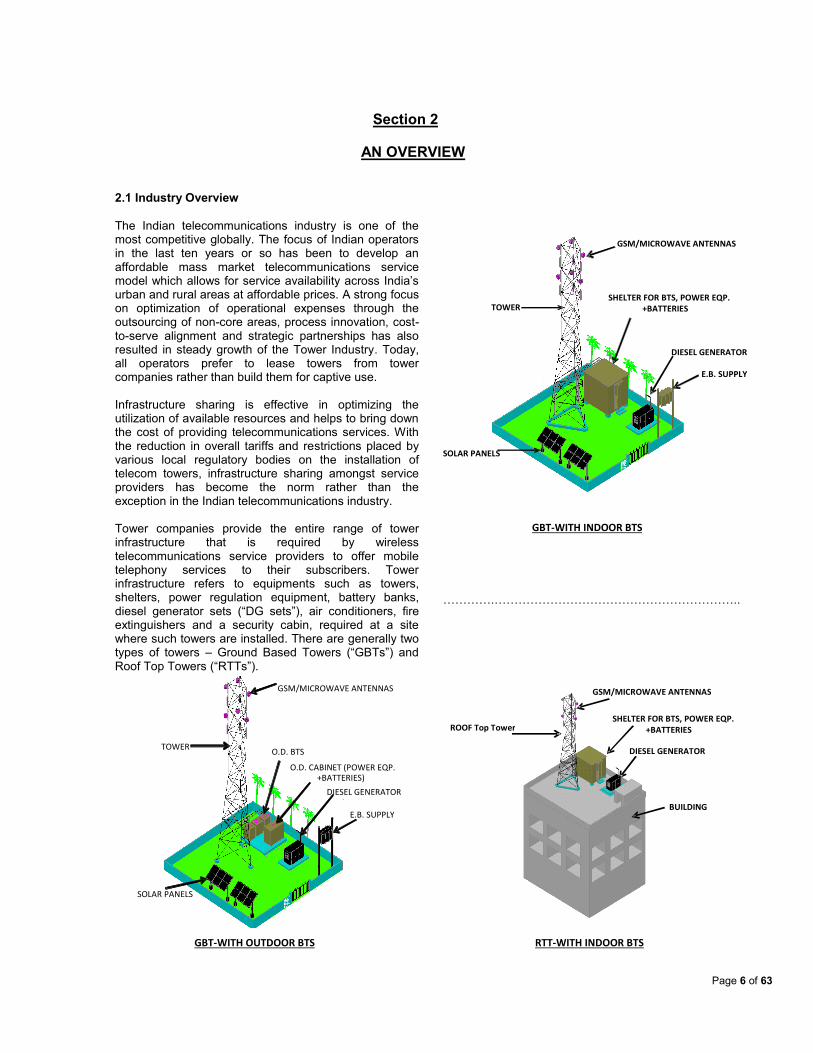
The Indian telecommunications industry is one of the most competitive globally. The focus of Indian operators in the last ten years or so has been to develop an affordable mass market telecommunications service model which allows for service availability across India’s urban and rural areas at affordable prices. A strong focus on optimization of operational expenses through the outsourcing of non-core areas, process innovation, cost-to-serve alignment and strategic partnerships has also resulted in steady growth of the Tower Industry. Today, all operators prefer to lease towers from tower companies rather than build them for captive use. Infrastructure sharing is effective in optimizing the utilization of available resources and helps to bring down the cost of providing telecommunications services. With the reduction in overall tariffs and restrictions placed by various local regulatory bodies on the installation of telecom towers, infrastructure sharing amongst service providers has become the norm rather than the exception in the Indian telecommunications industry. Tower companies provide the entire range of tower infrastructure that is required by wireless telecommunications service providers to offer mobile telephony services to their subscribers. Tower infrastructure refers to equipments such as towers, shelters, power regulation equipment, battery banks, diesel generator sets (“DG sets”), air conditioners, fire extinguishers and a security cabin, required at a site where such towers are installed. There are generally two types of towers – Ground Based Towers (“GBTs”) and Roof Top Towers (“RTTs”).
………….……………………………………………………..
TOWER
TOWER
ROOF Top Tower
GSM/MICROWAVE ANTENNAS
GSM/MICROWAVE ANTENNAS
GSM/MICROWAVE ANTENNAS
O.D. BTS
SOLAR PANELS
SHELTER FOR BTS, POWER EQP.
SOLAR PANELS
DIESEL GENERATOR
+BATTERIES
DIESEL GENERATOR
SHELTER FOR BTS, POWER EQP.
DIESEL GENERATOR
E.B. SUPPLY
+BATTERIES
BUILDING
O.D. CABINET (POWER EQP.
E.B. SUPPLY
+BATTERIES)
GBT-WITH OUTDOOR BTS
GBT-WITH INDOOR BTS
RTT-WITH INDOOR BTS

Page 7 of 63
Average specifications for GBT and RTT are summarized in the following table:
GBT RTT
Space Requirement
4,000 Sq. Ft. Roof Top
Height (m) 40-60 14-20
Occupancy Capacity
3-5 co-location 2-3 co-location
There are two kinds of infrastructure that constitute a telecom tower:
Active Infrastructure: Radio antenna, BTS/cell site, cables etc that are owned and supplied by telecom operators Tower Infrastructure: Steel tower, shelter room, DG set, Power regulation equipment, Battery bank, security cabin etc. that supports active infrastructure.
2.2 Company Overview
Bharti Infratel is a provider of tower and related infrastructure sharing services. On a consolidated basis, we are one of the largest PAN India tower infrastructure providers, based on the number of towers owned and operated by Bharti Infratel and Indus, that are represented by Bharti Infratel’s 42% equity interest in Indus. The business of Bharti Infratel and Indus is to acquire, build, own and operate tower and related infrastructure. Bharti Infratel and Indus provide access to their towers primarily to wireless telecommunications service providers on a shared basis, under long-term contracts. Bharti Infratel’s and Indus’s three largest customers are Bharti Airtel (together with Bharti Hexacom), Vodafone India and Idea Cellular, which are the three leading wireless telecommunications service providers in India by wireless revenue.
We have a nationwide presence with operations in all 22 telecommunications Circles in India, with Bharti Infratel and Indus having operations in 4 overlapping Circles. As of September 30, 2016, Bharti Infratel owned and operated 38,832 towers with 83,085 co-locations in 11 telecommunications Circles while Indus operated 1,21,330 towers with 2,75,499 co-locations in 15 telecommunications Circles. With Bharti Infratel’s towers and Bharti Infratel’s 42% interest in Indus, we have an economic interest in the equivalent of 89,791 towers and 1,98,795 co-locations in India as of September 30, 2016.
We have entered into MSAs with our customers. The MSAs are long-term contracts which set out the terms on which access is provided to Bharti Infratel’s and Indus’s towers, with all service providers being offered substantially the same terms and receiving equal treatment at towers where they have installed their active infrastructure. Under the MSAs, Bharti Infratel and Indus enter into service contracts in respect of individual towers. The MSAs and service contracts govern Bharti Infratel’s and Indus’s relationship with their customers; the services provided, the applicable charges and incorporate annual escalation clauses in respect of the applicable charges. This provides stability to our business and provides visibility with regard to future revenues. Relationship with Indus
In order to capitalize on the opportunities for tower sharing in the Indian telecommunications market, Bharti Airtel, Bharti Infratel, Vodafone India and Idea Cellular agreed to establish Indus as an independently managed joint venture that provides non-discriminatory shared tower services to all wireless telecommunications service providers. In furtherance of this joint venture, the parties also agreed to contribute certain identified towers to Indus and to use the services of Indus in the first instance for any new rollout of telecommunications towers or co-locations in 15 telecommunications circles. In this context, Indus was incorporated in November 2007 and Bharti Airtel, Bharti Infratel, Vodafone India (certain of its subsidiaries), Idea Cellular and Idea Cellular Infrastructure entered into the Indus Share

Page 8 of 63
Holders Agreement (SHA) to govern their relationship with respect to Indus and its day-to-day operations and the Framework Agreement, which sets out among other things, the basis on which towers were to be contributed to Indus by the respective parties. In accordance with the Framework Agreement, Bharti Infratel, Vodafone India and Aditya Birla Telecom hold a 42%, 42% and 16% shareholding interest in Indus, respectively. The Indus SHA provides that Indus cannot carry on business in the seven telecommunications Circles in which Bharti Infratel currently operates exclusive of Indus. Similarly, subject to certain exceptions, the joint venture partners are not permitted to, among other things (a) compete with the business of Indus in the 15 specified telecommunications Circles that Indus currently operates in, (b) develop, construct or acquire any tower in the 15 specified telecommunications Circles that Indus currently operates in and (c) directly or indirectly procure orders from or do business with any entity that has been a customer of Indus during the previous two year period in competition with the business of Indus in the 15 specified telecommunications Circles that Indus currently operates in.
Bharti Infratel entered into an indefeasible right to use agreement with Indus in December 2008. Pursuant to this agreement, Bharti Infratel granted Indus an IRU in relation to certain of its towers in the telecommunications Circles of Mumbai, Kolkata, Maharashtra, Tamil Nadu (including Chennai), Kerala, Gujarat, Delhi, Karnataka, Andhra Pradesh, Punjab and West Bengal, which it was to contribute to Indus in accordance with the terms of the Framework Agreement. Consequent to the transfer of towers by Bharti Infratel to Bharti Infratel Ventures Limited, the IRU with Bharti Infratel was transferred to Bharti Infratel Ventures Limited (the “BIVL IRU”) in respect of these towers. Similarly, the other joint venture partners had entered into similar IRU arrangements with Indus, which have been transferred to their respective tower infrastructure entities, and on the basis of which Indus operates and derives revenues from the towers that are to be contributed to it.
On the basis of the relationship as described above, Bharti Infratel and Indus do not compete with each other in any telecommunications Circle, they do not have any conflicts of interest in this regard and are able to work closely with each other and benefit from the synergies generated by the nationwide coverage and large scale of their operations.
Pursuant to filing the Order of Hon’ble High Court of Delhi with Registrar of Companies (ROC) on June 11, 2013, Bharti Infratel Ventures Limited has been merged with Indus Towers Limited as of that date. Please refer to the section “Indus Merger” in the glossary for further details. Pursuant to the Indus Merger, the IRU arrangements between BIVL and Indus Towers Ltd. cease to exist.
Market Share
As per a recent report ‘Indian Tower Industry: The Future is Data – June 2015’ by Deloitte, Bharti Infratel and Indus Towers together have a market share of 40.8% and 48.6% for towers and co-locations respectively.
Share of Towers
Share of Co-locations
Future visibility on revenues & cash flows
Bharti Infratel has assured future revenues and cash flows because of the following key competitive strengths:
A leading telecommunications infrastructure
operator in India, with large scale, nationwide operations in an industry with entry barriers.
Extensive presence in all telecommunications Circles with high growth potential
Long term contracts with leading wireless telecommunications service providers in India, providing visibility on future revenues.
On a consolidated basis, the estimated weighted average remaining life of service contracts, entered

Page 9 of 63
into with telecommunications service providers, as on September 30, 2016 is 6.69 Years.
Comprehensive deployment and operational experience supported by well-developed processes, systems and IT infrastructure.
Alternate Energy and Energy Conservation Measures
Bharti Infratel believes that a healthy environment is a prerequisite for progress, contributing to the well-being of society, our people and our business, and serving as the foundation for a sustainable and strong economy. In line with the vision of being known for Environmental Friendliness, the Company continues to deploy people, ideas and capital to help find effective solutions to environmental issues.
Bharti Infratel has initiated Green Towers P7 program based on seven ideas aimed at minimizing dependency on diesel and, thereby, carbon footprint reduction. This program promotes (a) improving energy efficiency of tower infrastructure equipment, (b) use of renewable energy resources, and (c) reduction of equipment load on tower infrastructure equipment. Some of the key initiatives taken so far are: Solar Photovoltaic (PV) Solutions: As of September
30, 2016, we operate ~3,070 solar-powered sites across the network on a consolidated basis, which helps in reducing noise and emissions from DG sets and also in reducing dependency on diesel, thereby contributing towards better energy security. The Company is working towards scaling up the solar installations across the network.
Further, we are partnering with Renewable Energy Service Companies in our efforts towards powering our towers using renewable energy along with community power development, in rural areas.
Adoption of Integrated Power Management Solutions (IPMS) and Plug and Play Cabinets (PPC) as part of standard configuration for new tower deployment to ensure effective utilization of grid power supply on the towers.
Comprehensive program to ensure zero diesel consumption at our tower sites. On a consolidated basis, over 30,000 towers across our network are green.
We believe that these renewable energy initiatives, energy efficiency measures and load optimization methods will continue to have long-term benefits to our business, securing us against rising power and fuel costs as well as reducing the environmental impact of our operations. For Operating highlights and details refer Page no. 14

Page 10 of 63
Section 3
PROFORMA FINANCIAL HIGHLIGHTS
The proforma audited financial results presented in this section are prepared as per proportionate consolidation method based on segment information in the audited consolidated financial statement of IND AS and underlying information.
Detailed financial statements, analysis & other related information is attached to this report (Page 21). Also, kindly refer to section 7.3 – use of Non GAAP financial information (Page 24) and Glossary (Page 59) for detailed definitions.
3.1 Summary of Proforma Consolidated Financial Statements
3.1.1. Summarized Consolidated Statement of Operations (net of inter-company eliminations)
1. Revenue, EBITDA, EBIT, Operating free cash flow and Adjusted Fund from Operations (AFFO) are excluding other income. 2. EBITDA margin has been computed on revenue excluding other income. 3. Profit after tax excludes impact of Other Comprehensive Income.
3.1.2. Summarized Statement of Consolidated Financial Position
Amount in Rs mn, except ratios
Quarter Ended Half Year Ended
Sep-16 Sep-15Y-on-Y
GrowthSep-16 Sep-15
Y-on-Y
Growth
Revenue1 32,919 30,410 8% 65,026 60,441 8%
EBITDA1 14,537 13,167 10% 28,619 26,113 10%
EBITDA Margin2 44.2% 43.3% 44.0% 43.2%
EBIT1 8,869 7,533 18% 17,167 14,978 15%
Other Income 333 564 -41% 684 1,128 -39%
Finance cost (Net) (2,472) (1,675) -48% (3,754) (1,109) -239%
Profit before Tax 11,674 9,772 19% 21,605 17,215 26%
Income tax Expense 3,936 3,855 2% 6,305 6,875 -8%
Profit after Tax3 7,738 5,917 31% 15,300 10,340 48%
Capex 5,112 5,916 -14% 9,527 10,819 -12%
Operating Free Cash Flow1 9,321 7,150 30% 18,898 15,123 25%
Adjusted Fund From Operations(AFFO)1 13,255 11,872 12% 25,887 23,322 11%
Cumulative Investments 285,213 274,171 4% 285,213 274,171 4%
Particulars
Amount in Rs. mn
As at As at
Sep 30, 2016 March 31, 2016
Shareholder's Fund
Share capital 18,496 18,967
Other Equity 151,565 163,295
170,061 182,262
Non-current liabilities 29,068 32,995
Current liabilities 38,631 29,520
Total liabilities 67,699 62,515
Total Equity and liabilities 237,760 244,777
Assets
Non-current assets 206,116 182,442
Current assets 31,644 62,335
Total assets 237,760 244,777
Particulars

Page 11 of 63
3.2 Summarized Statement of Proforma Group Consolidation- Statement of Operations
3.2.1 Bharti Infratel Consolidated (Quarter Ended Sep 30, 2016)
1. Revenue, EBITDA, EBIT, Operating free cash flow and AFFO are excluding other income. 2. EBITDA margin has been computed on revenue excluding other income. 3. Profit after tax excludes impact of Other Comprehensive Income. 4. Refer glossary for Indus Consolidation. 5. Infratel consolidated includes wholly owned subsidiary Smartx Services Ltd and Bharti Infratel Employee Welfare Trust.
3.2.2 Bharti Infratel Consolidated (Half Year Ended Sep 30, 2016)
1. Revenue, EBITDA, EBIT, Operating free cash flow and AFFO are excluding other income. 2. EBITDA margin has been computed on revenue excluding other income. 3. Profit after tax excludes impact of Other Comprehensive Income. 4. Refer glossary for Indus Consolidation. 5. Infratel consolidated includes wholly owned subsidiary Smartx Services Ltd and Bharti Infratel Employee Welfare Trust.
Amount in Rs mn, Except Ratios
Infratel
Standalone
Indus
Consolidation4 Eliminations
Infratel
Consol5
Revenue1
14,963 17,958 (2) 32,919
EBITDA1
6,919 7,618 - 14,537
EBITDA Margin2
46.2% 42.4% 44.2%
EBIT1
4,013 4,856 - 8,869
Other Income 187 146 - 333
Finance cost (Net) (3,062) 590 - (2,472)
Profit before Tax 7,262 4,412 - 11,674
Income tax expense 1,909 1,545 482 3,936
Profit after Tax3
5,353 2,867 (482) 7,738
Capex 2,179 2,933 - 5,112
Operating Free Cash Flow1
4,684 4,637 - 9,321
Adjusted Fund From Operations(AFFO)1 6,203 7,052 - 13,255
Cumulative Investments 132,661 152,552 - 285,213
Particulars
Quarter Ended Sep 30, 2016
Amount in Rs mn, Except Ratios
Infratel
Standalone
Indus
Consolidation3 Eliminations
Infratel
Consol4
Revenue1
29,494 35,544 (12) 65,026
EBITDA1
13,664 14,955 - 28,619
EBITDA Margin2
46.3% 42.1% 44.0%
EBIT1
7,744 9,423 - 17,167
Other Income 9,853 341 (9,510) 684
Finance cost (4,827) 1,073 - (3,754)
Profit before Tax 22,424 8,690 (9,509) 21,605
Income tax expense 2,302 3,053 950 6,305
Profit after Tax 20,122 5,637 (10,459) 15,300
Capex 4,180 5,347 - 9,527
Operating Free Cash Flow1
9,375 9,523 - 18,898
Adjusted Fund From Operations(AFFO)1
12,157 13,730 - 25,887
Cumulative Investments 132,661 152,552 - 285,213
Particulars
Half Year Ended Sep 30, 2016

Page 12 of 63
3.2.3 Bharti Infratel Standalone
1. Revenue, EBITDA, EBIT, Operating free cash flow & AFFO are excluding other income. 2. EBITDA margin has been computed on revenue excluding other income. 3. Profit after tax excludes impact of Other Comprehensive Income
3.2.4 Indus Consolidation
1. Revenue, EBITDA, EBIT, Operating free cash flow & AFFO are excluding other income. 2. EBITDA margin has been computed on revenue excluding other income. 3. Profit after tax excludes impact of Other Comprehensive Income
Amount in Rs mn, Except Ratios
Sep-16 Sep-15Y-on-Y
GrowthSep-16 Sep-15
Y-on-Y
Growth
Revenue1
14,963 13,726 9% 29,494 27,443 7%
EBITDA1
6,919 6,024 15% 13,664 12,102 13%
EBITDA Margin2
46.2% 43.9% 5% 46.3% 44.1% 5%
EBIT1
4,013 3,083 30% 7,744 6,294 23%
Other Income3
187 175 7% 9,853 538 1731%
Finance cost (Net) (3,062) (2,331) 31% (4,827) (2,463) 96%
Profit before Tax 7,262 5,589 30% 22,424 9,295 141%
Income tax expense 1,909 1,944 -2% 2,302 3,248 -29%
Profit after Tax3
5,353 3,645 47% 20,122 6,047 233%
Capex 2,179 2,511 -13% 4,180 5,426 -23%
Operating Free Cash Flow1
4,684 3,463 35% 9,375 6,588 42%
Adjusted Fund From Operations(AFFO)1 6,203 5,280 17% 12,157 10,571 15%
Cumulative Investments 132,661 130,069 2% 132,661 130,069 2%
Particulars
Quarter Ended Half Year Ended
Amount in Rs mn, Except Ratios
Sep-16 Sep-15Y-on-Y
GrowthSep-16 Sep-15
Y-on-Y
Growth
Revenue1
17,958 16,693 8% 35,544 33,016 8%
EBITDA1
7,618 7,143 7% 14,955 14,011 7%
EBITDA Margin2
42.4% 42.8% -1% 42.1% 42.4%
EBIT1
4,856 4,450 9% 9,423 8,684 9%
Other Income 146 389 -62% 341 590 -42%
Finance cost (Net) 590 656 -10% 1,073 1,354 -21%
Profit before Tax 4,412 4,183 5% 8,690 7,921 10%
Income tax expense 1,545 1,450 7% 3,053 2,755 11%
Profit after Tax3
2,867 2,733 5% 5,637 5,166 9%
Capex 2,933 3,405 -14% 5,347 5,393 -1%
Operating Free Cash Flow1
4,637 3,687 26% 9,523 8,535 12%
Adjusted Fund From Operations(AFFO)1 7,052 6,591 7% 13,730 12,751 8%
Cumulative Investments 152,552 144,102 6% 152,552 144,102 6%
Particulars
Quarter Ended Half Year Ended

Page 13 of 63
3.3 Summarized Statement of Group Consolidation- Statement of Financial Position
1. Refer glossary for Indus Consolidation. 2. Infratel consolidated includes closing balances of assets/liabilities of wholly owned subsidiary Smartx Services Ltd and Bharti Infratel Employee Welfare Trust
Amount in Rs mn
Infratel
Standalone
Indus
Consolidation1 Eliminations
Infratel
Consol2
Shareholder's Fund
Share capital 18,496 1 (1) 18,496
Other Equity 163,981 49,727 (62,143) 151,565
182,477 49,727 (62,144) 170,061
Non-current liabilities 7,426 20,540 1,103 29,068
Current liabilities 14,425 24,284 (78) 38,631
Total liabilities 21,851 44,824 1,025 67,699
Total Equity and liabilities 204,328 94,551 (61,119) 237,760
Assets
Non-current assets 180,318 86,392 (60,594) 206,116
Current assets 24,010 8,159 (525) 31,644
Total assets 204,328 94,551 (61,119) 237,760
Particulars
As at Sep 30, 2016

Page 14 of 63
Section 4
OPERATING HIGHLIGHTS
The financial figures used for computing sharing revenue per sharing operator, sharing revenue per tower, revenue per employee per month, personnel cost per employee per month are based on IND AS. The consolidated financial figures are based on proforma audited financial results prepared as per proportionate consolidation method based on segment information in the audited consolidated financial statements of IND AS and underlying information. 4.1 Tower and Related Infrastructure Services 1. Represents the sum of the numbers of towers (and the co-locations thereof) owned and operated by Bharti Infratel and 42% of the number of towers (and the co-locations thereof) owned & operated by Indus Towers.
4.1.1 Bharti Infratel Consolidated
Parameters UnitSep 30,
2016
June 30,
2016
Q-on-Q
Growth
Sep 30,
2015
Y-on-Y
Growth
Total Towers1
Nos 89,791 89,352 438 87,184 2,606
Total Co-locations1
Nos 198,795 196,401 2,393 188,636 10,159
Key Indicators
Average Sharing Factor Times 2.21 2.20 2.15
Closing Sharing Factor Times 2.21 2.20 2.16
Sharing Revenue per Tower p.m Rs 77,197 76,987 0.3% 73,979 4.4%
Sharing Revenue per Sharing Operator p.m Rs 34,994 35,040 -0.1% 34,349 1.9%
4.1.2 Bharti Infratel Standalone
Parameters UnitSep 30,
2016
June 30,
2016
Q-on-Q
Growth
Sep 30,
2015
Y-on-Y
Growth
Total Towers Nos 38,832 38,642 190 37,801 1,031
Total Co-locations Nos 83,085 81,908 1,177 78,949 4,136
Key Indicators
Average Sharing Factor Times 2.13 2.12 2.08
Closing Sharing Factor Times 2.14 2.12 2.09
Sharing Revenue per Tower p.m Rs 80,646 79,801 1.1% 75,586 6.7%
Sharing Revenue per Sharing Operator p.m Rs 37,868 37,622 0.7% 36,422 4.0%
4.1.3 Indus Towers
Parameters UnitSep 30,
2016
June 30,
2016
Q-on-Q
Growth
Sep 30,
2015
Y-on-Y
Growth
Total Towers Nos 121,330 120,739 591 117,579 3,751
Total Co-locations Nos 275,499 272,603 2,896 261,159 14,340
Key Indicators
Average Sharing Factor Times 2.26 2.26 2.21
Closing Sharing Factor Times 2.27 2.26 2.22
Sharing Revenue per Tower p.m Rs 74,587 74,902 -0.4% 72,812 2.4%
Sharing Revenue per Sharing Operator p.m Rs 32,941 33,215 -0.8% 32,889 0.2%

Page 15 of 63
4.2 Human Resource Analysis
1.Total On Roll Employees include proportionate consolidation of 42% of Indus Towers Employees.
Note: Indus operates on outsourced operations & maintenance model in certain geographical territories wherein the associated personnel cost is recorded as part of repair & maintenance and other expenses. Hence, the related human resources key performance indicators are not strictly comparable between Bharti Infratel Standalone and Indus.
4.3 Residual Lease Period and Future Minimum Lease Receivable 4.3.1 Bharti Infratel Consolidated
4.2.1 Bharti Infratel Consolidated
Parameters UnitSep 30,
2016
June 30,
2016
Q-on-Q
Growth
Sep 30,
2015
Y-on-Y
Growth
Total On Roll Employees1
Nos 2,393 2,364 28 2,276 117
Number of Towers per Employee Nos 38 38 -0.7% 38 -2.0%
Personnel Cost per Employee per month Rs 164,117 162,352 1.1% 164,399 -0.2%
Revenue per Employee per month Rs 4,613,645 4,544,573 1.5% 4,578,171 0.8%
4.2.2 Bharti Infratel Standalone
Parameters UnitSep 30,
2016
June 30,
2016
Q-on-Q
Growth
Sep 30,
2015
Y-on-Y
Growth
Total On Roll Employees Nos 1,246 1,252 (6) 1,237 9
Number of Towers per Employee Nos 31 31 1.0% 31 2.0%
Personnel Cost per Employee per month Rs 179,877 186,251 -3.4% 179,916 0.0%
Revenue per Employee per month Rs 3,993,328 3,871,836 3.1% 3,730,398 7.0%
4.2.3 Indus Towers
Parameters UnitSep 30,
2016
June 30,
2016
Q-on-Q
Growth
Sep 30,
2015
Y-on-Y
Growth
Total On Roll Employees Nos 2,730 2,648 82 2,474 256
Number of Towers per Employee Nos 44 46 -2.5% 48 -6.5%
Personnel Cost per Employee per month Rs 147,024 134,965 8.9% 145,082 1.3%
Revenue per Employee per month Rs 5,300,263 5,309,838 -0.2% 5,634,192 -5.9%
Parameters Unit Sep 30, 2016
Average Residual Service Contract Period Yrs. 6.69
Minimum Lease Payment Receivable Rs. Mn 549,453
Page 16 of 63
Section 5
MANAGEMENT DISCUSSION AND ANALYSIS
5.1 Key Industry Developments 1. Consultation paper by TRAI on Broadband
through Public Wi-Fi
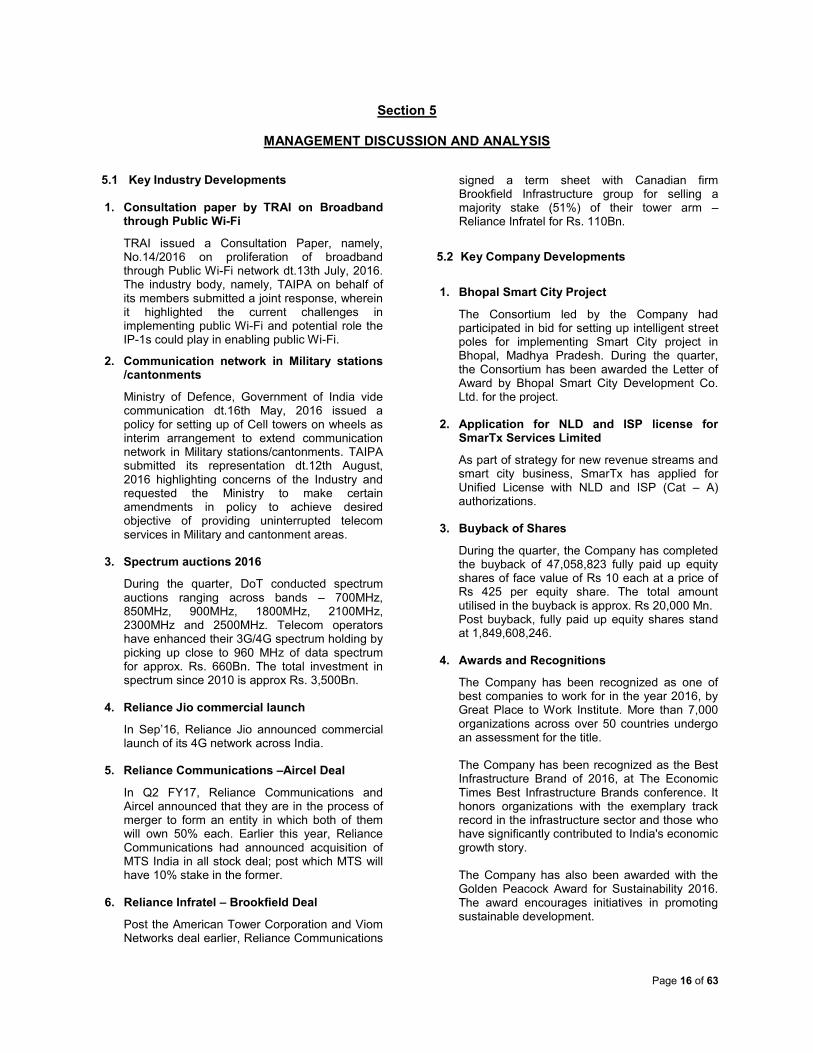
TRAI issued a Consultation Paper, namely, No.14/2016 on proliferation of broadband through Public Wi-Fi network dt.13th July, 2016. The industry body, namely, TAIPA on behalf of its members submitted a joint response, wherein it highlighted the current challenges in implementing public Wi-Fi and potential role the IP-1s could play in enabling public Wi-Fi.
2. Communication network in Military stations /cantonments
Ministry of Defence, Government of India vide communication dt.16th May, 2016 issued a policy for setting up of Cell towers on wheels as interim arrangement to extend communication network in Military stations/cantonments. TAIPA submitted its representation dt.12th August, 2016 highlighting concerns of the Industry and requested the Ministry to make certain amendments in policy to achieve desired objective of providing uninterrupted telecom services in Military and cantonment areas.
3. Spectrum auctions 2016
During the quarter, DoT conducted spectrum auctions ranging across bands – 700MHz, 850MHz, 900MHz, 1800MHz, 2100MHz, 2300MHz and 2500MHz. Telecom operators have enhanced their 3G/4G spectrum holding by picking up close to 960 MHz of data spectrum for approx. Rs. 660Bn. The total investment in spectrum since 2010 is approx Rs. 3,500Bn.
4. Reliance Jio commercial launch
In Sep’16, Reliance Jio announced commercial launch of its 4G network across India.
5. Reliance Communications –Aircel Deal
In Q2 FY17, Reliance Communications and Aircel announced that they are in the process of merger to form an entity in which both of them will own 50% each. Earlier this year, Reliance Communications had announced acquisition of MTS India in all stock deal; post which MTS will have 10% stake in the former.
6. Reliance Infratel – Brookfield Deal
Post the American Tower Corporation and Viom Networks deal earlier, Reliance Communications
signed a term sheet with Canadian firm Brookfield Infrastructure group for selling a majority stake (51%) of their tower arm – Reliance Infratel for Rs. 110Bn.
5.2 Key Company Developments
1. Bhopal Smart City Project
The Consortium led by the Company had participated in bid for setting up intelligent street poles for implementing Smart City project in Bhopal, Madhya Pradesh. During the quarter, the Consortium has been awarded the Letter of Award by Bhopal Smart City Development Co. Ltd. for the project.
2. Application for NLD and ISP license for SmarTx Services Limited
As part of strategy for new revenue streams and smart city business, SmarTx has applied for Unified License with NLD and ISP (Cat – A) authorizations.
3. Buyback of Shares
During the quarter, the Company has completed the buyback of 47,058,823 fully paid up equity shares of face value of Rs 10 each at a price of Rs 425 per equity share. The total amount utilised in the buyback is approx. Rs 20,000 Mn. Post buyback, fully paid up equity shares stand at 1,849,608,246.
4. Awards and Recognitions
The Company has been recognized as one of best companies to work for in the year 2016, by Great Place to Work Institute. More than 7,000 organizations across over 50 countries undergo an assessment for the title. The Company has been recognized as the Best Infrastructure Brand of 2016, at The Economic Times Best Infrastructure Brands conference. It honors organizations with the exemplary track record in the infrastructure sector and those who have significantly contributed to India's economic growth story. The Company has also been awarded with the Golden Peacock Award for Sustainability 2016. The award encourages initiatives in promoting sustainable development.

Page 17 of 63
5.3 Results of Operations
The proforma financial results presented in this section are prepared as per proportionate consolidation method based on segment information in the audited consolidated financial statement of IND AS and underlying information.
Key Highlights – For the quarter ended Sep 30, 2016
Consolidated tower base at 89,791
Consolidated co-locations at 198,795
Average sharing factor at the end of the quarter at 2.21 (L.Y. 2.15)
Consolidated Revenues at Rs. 32,919 Mn (up 8% Y-o-Y)
Consolidated EBITDA at Rs. 14,537 Mn (up 10% Y-o-Y)
Net profit1 at Rs. 7,738 Mn (up 31% Y-o-Y)
Operating Free Cash Flow (OFCF) at Rs. 9,321 Mn (up 30% Y-o-Y)
Adjusted Fund From Operations (AFFO) at Rs. 13,255 Mn (up 12% Y-o-Y) 1: Net Profit excludes impact of Other Comprehensive Income
5.3.1 Financial & Operational Performance
Bharti Infratel Consolidated Quarter Ended Sep 30, 2016 Tower and Co-Location base & additions
Net co-locations added during the quarter were 2,393 on consolidated basis and 1,177 on standalone basis. Net co-locations added during the quarter has impact of exits of 186 on consolidated basis and 73 on standalone basis. The consolidated tower and co-location base stands at 89,791 towers and 198,795 co-locations respectively. For the quarter ended Sep 30, 2016, Bharti Infratel and Indus had average sharing factors of 2.13 and 2.26 per tower, respectively.
Revenues1 from Operations
Our consolidated revenue comprises of primarily revenues from co-locations of Bharti Infratel and 42% economic Interest in Indus and their energy billings. Our consolidated revenue from operations for the quarter ended Sep 30, 2016 was Rs 32,919 million, a growth of 8.3% compared to the quarter ended Sep 30, 2015.
Operating Expenses
Our consolidated total expenses for the quarter ended Sep 30, 2016 were Rs 18,382 million, or 55.8% of our consolidated revenues from operations. The largest component of our consolidated expenses during this period was power and fuel, amounting to Rs 11,447 million. The other key expenses incurred by us during the quarter ended Sep 30, 2016 were rent of Rs 2,871 million, repair & maintenance (operations and maintenance costs of the network) of Rs 2,312 million and employee benefits expenses of Rs. 1,171 million.
EBITDA1, EBIT
1 & Finance Cost
For the quarter ended Sep 30, 2016, the Group had an EBITDA of Rs 14,537 million, a growth of 10.4% compared to the quarter ended Sep 30, 2015. EBITDA margin for the quarter was 44.2%.
During the quarter ended Sep 30, 2016, the Group had depreciation and amortization expenses of Rs 5,629 million or 17.1% of our consolidated revenues. The resultant EBIT for the quarter ended Sep 30, 2016 was Rs 8,869 million, a growth of 17.8% compared to the quarter ended Sep 30, 2015. The net finance income for the quarter ended Sep 30, 2016 was Rs 2,472 million. Profit before Tax (PBT)
Our consolidated profit before tax for the quarter ended Sep 30, 2016 was Rs 11,674 million, or 35.5% of our consolidated revenues, a growth of 19.5% compared to the quarter ended Sep 30, 2015.
Tax
Tax for the period is net of deferred tax liability reversed of Rs. 170 Mn on mark to market gain on investment accounted under Ind AS on account of underlying investments moving to long term capital asset category. Profit after Tax (PAT)
The net income for the quarter ended Sep 30, 2016 was Rs 7,738 million or 23.5% of our consolidated revenues, representing a Y-o-Y growth of 30.8%. Our consolidated total tax expense for the quarter ended Sep 30, 2016 was Rs 3,936 million, or 12% of our consolidated revenues.

Page 18 of 63
Capital Expenditure, Operating Free Cash Flow1 &
Adjusted Fund from Operations (AFFO) 1
For the quarter ended Sep 30, 2016, the Group incurred capital expenditure of Rs 5,112 million. The Operating free cash flow during the quarter was Rs 9,321 million, an increase of 30.4% as compared to the quarter ended Sep 30, 2015 led by higher operating income. The Adjusted Fund from Operations (AFFO) during the quarter was Rs 13,255 million, an increase of 11.6 % compared to the quarter ended Sep 30, 2015.
1. Revenue, EBITDA, EBIT, Operating free cash flow & AFFO are excluding other income.
Return on Capital Employed (ROCE)
ROCE as at the period ended Sep 30, 2016 stands at 28.4%.
5.4 Bharti Infratel Consolidated Three Line Graph
The Group tracks its performance on a three-line graph.
The parameters considered for the three-line graph are:
1. Total Sharing revenue - i.e. service revenue
accrued during the respective period
2. Opex Productivity – is calculated as operating
expenses other than power and fuel expense divided by total sharing revenues for the respective period. This ratio depicts the operational efficiencies in the Group.
3. Capex Productivity – this is computed by
dividing sharing revenue accrued for the quarter (annualized) by average gross cumulative investments (gross fixed assets and capital work in progress) as at the end of respective period. This ratio depicts the asset productivity of the Group.
Given below are the graphs for the last five quarters of the Group: 5.4.1 Bharti Infratel Consolidated

Page 19 of 63
Section 6
STOCK MARKET HIGHLIGHTS 6.1 General Information
6.2 Summarized Shareholding pattern as of Sep 30, 2016
Shareholding and Financial Data UnitQuarter Ended
Sep 30, 2016
Code/Exchange INFRATEL/NSE
Bloomberg/Reuters BHIN:IN/BHRI.NS
No. of Shares Outstanding (30/09/16) Mn Nos 1,849.61
Closing Market Price - NSE (30/09/16) Rs /Share 365.30
Combined Average Daily Volume (NSE & BSE) Nos in Mn/day 1.91
Combined Average Daily Value (NSE & BSE) Rs bn /day 0.69
Market Capitalization Rs bn 676
Book Value Per Equity Share Rs /share 91.94
Market Price/Book Value Times 3.97
Enterprise Value Rs bn 624
PE Ratio Times 25.14
Enterprise Value/ EBITDA (LTM) Times 10.94
CategoryNumber of
Shares%
Promoter & Promoter Group
Indian 1,330,898,728 71.96%
Foreign - -
Sub-Total 1,330,898,728 71.96%
Public Shareholding
Institutions 484,183,282 26.18%
Non-Institutions 33,231,336 1.79%
Sub-Total 517,414,618 27.97%
Non-promoter Non-public shareholding
Indian (Held by Bharti Infratel Employees' Welfare Trust) 1,294,900 0.07%
Foreign - -
Sub-Total 1,294,900 0.07%
Total 1,849,608,246 100.00%

Page 20 of 63
6.3 Bharti Infratel daily stock price (NSE) and volume (BSE & NSE Combined) movement
6.4 Comparison of Bharti Infratel with Nifty
Nifty and Bharti Infratel Stock price rebased to 100.

Page 21 of 63
Section 7
DETAILED PROFORMA FINANCIAL AND RELATED INFORMATION
The proforma financial results presented in this section are prepared as per proportionate consolidation method based on segment information in the audited consolidated financial statement of IND AS and underlying information.
7.1 Proforma Proportionate Consolidated Financial Statements
7.1.1 Consolidated Statement of Income
1 Tax for the period is net of deferred tax liability reversed of Rs. 170 Mn (quarter ended June 30, 2016 Rs 1,277 Mn) on mark to market gain on
investment accounted under Ind AS on account of underlying investments moving to long term capital asset category
Amount in Rs mn, except ratios
Sep 2016 Sep 2015 Y-on-Y growth Sep 2016 Sep 2015 Y-on-Y growth
Income
Revenue from Operations 32,919 30,410 8% 65,026 60,441 8%
Other income 333 564 -41% 684 1,128 -39%
33,252 30,974 7% 65,710 61,569 7%
Expenses
Power and fuel 11,447 10,762 6% 22,591 21,495 5%
Rent 2,871 2,501 15% 5,667 5,019 13%
Employee expenses 1,171 1,092 7% 2,318 2,096 11%
Repairs and maintenance 2,312 2,212 5% 4,610 4,508 2%
Other expenses 581 676 -14% 1,221 1,210 1%
18,382 17,243 7% 36,407 34,328 6%
Profit/ (loss) before finance costs, depreciation
and amortisation and tax 14,870 13,731 8% 29,303 27,241 8%
Finance Costs (Net) (2,472) (1,675) -48% (3,754) (1,109) -239%
Charity and Donation 39 72 -46% 174 122 43%
Depreciation and Amortization Expense 6,055 6,062 0% 12,167 12,040 1%
Less: adjusted with general reserve in
accordance with the Scheme(426) (500) 15% (889) (1,027) 13%
Profit/(loss) before exceptional items and tax 11,674 9,772 19% 21,605 17,215 26%
Exceptional items - - - -
Profit/(loss) before tax 11,674 9,772 19% 21,605 17,215 26%
Tax expenses
Current tax 3,201 3,192 0% 6,575 6,499 1%
Deferred tax 735 663 11% (270) 376 -172%
Total tax expense1
3,936 3,855 2% 6,305 6,875 -8%
Profit (Loss) for the period 7,738 5,917 31% 15,300 10,340 48%
Other comprehensive income 28 (4) 859% 36 (12) 393%
Total comprehensive income for the year,
net of tax 7,766 5,913 31% 15,336 10,328 48%
Earnings per equity share (nominal value of
share Rs 10 each)
Basic (Rs.) 4.142 3.122 33% 8.131 5.459 49%
Diluted (Rs.) 4.141 3.122 33% 8.129 5.458 49%
Particulars Quarter Ended Half Year Ended
Page 22 of 63
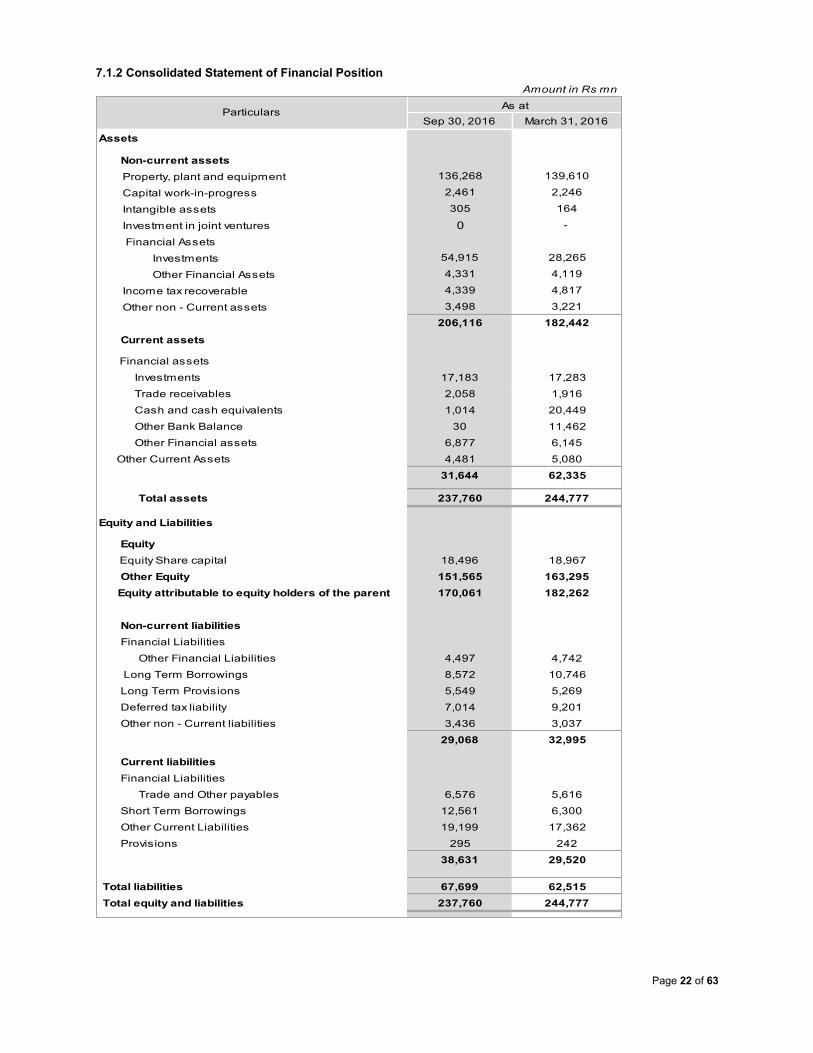
7.1.2 Consolidated Statement of Financial Position
Amount in Rs mn
Sep 30, 2016 March 31, 2016
Assets
Non-current assets
Property, plant and equipment 136,268 139,610
Capital work-in-progress 2,461 2,246
Intangible assets 305 164
Investment in joint ventures 0 -
Financial Assets
Investments 54,915 28,265
Other Financial Assets 4,331 4,119
Income tax recoverable 4,339 4,817
Other non - Current assets 3,498 3,221
206,116 182,442
Current assets
Financial assets
Investments 17,183 17,283
Trade receivables 2,058 1,916
Cash and cash equivalents 1,014 20,449
Other Bank Balance 30 11,462
Other Financial assets 6,877 6,145
Other Current Assets 4,481 5,080
31,644 62,335
Total assets 237,760 244,777
Equity and Liabilities
Equity
Equity Share capital 18,496 18,967
Other Equity 151,565 163,295
Equity attributable to equity holders of the parent 170,061 182,262
Non-current liabilities
Financial Liabilities
Other Financial Liabilities 4,497 4,742
Long Term Borrowings 8,572 10,746
Long Term Provisions 5,549 5,269
Deferred tax liability 7,014 9,201
Other non - Current liabilities 3,436 3,037
29,068 32,995
Current liabilities
Financial Liabilities
Trade and Other payables 6,576 5,616
Short Term Borrowings 12,561 6,300
Other Current Liabilities 19,199 17,362
Provisions 295 242
38,631 29,520
Total liabilities 67,699 62,515
Total equity and liabilities 237,760 244,777
ParticularsAs at

Page 23 of 63
7.2 Schedules to Financial Statements 7.2.1 Schedule of Revenue from Operations
7.2.2 Schedule of Operating Expenses
7.2.3 Schedule of Depreciation & Amortization
7.2.4 Schedule of Finance Cost (Net)
Amount in Rs mn
Sep 30, 2016 Sep 30, 2015 Sep 30, 2016 Sep 30, 2015
Rent 20,744 19,262 41,318 37,990
Energy and other reimbursements 12,175 11,148 23,708 22,451
Revenue 32,919 30,410 65,026 60,441
ParticularsQuarter Ended Half Year Ended
Amount in Rs mn
Sep 30, 2016 Sep 30, 2015 Sep 30, 2016 Sep 30, 2015
Power and fuel 11,447 10,762 22,591 21,495
Rent 2,871 2,501 5,667 5,019
Employee expenses 1,171 1,092 2,318 2,096
Repairs and maintenance 2,312 2,212 4,610 4,508
Other expenses 581 676 1,221 1,210
-Other network expenses 31 94 95 135
-Others 550 582 1,126 1,075
Expenses 18,382 17,243 36,407 34,328
ParticularsQuarter Ended Half Year Ended
Amount in Rs mn
Sep 30, 2016 Sep 30, 2015 Sep 30, 2016 Sep 30, 2015
Depreciation of tangible assets 5,590 5,507 11,212 10,926
Amortization of intangible assets 39 55 66 87
Depreciation and Amortization 5,629 5,562 11,278 11,013
ParticularsQuarter Ended Half Year Ended
Amount in Rs mn
Sep 30, 2016 Sep 30, 2015 Sep 30, 2016 Sep 30, 2015
Finance Income (3,187) (2,435) (5,155) (2,709)
Finance Cost 715 760 1,401 1,600
Finance cost (Net) (2,472) (1,675) (3,754) (1,109)
ParticularsQuarter Ended Half Year Ended

Page 24 of 63
7.3 Use of Non - GAAP Financial Information
In presenting and discussing the Company’s reported financial position, operating results and cash flows, certain information is derived from amounts calculated in accordance with IND AS, but this information is a Non-GAAP measure. Such Non-GAAP measures should not be viewed in isolation as alternatives to the equivalent IND AS measures. A summary of Non – GAAP measures included in this report are shown below 7.3.1 Reconciliation of Non- GAAP financial information to the information as per proforma proportionate consolidated financial statements in 7.1 & 7.2 above
a) Reconciliation of Total Income to Revenue
Amount in Rs mn
Quarter Ended Half Year Ended
Sep 30, 2016 Sep 30, 2016
Total Income to Revenue
Total Income as per IND AS 33,252 65,710
Less: Other Income 333 684
Revenue 32,919 65,026
Particulars
b) Reconciliation of EBITDA (Including Other Income) to EBITDA
Amount in Rs mn
Quarter Ended Half Year Ended
Sep 30, 2016 Sep 30, 2016
EBITDA (Including Other Income) to EBITDA
EBITDA (Incl. Other Income) as per IND AS 14,870 29,303
Less: Other Income 333 684
EBITDA 14,537 28,619
Particulars
c) Reconciliation of EBIT (Including Other Income) to EBIT
Amount in Rs mn
Quarter Ended Half Year Ended
Sep 30, 2016 Sep 30, 2016
EBIT (Including Other Income) to EBIT
EBIT (Incl. Other Income) as per IND AS 9,202 17,851
Less: Other Income 333 684
EBIT 8,869 17,167
Particulars

Page 25 of 63
d) Derivarion of Operating Free Cash Flow from EBITDA
Amount in Rs mn
Quarter Ended Half Year Ended
Sep 30, 2016 Sep 30, 2016
EBITDA to Operating Free Cash Flow
EBITDA 14,537 28,619
Less: Capex 5,112 9,527
Add:Operating Lease expense - Security Deposit 6 23
Less:Operating Lease revenue - Security Deposit 110 217
Operating Free Cash Flow 9,321 18,898
Particulars
e) Derivation of Adjusted Fund From Operations (AFFO) from EBITDA
Amount in Rs mn
Quarter Ended Half Year Ended
Sep 30, 2016 Sep 30, 2016
EBITDA to Adjusted Fund From Operations
EBITDA 14,537 28,619
Less: Maintenance & General Corporate Capex 1,178 2,538
Add:Operating Lease expense - Security Deposit 6 23
Less:Operating Lease revenue - Security Deposit 110 217
Adjusted Fund From Operations(AFFO) 13,255 25,887
Particulars
f) Calculation of Net Debt / (Net Cash)
Amount in Rs mn
Total Debt 21,133 17,046
Less: Cash and Cash Equivalents & Current and non-
current Investments (including fixed deposits)73,142 77,459
Net Debt / (Net Cash) (52,009) (60,413)
As at March 31, 2016As at Sep 30, 2016Particulars
g) Calculation of Capital Employed
Amount in Rs mn
Shareholder's Fund 170,061 182,262
Add:Net Debt / (Net Cash) (52,009) (60,413)
Capital Employed 118,052 121,849
As at March 31, 2016Particulars As at Sep 30, 2016

Page 26 of 63
Section 8
TRENDS AND RATIOS _________________________________________________________________________________________
The proforma financial results presented in this section are prepared as per proportionate consolidation method based on segment information in the audited consolidated financial statement of IND AS and underlying information ______________________________________________________________________________________________________________________________________________________________________________________________________________ 8.1 Based on Statement of Operations
1. Revenue, EBITDA, EBIT, Operating free cash flow & AFFO are excluding other income. 2. Energy cost, other operating exp., EBITDA, profit before tax and profit after tax margin have been computed on revenue excluding other income. 3. Profit after tax excludes impact of Other Comprehensive Income 4. Previous periods’ figures have been regrouped/ rearranged wherever necessary to confirm to current period classifications.
Amount in Rs mn
Sep-16 Jun-16 Mar-16 Dec-15 Sep-15
Revenue1
32,919 32,107 31,817 31,056 30,410
Energy Cost 11,447 11,144 10,386 10,717 10,762
Other Operating Expenses 6,935 6,881 6,744 6,659 6,481
EBITDA1
14,537 14,082 14,687 13,680 13,167
EBITDA / Total revenues2
44.2% 43.9% 46.2% 44.0% 43.3%
EBIT1
8,869 8,298 8,798 8,097 7,533
Other Income 333 351 433 487 564
Finance cost (Net) (2,472) (1,282) (1,029) 292 (1,675)
Profit before Tax 11,674 9,931 10,260 8,292 9,772
Income Tax Expense 3,936 2,369 3,076 3,342 3,855
Profit after tax3
7,738 7,562 7,184 4,950 5,917
Capex 5,112 4,416 5,007 5,417 5,916
Operating Free Cash Flow1 9,321 9,577 9,578 8,180 7,150
Adjusted Fund From Operations(AFFO)1
13,255 12,633 13,618 12,431 11,872
Cumulative Investments 285,213 281,595 277,951 278,068 274,171
Sep-16 Jun-16 Mar-16 Dec-15 Sep-15
As a % of Revenue2
Energy Cost 34.8% 34.7% 32.6% 34.5% 35.4%
Other Operating Expenses 21.1% 21.4% 21.2% 21.4% 21.3%
EBITDA 44.2% 43.9% 46.2% 44.0% 43.3%
Profit before tax 35.5% 30.9% 32.2% 26.7% 32.1%
Profit after tax 23.5% 23.6% 22.6% 15.9% 19.5%
ParametersFor the Quarter Ended
4

Page 27 of 63
8.2 Based on Statement of Financial Position
Amount in Rs mn
Sep-16 Jun-16 Mar-16 Dec-15 Sep-15
Equity Shareholder's Fund 170,061 189,388 182,262 175,559 171,130
Net Debt / (Net Cash)1
(52,009) (68,058) (60,413) (54,259) (49,327)
Capital Employed = Equity Shareholders Fund + Net
Debt / (Net Cash)118,052 121,330 121,849 121,301 121,803
Parameters Sep-16 Jun-16 Mar-16 Dec-15 Sep-15
Return on Capital Employed (LTM) Pre Tax 28.4% 26.0% 27.2% 26.1% 25.1%
Return on Shareholder's Equity (LTM) Pre Tax 23.5% 20.7% 20.0% 20.2% 22.2%
Return on Shareholder's Equity (LTM) Post tax 16.1% 13.9% 12.5% 12.0% 13.4%
Net Debt / (Net Cash) to EBITDA (LTM) (0.91) (1.22) (1.11) (1.02) (0.95)
Asset Turnover ratio 63.10% 59.26% 59.91% 59.96% 57.55%
Interest Coverage ratio (times) 20.76 19.93 18.50 17.01 15.63
Net debt / (Net Cash) to Funded Equity (Times) (0.31) (0.36) (0.33) (0.31) (0.29)
Per share data (for the period)
Earnings Per Share - Basic (in Rs) 4.14 3.99 3.79 2.61 3.12
Earnings Per Share - Diluted (in Rs) 4.14 3.99 3.79 2.61 3.12
Book Value Per Equity Share (in Rs) 91.9 99.9 96.1 92.6 90.2
Market Capitalization (Rs. bn) 676 654 724 812 674
Enterprise Value (Rs. bn) 624 586 664 758 624
ParametersAs at
Page 28 of 63
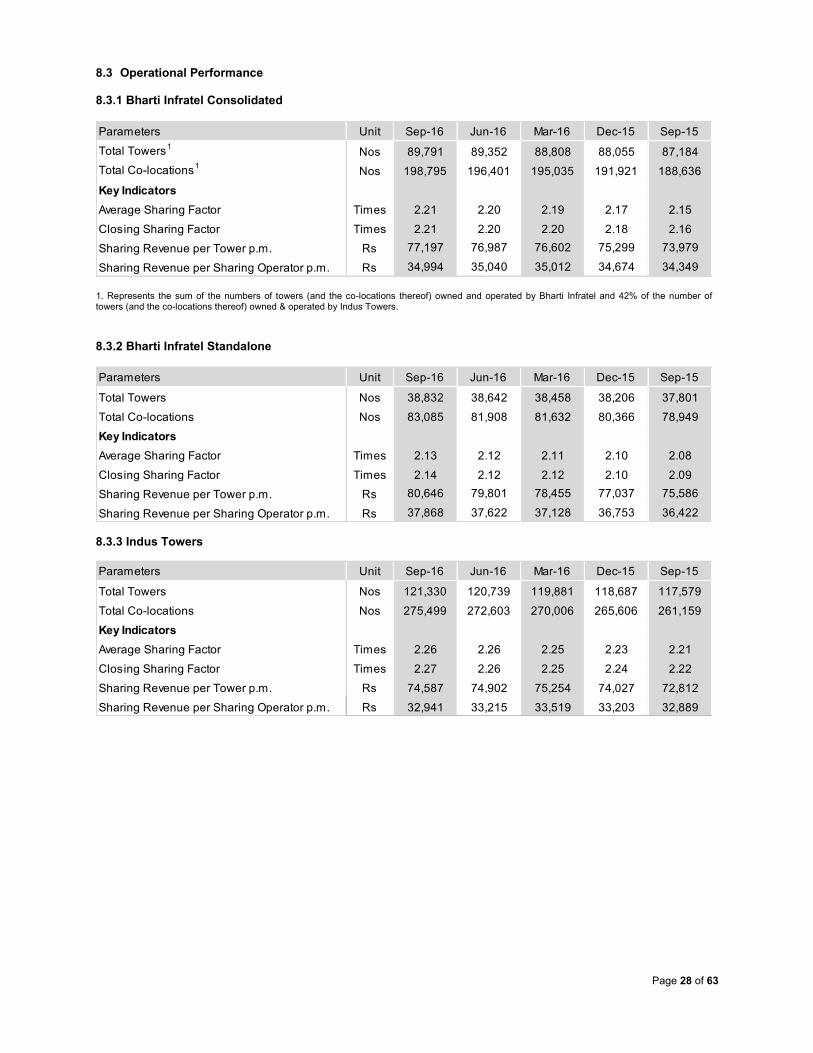
8.3 Operational Performance 8.3.1 Bharti Infratel Consolidated
1. Represents the sum of the numbers of towers (and the co-locations thereof) owned and operated by Bharti Infratel and 42% of the number of towers (and the co-locations thereof) owned & operated by Indus Towers.
8.3.2 Bharti Infratel Standalone
8.3.3 Indus Towers
Parameters Unit Sep-16 Jun-16 Mar-16 Dec-15 Sep-15
Total Towers1
Nos 89,791 89,352 88,808 88,055 87,184
Total Co-locations1
Nos 198,795 196,401 195,035 191,921 188,636
Key Indicators
Average Sharing Factor Times 2.21 2.20 2.19 2.17 2.15
Closing Sharing Factor Times 2.21 2.20 2.20 2.18 2.16
Sharing Revenue per Tower p.m. Rs 77,197 76,987 76,602 75,299 73,979
Sharing Revenue per Sharing Operator p.m. Rs 34,994 35,040 35,012 34,674 34,349
Parameters Unit Sep-16 Jun-16 Mar-16 Dec-15 Sep-15
Total Towers Nos 38,832 38,642 38,458 38,206 37,801
Total Co-locations Nos 83,085 81,908 81,632 80,366 78,949
Key Indicators
Average Sharing Factor Times 2.13 2.12 2.11 2.10 2.08
Closing Sharing Factor Times 2.14 2.12 2.12 2.10 2.09
Sharing Revenue per Tower p.m. Rs 80,646 79,801 78,455 77,037 75,586
Sharing Revenue per Sharing Operator p.m. Rs 37,868 37,622 37,128 36,753 36,422
Parameters Unit Sep-16 Jun-16 Mar-16 Dec-15 Sep-15
Total Towers Nos 121,330 120,739 119,881 118,687 117,579
Total Co-locations Nos 275,499 272,603 270,006 265,606 261,159
Key Indicators
Average Sharing Factor Times 2.26 2.26 2.25 2.23 2.21
Closing Sharing Factor Times 2.27 2.26 2.25 2.24 2.22
Sharing Revenue per Tower p.m. Rs 74,587 74,902 75,254 74,027 72,812
Sharing Revenue per Sharing Operator p.m. Rs 32,941 33,215 33,519 33,203 32,889

Page 29 of 63
8.3.4 Human Resource Analysis 8.3.4.1 Bharti Infratel Consolidated
1. Total On Roll Employees include proportionate consolidation of 42% of Indus Towers Employees. 8.3.4.2 Bharti Infratel Standalone
8.3.4.3 Indus Towers
Note: Indus operates on outsourced operations & maintenance model in certain geographical territories wherein the associated personnel cost is
recorded as part of repair & maintenance and other expenses. Hence, the related human resources key performance indicators are not strictly comparable between Bharti Infratel Standalone and Indus.
Parameters Unit Sep-16 Jun-16 Mar-16 Dec-15 Sep-15
Total On roll Employees1
Nos 2,393 2,364 2,346 2,323 2,276
Number of Towers per employee Nos 38 38 38 38 38
Personnel Cost per employee per month Rs 164,117 162,352 155,364 158,734 164,399
Revenue per employee per month Rs 4,613,645 4,544,573 4,543,403 4,501,946 4,578,171
Parameters Unit Sep-16 Jun-16 Mar-16 Dec-15 Sep-15
Total On roll Employees Nos 1,246 1,252 1,250 1,243 1,237
Number of Towers per employee Nos 31 31 31 31 31
Personnel Cost per employee per month Rs 179,877 186,251 167,135 176,344 179,916
Revenue per employee per month Rs 3,993,328 3,871,836 3,792,218 3,752,419 3,730,398
Parameters Unit Sep-16 Jun-16 Mar-16 Dec-15 Sep-15
Total On roll Employees Nos 2,730 2,648 2,609 2,571 2,474
Number of Towers per employee Nos 44 46 46 46 48
Personnel Cost per employee per month Rs 147,024 134,965 141,925 138,249 145,082
Revenue per employee per month Rs 5,300,263 5,309,838 5,407,321 5,381,931 5,634,192

Page 30 of 63
8.4 Energy Cost Analysis
8.5 Other Than Energy Cost Analysis
8.6 Revenue and Cost Composition
Unit Sep-16 Jun-16 Mar-16 Dec-15 Sep-15
Energy Cost Indicators
Energy Cost Per Tower per month Rs 42,599 41,700 39,149 40,771 41,333
Energy Cost Per Colocation per month Rs 19,310 18,980 17,894 18,774 19,191
ParametersFor the Quarter Ended
Unit Sep-16 Jun-16 Mar-16 Dec-15 Sep-15
Other Than Energy Cost
Cost Per Tower per month Rs 25,808 25,748 25,421 25,333 24,891
Cost per Colocation per month Rs 11,699 11,719 11,619 11,665 11,557
ParametersFor the Quarter Ended
Unit Sep-16 Jun-16 Mar-16 Dec-15 Sep-15
Revenue Composition
Service Revenue % 63% 64% 64% 64% 63%
Energy and other reimbursements % 37% 36% 36% 36% 37%
Total 100% 100% 100% 100% 100%
Opex Composition
Power and fuel % 62% 62% 61% 62% 62%
Rent % 16% 16% 16% 15% 15%
Employee benefits expenses % 6% 6% 6% 6% 6%
Repair and maintenance expenses % 13% 13% 13% 13% 13%
Other expenses % 3% 4% 4% 4% 4%
-Other network expenses % 0% 0% 1% 1% 1%
-Others % 3% 3% 3% 3% 3%
Total 100% 100% 100% 100% 100%
ParametersFor the Quarter Ended
Page 31 of 63
Section 1
Section B
Consolidated IND AS Financial Statements
for the quarter ended Sep 2016
This section includes Consolidated financial statements prepared on IND AS principles as per equity approach.
Page 32 of 63
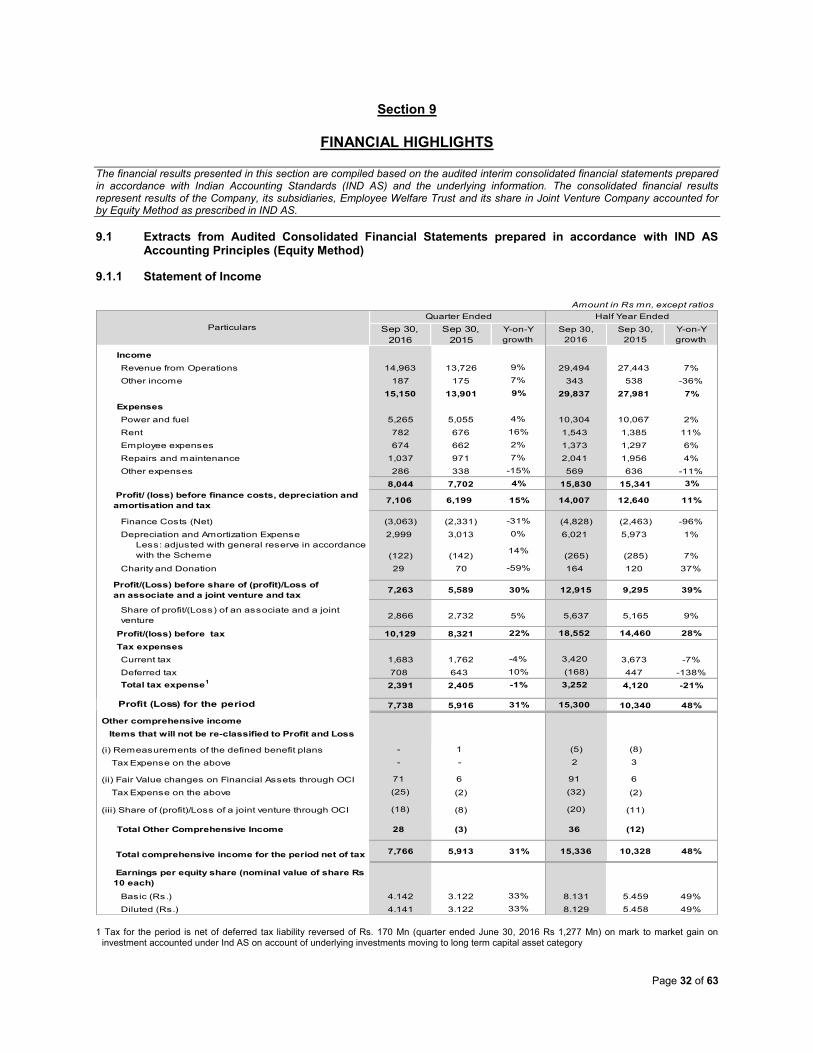
Section 9
FINANCIAL HIGHLIGHTS
The financial results presented in this section are compiled based on the audited interim consolidated financial statements prepared in accordance with Indian Accounting Standards (IND AS) and the underlying information. The consolidated financial results represent results of the Company, its subsidiaries, Employee Welfare Trust and its share in Joint Venture Company accounted for by Equity Method as prescribed in IND AS.
9.1 Extracts from Audited Consolidated Financial Statements prepared in accordance with IND AS Accounting Principles (Equity Method)
9.1.1 Statement of Income
1 Tax for the period is net of deferred tax liability reversed of Rs. 170 Mn (quarter ended June 30, 2016 Rs 1,277 Mn) on mark to market gain on
investment accounted under Ind AS on account of underlying investments moving to long term capital asset category
Amount in Rs mn, except ratios
Sep 30,
2016
Sep 30,
2015
Y-on-Y
growth
Sep 30,
2016
Sep 30,
2015
Y-on-Y
growth
Income
Revenue from Operations 14,963 13,726 9% 29,494 27,443 7%
Other income 187 175 7% 343 538 -36%
15,150 13,901 9% 29,837 27,981 7%
Expenses
Power and fuel 5,265 5,055 4% 10,304 10,067 2%
Rent 782 676 16% 1,543 1,385 11%
Employee expenses 674 662 2% 1,373 1,297 6%
Repairs and maintenance 1,037 971 7% 2,041 1,956 4%
Other expenses 286 338 -15% 569 636 -11%
8,044 7,702 4% 15,830 15,341 3%
Profit/ (loss) before finance costs, depreciation and
amortisation and tax 7,106 6,199 15% 14,007 12,640 11%
Finance Costs (Net) (3,063) (2,331) -31% (4,828) (2,463) -96%
Depreciation and Amortization Expense 2,999 3,013 0% 6,021 5,973 1%
Less: adjusted with general reserve in accordance
with the Scheme (122) (142)14%
(265) (285) 7%
Charity and Donation 29 70 -59% 164 120 37%
Profit/(Loss) before share of (profit)/Loss of
an associate and a joint venture and tax7,263 5,589 30% 12,915 9,295 39%
Share of profit/(Loss) of an associate and a joint
venture2,866 2,732 5% 5,637 5,165 9%
Profit/(loss) before tax 10,129 8,321 22% 18,552 14,460 28%
Tax expenses
Current tax 1,683 1,762 -4% 3,420 3,673 -7%
Deferred tax 708 643 10% (168) 447 -138%
Total tax expense1
2,391 2,405 -1% 3,252 4,120 -21%
Profit (Loss) for the period 7,738 5,916 31% 15,300 10,340 48%
Other comprehensive income
Items that will not be re-classified to Profit and Loss
(i) Remeasurements of the defined benefit plans - 1 (5) (8)
Tax Expense on the above - - 2 3
(ii) Fair Value changes on Financial Assets through OCI 71 6 91 6
Tax Expense on the above (25) (2) (32) (2)
(iii) Share of (profit)/Loss of a joint venture through OCI (18) (8) (20) (11)
Total Other Comprehensive Income 28 (3) 36 (12)
Total comprehensive income for the period net of tax 7,766 5,913 31% 15,336 10,328 48%
Earnings per equity share (nominal value of share Rs
10 each)
Basic (Rs.) 4.142 3.122 33% 8.131 5.459 49%
Diluted (Rs.) 4.141 3.122 33% 8.129 5.458 49%
Particulars
Quarter Ended Half Year Ended

Page 33 of 63
9.1.2 Statement of Financial Position
Amount in Rs mn
Sep 30, 2016 March 31, 2016
Assets
Non-current assets
Property, plant and equipment 58,588 60,560
Capital work-in-progress 604 701
Intangible assets 52 71
Investment in joint ventures 49,727 56,180
Financial assets
Investment 54,915 28,265
Other Financial Assets 1,283 1,221
Income tax recoverable 2,111 2,268
Other non - Current assets 2,316 2,311
169,596 151,577
Current assets
Financial assets
Investment 15,570 16,148
Trade and other receivables 2,013 1,955
Cash and cash equivalents 505 20,133
Other Bank Balance 30 11,462
Other Financial Assets 2,420 1,963
Other Current Assets 3,025 3,794
23,563 55,455
Total assets 193,159 207,032
Equity and Liabilities
Equity
Equity Share capital 18,496 18,967
Other Equity 151,710 163,454
Equity attributable to equity holders of the parent 170,206 182,421
Non-current liabilities
Financial Liabilities
Other Financial Liabilities 2,170 2,033
Long Term Provisions 2,135 2,009
Deferred tax liability 2,557 4,630
Other non - Current liabilities 1,666 1,773
8,528 10,445
Current liabilities
Financial Liabilities
Trade and Other payables 741 634
Other Current Liabilities 13,547 13,413
Provisions 137 119
14,425 14,166
Total liabilities 22,953 24,611
Total equity and liabilities 193,159 207,032
ParticularsAs at

Page 34 of 63
9.1.3 Cash Flow
Contd…
Amount in Rs mn
Half Year Ended Half Year Ended
Sep 30, 2016 Sep 30, 2015
Cash flows from operating activities
Profit before taxation 18,552 14,460
Adjustments for -
Depreciation and amortization expense 5,756 5,688
Finance income (5,008) (2,625)
Finance Costs 180 162
Dividend income - -
Gain on disposal of investments - -
Gain/loss on sale of tangible fixed assets (249) (363)
Reversal of provision for doubtful trade receivables 50 94
Provision for doubtful deposits - -
Provision for obsolescence of capital work in progress/services (4) (5)
Others (134) (214)
Operating profit before working capital changes 19,143 17,197
Changes in Trade Receivables (108) 1,350
Changes in Trade Payables 132 442
Changes in Other Current Liabilities 396 594
Changes in Other Non Current Assets (5) 773
Changes in Other Long Term Financial Liabilities 137 127
Changes in Long Term Provisions 29 20
Changes in Short Term Provisions 18 16
Changes in Other Financial Assets (457) (598)
Changes in Other Long Term Financial Assets (62) (61)
Changes in Other Non Current Liabilities 5 41
Changes in Other Current Assets 763 (356)
Investment in Joint Venture 5,849 (5,155)
Cash generated from operations 25,841 14,390
Income tax paid (net of refunds) (5,168) (3,247)
Contribution towards CSR - -
Net Cash flow from operating activities (A) 20,672 11,143
Cash flows from investing activities
Purchase of Property,Plant & Equipment (4,341) (5,552)
Proceeds from sale of Property,Plant & Equipment 496 545
Purchase of Investment (58,486) (8,053)
Proceeds from Fixed Deposit 11,462 (2,013)
Proceeds from sale of investments 33,895 25,901
Proceeds from sale of Corporate Deposit 2,846 -
Interest received 593 971
Dividend received - -
Net Cash flow (used in) investing activities (B) (13,535) 11,799
Cash flows from financing activities
Proceeds from exercise of stock options (54) 316
Buyback of Shares (20,032) -
Interest paid - -
Dividend paid (5,549) (12,326)
Tax on Dividend paid (1,130) (2,509)
Net Cash flow (used in) financing activities (C) (26,765) (14,519)
Net (decrease) / increase in cash and cash equivalents during the
period (A+B+C)(19,628) 8,423
Cash and cash equivalents at the beginning of the period 20,133 64
Cash and cash equivalents at the end of the period 505 8,487
Particulars
Page 35 of 63
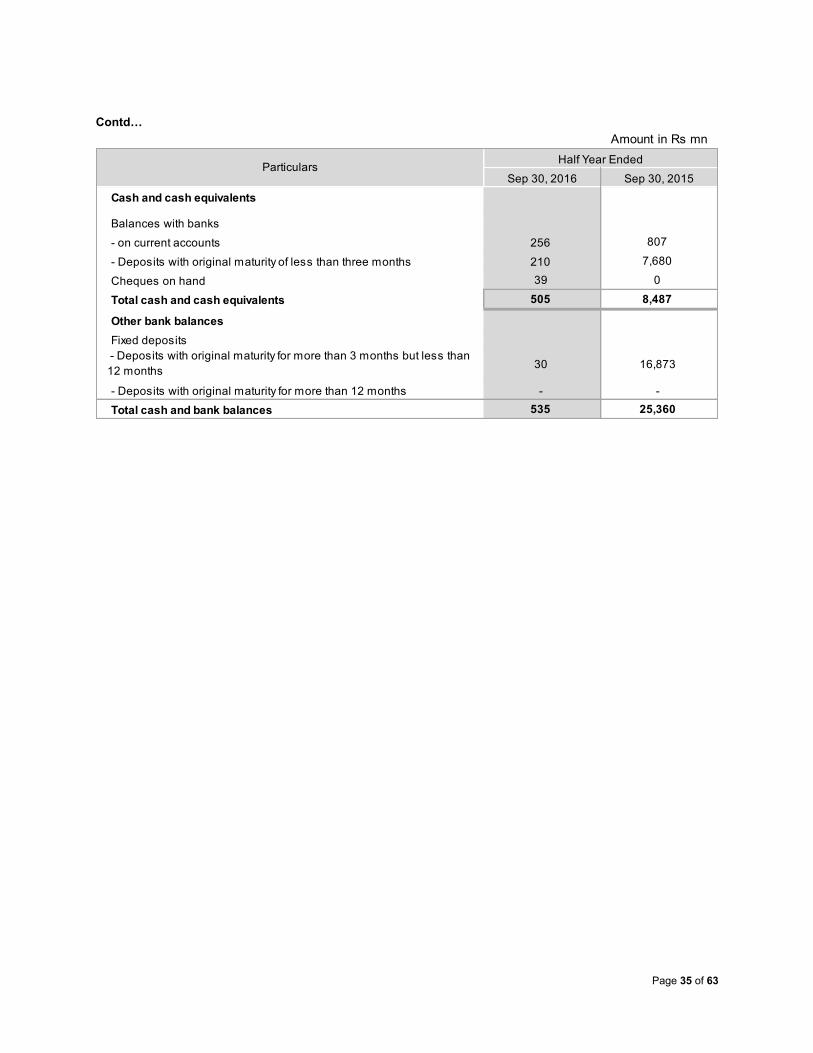
Contd…
Amount in Rs mn
Sep 30, 2016 Sep 30, 2015
Cash and cash equivalents
Balances with banks
- on current accounts 256 807
- Deposits with original maturity of less than three months 210 7,680
Cheques on hand 39 0
Total cash and cash equivalents 505 8,487
Other bank balances
Fixed deposits
- Deposits with original maturity for more than 3 months but less than
12 months 30 16,873
- Deposits with original maturity for more than 12 months - -
Total cash and bank balances 535 25,360
ParticularsHalf Year Ended

Page 36 of 63
Section C
Transition to IND AS
This section details the: 1. Key Accounting Changes 2. IGAAP to IND AS Reconciliation Statements 3. Walk of IND AS Consolidated Results (using Equity approach)
to Proforma Consolidated Results (using proportional consolidation approach on IND AS principles)

Page 37 of 63
Section 10
Key Accounting Changes
First-time adoption of Ind AS
The Ministry of Corporate Affairs (MCA) notification dated 16
th February, 2015 that the companies having
a net worth of Rs. 500 crores or more (as per the standalone financial statements as on 31st March, 2014) are required to comply with Ind AS in the preparation of their financial statements for accounting periods beginning on or after 1st April, 2016, with the comparatives for the periods ending 31st March, 2016, or thereafter. Accordingly, the Company has prepared financial statements which comply with Ind AS applicable for periods ending on 30 September 2016, together with the comparative period data as at and for the year ended 31 March 2016 and 30 September 2015, as described in the summary of significant accounting policies. In preparing these financial statements, the Company’s opening balance sheet was prepared as at 1 April 2015, the Company’s date of transition to Ind AS as per Ind AS 101, First Time adoption of Indian Accounting Standards. This note explains the key accounting changes and principal adjustments made by the Company in restating its Indian GAAP financial statements, including the balance sheet as at 1 April 2015 and the financial statements as at and for the year/period ended 30 June 2016 and 31 March 2016. Interest in a Joint Venture
Under Ind AS 28, the Company investment in its joint venture is accounted for using the equity method. Segment Information
Operating Segments are identified on the basis of internal reports about components of the group that are regularly reviewed by the chief operating decision maker (CODM) in order to allocate resources to the segments and to assess their performance in accordance with Ind AS 108, Operating Segments. Indus separately prepares and gets its financial statements audited as per legal requirement. While transiting from IGAAP to Ind AS, Bharti Infratel Limited has identified Indus as operating segment based on the fact that the operating results of Indus are regularly reviewed by the entity’s CODM about the resources allocated to the segment and assess its performance. Exemptions applied
Ind AS 101 allows first-time adopters certain exemptions from the retrospective application of certain requirements under Ind AS. The Company has applied the following exemptions:
1. The company has elected to continue with the previous GAAP carrying amount as deemed cost as starting point under Ind AS for Property, Plant and Equipment and Intangible assets.
2. In Separate Financial Statements, The Company has availed optional exemption related to Investment in Joint venture and continues with the carrying amount of Investment in IGAAP as a deemed cost in Ind AS.
Scheme of Arrangement
1. During the year ended March 31, 2008, pursuant to the Scheme of Arrangement with Bharti Airtel Limited (‘the Scheme’) under sections 391 to 394 of the Companies Act, 1956, the telecom infrastructure undertaking of Bharti Airtel Limited was transferred to the Company. Pursuant to the Scheme, the depreciation charged by the Company on the excess of the fair values over the original book values of the assets transferred by Bharti Airtel Limited is being off-set against General Reserve. In absence of any specific provision in Ind AS with respect to merger under court scheme the entity has continued with the scheme accounting and balances under IGAAP as at 31 March 2015 has been carried over to the transition date Balance Sheet. The depreciation on fair valuation under the scheme will continue to be charged from general reserve.
2. The Scheme of Arrangement (‘Indus Scheme’) under Section 391 to 394 of the Companies Act, 1956 for transfer of all assets and liabilities, as defined in Indus scheme, from Bharti Infratel Ventures Limited (BIVL), erstwhile wholly owned subsidiary company, to Indus Towers Limited (Indus), was approved by the Hon’ble High Court of Delhi vide order dated April 18, 2013 and filed with the Registrar of Companies on June 11, 2013 with appointed date April 1, 2009 i.e. effective date of Indus Scheme and accordingly, effective June 11, 2013, the erstwhile subsidiary company has ceased to exist and has become part of Indus. The entity continued with the scheme accounting and the carrying value of Investment in Indian GAAP will be treated as cost of Investment in separate financial statements of Bharti Infratel Limited.

Page 38 of 63
Impact of transition to Ind AS
The following is a summary of the effects of the differences between Ind AS and Indian GAAP on the Company’s total equity and profit for the period or periods previously reported under Indian GAAP following the date of transition to Ind AS. 1. Asset Retirement obligation (ARO)
The company uses various premises on lease to install plant and equipment. A provision is recognized for the costs to be incurred for the restoration of these premises at the end of the lease period. It is expected that this provision will be utilized at the end of the lease period of the respective sites as per the respective lease agreements. Under Indian GAAP, Asset Retirement obligation (ARO) liability is stated at historical cost till the extinguishment of liability or expiry of the contractual period. The capitalized portion of the cost is depreciated over the useful life of the asset. As per Ind AS 37, Provisions, Contingent Liabilities and Contingent Assets, Asset Retirement obligation is provided at the present value of expected cost to settle the obligation and is recognized as part of Property, Plant and Equipment and liability. The estimated future cash outflows are discounted at a current pre tax rate that reflects the risk specific to the decommissioning liability. The unwinding of the discount is expensed as incurred and recognized in the statement of profit and loss as finance cost. Changes in the estimated future cost or in the discount rate applied are added to or deducted from the cost of the asset.
2. Revenue Equalization reserve & Lease Equalization reserve
Under Indian GAAP, Rental income and expenses arising from operating leases is accounted for on a straight-line basis over the lease terms and is included in revenue in the statement of profit or loss. Under Ind AS 17, Leases, the rental income and expenses arising from operating leases is not accounted for on a straight-line basis over the lease terms due to payments from/to the operators and Landlords are structured to increase in line with expected general inflation to compensate for the company’s expected inflationary cost increases.
3. Short Term Provisions
Under Indian GAAP, proposed dividends including Dividend Distribution Tax are recognized as a liability in the period to which they relate, irrespective of when they are declared.
Under Ind AS, a proposed dividend is recognised as a liability in the period in which it is declared by the company (usually when approved by shareholders in a general meeting) or paid as per Ind AS 10, Events occurring after reporting period.
4. Financial Assets at Fair Value through profit
or loss
Under Indian GAAP, Current Investments are accounted for at cost or market price whichever is lower. Difference between the cost and market price is recognised in the statement of profit and loss. Long Term Investments are measured at cost less provision for diminution if there is permanent decline in value. Under Ind AS, such assets have been classified at fair value through profit and loss as per Ind AS 109, Financial Instruments.
5. Financial Assets & Liabilities at amortised Cost
Under Ind AS 109, Financial Instruments, financial assets and liabilities which are non derivative with fixed or determinable payments that are not quoted in an active market and recognised initially at Fair value. After initial measurement, such financial assets and liabilities are subsequently measured at amortised cost using the effective interest rate (EIR) method. The EIR amortisation is included in finance Income & cost in the profit or loss. The difference between transaction value and fair value of Security deposits is recognised as Deferred Lease Income or Expense which will be amortised over tenure of the deposit. This category generally applies to trade and other receivables, Security deposits etc. Under Indian GAAP these kind of financial assets are stated at transaction value.
6. Deferred Tax
Indian GAAP requires deferred tax accounting using the income statement approach, which focuses on differences between taxable profits and accounting profits for the period. Ind AS 12, Income Taxes requires entities to account for deferred taxes using the balance sheet approach, which focuses on temporary differences between the carrying amount of an asset or liability in the balance sheet and its tax base. Further also dividend tax has also recognized on un-distributed profits of the JV Company.
7. Other Comprehensive Income
Other Comprehensive income was not required under Indian GAAP. Hence, the company has reconciled Indian GAAP profit or loss to profit or

Page 39 of 63
loss as per Ind AS. Further, Indian GAAP profit or loss is also reconciled to total comprehensive income as per Ind AS.
8. Loans and Borrowings
Under Indian GAAP, the processing fee is amortized over the period of the borrowings and the interest is recognized as per the terms of the loan whereas under Ind AS 109, the processing fees is netted off from the borrowing at the inception and the interest is recognized as per EIR method.
9. Treasury shares
Under Ind AS 110 – Consolidated financial statements define control and establish control as the main basis for consolidating the entities, in light of which we are required to consolidate employee welfare trust in the consolidated financial statement. Under IGAAP, the trusts are not required to be consolidated. Impact of IND-AS transition adjustments on the opening proforma consolidated balance sheet as on April 1, 2015 (the date of transition to IND AS) of Rs 7,871 Mn (other than proposed dividend and tax thereon, impact of consolidation of JV under equity method and Bharti Infratel Employee Welfare Trust), has been adjusted from General Reserves as on April 1, 2015.

Page 40 of 63
Section 11
IGAAP to IND AS Reconciliation Statements ___________________________________________________________________________________________ The proforma financial results presented in this section are prepared as per proportionate consolidation method based on segment information in the audited consolidated financial statement of IND AS and underlying information
11. Reconciliation of IGAAP to Proforma Consolidated Results under IND AS
11.1 Reconciliation of Statement of Financial Position as on 01-April-2015
1. Previous periods’ figures have been regrouped/ rearranged
wherever necessary to confirm to current period classifications 2. Adjustment for discounting of Asset Retirement Obligation and
corresponding impact of depreciation 3. Effect of measuring investment at fair value 4. Discounting of security deposits paid to fair value 5. Adjustment for annual escalation on rentals income not equalized
over the lease term, being inflation linked 6. Impact of consolidation of Trust not done earlier 7. Adjustment for all the IND AS impacts on Other Equity 8. Discounting of security deposits received to fair value
9. Adjustment for discounting of Asset Retirement Obligation and employee benefits
10. Tax impact of the IND AS adjustments 11. Adjustment for annual escalation on rentals expense not equalized
over the lease term, being inflation linked 12. Represents reclassification 13. Represents reversal of proposed dividend recognized as liability 14. Adjustment of processing fee for long term borrowings
Amount in Rs Mn
Particulars IGAAP1
Adjustments Ind AS
INR Mn's INR Mn's INR Mn's
Assets
Non-current assets
Property, plant and equipment2
147,919 (5,150) 142,769
Capital Work in Progress 2,260 0 2,260
Other Intangible assets 202 (0) 202
Investment in an associate/ joint venture - - -
Financial assets
Investments3
27,382 3,881 31,263
Other Financial Assets4,12
4,192 (430) 3,762
Income tax recoverable 4,606 (44) 4,562
Other non-current assets4,5
27,637 (23,782) 3,855
214,198 (25,526) 188,672
Current assets
Financial assets
Investments3
31,440 3,532 34,972
Trade receivables 3,532 0 3,532
Cash and cash Equivalent6
285 2 287
Other Bank Balance12
8,835 (16) 8,819
Other Financial Assets 6,140 0 6,140
Other current assets4,8,12
7,117 (1,735) 5,382
57,349 1,783 59,132
Total assets 271,547 (23,743) 247,804
Equity and liabilities
Equity
Equity share capital 18,938 (0) 18,938
Other equity7
151,262 6,102 157,364
Total equity 170,200 6,102 176,302
Non-current liabilities
Financial Liabilities
Other Financial Liabilities8
6,688 (2,528) 4,160
Long term borrowings14
15,663 (38) 15,625
Long Term Provisions9
11,101 (6,365) 4,736
Deferred tax liability10
12,247 (3,943) 8,304
Other non - Current liabilities11,8
4,954 (1,864) 3,090
50,653 (14,739) 35,914
Current liabilities
Financial Liabilities
Trade Payables12
1,342 6,865 8,207
Short term borrowings12
1,468 8,690 10,158
Other Current Liabilities12
32,052 (15,035) 17,017
Provisions13,12
15,832 (15,626) 206
50,694 (15,105) 35,589
Total liabilities 101,347 (29,844) 71,503
Total equity and liabilities 271,547 (23,743) 247,804
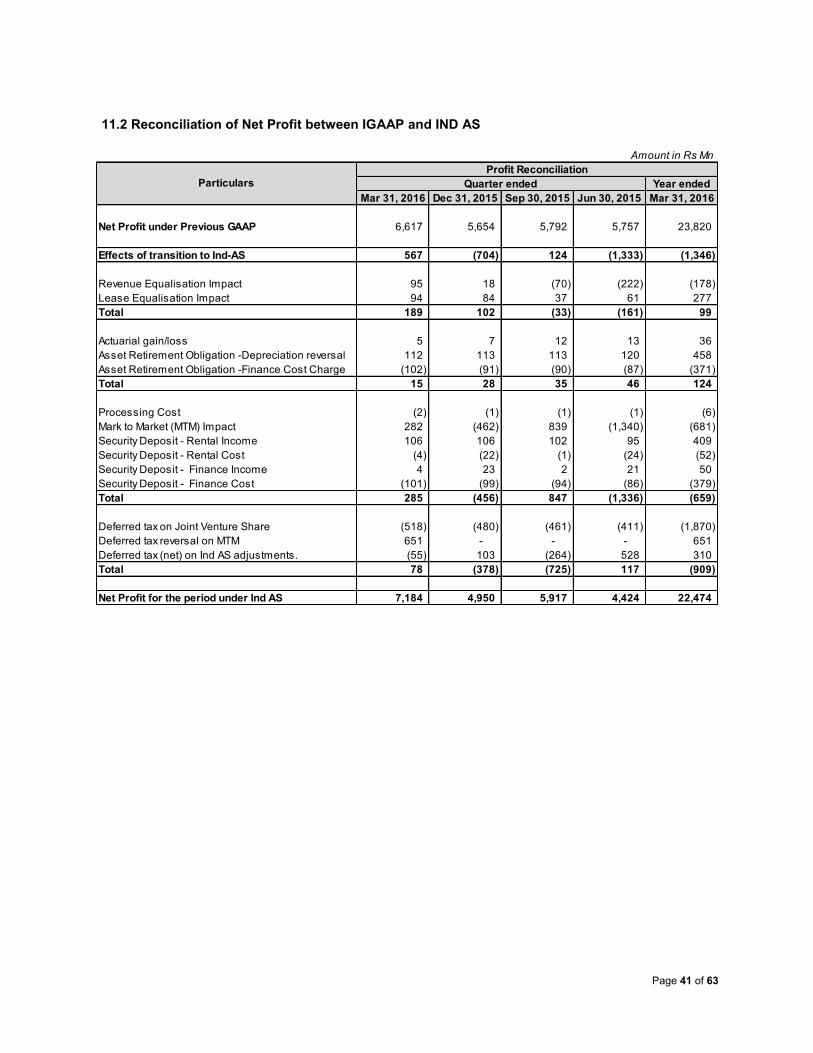
Page 41 of 63
11.2 Reconciliation of Net Profit between IGAAP and IND AS
Amount in Rs Mn
Year ended
Mar 31, 2016 Dec 31, 2015 Sep 30, 2015 Jun 30, 2015 Mar 31, 2016
Net Profit under Previous GAAP 6,617 5,654 5,792 5,757 23,820
Effects of transition to Ind-AS 567 (704) 124 (1,333) (1,346)
Revenue Equalisation Impact 95 18 (70) (222) (178)
Lease Equalisation Impact 94 84 37 61 277
Total 189 102 (33) (161) 99
Actuarial gain/loss 5 7 12 13 36
Asset Retirement Obligation -Depreciation reversal 112 113 113 120 458
Asset Retirement Obligation -Finance Cost Charge (102) (91) (90) (87) (371)
Total 15 28 35 46 124
Processing Cost (2) (1) (1) (1) (6)
Mark to Market (MTM) Impact 282 (462) 839 (1,340) (681)
Security Deposit - Rental Income 106 106 102 95 409
Security Deposit - Rental Cost (4) (22) (1) (24) (52)
Security Deposit - Finance Income 4 23 2 21 50
Security Deposit - Finance Cost (101) (99) (94) (86) (379)
Total 285 (456) 847 (1,336) (659)
Deferred tax on Joint Venture Share (518) (480) (461) (411) (1,870)
Deferred tax reversal on MTM 651 - - - 651
Deferred tax (net) on Ind AS adjustments. (55) 103 (264) 528 310
Total 78 (378) (725) 117 (909)
Net Profit for the period under Ind AS 7,184 4,950 5,917 4,424 22,474
Particulars
Profit Reconciliation
Quarter ended

Page 42 of 63
11.3 Reconciliation of Statement of Income for the full year ended March 31, 2016
1. Previous periods’ figures have been regrouped/ rearranged wherever necessary to confirm to current period classifications
2. Represents adjustment for revenue equalisation and deferred revenue on security deposits received
3. Represents reclassification 4. Represents adjustment for lease rent equalisation and deferred
expense on security deposits paid 5. Represents adjustment for fair valuation of employee benefit funds
6. Represents impact of mark to market on investments and finance cost/income related to fair value discounting entries
7. Represents adjustment for change in fair valuation of asset retirement obligation
8. Represents tax impact for IND AS adjustments and dividend distribution tax on undistributed profits of joint venture
9. Represents reclassification in line with IND AS
Amount in Rs mn
IGAAP1
Adjustments Ind AS
INR Mn's INR Mn's INR Mn's
Income
Revenue from Operations2
123,084 230 123,314
Other income3
2,012 36 2,047
125,096 266 125,361
Expenses
Power and Fuel 42,597 - 42,597
Rent4
10,548 (225) 10,322
Employee benefits expense5
4,316 (37) 4,279
Repairs and maintenance3
9,061 1 9,063
Other expenses3
2,531 44 2,573
69,053 (217) 68,834
Profit before Finance Cost (net), Depreciation and
amortisation, Share of JV and tax 56,043 483 56,527
Finance costs (net)6
(3,228) 1,380 (1,847)
Depreciation and amortization expense7
22,693 (457) 22,236
Charity and donation 371 - 371
Profit before tax 36,207 (440) 35,767
Tax expenses -
Current tax 12,385 - 12,385
Deferred tax8
2 907 908
Total tax expense 12,387 907 13,293
Profit/ (Loss) for the period 23,820 (1,347) 22,474
Other comprehensive income9
- (22) (17)
Total comprehensive income for the year,
net of tax23,820 (1,369) 22,457
Particulars

Page 43 of 63
11.4 Reconciliation of Statement of Financial Position as on March 2016
1. Previous periods’ figures have been regrouped/ rearranged wherever necessary to confirm to current period classifications
2. Adjustment for discounting of Asset Retirement Obligation and corresponding impact of depreciation
3. Effect of measuring investment at fair value 4. Discounting of security deposits paid to fair value 5. Adjustment for annual escalation on rentals income not
equalized over the lease term, being inflation linked 6. Impact of consolidation of Trust not done earlier 7. Adjustment for all the IND AS impacts on Other Equity
8. Discounting of security deposits received to fair value 9. Adjustment for discounting of Asset Retirement Obligation and
employee benefits 10. Tax impact of the IND AS adjustments 11. Adjustment for annual escalation on rentals expense not
equalized over the lease term, being inflation linked 12. Represents reclassification 13. Represents reversal of proposed dividend recognized as
liability 14. Adjustment of processing fee for long term borrowings
Amount in Rs mn
Particulars IGAAP1
Adjustments Ind AS
INR Mn's INR Mn's INR Mn's
Assets
Non-current assets
Property, plant and equipment2
144,704 (5,094) 139,610
Capital Work in Progress 2,245 0 2,246
Other Intangible assets 164 (1) 163
Investment in an associate/ joint venture - - -
Financial assets
Investments3
23,967 4,299 28,266
Other Financial Assets4,12
4,536 (417) 4,119
Income tax recoverable 4,822 (3) 4,819
Other non-current assets4,5
26,507 (23,285) 3,222
206,945 (24,500) 182,445
Current assets
Financial assets
Investments3
14,844 2,439 17,283
Trade receivables 1,916 0 1,915
Cash and cash Equivalent6
20,437 12 20,448
Other Bank Balance12
11,479 (17) 11,462
Other Financial Assets 6,145 (0) 6,145
Other current assets4,8,12
7,423 (2,343) 5,079
62,244 90 62,333
Total assets 269,189 (24,410) 244,778
Equity and liabilities
Equity
Equity share capital 18,967 - 18,967
Other equity7
164,512 (1,216) 163,296
Total equity 183,479 (1,216) 182,263
Non-current liabilities
Financial Liabilities
Other Financial Liabilities8
7,088 (2,346) 4,741
Long term borrowings14
10,767 (21) 10,746
Long Term Provisions9
11,663 (6,393) 5,270
Deferred tax liability10
12,249 (3,048) 9,200
Other non - Current liabilities11,8
5,346 (2,309) 3,037
47,113 (14,117) 32,994
Current liabilities
Financial Liabilities
Trade Payables12
844 4,772 5,617
Short term borrowings12
- 6,300 6,300
Other Current Liabilities12
28,820 (11,458) 17,362
Provisions13,12
8,933 (8,691) 242
38,597 (9,077) 29,521
Total liabilities 85,710 (23,194) 62,515
Total equity and liabilities 269,189 (24,410) 244,778

Page 44 of 63
Section 12
Walk - IND AS Consolidated Results to Proforma Consolidated Results _________________________________________________________________________________________________________
The proforma financial results presented in this section are prepared as per proportionate consolidation method based on segment information in the audited consolidated financial statement of IND AS and underlying information ________________________________________________________________________________________________________________________________________________________________________
12.1 Statement of Income
* Elimination/adjustments represents elimination of intersegment transactions and adjustment for share of profits in JV
Amount in Rs mn
Sep-16 Jun-16 Mar-16 Dec-15 Sep-15 Sep-16 Jun-16 Mar-16 Dec-15 Sep-15 Sep-16 Jun-16 Mar-16 Dec-15 Sep-15 Sep-16 Jun-16 Mar-16 Dec-15 Sep-15
Income
Revenue from operations 14,963 14,531 14,181 13,959 13,726 17,959 17,585 17,646 17,106 16,693 (3) (9) (10) (9) (9) 32,919 32,107 31,817 31,056 30,410
Other income 187 156 183 383 175 147 195 250 104 389 - - - - - 333 351 433 487 564
Total Income 15,150 14,687 14,364 14,342 13,901 18,106 17,780 17,896 17,210 17,082 (3) (9) (10) (9) (9) 33,252 32,458 32,250 31,543 30,974
Power and fuel 5,265 5,039 4,821 5,013 5,055 6,182 6,105 5,565 5,704 5,707 - - - - - 11,447 11,144 10,386 10,717 10,762
Rent 782 761 707 706 676 2,089 2,035 1,970 1,920 1,825 - - - - - 2,871 2,796 2,677 2,626 2,501
Employee expenses 674 699 625 656 662 497 447 463 439 430 - - - - - 1,171 1,147 1,088 1,095 1,092
Repairs and maintenance 1,037 1,004 1,020 943 971 1,275 1,294 1,265 1,326 1,241 - - - - - 2,312 2,298 2,285 2,269 2,212
Other expenses 286 283 275 379 338 295 357 419 290 338 - - - - - 581 640 694 669 676
Intersegmental expense - - - - - 3 10 10 10 9 (3) (10) (10) (10) (9) - - - - -
Total Expense 8,044 7,786 7,448 7,697 7,702 10,342 10,248 9,692 9,689 9,550 (3) (10) (10) (10) (9) 18,382 18,025 17,130 17,376 17,243
Profit/(Loss) before share of profit of a
joint venture, Depreciation, Finance cost
and tax
7,106 6,901 6,916 6,645 6,199 7,764 7,532 8,204 7,521 7,532 - 1 - 1 - 14,870 14,433 15,120 14,167 13,731
Finance Costs (Net) (3,063) (1,765) (1,572) (250) (2,331) 591 484 543 542 656 - - - - - (2,472) (1,282) (1,029) 292 (1,675)
Depreciation and Amortization Expense 2,877 2,879 2,952 2,910 2,871 2,752 2,770 2,745 2,616 2,692 - - - - - 5,629 5,649 5,697 5,526 5,562
Charity & Donation 29 135 37 57 70 10 - 155 - 2 - - - - - 39 135 192 57 72
Profit/(Loss) before share of profit of a
joint venture and tax 7,263 5,652 5,499 3,928 5,589 4,411 4,279 4,761 4,363 4,182 - 1 - 1 - 11,674 9,931 10,260 8,292 9,772
Share of profits in Joint Venture 2,866 2,771 3,059 2,845 2,732 - - - - - (2,866) (2,771) (3,059) (2,845) (2,732) - - - - -
Profit before tax 10,129 8,423 8,558 6,773 8,321 4,411 4,279 4,761 4,363 4,182 (2,866) (2,770) (3,059) (2,844) (2,732) 11,674 9,931 10,260 8,292 9,772
Tax expense 2,391 861 1,374 1,823 2,405 1,545 1,508 1,702 1,519 1,450 - - - - - 3,936 2,369 3,076 3,342 3,855
Profit for the period 7,738 7,562 7,184 4,950 5,916 2,866 2,771 3,059 2,844 2,732 (2,866) (2,770) (3,059) (2,844) (2,732) 7,738 7,562 7,184 4,950 5,917
Other comprehensive income 28 8 6 (11) (3) (18) (2) (5) (6) (8) 18 2 5 6 7 28 8 6 (11) (4)
Total comprehensive income for the
period7,766 7,570 7,190 4,939 5,913 2,848 2,769 3,054 2,838 2,724 (2,848) (2,768) (3,054) (2,838) (2,725) 7,766 7,570 7,190 4,939 5,913
Proforma Consolidated Statement of Income
(Proportionate Consolidation Method)
D = (A+B+C)Particulars
IND AS Consolidated Statement of Income
(Equity Method)
(A)
Proportionate share of JV
(B)
Eliminations/ Adjustment*
(C)
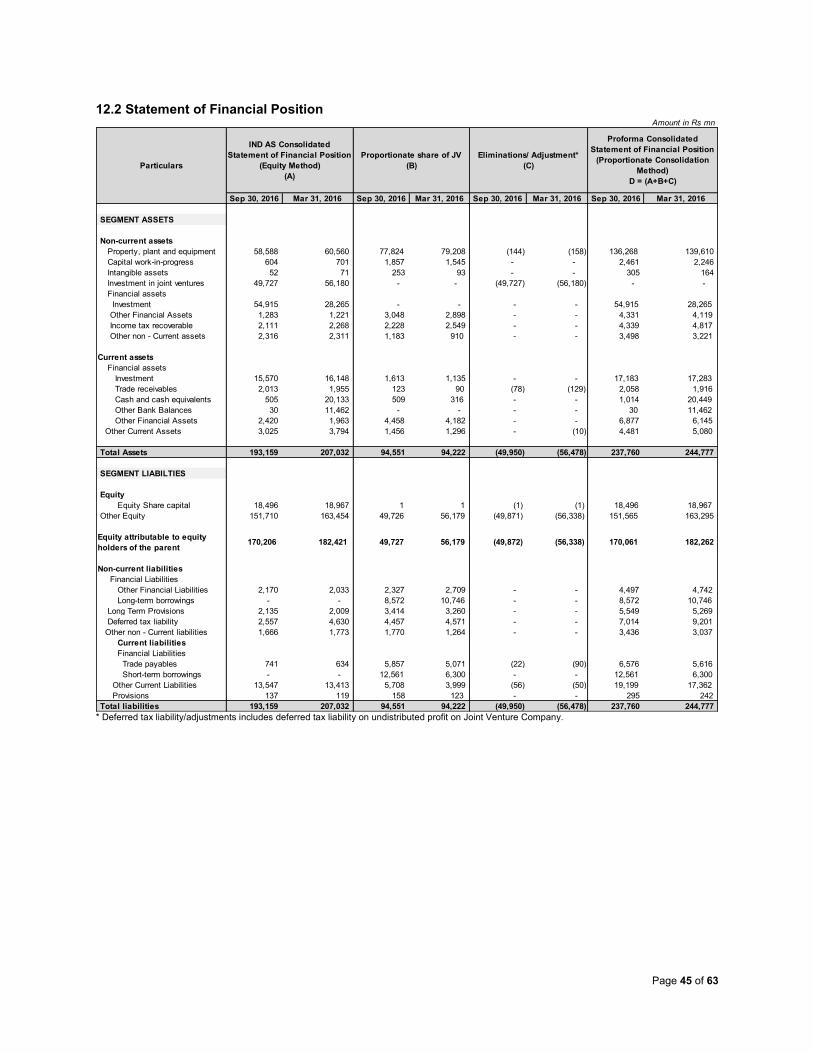
Page 45 of 63
12.2 Statement of Financial Position
* Deferred tax liability/adjustments includes deferred tax liability on undistributed profit on Joint Venture Company.
Amount in Rs mn
Sep 30, 2016 Mar 31, 2016 Sep 30, 2016 Mar 31, 2016 Sep 30, 2016 Mar 31, 2016 Sep 30, 2016 Mar 31, 2016
SEGMENT ASSETS
Non-current assets
Property, plant and equipment 58,588 60,560 77,824 79,208 (144) (158) 136,268 139,610
Capital work-in-progress 604 701 1,857 1,545 - - 2,461 2,246
Intangible assets 52 71 253 93 - - 305 164
Investment in joint ventures 49,727 56,180 - - (49,727) (56,180) - -
Financial assets
Investment 54,915 28,265 - - - - 54,915 28,265
Other Financial Assets 1,283 1,221 3,048 2,898 - - 4,331 4,119
Income tax recoverable 2,111 2,268 2,228 2,549 - - 4,339 4,817
Other non - Current assets 2,316 2,311 1,183 910 - - 3,498 3,221
Current assets
Financial assets
Investment 15,570 16,148 1,613 1,135 - - 17,183 17,283
Trade receivables 2,013 1,955 123 90 (78) (129) 2,058 1,916
Cash and cash equivalents 505 20,133 509 316 - - 1,014 20,449
Other Bank Balances 30 11,462 - - - - 30 11,462
Other Financial Assets 2,420 1,963 4,458 4,182 - - 6,877 6,145
Other Current Assets 3,025 3,794 1,456 1,296 - (10) 4,481 5,080
Total Assets 193,159 207,032 94,551 94,222 (49,950) (56,478) 237,760 244,777
SEGMENT LIABILTIES
Equity
Equity Share capital 18,496 18,967 1 1 (1) (1) 18,496 18,967
Other Equity 151,710 163,454 49,726 56,179 (49,871) (56,338) 151,565 163,295
Equity attributable to equity
holders of the parent 170,206 182,421 49,727 56,179 (49,872) (56,338) 170,061 182,262
Non-current liabilities
Financial Liabilities
Other Financial Liabilities 2,170 2,033 2,327 2,709 - - 4,497 4,742
Long-term borrowings - - 8,572 10,746 - - 8,572 10,746
Long Term Provisions 2,135 2,009 3,414 3,260 - - 5,549 5,269
Deferred tax liability 2,557 4,630 4,457 4,571 - - 7,014 9,201
Other non - Current liabilities 1,666 1,773 1,770 1,264 - - 3,436 3,037
Current liabilities
Financial Liabilities
Trade payables 741 634 5,857 5,071 (22) (90) 6,576 5,616
Short-term borrowings - - 12,561 6,300 - - 12,561 6,300
Other Current Liabilities 13,547 13,413 5,708 3,999 (56) (50) 19,199 17,362
Provisions 137 119 158 123 - - 295 242
Total liabilities 193,159 207,032 94,551 94,222 (49,950) (56,478) 237,760 244,777
Particulars
Proportionate share of JV
(B)
Proforma Consolidated
Statement of Financial Position
(Proportionate Consolidation
Method)
D = (A+B+C)
Eliminations/ Adjustment*
(C)
IND AS Consolidated
Statement of Financial Position
(Equity Method)
(A)

Page 46 of 63
Section D
Key Accounting Policies and Glossary

Page 47 of 63
Section 13
Basis of Preparation and Key Accounting Policies as per IND AS
1. Corporate information
Bharti Infratel Limited (‘the Company’ or ‘BIL’) incorporated on November 30, 2006 with the object of, inter-alia, setting up, operating and maintaining wireless communication towers. The Company received the certificate of commencement of business on April 10, 2007 from the Registrar of Companies. The Registered office of the Company is situated at Bharti Crescent, 1, Nelson Mandela Road, Vasant Kunj, Phase – II, New Delhi – 110070. The Company is publicly traded on National Stock Exchange (NSE) and BSE India. The Company has entered into a joint venture agreement with Vodafone India Limited and Aditya Birla Telecom Limited to provide passive infrastructure services in 15 Telecom circles of India and formed Indus Towers Limited for such purpose. The Company and Vodafone India Limited are holding approximately 42% each in Indus Towers Limited and the balance 16% is held by Aditya Birla Telecom Limited. Indus Towers Limited is incorporated in India. The wholly owned subsidiary, Bharti Infratel Services Limited, was incorporated on June 4, 2013 with the object of providing operation and management services of all kinds in the field of telecom infrastructure (both active and passive), telecom equipments, wireless communication towers either on its own or in alliance with any other Person/Body/Bodies Corporate incorporated in India or abroad. The company was evaluating various business opportunities, but due to various reasons remained inoperative since incorporation. In view of this, Board of Directors at their meeting held on 29th March 2016 have agreed to initiate the process of striking off the name of the company from the Register of Registrar of Companies under Fast Track Exit Mode. The name of the company has been striken off from the register of Registrar of companies vide notice dated May 24, 2016. A wholly owned subsidiary, Smartx Services Limited, has been incorporated on September 21, 2015 with the object of transmission through Optic Fibre Cables and setting up Wi-Fi hotspots for providing services to telecom operators and others on sharing basis. The Company together with its wholly owned subsidiary Smartx Services Limited and directly controlled trust, Bharti Infratel Employees’ Welfare Trust referred to as ‘the Group’. The Group is a leading telecom passive infrastructure service provider in India.
The Group’s parent company is Bharti Airtel Limited (‘BAL’) as at September 30, 2016. The interim condensed consolidated financial statements were authorised for issue in accordance with resolution of the directors on October 24, 2016
2. Basis of preparation
a) Statement of compliance
These interim condensed consolidated financial statements (“financial statements”) have been prepared to comply in all material respects with the Indian Accounting Standard (Ind AS) notified under section 133 of the Companies Act, 2013, read together with Rule 3 of the Companies (Indian Accounting Standards) Rules, 2015 and Companies (Indian Accounting Standards) Amendment Rules, 2016 issued by the Ministry of Corporate Affairs
b) Basis of preparation
These interim consolidated financial statements are
covered by Ind AS 101, complete set of First time
adoption of Indian Accounting Standards, as they are
part of the period covered by the Group first Ind AS
financial statements for the year ending March 31,
2017 and are prepared in accordance with Ind AS 34,
Interim financial reporting notified under the
Companies (Indian Accounting Standards) Rules,
2015.
Accordingly, the said interim Consolidated financial
statements do not include all the information required
for a complete set of Ind AS financial statements.
However, selected explanatory notes are included to
explain events and transactions that are significant for
the understanding of the Group’s financial position
and performance. Until the first complete Ind AS
financial statements are issued, the balances in these
financial statements can change if (a) there are any
new Ind AS standards issued through March 31,
2017, (b) there are any amendments/modifications
made to existing Ind AS standards or interpretations
thereof through March 31, 2017 effecting the Ind AS
balances in these financial statements and (c) if the
Group makes any changes in the elections and/or
exemptions selected on adoption of Ind AS at its
transition date of April 1, 2015.
For all periods up to and including the year ended
March 31, 2016, the Group prepared its financial
statements in accordance with accounting standards
notified under the section 133 of the Companies Act
2013, read together with paragraph 7 of the

Page 48 of 63
Companies (Accounts) Rules, 2014 (Indian GAAP).
The transition was carried out from the accounting
principles generally accepted in India (Indian GAAP)
which is considered as previous GAAP, as defined in
Ind AS 101.
These interim financial statements for the three
months and six months period ended September 30,
2016 are the Second interim financial statements
which has been prepared by the group in accordance
with Ind AS. The preparation of these financial
statements resulted in changes to the accounting
policies as compared to most recent annual financial
statements prepared under Indian GAAP (“Previous
GAAP”). Accounting policies have been applied
consistently to all periods presented in the financial
statements. They have also been applied in preparing
the Ind AS opening balance sheet as at April 1, 2015
for the purpose of transition to Ind AS and as required
by Ind AS 101.
The financial statements have been prepared on the
accrual and going concern basis and the historical
cost convention, except for the certain financial
assets, financial liabilities and certain other items
which have been measured at fair value as required
under relevant Ind AS.
c) Basis of Consolidation
The Consolidated financial statements comprises the
financial statements of the Group, its subsidiaries,
joint venture and its directly controlled entity which are
as follows:-:-
Entity Coutry of
Incorporation
Principal Service Relationship Shareholding
as at
September 30,2016
Shareholding
as at
March 31, 2016
Indus Towers
Limited India
Passive Infrastructure
Services Joint Venture 42% 42%
Bharti Infratel
Services Limited* India
Active and Passive
Infrastructure Services Subsidiary - -
Smartx Services
Limited* India Optical Fibre Service Subsidiary 100% 100%
Name of Trust Coutry of
Incorporation
Bharti Infratel
Employee Welfare
Trust India
Details of Controlled Trust
* Refer note 1
Accounting for Subsidiaries:
A subsidiary is an entity controlled by the Group.
Control exists when the parent has power over the
entity, is exposed, or has rights to variable returns
from its involvement with the entity and has the ability
to affect those returns by using its power over entity.
Power is demonstrated through existing rights that
give the ability to direct relevant activities, those which
significantly affect the entity’s returns.
Subsidiaries are fully consolidated from the date on
which Group obtains control over the subsidiary and
ceases when the Group loses control of the
subsidiary. Assets, liabilities, income and expenses of
a subsidiary acquired or disposed of during the year
are included in the consolidated financial statements
from the date the Group gains control until the date
the Group ceases to control the subsidiary. Where
necessary, adjustments are made to the financial
statements of subsidiaries to bring their accounting
policies and accounting period in line with those used
by the Group. All intra-group transactions, balances,
income and expenses and cash flows are eliminated
on consolidation.
Interest in a Joint Venture
A joint venture is a type of joint arrangement whereby
the parties that have joint control of the arrangement
have rights to the net assets of the joint venture. Joint
control is the contractually agreed sharing of control
of an arrangement, which exists only when decisions
about the relevant activities require unanimous
consent of the parties sharing control.
The Group’s investments in its joint ventures are
accounted for using the equity method. Under the
equity method, investments in joint ventures are
carried in the consolidated statement of financial
position at cost as adjusted for post-acquisition
changes in the Group’s share of the net assets of the
joint ventures, less any impairment in the value of the
investments. Additional losses are provided for, and a
liability is recognized, only to the extent that the
Group has incurred legal or constructive obligation or
made payments on behalf of the joint venture.
The joint venture are accounted for from the date on
which group obtains joint control over Joint Venture
for the same reporting period as the Group. Where
necessary, adjustments are made to bring the
accounting policies in line with those of the Group.
3. Summary of significant accounting policies
a) Property, Plant and Equipment
Property, plant and equipment including Capital work
in progress is stated at cost, except assets acquired
under Schemes of Arrangement, which are stated at
fair values as per the Schemes, net of accumulated
depreciation and accumulated impairment losses, if
any. Such cost includes the cost of replacing part of
the plant and equipment and borrowing costs for long
term construction projects if the recognition criteria

Page 49 of 63
are met. When significant parts of property, plant and
equipment are required to be replaced in intervals, the
group recognizes such parts as separate component
of assets with specific useful lives and provides
depreciation over their useful life. Subsequent costs
are included in the asset’s carrying amount or
recognized as a separate asset, as appropriate, only
when it is probable that future economic benefits
associated with the item will flow to the entity and the
cost of the item can be measured reliably. The
carrying amount of the replaced part is derecognized.
All other repair and maintenance costs are recognised
in the statement of Consolidated Profit and loss as
incurred.
The present value of the expected cost for the
decommissioning of the asset after its use is included
in the cost of the respective asset if the recognition
criteria for a provision are met.
An item of property, plant and equipment and any
significant part initially recognised is derecognised
upon disposal or when no future economic benefits
are expected from its use or disposal. Any gain or
loss arising on derecognition of the asset (calculated
as the difference between the net disposal proceeds
and the carrying amount of the asset) is included in
the Statement of Consolidated Profit and Loss when
the asset is derecognised.
Assets are depreciated to the residual values on a
straight-line basis over the estimated useful lives.
Estimated useful lives of the assets are as follows:
Useful lives
Office Equipment 2 years / 5 years
Computer 3 years
Vehicles 5 years
Furniture and Fixtures 5 years
Plant & Machinery 3 to 20 Years
Leasehold Improvement Period of Lease or useful life whichever is less
The existing useful lives of tangible assets are different from the useful lives as prescribed under Part C of Schedule II to the Companies Act, 2013 and the group believes that this is the best estimate on the basis of technical evaluation and actual usage period. The existing realizable values of tangible assets are different from 5% as prescribed under Part C of Schedule II to the Companies Act, 2013 and the
group believes that this is the best estimate on the basis of actual realization. The assets’ residual values and useful lives are reviewed at each financial year end or whenever there are indicators for impairment, and adjusted prospectively.
b) Intangible Assets
Intangible assets are recognized when the entity
controls the asset, it is probable that future economic
benefits attributed to the asset will flow to the entity
and the cost of the asset can be reliably measured.
At initial recognition, the separately acquired
intangible assets are recognised at cost. Intangible
assets with finite useful lives are carried at cost less
accumulated amortisation and accumulated
impairment losses, if any.
Intangible assets are amortised over the useful
economic life and assessed for impairment whenever
there is an indication that the intangible asset may be
impaired. The amortisation period and the
amortisation method for an intangible asset are
reviewed at least at the end of each reporting period.
Changes in the expected useful life or the expected
pattern of consumption of future economic benefits
embodied in the asset are considered to modify the
amortisation period or method, as appropriate, and
are treated as changes in accounting estimates. The
amortisation expense on intangible assets is
recognised in the statement of Consolidated Profit
and Loss unless such expenditure forms part of
carrying value of another asset.
Software is capitalized at the amounts paid to acquire
the respective license for use and is amortised over
the period of license, generally not exceeding three
years.
Gains or losses arising from derecognition of an
intangible asset are measured as the difference
between the net disposal proceeds and the carrying
amount of the asset and are recognised in the
Statement of Consolidated Profit and Loss within
other income when the asset is derecognised.
c) Impairment of non-financial assets
The Group assesses, at each reporting date, whether
there is an indication that an asset may be impaired. If
any indication exists, or when annual impairment
testing for an asset is required, the Group estimates
the asset’s recoverable amount. An asset’s
recoverable amount is the higher of an asset’s or
cash-generating unit’s (CGU) fair value less costs of

Page 50 of 63
disposal and its value in use. Recoverable amount is
determined for an individual asset, unless the asset
does not generate cash inflows that are largely
independent of those from other assets or groups of
assets. When the carrying amount of an asset or
CGU exceeds its recoverable amount, the asset is
considered impaired and is written down to its
recoverable amount.
In assessing value in use, the estimated future cash
flows are discounted to their present value using a
pre-tax discount rate that reflects current market
assessments of the time value of money and the risks
specific to the asset. In determining fair value less
costs of disposal, recent market transactions are
taken into account. If no such transactions can be
identified, an appropriate valuation model is used.
Impairment losses, if any, are recognized in
Statement of Consolidated Profit and Loss as a
component of depreciation and amortisation expense.
A previously recognised impairment loss is reversed
only if there has been a change in the assumptions
used to determine the asset’s recoverable amount
since the last impairment loss was recognised. The
reversal is limited to the extent the carrying amount
of the asset does not exceed its recoverable amount,
nor exceed the carrying amount that would have been
determined, net of depreciation or amortisation, had
no impairment loss been recognised for the asset in
prior years. Such reversal is recognized in the
Statement of Consolidated Profit and Loss when the
asset is carried at the revalued amount, in which case
the reverse is treated as a revaluation increase.
d) Current versus non-current classification
The Group presents assets and liabilities in the
balance sheet based on current/ non-current
classification. An asset is treated as current when it is:
Expected to be realised or intended to be sold or consumed in normal operating cycle
Held primarily for the purpose of trading
Expected to be realised within twelve months after the reporting period, or
Cash or cash equivalent unless restricted from being exchanged or used to settle a liability for at least twelve months after the reporting period
All other assets are classified as non-current.
A liability is current when:
It is expected to be settled in normal operating
cycle
It is held primarily for the purpose of trading
It is due to be settled within twelve months after
the reporting period, or
There is no unconditional right to defer the
settlement of the liability for at least twelve
months after the reporting period
The Group classifies all other liabilities as non-current.
Deferred tax assets and liabilities are classified as non-
current assets and liabilities.
The operating cycle is the time between the acquisition of
assets for processing and their realisation in cash and
cash equivalents. The Group has identified twelve
months as its operating cycle.
e) Leases
The determination of whether an arrangement is (or
contains) a lease is based on the substance of an
arrangement at inception date: whether fulfilment of the
arrangement is dependent on the use of a specific asset
or assets and the arrangement conveys a right to use the
asset, even if that right is not explicitly specified in an
arrangement.
Group as a lessee
A lease is classified at the inception date as a finance
lease or on operating lease. A lease that transfers
substantially all the risks and rewards incidental to
ownership to the group is classified as a finance lease.
Finance leases are capitalized at the commencement of
the lease at the inception date fair value of the leased
property or, if lower, at the present value of the minimum
lease payments. Lease payments are apportioned
between finance charges and reduction of the lease
liability so as to achieve a constant rate of interest on the
remaining balance of the liability. Finance charges are
recognised in finance costs in the statement of
Consolidated Profit and Loss, unless they are directly
attributable to qualifying assets, in which case they are
capitalized in accordance with the Group policy on the
borrowing costs.
Leased assets are depreciated over the useful life of the
asset. However, if there is no reasonable certainty that
the group will obtain ownership by the end of the lease
term, the asset is depreciated over the shorter of the
estimated useful life of the asset and the lease term.
Operating lease payments are recognized as an expense
on a straight-line basis over the lease term and
escalation in the contract, which are structured to
compensate expected general inflationary increase are
not straight lined. Contingent rents are recognized as
expense in the period in Statement of Consolidated Profit
and Loss in which they are incurred

Page 51 of 63
Group as a Lessor
Leases are classified as finance leases when
substantially all of the risks and rewards of ownership
transfer from the group to the lessee. Amounts due
from lessees under finance leases are recorded as
receivables at the group net investment in the leases.
Finance lease income is allocated to accounting
periods so as to reflect a constant periodic rate of
return on the net investment outstanding in respect of
the lease.
Leases where the group does not transfer
substantially all the risks and rewards incidental to
ownership of the asset are classified as operating
leases. Initial direct costs incurred in negotiating an
operating lease are added to the carrying amount of
the leased asset and recognized over the lease term
on the same basis as rental income.
Lease rentals under operating leases are recognized
as income on a straight-line basis over the lease term
and escalation in the contract, which are structured to
compensate compensate expected general
inflationary increase are not straight lined. Contingent
rents are recognized as revenue in the period in
which they are earned.
f) Share-based payments
The Group issues equity-settled and cash-settled
share-based options to certain employees. These are
measured at fair value on the date of grant.
The fair value determined at the grant date of the
equity-settled share-based options is expensed over
the vesting period, based on the Group’s estimate of
the shares that will eventually vest.
The fair value determined on the grant date of the
cash settled share based options is expensed over
the vesting period, based on the Group’s estimate of
the shares that will eventually vest. At the end of the
each reporting period, until the liability is settled, and
at the date of settlement, the fair value of the liability
is recognized, with any changes in fair value
pertaining to the vested period recognized
immediately in statement of consolidated profit and
loss.
At the vesting date, the Group’s estimate of the
shares expected to vest is revised to equal the
number of equity shares that ultimately vest.
Fair value is measured using Lattice-based option
valuation model and Black-Scholes framework and is
recognized as an expense, together with a
corresponding increase in equity/ liability as
appropriate, over the period in which the options vest
using the graded vesting method. The expected life
used in the model is adjusted, based on
management’s best estimate, for the effects of non-
transferability, exercise restrictions and behavioral
considerations. The expected volatility and forfeiture
assumptions are based on historical information.
Where the terms of a share-based payments are
modified, the minimum expense recognized is the
expense as if the terms had not been modified, if the
original terms of the award are met. An additional
expense is recognized for any modification that
increases the total fair value of the share-based
payment transaction, or is otherwise beneficial to the
employee as measured at the date of modification.
Where an equity-settled award is cancelled, it is
treated as if it is vested on the date of cancellation,
and any expense not yet recognized for the award is
recognized immediately. This includes any award
where non-vesting conditions within the control of
either the entity or the employee are not met.
However, if a new award is substituted for the
cancelled award, and designated as a replacement
award on the date that it is granted, the cancelled and
new awards are treated as if they were a modification
of the original award, as described in the previous
paragraph.
The dilutive effect of outstanding options is reflected
as additional share dilution in the computation of
diluted earnings per share.
g) Cash and Cash equivalents
Cash and cash equivalents in the balance sheet
comprise cash at banks and on hand and short-term
deposits with an original maturity of three months or
less, which are subject to an insignificant risk of
changes in value. Bank overdrafts that are repayable
on demand and form an integral part of the group
cash management are included as a component of
cash and cash equivalents for the purpose of the
Statement of Cash Flows.
h) Treasury shares
The Group has created Bharti Infratel Employee
Welfare Trust, for administration of ESOP Schemes of
the Group. The Trust bought shares of the Group
from the market, for giving shares to employees. The
group treats Trust as its extension and shares held by
Trust are treated as treasury shares.
Own equity instruments (“treasury shares”) which are
reacquired through Bharti Infratel Employees Welfare
Trust are recognized at cost and deducted from

Page 52 of 63
equity. No gain or loss is recognized in the Statement
of Consolidated Profit and Loss on the purchase,
sale, issue or cancellation of the group own equity
instruments. Any difference between the carrying
amount and the consideration, if reissued, is
recognized in the share premium. Share options
exercised during the reporting period are satisfied
with treasury shares.
i) Financial Instruments
A financial instrument is any contract that gives rise to
a financial asset of one entity and a financial liability
or equity instrument of another entity.
Financial Assets
Initial Recognition and Measurement
All financial assets are recognised initially at fair value
plus, in the case of financial assets not recorded at
fair value through profit or loss, transaction costs that
are attributable to the acquisition of the financial
asset.
Subsequent Measurement
For purposes of subsequent measurement, financial
assets are classified in four categories:
Debt instruments at amortised cost
Debt instruments at fair value through other
comprehensive income (FVTOCI)
Debt instruments, derivatives and equity
instruments at fair value through Profit & Loss
(FVTPL)
Equity instruments measured at fair value through
other comprehensive income (FVTOCI)
Debt Instruments at Amortised Cost
The category applies to the Group’s trade
receivables, unbilled revenue, Other Bank balances,
security deposits, etc.
A ‘debt instrument’ is measured at the amortised cost
if both the following conditions are met:
The asset is held within a business model whose
objective is to hold assets for collecting contractual
cash flows and
Contractual terms of the asset give rise on
specified dates to cash flows that are solely
payments of principal and interest (SPPI) on the
principal amount outstanding
This category is most relevant to the Group.
After initial measurement, such financial assets are
subsequently measured at amortised cost using the
effective interest rate (EIR) method. Amortised cost is
calculated by taking into account any discount or
premium on acquisition and fees or costs that are an
integral part of the EIR. The accretion of EIR is
recorded as a finance income in the Statement of
Consolidated Profit and Loss. The losses arising from
impairment are recognised in the Statement of
Consolidated Profit and Loss.
Debt instrument at FVTOCI
A ‘debt instrument’ is classified as at the FVTOCI if
both of the following criteria are met:
a) The objective of the business model is achieved
both by collecting contractual cash flows and selling
the financial assets, and
b) The asset’s contractual cash flows represent SPPI.
Debt instruments included within the FVTOCI
category are measured initially as well as at each
reporting date at fair value. Fair value movements are
recognized in the other comprehensive income (OCI).
However, the group recognizes interest income,
impairment losses & reversals in the statement of
Consolidated Profit and Loss. On derecognition of the
asset, cumulative gain or loss previously recognised
in OCI is reclassified from the equity to Statement of
Consolidated Profit and Loss.
Interest earned whilst holding FVTOCI debt
instrument is reported as interest income.
The Group has classified Investment in Bonds within
this category.
Debt instrument at FVTPL
FVTPL is a residual category for debt instruments.
Any debt instrument, which does not meet the criteria
for categorization as at amortized cost or as FVTOCI,
is classified as at FVTPL.
In addition, the group may elect to designate a debt
instrument, which otherwise meets amortized cost or
FVTOCI criteria, as at FVTPL. However, such election
is allowed only if doing so reduces or eliminates a
measurement or recognition inconsistency (referred to
as ‘accounting mismatch’).
The group has not designated any debt instrument as
at FVTPL.
Debt instruments included within the FVTPL category
are measured at fair value with all changes
recognized in the statement of Consolidated Profit
and Loss. This category applies to the Group
investment in mutual funds.

Page 53 of 63
Equity investments
All equity investments in scope of Ind AS 109 are
measured at fair value. Equity instruments which are
held for trading and contingent consideration
recognised by an acquirer in a business combination
to which Ind AS103 applies are classified as at
FVTPL. There are no such investments in the Group.
De-recognition
A financial asset (or, where applicable, a part of a
financial asset) is primarily derecognised (i.e.
removed from the Group’s balance sheet) when:
The contractual rights to receive cash flows from
the asset have expired, or
The Group has transferred its contractual rights
to receive cash flows from the financial asset or
has assumed an obligation to pay the received
cash flows in full without material delay to a third
party under a ‘pass-through’ arrangement; and
either (a) the Group has transferred
substantially all the risks and rewards of the
asset, or (b) the Group has neither transferred
nor retained substantially all the risks and
rewards of the asset, but has transferred control
of the asset.
Impairment on Financial Assets
In accordance with Ind AS 109, the Group applies
expected credit loss (ECL) model for measurement
and recognition of impairment loss on the Financial
assets that are debt instruments and are initially
measured at fair value with subsequent measurement
at amortised cost e.g Trade receivables, unbilled
revenue etc.
The Group follows ‘simplified approach’ for
recognition of impairment loss allowance for trade
receivables
The application of simplified approach does not
require the group to track changes in credit risk.
Rather, it recognises impairment loss allowance
based on lifetime ECLs at each reporting date, right
from its initial recognition.
For recognition of impairment loss on other financial
assets and risk exposure, the Group determines
whether there has been a significant increase in the
credit risk since initial recognition. If credit risk has not
increased significantly, twelve month ECL is used to
provide for impairment loss. However, if credit risk
has increased significantly, lifetime ECL is used. If, in
the subsequent period, credit quality of the instrument
improves such that there is no longer a significant
increase in credit risk since initial recognition, then the
entity reverts to recognising impairment loss
allowance based on a twelve month ECL.
ECL is the difference between all contractual cash
flows that are due to the group in accordance with the
contract and all the cash flows that the entity expects
to receive (i.e., all cash shortfalls), discounted at the
original EIR.
Financial Liabilities
Initial Recognition and Measurement
Financial liabilities are classified, at initial recognition,
as financial liabilities at fair value through profit or
loss, loans and borrowings or payables, as
appropriate
All financial liabilities are recognised initially at fair
value and, in the case of loans and borrowings and
payables, net of directly attributable transaction costs.
The Group’s financial liabilities include trade and
other payables, security deposits, etc
Subsequent measurement
The measurement of financial liabilities depends on
their classification, as described below:
Financial liabilities at FVTPL
Financial liabilities at fair value through profit or loss
include financial liabilities held for trading and
financial liabilities designated upon initial recognition
as at fair value through profit or loss. Financial
liabilities are classified as held for trading if they are
incurred for the purpose of repurchasing in the near
term.
Financial liabilities designated upon initial recognition
at fair value through profit or loss are designated as
such at the initial date of recognition, and only if the
criteria in Ind AS 109 are satisfied. For liabilities
designated as FVTPL, fair value gains/ losses
attributable to changes in own credit risk are
recognized in OCI. These gains/ loss are not
subsequently transferred to Statement of
Consolidated Profit and Loss. However, the group
may transfer the cumulative gain or loss within equity.
All other changes in fair value of such liability are
recognised in the Statement of profit or loss. The
group has designated the security deposits received
from operators as financial liability as at fair value
through profit and loss.
Financial Liabilities at Amortised Cost
This Category includes Security deposit received,
trade payables etc. After initial recognition, such
liabilities are subsequently measured at amortised
Page 54 of 63
cost using the EIR method. Gains and losses are
recognised in profit or loss when the liabilities are
derecognised as well as through the EIR amortisation
process. Amortised cost is calculated by taking into
account any discount or premium on acquisition and
fees or costs that are an integral part of the EIR. The
EIR amortisation is included as finance costs in the
Statement of Consolidated Profit and Loss.
De-recognition
A financial liability is derecognised when the
obligation under the liability is discharged or cancelled
or expires. When an existing financial liability is
replaced by another from the same lender on
substantially different terms or the terms of an existing
liability are substantially modified, such an exchange
or modification is treated as the de-recognition of the
original liability and the recognition of a new liability.
The difference in the respective carrying amounts is
recognised in the Statement of Consolidated Profit
and Loss.
Reclassification of Financial Assets
The Group determines classification of financial
assets and liabilities on initial recognition. After initial
recognition, no reclassification is made for financial
assets which are equity instruments and financial
liabilities. For financial assets which are debt
instruments, a reclassification is made only if there is
a change in the business model for managing those
assets. Changes to the business model are expected
to be infrequent. The Group’s senior management
determines change in the business model as a result
of external or internal changes which are significant to
the Group’s operations. Such changes are evident to
external parties. A change in the business model
occurs when the Group either begins or ceases to
perform an activity that is significant to its operations.
If the Group reclassifies financial assets, it applies the
reclassification prospectively from the reclassification
date which is the first day of the immediately next
reporting period following the change in business
model. The Group does not restate any previously
recognised gains, losses (including impairment gains
or losses) or interest.
Offsetting of Financial Instruments
Financial assets and financial liabilities are offset and
the net amount is reported in the consolidated
balance sheet if there is a currently enforceable legal
right to offset the recognised amounts and there is an
intention to settle on a net basis, to realise the assets
and settle the liabilities simultaneously.
j) Revenue Recognition
Revenue is recognized to the extent that it is probable
that the economic benefits will flow to the Group and
the revenue can be reliably measured. Revenue is
measured at the fair value of the consideration
received/ receivable, excluding discounts, rebates,
and VAT, service tax or duty. The Group assesses its
revenue arrangements against specific criteria, i.e.,
whether it has exposure to the significant risks and
rewards associated with the rendering of services, in
order to determine if it is acting as principal or as an
agent. The Group has concluded that it is acting as a
principal in all of its revenue arrangements. The
following specific recognition criteria must also be met
before revenue is recognized:
Service revenue
Service revenue includes rental revenue for use of
sites and energy revenue for the provision of energy
for operation sites. Rental revenue and energy
revenue is recognized as and when services are
rendered on a monthly basis as per the contractual
terms under agreements entered with customer.
The group has ascertained that the lease payment
received are structured to increase in line with
expected inflationary increase in cost and therefore
not straight-lined.
Unbilled revenue represents revenues recognized
from the last invoice raised to customer to the period
end. These are billed in subsequent periods based on
the rates specified in the master service agreement
with the operators. The Group collects service tax on
behalf of the government and therefore, it is not an
economic benefit flowing to the Group, hence it is
excluded from revenue.
Finance income
Finance income comprises interest income on funds
invested and changes in the fair value of financial
assets at fair value through profit or loss, and that are
recognised in Statement of consolidated profit and
loss. Interest income is recognised as it accrues in
Statement of consolidated profit and loss, using the
effective interest rate (EIR) which is the rate that
exactly discounts the estimated future cash receipts
through the expected life of the financial instrument or
a shorter period, where appropriate, to the net
carrying amount of the financial asset.
Dividend Income
Dividend income is recognised in Statement of
Consolidated profit and loss on the date that the
Group’s right to receive payment is established.
Page 55 of 63
k) Taxes
Current income tax
Current income tax assets and liabilities for the
current and prior periods are measured at the amount
expected to be recovered from or paid to the taxation
authorities. The tax rates and tax laws used to
compute the amount are those that are enacted or
substantively enacted, by the reporting date.
Current income tax relating to items recognized
directly in equity is recognized in equity and not in the
statement of profit and loss. The Group periodically
evaluates positions taken in the tax returns with
respect to situations in which applicable tax
regulations are subject to interpretation and
establishes provisions where appropriate.
Deferred tax
Deferred tax liability is provided on temporary
differences at the reporting date between the tax base
of assets and liabilities and their carrying amounts for
financial reporting purposes at the reporting date.
Deferred tax liabilities are recognised for all taxable
temporary differences, except:
when the deferred tax liability arises from the
initial recognition of goodwill or of an asset or
liability in a transaction that is not a business
combination and, at the time of the transaction,
affects neither the accounting profit nor taxable
profit / (tax loss).
in respect of taxable temporary differences
associated with investments in subsidiaries,
associates and interests in joint ventures, where
the timing of the reversal of the temporary
differences can be controlled and it is probable
that the temporary differences will not reverse in
the foreseeable future.
Deferred tax assets are recognised for all deductible
temporary differences, carry forward of unused tax
credits and unused tax losses, to the extent that it is
probable that taxable profit will be available against
which the deductible temporary differences, and the
carry forward of unused tax credits and unused tax
losses can be utilised except:
when the deferred tax asset relating to the
deductible temporary difference arises from the
initial recognition of an asset or liability in a
transaction that is not a business combination
and, at the time of the transaction, affects
neither the accounting profit nor taxable profit /
(tax loss).
in respect of deductible temporary differences
associated with investments in subsidiaries,
associates and interests in joint ventures,
deferred tax assets are recognised only to the
extent that it is probable that the temporary
differences will reverse in the foreseeable future
and taxable profit will be available against which
the temporary differences can be utilized.
The carrying amount of deferred tax assets is
reviewed at each reporting date and reduced to the
extent that it is no longer probable that sufficient
taxable profit will be available to allow all or part of the
deferred tax asset to be utilized. Unrecognized
deferred tax assets are reassessed at each reporting
date and are recognised to the extent that it has
become probable that future taxable profits will allow
the deferred tax asset to be recovered.
Deferred tax assets and deferred tax liabilities are
offset, if a legally enforceable right exists to set off
current income tax assets against current income tax
liabilities and the deferred taxes relate to the same
taxable entity and the same taxation authority
l) Borrowing costs
Borrowing costs directly attributable to the acquisition,
construction or production of an asset that necessarily
takes a substantial period of time to get ready for its
intended use or sale are capitalized as part of the cost
of the asset. All other borrowing costs are expensed
in the period in which they occur. Borrowing costs
consist of interest and other costs that an entity incurs
in connection with the borrowing of funds.
Borrowing cost also includes exchange differences to
the extent regarded as an adjustment to the
borrowing costs..
m) Dividend Payments
Provision for dividend is recognized, when it is
approved by the shareholders and the distribution is
no longer at the discretion of the group.
n) Share capital
Ordinary shares
Ordinary shares are classified as equity. Incremental
costs directly attributable to the issue of ordinary
shares and share options are recognised as a
deduction from equity, net of any tax effects.
o) Retirement and other employee benefits
Short term employee benefits are recognised in the
period during which the services have been rendered.

Page 56 of 63
The group post-employment benefits include defined
benefit plan and defined contribution plans. The group
also provides other benefits in the form of deferred
compensation and compensated absences.
A defined contribution plan is a post-employment
benefit plan under which an entity pays fixed
contributions to a statutory authority and will have no
legal or constructive obligation to pay further
amounts. The group contributions to defined
contribution plans are recognized in statement of
Profit & loss as they fall due. The group has no further
obligations under these plans beyond its periodic
contributions.
A defined benefit plan is a post-employment benefit
plan other than a defined contribution plan. Under the
defined benefit retirement plan, the group provides
retirement obligation in the form of Gratuity. Under the
plan, a lump sum payment is made to eligible
employees at retirement or termination of employment
based on respective employee salary and years of
experience with the group.
The cost of providing benefits under this plan is
determined on the basis of actuarial valuation carried
out quarterly as at the reporting date by an
independent qualified actuary using the projected unit
credit method. Actuarial gains and losses are
recognised in full in the period in which they occur in
the statement of profit and loss.
The obligation towards the said benefit is recognised
in the balance sheet as the difference between the
fair value of the plan assets and the present value of
the plan liabilities. Scheme liabilities are calculated
using the projected unit credit method and applying
the principal actuarial assumptions as at the date of
Balance Sheet. Plan assets are assets that are held
by a long-term employee benefit fund or qualifying
insurance policies.
All expenses excluding remeasurements of the net
defined benefit liability (asset), in respect of defined
benefit plans are recognized in the profit or loss as
incurred. Remeasurements, comprising actuarial
gains and losses and the return on the plan assets
(excluding amounts included in net interest on the net
defined benefit liability (asset)), are recognized
immediately in the Balance Sheet with a
corresponding debit or credit through other
comprehensive income in the period in which they
occur. Remeasurements are not reclassified to profit
or loss in subsequent periods.
The group provides other benefits in the form of
compensated absences and long term service
awards. The employees of the group are entitled to
compensated absences based on the unavailed leave
balance. The group records liability based on actuarial
valuation computed under projected unit credit
method. Actuarial gains / losses are immediately
taken to the statement of profit and loss and are not
deferred. The group presents the entire leave
encashment liability as a current liability in the
balance sheet, since the group does not have an
unconditional right to defer its settlement for more
than 12 months after the reporting date.
Under the long term service award plan, a lump sum
payment is made to an employee on completion of
specified years of service. The group records the
liability based on actuarial valuation computed under
projected unit credit method. Actuarial gains / losses
are immediately taken to the statement of profit and
loss and are not deferred.
The amount charged to the statement of Profit and
loss in respect of these plans is included within
operating costs.
p) Provisions
(i) General
Provisions are recognised when the Group has a
present obligation (legal or constructive) as a result of
a past event, it is probable that an outflow of
resources embodying economic benefits will be
required to settle the obligation and a reliable
estimate can be made of the amount of the obligation.
When the Group expects some or all of a provision to
be reimbursed, the reimbursement is recognised as a
separate asset, but only when the reimbursement is
virtually certain. The expense relating to a provision is
presented in the Statement of consolidated Profit &
Loss, net of any reimbursement.
If the effect of the time value of money is material,
provisions are discounted using a current pre-tax rate
that reflects, when appropriate, the risks specific to
the liability. The unwinding of discount is recognised
in the Statement of Consolidated Profit & Loss as a
finance cost.
Provisions are reviewed at the end of each reporting
period and adjusted to reflect the current best
estimate. If it is no longer probable that an outflow of
resources would be required to settle the obligation,
the provision is reversed.
(ii) Contingent Assets/ Liabilities
Contingent assets are not recognised. However,
when realisation of income is virtually certain, then the

Page 57 of 63
related asset is no longer a contingent asset, and is
recognised as an asset.
Contingent liabilities are disclosed in notes to
accounts when there is a possible obligation arising
from past events, the existence of which will be
confirmed only by the occurrence or non-occurrence
of one or more uncertain future events not wholly
within the control of the Group or a present obligation
that arises from past events where it is either not
probable that an outflow of resources will be required
to settle or a reliable estimate of the amount cannot
be made.
(iii) Asset Retirement Obligations
Asset retirement obligations (ARO) are provided for
those operating lease arrangements where the Group
has a binding obligation at the end of the lease period
to restore the leased premises in a condition similar to
inception of lease.
Asset retirement obligation are provided at the
present value of expected costs to settle the
obligation using estimated cash flows and are
recognized as part of the cost of the particular asset.
The cash flows are discounted at a current pre-tax
rate that reflects the risks specific to the site
restoration obligation. The unwinding of the discount
is expensed as incurred and recognized in the
Statement of Consolidated Profit & Loss as a finance
cost. The estimated future costs of decommissioning
are reviewed annually and adjusted as appropriate.
Changes in the estimated future costs or in the
discount rate applied are added to or deducted from
the cost of the asset.
q) Earnings Per Share (EPS)
The Group Basic Earning Per Share is determined
based on the net profit attributable to the
shareholders of the parent. Basic Earning Per Share
is computed using the weighted average number of
Equity shares outstanding during the period excluding
shares purchased by the group and held as treasury
shares.
Diluted EPS is computed using the weighted average
common and dilutive common equivalents shares
outstanding during the period including shares options
except where the result would be anti dilutive.
r) Fair Value Measurement
The group measures some financial instruments and
share based payments at fair value at each reporting
date. Fair value is the price that would be received to
sell an asset or paid to transfer a liability in an orderly
transaction between market participants at the
measurement date. The fair value measurement is
based on the presumption that the transaction to sell
the asset or transfer the liability takes place either:
In the principal market for the asset or liability
In the absence of a principal market, in the most
advantageous market for the asset or liability
The principal or the most advantageous market must
be accessible by the group.
The fair value of an asset or a liability is measured
using the assumptions that market participants would
use when pricing the asset or liability, assuming that
market participants act in their economic best interest.
A fair value measurement of a non-financial asset
takes into account a market participant's ability to
generate economic benefits by using the asset in its
highest and best use or by selling it to another market
participant that would use the asset in its highest and
best use.
The group uses valuation techniques that are
appropriate in the circumstances and for which
sufficient data are available to measure fair value,
maximising the use of relevant observable inputs and
minimising the use of unobservable inputs.
All assets and liabilities for which fair value is
measured or disclosed in the financial statements are
categorised within the fair value hierarchy, described
as follows, based on the lowest level input that is
significant to the fair value measurement as a whole:
Level 1 — Quoted (unadjusted) market prices in
active markets for identical assets or liabilities
Level 2 — Valuation techniques for which the lowest
level input that is significant to the fair value
measurement is directly or indirectly observable
Level 3 — Valuation techniques for which the lowest
level input that is significant to the fair value
measurement is unobservable
For assets and liabilities that are recognised in the
financial statements on a recurring basis, the Group
determines whether transfers have occurred between
levels in the hierarchy by re-assessing categorisation
(based on the lowest level input that is significant to
the fair value measurement as a whole) at the end of
each reporting period.
For the purpose of fair value disclosures, the group
has determined classes of assets and liabilities on the
basis of the nature, characteristics and risks of the
asset or liability and the level of the fair value
hierarchy as explained above.

Page 58 of 63
This note summarises accounting policy for fair value.
Other fair value related disclosures are given in the
relevant notes.
s) Foreign Currency
Functional and presentational currency
The group financial statements are presented in INR,
which is also the group functional currency.
Functional currency is the currency of the primary
economic environment in which an entity operates
and is normally the currency in which the entity
primarily generates and expends cash. All the
financial information presented in Indian Rupees
(INR) has been rounded to the nearest of million
rupees, except where otherwise stated.
Transactions and Balances
Transactions in foreign currencies are initially
recorded by the Group at the functional currency spot
rates at the date the transaction first qualifies for
recognition.
Monetary assets and liabilities denominated in foreign
currencies are translated at the functional currency
spot rates of exchange at the reporting date.
Differences arising on settlement or translation of
monetary items are recognised in Statement of
Consolidated Profit or Loss.
Non-monetary assets and liabilities denominated in
foreign currencies that are measured at fair value are
retranslated to the functional currency at the
exchange rate at the date that the fair value was
determined. Non-monetary items that are measured
in terms of historical cost in a foreign currency are
translated using the exchange rate at the date of the
transaction.
t) Corporate social responsibility expenditure
4 Pursuant to the requirements of section 135 of the
Act and rules thereon and guidance note on
“Accounting for expenditure on Corporate Social
Responsibility activities” issued by ICAI, with effect
from April 1, 2015, CSR expenditure is recognized as
an expense in the Statement of Consolidated Profit
and Loss in the period in which it is incurred.

Page 59 of 63
Section 14
GLOSSARY
14.1 Company Related Terms
4 Overlapping Circles
Represents the telecommunication circles of Haryana, Rajasthan, Uttar Pradesh (East) and Uttar Pradesh (West) wherein Bharti Infratel and Indus Towers have overlapping operations. Bharti Infratel is not permitted to roll out any new towers in these telecommunications Circles, although it continues to own and operate its existing telecommunications towers in these Circles, and add additional sharing operators to these towers. New tower rollout in these telecommunication circles is done by Indus.
7 Circles Represents the telecommunications circles of Bihar, Madhya Pradesh and Chhattisgarh, Orissa, Jammu and Kashmir, Himachal Pradesh, Assam and North East states wherein Bharti Infratel operates on exclusive basis.
11 circles Represents the 7 telecommunications circles of Bihar, Madhya Pradesh and Chhattisgarh, Orissa, Jammu and Kashmir, Himachal Pradesh, Assam and North East states wherein Bharti Infratel operates on exclusive basis and the 4 common circles of Haryana, Rajasthan, Uttar Pradesh (East) and Uttar Pradesh (West) wherein Bharti Infratel and Indus Towers have overlapping operations.
15 circles Represents the 11 telecommunication circles of Andhra Pradesh, Delhi, Gujarat, Karnataka, Kerala, Kolkata, Maharashtra & Goa, Mumbai, Punjab, Tamil Nadu (including Chennai) and West Bengal wherein Indus operates on exclusive basis and the 4 common telecommunication circles of Haryana, Rajasthan, Uttar Pradesh (East) and Uttar Pradesh (West) wherein Bharti Infratel and Indus Towers have overlapping operations.
Asset Turnover Asset Turnover is defined as total revenues (revenues (annualized for 12 months), divided by average assets. Asset is
defined as the sum of non-current assets and net current assets. Net current assets are computed by subtracting current
liabilities from current assets. Average assets are calculated by considering average of opening and closing assets of the
relevant period.
Adjusted Fund from Operations (AFFO)
It is not an IND AS measure and is defined as EBITDA adjusted for Maintenance and General Corporate Capex and Non Cash IND AS measures, i.e., operating lease revenue/expense on security deposit received/paid.
Average Co-locations
Average co-locations are derived by computing the average of the Opening and Closing co-locations at the end of relevant period.
Average Sharing Factor
Average Sharing factor is calculated as the average of the opening and closing number of co-locations divided by average of the opening and closing number of towers for the relevant period.
Average Towers
Average towers are derived by computing the average of the opening and closing towers at the end of relevant period.
BISL Bharti Infratel Services Limited
BIVL Bharti Infratel Ventures Limited
Bn Billion
Book Value Per Equity Share
Total shareholder’s equity as at the end of the relevant period divided by outstanding equity shares as at the end of the relevant period.
Capex It includes investment in gross fixed assets and capital work in progress for the relevant period.
Capital Employed Capital Employed is defined as sum of equity attributable to equity shareholders and net debt / (net cash).
Circle(s) 22 service areas that the Indian telecommunications market has been segregated into
Closing Sharing Factor
Closing Sharing factor is calculated as the closing number of co-locations divided by closing number of towers as at the end of relevant period.
Co-locations Co-location is the total number of sharing operators at a tower, and where there is a single operator at a tower; ‘co-location’ refers to that single operator. Co-locations as referred to are revenue-generating co-locations.
Consolidated Financial statements
The Consolidated financial statements of the company till FY 2012-13 represent the financials of Bharti Infratel Ltd Standalone taken together with its wholly owned subsidiary Bharti Infratel Ventures Ltd and Bharti Infratel’s 42% equity interest in Indus Towers Ltd. accounted for by proportionate consolidation. Consequent to Indus Merger, the financial statements of Indus have been prepared after giving effect to the Merger Scheme. Accordingly the Consolidated Financial Results of the Company from quarter ended June 2013 and onwards represent the financials of Bharti Infratel Ltd Standalone taken together with its 42% equity interest in Indus Towers Ltd.

Page 60 of 63
Accounted for by proportionate consolidation and consolidating the new subsidiary Bharti Infratel Services Ltd. With effect from January 2015, Bharti Infratel Employee Welfare Trust (incorporated for allotment of shares to employees as part of Employee Stock Option Plan) has been included as part of the group.
With effect from September 2015, Smartx Services Ltd (incorporated on September 21, 2015 as a wholly owned subsidiary) has been included as a part of the group. Effective 29
th March 2016, Bharti Infratel Services Limited has been closed pursuant to Board’s decision to initiate the
process of striking off the name of the company from the register of ROC.
CSR Corporate Social Responsibility
Cumulative Investments
Cumulative Investments comprises of gross fixed assets (including Capital Work In Progress).
Earnings Per Share (EPS)-Basic
It is computed by dividing net profit or loss attributable for the period to equity shareholders by the weighted average number of equity shares outstanding during the period.
Earnings Per Share (EPS)- Diluted
Diluted earnings per share is calculated by adjusting net profit or loss for the period attributable to equity shareholders and the weighted average number of shares outstanding during the period for the effects of all dilutive potential equity shares.
EBIT Earnings before interest, taxation excluding other income for the relevant period.
EBIT (Including Other Income)
Earnings before interest, taxation including other income for the relevant period.
EBITDA Earnings before interest, taxation, depreciation and amortization and charity and donation excluding other income for the relevant period. It is defined as operating income and does not include depreciation and amortization expense, finance cost (net) and tax expense.
EBITDA (Including Other Income)
Earnings before interest, taxation, depreciation and amortization and charity and donation including other income for the relevant period.
Enterprise Value (EV)
Calculated as sum of Market Capitalization plus Net Debt / (Net Cash) as at the end of the relevant period.
EV / EBITDA (times)(LTM)
Computed by dividing Enterprise Value as at the end of the relevant period (EV) by EBITDA for the preceding (last) 12 months from the end of the relevant period.
Future Minimum Lease Payment Receivable
The Company has entered into long term non-cancellable agreements to provide infrastructure services to telecom operators. Future Minimum Lease Payment Receivable represents minimum amounts receivable in future under the above long term non-cancellable agreements.
Finance Cost (Net) Calculated as Finance Cost less Finance Income
GAAP Generally Accepted Accounting Principle
IGAAP
Indian Generally Accepted Accounting Principle
IND AS Indian Accounting Standards
Indus Merger During the quarter ended June 30, 2013, the Scheme of Arrangement (Scheme) under Section 391 to 394 of the Companies Act, 1956 for transfer of all assets and liabilities as defined in the Scheme from Bharti Infratel Ventures Limited (BIVL), wholly owned subsidiary of the Company, Vodafone Infrastructure Limited (formerly known as Vodafone Essar Infrastructure Limited), and Idea Cellular Tower Infrastructure Limited (collectively referred to as ‘The Transferor companies’) to Indus Towers Limited (Indus) was sanctioned by the Hon’ble High Court of Delhi vide its order dated on April 18, 2013 subject to the final order in another appeal pending before the Division Bench of Delhi High Court and any other orders in any further proceedings thereafter. The Scheme had become operative from June 11, 2013 upon filing of certified copy of the order with the Registrar of Companies with an appointed date of April 1, 2009 i.e. effective date of scheme and accordingly effective June 11, 2013 the transferor companies have ceased to exist and have become part of Indus Towers Ltd. Pursuant to the Indus Merger the IRU agreements between the Transferor Companies and Transferee Company Ceases to exist.
Indus Consolidation Indus Consolidation represents consolidation of Bharti Infratel’s 42% proportionate shareholding in Indus Towers Ltd and 100% of BIVL till FY end 31
st Mar 2013 net of IRU eliminations. W.e.f quarter ending June’13 and onwards Indus
Consolidation represents consolidation of Bharti Infratel’s 42% proportionate shareholding in Indus Towers Ltd.
Intangibles Comprises of acquisition cost of software.
NA Not ascertainable

Page 61 of 63
Interest Coverage Ratio(LTM)
It is computed by dividing EBITDA for the preceding (last) 12 months from the end of relevant period by finance cost for the preceding (last) 12 months.
IRU
Indefeasible right to use
Lease Rent Equalization
It represents the effect of fixed escalations (as per the terms of lease agreements with landlords) recognized on straight line basis over the fixed, non-cancellable term of the agreement, as applicable
LTM
Last Twelve months
Market Capitalization
Number of issued and outstanding shares as at end of the period multiplied by closing market price (NSE) as at end of the period.
Mn Million
MSA
Master Service Agreement
Maintenance & General Corporate Capex
Represents the capital expenditure undertaken by the company for general maintenance, upkeep and replacement of equipments installed at the Towers which is undertaken on the end of their useful life as well as General Corporate related capital expenditure such as on office/ facilities and information technology.
Net Debt / (Net Cash)
It is not an IND AS measure and is defined as the sum of long-term borrowings, short-term borrowings minus cash and cash equivalents, current and non-current investments, and other bank balances at the end of the relevant period.
Net Debt / (Net Cash) to EBITDA (LTM)
It is computed by dividing net debt / (net cash) as at the end of the relevant period by EBITDA for preceding (last) 12 months from the end of the relevant period.
Net Debt / (Net Cash) to Funded Equity Ratio
It is computed by dividing net debt / (net cash) as at the end of the relevant period by Equity attributable to equity shareholders as at the end of the relevant period.
Operating Free Cash flow
It is not an IND AS measure and is defined as EBITDA adjusted for Capex and Non Cash IND AS measures, i.e., operating lease revenue/expense on security deposit received/paid
PE Ratio Price to Earnings ratio is calculated as closing market price (NSE) as at the end of relevant period, divided by diluted annual earnings per share. Annual Diluted Earnings per share is calculated by adding the preceding last four quarters diluted Earnings per share
ROC Registrar of Companies
Return On Capital Employed (ROCE) Pre Tax – (LTM)
For the full year computations, ROCE is computed by dividing the sum of EBIT for the period by average (of opening and closing) capital employed. For the quarterly computations, it is computed by dividing sum of EBIT for the preceding (last) 12 months from the end of the relevant period by average (of opening and closing) capital employed during the relevant periods.
Return On Equity (ROE) Pre Tax-(LTM)
For the full year computations, ROE (Pre Tax) is computed by dividing the sum of Profit before tax for the period by average (of opening and closing) equity shareholders funds. For the quarterly computations, it is computed by dividing sum of Profit before tax for the preceding (last) 12 months from the end of the relevant period by average (of opening and closing) equity shareholders funds during the relevant periods.
Return On Equity (ROE) Post Tax-(LTM)
For the full year computations, ROE (Post Tax) is computed by dividing the sum of Profit after tax for the period by average (of opening and closing) equity shareholders funds. For the quarterly computations, it is computed by dividing sum of Profit after tax for the preceding (last) 12 months from the end of the relevant period by average (of opening and closing) equity shareholders funds during the relevant periods.
Revenue per Employee per month
It is computed by dividing the Total Revenues (net of inter-segment eliminations) by the average number of on – roll employees in the business unit and number of months in the relevant period.
Revenue Equalization
It represents the effect of fixed escalations (as per the terms of service agreements with customers) recognized on straight line basis over the fixed, non-cancellable term of the agreement, as applicable.
SHA Shareholders Agreement Sharing Operator
A party granted access to a tower and who has installed active infrastructure at the tower
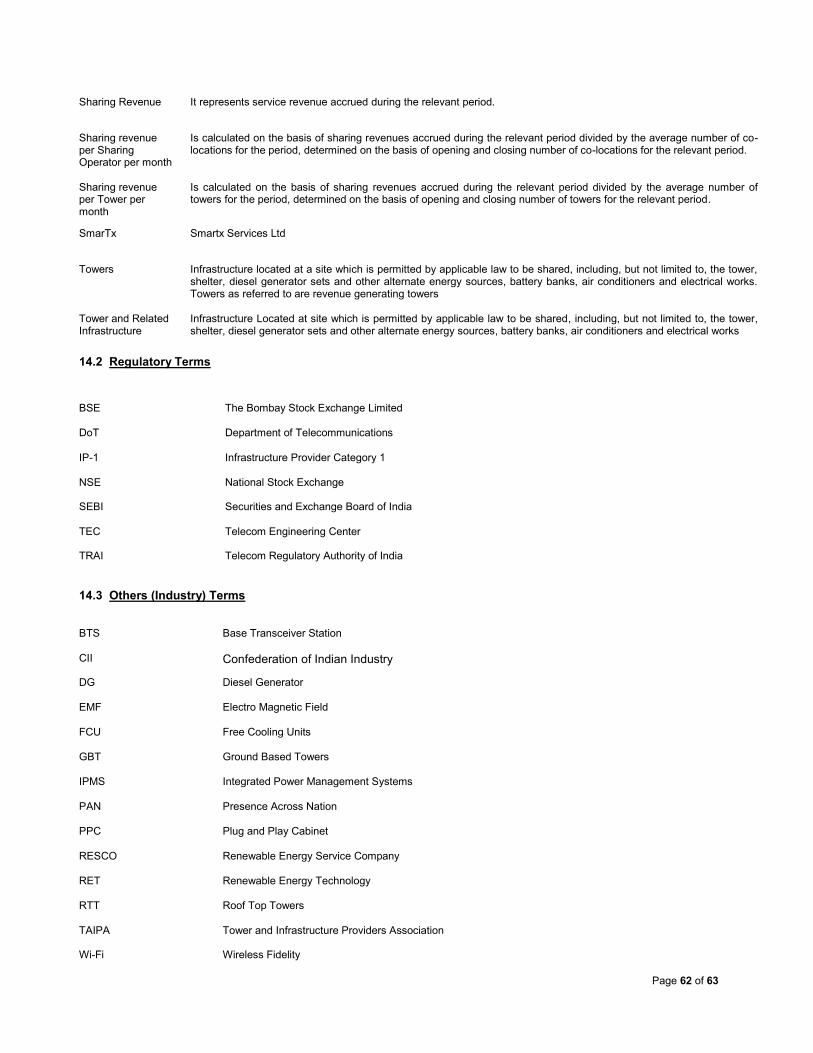
Page 62 of 63
Sharing Revenue
It represents service revenue accrued during the relevant period.
Sharing revenue per Sharing Operator per month
Is calculated on the basis of sharing revenues accrued during the relevant period divided by the average number of co-locations for the period, determined on the basis of opening and closing number of co-locations for the relevant period.
Sharing revenue per Tower per month
Is calculated on the basis of sharing revenues accrued during the relevant period divided by the average number of towers for the period, determined on the basis of opening and closing number of towers for the relevant period.
SmarTx Smartx Services Ltd
Towers Infrastructure located at a site which is permitted by applicable law to be shared, including, but not limited to, the tower, shelter, diesel generator sets and other alternate energy sources, battery banks, air conditioners and electrical works. Towers as referred to are revenue generating towers
Tower and Related Infrastructure
Infrastructure Located at site which is permitted by applicable law to be shared, including, but not limited to, the tower, shelter, diesel generator sets and other alternate energy sources, battery banks, air conditioners and electrical works
14.2 Regulatory Terms
BSE The Bombay Stock Exchange Limited
DoT Department of Telecommunications
IP-1 Infrastructure Provider Category 1
NSE National Stock Exchange
SEBI Securities and Exchange Board of India
TEC Telecom Engineering Center
TRAI Telecom Regulatory Authority of India
14.3 Others (Industry) Terms
BTS Base Transceiver Station
CII Confederation of Indian Industry
DG Diesel Generator
EMF Electro Magnetic Field
FCU Free Cooling Units
GBT Ground Based Towers
IPMS Integrated Power Management Systems
PAN
Presence Across Nation
PPC Plug and Play Cabinet
RESCO Renewable Energy Service Company
RET Renewable Energy Technology
RTT Roof Top Towers
TAIPA Tower and Infrastructure Providers Association
Wi-Fi Wireless Fidelity
