quarterly results q3 2014
TRANSCRIPT

QUARTERLY RESULTS Q1 2015 CEO Rolv Erik Ryssdal,
CFO Trond Berger
8 May 2015
Q1 2015 2
DISCLAIMER
This presentation (hereinafter referred to as the "presentation") has been prepared by Schibsted ASA ("Schibsted" or the "Company") exclusively for
information purposes, and does not constitute an offer to sell or the solicitation of an offer to buy any financial instruments.
Reasonable care has been taken to ensure that the information and facts stated herein are accurate and that the opinions contained herein are fair and
reasonable, however no representation or warranty, express or implied, is given by or on behalf of the Company, any of its directors, or any other person as to
the accuracy or completeness of the information or opinions contained in this document and no liability is accepted for any such information or opinions.
This presentation includes and is based on, among other things, forward-looking information and statements. Such forward-looking information and statements
are based on the current expectations, estimates and projections of the Company or assumptions based on information available to the Company. Such
forward-looking information and statements reflect current views with respect to future events and are subject to risks, uncertainties and assumptions. The
Company cannot give any assurance as to the correctness of such information and statements. Several factors could cause the actual results, performance or
achievements of the Company to be materially different from any future results, performance or achievements that may be expressed or implied by statements
and information in this presentation.
There may have been changes in matters which affect the Company subsequent to the date of this presentation. Neither the issue nor delivery of this
presentation shall under any circumstance create any implication that the information contained herein is correct as of any time subsequent to the date hereof
or that the affairs of the Company have not since changed.
The Company does not intend, and does not assume any obligation, to update or correct any information included in this presentation.

■ Offer to acquire Hemnet.se
■ Online Classifieds
■ Media Houses
■ Finance
■ Summary
AGENDA
3 Q1 2015

■ Clear market leader:
■ 2x the traffic of its closest competitor
■ 100% of listing objects
■ 51% unaided brand awareness*
■ 2014 revenues SEK 162 million, EBITDA SEK 34 million
■ Listing fees introduced 1 July 2013
■ Good growth rate and synergies with Blocket Bostad expected
4
HEMNET A PRIME ASSET IN SWEDEN
EXPANDING IN SWEDISH REAL ESTATE ONLINE CLASSIFIEDS
*) Source: KIA index, SCM Brand Tracker Q1 2015

Q1 2015 5
SWEDISH REAL ESTATE MARKET
LEADER IN A EUR 24 MILLION ONLINE MARKET WITH GROWTH POTENTIAL – 80-85% OF MARKETING SPEND STILL ON PRINT
■ Business model aligns interest
between realtors and Hemnet
■ Total real estate marketing spending
in Sweden is EUR 160 million.
Approx 15%-20% is online*
■ In connection with the acquisition,
the current owners will enter into a
cooperation regarding future use and
development of the site
*Source: Schibsted internal assessment

■ Schibsted has made a conditional
offer for 100 percent of Hemnet.se
■ Values Hemnet at SEK 1,500 million
(EV)
■ Offer conditional on Schibsted
acquiring all shares and approval by
the Swedish Competition Authority
6
EXPANDING IN SWEDISH REAL ESTATE
OFFER TO ACQUIRE MARKET LEADER HEMNET.SE
25% 34% 25% 16%
Ownership structure
Accepted bid
Q1 2015

■ Offer to acquire Hemnet.se
■ Online Classifieds
■ Media Houses
■ Finance
■ Summary
AGENDA
7 Q1 2015

ONLINE CLASSIFIEDS
8

9
A GLOBAL LEADER IN ONLINE MARKETPLACES…
■ 6,800 Employees
■ 15bn Revenue (NOK)
■ 26 Countries
■ #1 in General Classifieds in
24 markets
■ Reaching >200m people
worldwide
Q1 2015

■ Continued organic growth in key online classifieds markets
■ Solid development in France – tapping into the real estate market
■ Fast growing revenues and traffic in Italy
■ Strong development in Shpock – entering new markets
■ Bolt on acquisitions leverage existing traffic position and strengthens verticals
■ Offer to acquire Swedish real estate market leader Hemnet.se
■ Integration of Milanuncios in Spain well under way
■ Structural agreements strengthens market positions and boosts traffic
■ Successful merger with OLX in several emerging markets, including Brazil
10
VALUE CREATION THROUGH IN-MARKET FOCUS
Q1 2015

0
200,000,000
400,000,000
600,000,000
800,000,000
1,000,000,000
1,200,000,000
Jan
Ma
r
Ma
y
Jul
Sep
No
v
Jan
Ma
r
Ma
y
Jul
Sep
No
v
Jan
Ma
r
Ma
y
Jul
Sep
No
v
Jan
Ma
r
2012 2013 2014 2015
0
50,000,000
100,000,000
150,000,000
200,000,000
250,000,000
300,000,000
350,000,000
Jan
Ma
r
Ma
y
Jul
Sep
No
v
Jan
Ma
r
Ma
y
Jul
Sep
No
v
Jan
Ma
r
Ma
y
Jul
Sep
No
v
Jan
Ma
r
2012 2013 2014 2015
Q1 2015 11
STRONG TRAFFIC GROWTH BOTH IN EUROPE AND IN EMERGING MARKETS IN Q1 Traffic growth European portfolio* Traffic growth outside Europe**
Source: Internal figures/KeyWe/Google Analytics for Milanuncios
Month
ly v
isits
Month
ly v
isits
*) Finn, Blocket, BytBil, Coches.net, Donedeal IE, Fotocasa, Hasznaltauto, Infojobs Italy, Infojobs Spain, Jofogas,
Kapaza, Kufar, Leboncoin, Milanuncios, Motos.net, Segundamano, Subito, Tocmai, Tori, Willhaben
**) Avito, OLX Brazil, Chotot, Fincaraiz, Infojobs Brasil, Mudah, Segundamano MX, Tayara, Yapo.cl
Y/Y growth
89% in March
Y/Y growth
20% in March

70% 68% 71%
0%
20%
40%
60%
80%
100%
0
10
20
30
40
50
Q1 13 Q1 14 Q1 15
Revenues EBITDA margin
12
■ Steady growth with good contribution from
key revenue drivers:
■ Display advertising growth of 31%
(local+national) - market share of 1.5%
■ Continued growth for premium features and
professional listing fees - real estate and cars
■ Continued traffic growth; 12% Y/Y (visits per
day*)
STEADY, HIGH GROWTH RATE – SOLID MARGINS IN FRANCE
+20%
France
Q1 2015
Mill
ion
EU
R
*) Source: Leboncoin internal data

■ Gradual ramp up of new revenues, starting
in Q1 2015 with an uplift of high ARPU
automatic upload link customers
■ Strong growth in direct customers
■ 25,000 real estate agents in a fragmented
market. Leboncoin has a strong position
outside Paris
■ Around 1/3 of the market is C2C
■ Main revenue uplift expected in 2016, as
main sales season is in the autumn
13
■ The French real estate market
■ 668,000 objects sold in 2013*, of which
70% through agents and 30% C2C
■ Market size around EUR 400 million, of
which around EUR 250 million online**
■ Consumer to consumer 30% of the
total number of transactions
REAL ESTATE STAND-ALONE PRODUCT WELL RECEIVED IN THE MARKET
*) Source: FNAIM **) Source: Xerfi precepta/Leboncoin
Q1 2015
Real estate
customers
control their
own
inventory on
the site –
including
statistics
Total real estate market value ~EUR 300 million online, ~EUR 500 million including print*
*Source: Schibsted
internal assessment

■ Revenue growth driven by macro and internal improvement
■ Jobs important growth driver
■ Improved efficiency in the sales teams and lower churn
■ Product development and integration of Milanuncios lay the foundation for increased monetization in the coming quarters
Q1 2015 14
SPAIN BACK TO REVENUE GROWTH OF 10%*
*Underlying growth

Q1 2015 15
CONTINUED IMPROVEMENTS IN EMPLOYMENT
DRIVE VOLUME AND REVENUE GROWTH
Traffic development (million visits) Registered unemployment New job posts per week in InfoJobs
0
5
10
15
20
25
30
35
40
May
-20
13
Jul-
20
13
Sep
-20
13
No
v-2
01
3
Jan
-20
14
Mar
-20
14
May
-20
14
Jul-
20
14
Sep
-20
14
No
v-2
01
4
Jan
-20
15
Mar
-20
15 0
500
1,000
1,500
2,000
2,500
1-2
01
3
9-2
01
3
17
-20
13
25
-20
13
33
-20
13
41
-20
13
49
-20
13
5-2
01
4
13
-20
14
21
-20
14
29
-20
14
37
-20
14
45
-20
14
1-2
01
5
9-2
01
5
0.000
1,000.000
2,000.000
3,000.000
4,000.000
5,000.000
6,000.000
7,000.000
2005T
1
2005T
4
2006T
3
2007T
2
2008T
1
2008T
4
2009T
3
2010T
2
2011T
1
2011T
4
2012T
3
2013T
2
2014T
1
2014T
4
Sale of new contracts +33% Y/Y in Q1 for InfoJobs – deferred revenue model

Q1 2015 16
SOLID TRAFFIC GROWTH FOR ALL SITES
SCM Spain Rolling 12 months
Mill
ion
EU
R
Total Monthly Visits indexed (May 2013 – Mar 2015)
Source traffic data: SCM internal figures 16
0
20
40
60
80
100
120
140
160
180
May
-20
13
Jul-
20
13
Sep
-20
13
No
v-2
013
Jan
-20
14
Mar
-20
14
May
-20
14
Jul-
20
14
Sep
-20
14
No
v-2
014
Jan
-20
15
Mar
-20
15
Web m. site Apps
0
20
40
60
80
100
120
140
160
180
May
-20
13
Jul-
20
13
Sep
-20
13
No
v-2
013
Jan
-20
14
Mar
-20
14
May
-20
14
Jul-
20
14
Sep
-20
14
No
v-2
014
Jan
-20
15
Mar
-20
15
Web m. site Apps
0
20
40
60
80
100
120
140
160
180
May
-20
13
Jul-
20
13
Sep
-20
13
No
v-2
013
Jan
-20
14
Mar
-20
14
May
-20
14
Jul-
20
14
Sep
-20
14
No
v-2
014
Jan
-20
15
Mar
-20
15
Web m. site Apps
0
20
40
60
80
100
120
140
160
180
mai
.13
jul.1
3
sep
.13
no
v.1
3
jan
.14
mar
.14
mai
.14
jul.1
4
sep
.14
no
v.1
4
jan
.15
mar
.15
Web m. site App

Q1 2015 17
STRONG TRAFFIC AND REVENUE GROWTH FOR ITALIAN MARKET LEADER SUBITO.IT
Total Monthly Visits indexed
(Jan 2010 – Mar 2015)
Total Monthly Revenues indexed
(Jan 2010 – Mar 2015)
Heavy marketing investments in Q1 15, to be maintained throughout the year.
0
100
200
300
400
500
600
Dec-1
4
Jun-1
4
Dec-1
3
Jun-1
3
Dec-1
2
Jun-1
2
Dec-1
1
Jun-1
1
Dec-1
0
Jun-1
0
Jan-1
0
jul-12
jul-11
200
jan-1
1
jul-14
jan-1
0
jan-1
5
1.000
0
400
jul-10
jan-1
4
jan-1
2
jul-13
jan-1
3
600
800
jul-15
m.site Apps Web 46% YoY revenue
growth in Q1 2015 3.6x Kijiji.it desktop traffic
3.5x Kijiji.it app downloads
Source: SCM Internal figures, Comscore, AppAnnie

Q1 2015 18
BUILDING POSITION IN CARS AND REAL ESTATE VERTICALS IN ITALY
250
270
290
310
330
350
370
390
410
430
450
Sep13
Oct13
Nov13
Dec13
Jan14
Feb14
Mar14
Apr14
May14
Jun14
Jul14
Aug14
Sep14
Oct14
Nov14
Dec14
Jan15
Feb15
Mar15
Number of car ads (Sep‘13-Mar‘15, thousands)
Volume and traffic leadership in cars
Autoscout24.it
206
105
200
243 Autoscout
Subito.it
Distribution of Ads (Mar ‘15, thousands)
Dealers
Private 137
64
40
335
692
534 Casa.it
Immobiliare.it
Subito.it
Distribution of Ads (Mar ‘15)
Agents
Private
Source: Audiweb - desktop (for Subito, only traffic from the vehicles section), Autobiz

Q1 2015 19
■ Revenue growth in real estate +18%
■ Strong traffic growth for Torget – Number of private ads increased 2.7x Y/Y
■ Revenue growth ex Torget freemium effect +5%
■ Soft development in display – new products in pipeline
■ New targeted products under development in real estate and jobs
MIXED DEVELOPMENT IN FINN.NO
45% 42% 40%
0%
20%
40%
60%
80%
0
100
200
300
400
Q1 13 Q1 14 Q1 15
Revenues EBITDA margin
Norway
Mill
ion
NO
K
+1%

51% 59%
52%
0%
20%
40%
60%
80%
100%
0
50
100
150
200
250
Q1 13 Q1 14 Q1 15
Revenues EBITDA margin
20
■ 5 percent revenue growth supported by
growth in new verticals
■ Strong inflow of job ads. Clearly market
leading in traffic terms (Blocket
Jobb+StepStone)
■ Movement from private cars to dealer cars,
market share unchanged
■ Continued investments in real estate and jobs
verticals
GOOD GROWTH IN NEW VERTICALS
+10%*
Sweden (Blocket/Bytbil)
Q1 2015
Mill
ion
SE
K
*) Growth adjusted for inclusion of Servicefinder +5%
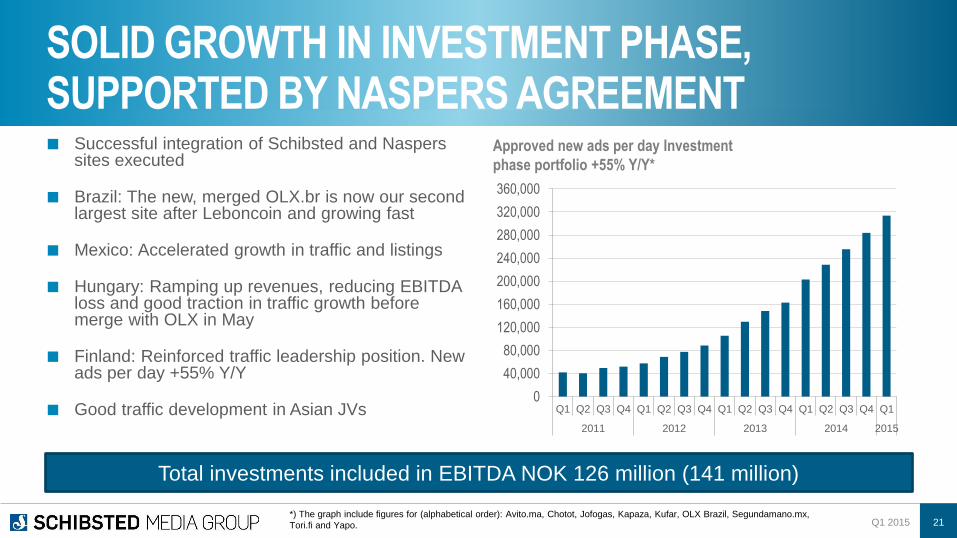
■ Successful integration of Schibsted and Naspers sites executed
■ Brazil: The new, merged OLX.br is now our second largest site after Leboncoin and growing fast
■ Mexico: Accelerated growth in traffic and listings
■ Hungary: Ramping up revenues, reducing EBITDA loss and good traction in traffic growth before merge with OLX in May
■ Finland: Reinforced traffic leadership position. New ads per day +55% Y/Y
■ Good traffic development in Asian JVs
Q1 2015 21
SOLID GROWTH IN INVESTMENT PHASE, SUPPORTED BY NASPERS AGREEMENT
Total investments included in EBITDA NOK 126 million (141 million)
0
40,000
80,000
120,000
160,000
200,000
240,000
280,000
320,000
360,000
Q1 Q2 Q3 Q4 Q1 Q2 Q3 Q4 Q1 Q2 Q3 Q4 Q1 Q2 Q3 Q4 Q1
2011 2012 2013 2014 2015
Approved new ads per day Investment
phase portfolio +55% Y/Y*
*) The graph include figures for (alphabetical order): Avito.ma, Chotot, Jofogas, Kapaza, Kufar, OLX Brazil, Segundamano.mx,
Tori.fi and Yapo.

Q1 2015 22
GOOD DEVELOPMENT FOR OLX IN BRAZIL AFTER MERGER
0.0
0.5
1.0
1.5
2.0
2.5
3.0
3.5
4.0
1 2 3 4 5 6 7 8 9 10 11 12 13 14 15 16 17 18
OLX(new)BN (old)
OLX(old)
Strong ad insertion growth
New Postings (indexed, 1/1/2015 = 1)
2015 Week number Source: Internal DW, AT Internet

■ Rapid growth in downloads and new listings in Germany and Austria
■ Top rankings in app stores
■ Most downloaded next-gen marketplace app in Europe
■ 4.6 million monthly active users
■ Preparing to launch in additional markets
Q1 2015 23
NATIVE APP SHPOCK WITH CONTINOUS STRONG TRACTION - TO BE ROLLED OUT IN NEW MARKETS
Mobile-only marketplaces expand our markets through new audiences and new volume

■ Mobile dominate product development pipeline
■ Next gen app (iOS and Android) with social features launched in 6 countries
■ Central mobile development team to pilot new functionality in Spain before global roll out
■ Easy ad insertion, proximity search, messaging, user profiles
Q1 2015 24
MOBILE INNOVATION TOP PRIORITY
CLOSE TO 50% OF TRAFFIC TO APPS OR MOBILE OPTIMIZED SITES

MEDIA HOUSES
25

■ Newspaper of the Year
VG
■ Newspaper Magazine of the Year
VG – VGHelg
■ Magazine Cover of the Year
VG Helg – Saturday 30 August 2014
■ Sports Page of the Year
VG – "Best games never“
■ News Page of the Year
- Bergens Tidende – "Politimann slo
alarm etter Monikas død"
- Stavanger Aftenblad – "Gjeldsslaver
resten av livet" (excellence)
■ Feature Page of the Year
VG Helg – "Historien om Odin“
■ MBL’s Young Award
Fædrelandsvennen – KRSby
Q1 2015 26
■ Website of the Year
VG.no
■ News Website of the Year
BT.no
■ Innovation of the Year
- VG – VGdirekte
- BT- kommunebyggeren (excellence)
■ Digital Story of the Year
VG - Odins-historie
■ Feature Series of the Year
Aftenposten – Fra Ungdommen
■ Magazine of the Year
Aftenposten K
■ Innovation of the Year
Aftenposten Historie
SCHIBSTED COLLECTING A BROAD RANGE OF AWARDS FOR INNOVATION AND JOURNALISM
FOCUS ON HIGH QUALITY EDITORIAL PRODUCTS
16 out of 21 awards at “Media Awards
of the Year” to Schibsted media

15% 15% 12%
0%
10%
20%
30%
40%
50%
60%
0
100
200
300
400
500
600
Q1 13 Q1 14 Q1 15
Mill
ion
NO
K
Online revenues Offline revenues
EBITDA margin
12% 9% 7%
0%
10%
20%
30%
40%
50%
60%
0
100
200
300
400
500
600
Q1 13 Q1 14 Q1 15
Mill
ion
NO
K
Online revenues Offline revenues
EBITDA margin
27
MARKET SLOW-DOWN IN DIGITAL ADVERTISING HAMPERS MARGIN DEVELOPMENT Digital newspapers with clearly leading positions in Norway and Sweden
Q1 2015
VG AND AFTONBLADET
28
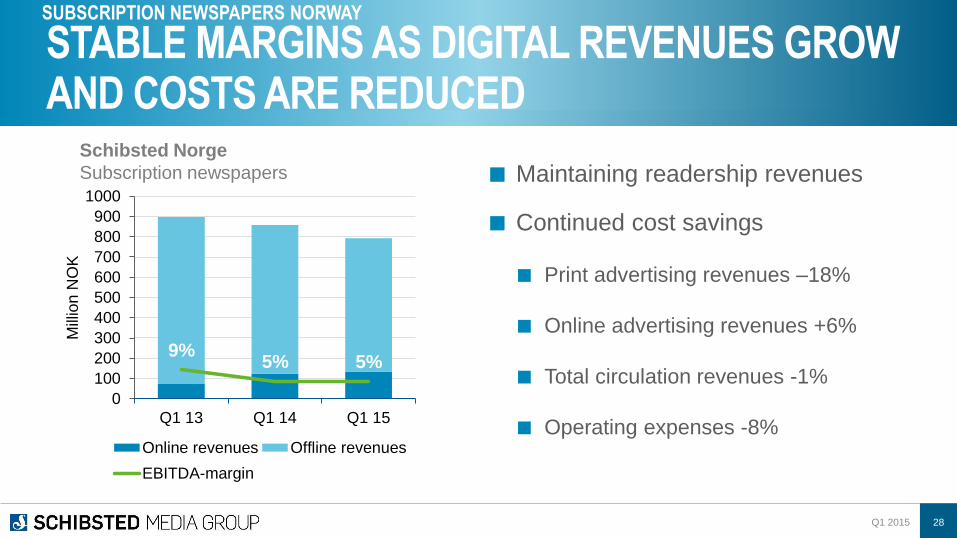
■ Maintaining readership revenues
■ Continued cost savings
■ Print advertising revenues –18%
■ Online advertising revenues +6%
■ Total circulation revenues -1%
■ Operating expenses -8%
STABLE MARGINS AS DIGITAL REVENUES GROW AND COSTS ARE REDUCED
Schibsted Norge
Subscription newspapers
Q1 2015
9% 5% 5%
0%
10%
20%
30%
40%
50%
60%
0
100
200
300
400
500
600
700
800
900
1000
Q1 13 Q1 14 Q1 15
Mill
ion
NO
K
Online revenues Offline revenues
EBITDA-margin
SUBSCRIPTION NEWSPAPERS NORWAY

■ Centralized data driven products in Norway and Sweden
■ All Schibsted’s national sites in one product
■ Advertiser can buy audience segments based on Schibsted’s user data, also programmatically
■ Centralized sales teams across Media Houses and Online Classifieds
Q1 2015 29
DATA DRIVEN PRODUCTS KEY TO SECURE GROWTH IN DIGITAL ADVERTISING
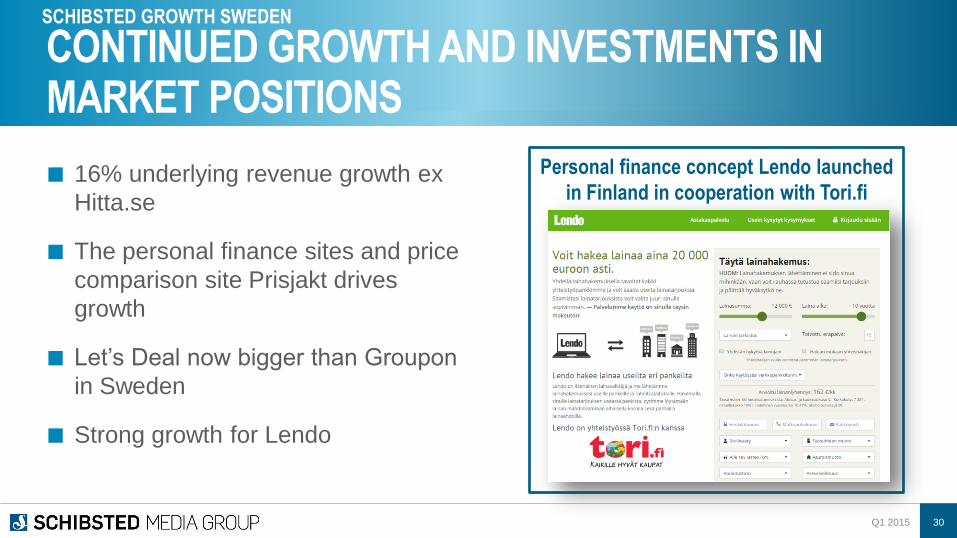
Personal finance concept Lendo launched
in Finland in cooperation with Tori.fi ■ 16% underlying revenue growth ex
Hitta.se
■ The personal finance sites and price
comparison site Prisjakt drives
growth
■ Let’s Deal now bigger than Groupon
in Sweden
■ Strong growth for Lendo
30
CONTINUED GROWTH AND INVESTMENTS IN MARKET POSITIONS
Q1 2015
SCHIBSTED GROWTH SWEDEN
10%
24%
17%
0%
5%
10%
15%
20%
25%
30%
0
50
100
150
200
250
Q1 13 Q1 14 Q1 15
Mill
ion
SE
K
Hitta.se
Schibsted Growth Other
EBITDA margin

■ Strong revenue growth in
price comparison site Prisjakt
■ Rolled out in several
additional markets – Norway,
UK, New Zealand, Ireland
■ Unique database
■ Revenue growth 48% in Q1
■ Click growth rate 38% in Q1
Q1 2015 31
PRISJAKT – STRONG GROWTH IN PRICE COMPARISON
SCHIBSTED GROWTH SWEDEN

FINANCE
Q1 2015 32

EBITDA DEVELOPMENT IN Q1
3761557410
Schibsted
Sverige
(34) (11)
OLC France Online
classifieds
Investment
phase
Other (HQ,
20 Minutos
Aspiro and
Møteplassen)
(10)
EBITDA
Q1 2015
OLC Other
(38) (13)
Schibsted
Norge
OLC Norway
and Sweden
EBITDA
Q1 2014
Q1 2015 33
Spain -5
Italy -25
Million NOK
Aspiro divested
as of 1 March
2015

INCOME STATEMENT SCHIBSTED GROUP
Q1 2015 34
Positively affected by gain in
connection with establishment of
Naspers JVs. Negative EBITDA effect
of organic investments NOK 81 million.
Gain on sale of Aspiro and online
classifieds operations in Romania of
NOK 287 million
(NOK million) Q1 2015 Q1 2014
Operating revenues 3,694 3,710
Operating expenses (3,318) (3,300)
Gross operating profit (EBITDA) 376 410
Depreciation and amortization (118) (114)
Share of profit (loss) of JVs and associates 354 (202)
Impairment loss (6) (9)
Other income and expenses 267 45
Operating profit (loss) 873 130
Net financial items (27) (29)
Profit (loss) before taxes 846 101
Taxes (112) (125)
Profit (loss) 734 (24)
EPS (NOK) 6.17 -0.32
EPS - adjusted (NOK) 4.20 -0.69

Q1 2015 35
• Estimated spending to be closer to EUR 100 million in 2015
Online classifieds Investment phase
• Investments expensed and affecting EBITDA negatively with around NOK 100 million – mainly VG and Aftonbladet
Web TV
• Increased investments of NOK 100-200 million in 2015
• 60% – 70% expected to be capitalized
New online technology and
online development
DIGITAL INVESTMENTS CONTINUE IN 2015
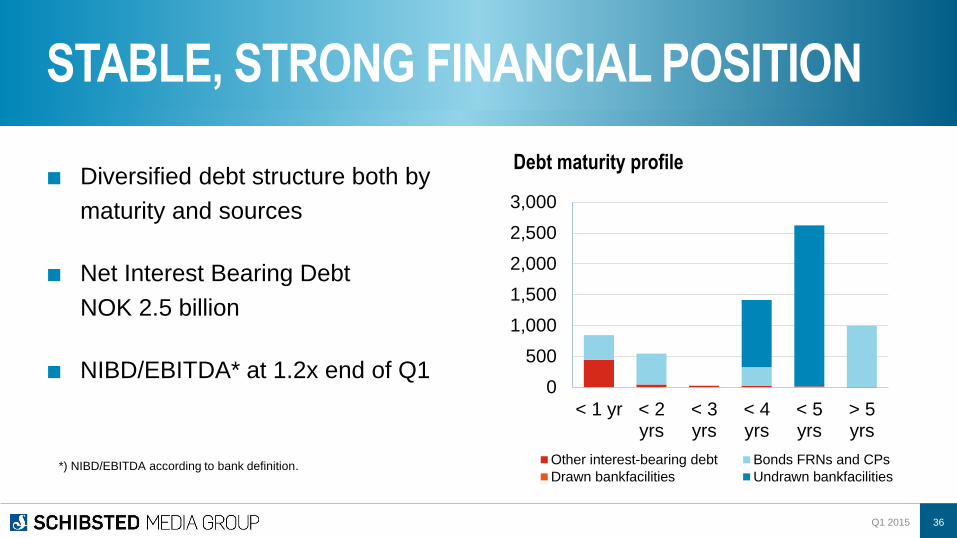
■ Diversified debt structure both by
maturity and sources
■ Net Interest Bearing Debt
NOK 2.5 billion
■ NIBD/EBITDA* at 1.2x end of Q1
Q1 2015 36
STABLE, STRONG FINANCIAL POSITION
Debt maturity profile
*) NIBD/EBITDA according to bank definition.
0
500
1,000
1,500
2,000
2,500
3,000
< 1 yr < 2yrs
< 3yrs
< 4yrs
< 5yrs
> 5yrs
Other interest-bearing debt Bonds FRNs and CPs
Drawn bankfacilities Undrawn bankfacilities

■ High dividend compared to the target
range
■ A balanced dividend level in a period
of digital investment
■ Equals NOK 376 million based on
total number of shares outstanding
Q1 2015 37
DIVIDEND OF NOK 3.50 PROPOSED
3.50
0.00
0.50
1.00
1.50
2.00
2.50
3.00
3.50
4.00
4.50
5.00
19
99
20
00
20
01
20
02
20
03
20
04
20
05
20
06
20
07
20
08
20
09
20
10
20
11
20
12
20
13
20
14*
NOK per share Dividend policy (summary)
Schibsted targets a pay-out ratio over time
in the range of 25% to 40% of cash flow
*) The Board’s proposal

Q1 2015 38
UNDERLYING TAX RATE OF AROUND 29%
Q1 2015
Reported profit (loss) before taxes 846
Share of profit (loss) of joint ventures and associated companies (354)
Other losses for which no deferred tax benefit is recognized* 178
Gain on remeasurement in business combinations achieved in stages and other non-
taxable gains -287
"Adjusted" tax base 383
Taxes 112
Adjusted effective tax rate (112/383) 29%
*) Mainly online classifieds New ventures that are not in JVs.
■ Reported tax rate that may deviate significantly from the nominal tax rates in our markets.
The main reasons are:
■ Share of profit (loss) of joint ventures and associated companies being reported net of tax
■ Unrecognised tax benefits from tax losses in Online classifieds Investment phase operations, and
■ Non-deductible expenses or non-taxable gains

0.50 1.72
-0.73
7.94
-0.32
0.06 0.43
-1.84
6.17
-4.00
-2.00
0.00
2.00
4.00
6.00
8.00
10.00
Q113 Q213 Q313 Q413 Q114 Q214 Q314 Q414 Q115
Q1 2015 39
KEY FINANCIAL FIGURES Earnings per share Cash flow from operating activities/share
NOK NOK
CAPEX Net interest bearing debt CAPEX (NOK million) and CAPEX/Sales (%) Net interest bearing debt (NOK) and
Ratio of Net interest bearing debt/LTM EBITDA
Note:
NIBD/EBITDA
according to
bank definition.
92 94
131
203
171 150 154 155
129
2.6 2.4 3.7
5.3 4.6 3.9 4.3 4.0 3.5
0255075
100125150175200225
Q113 Q213 Q313 Q413 Q114 Q214 Q314 Q414 Q115
1913 2185
2660
1115
1771
2183
1677
2083
2467
1.0 1.1 1.5 0.6 0.8 1.1 0.8 1.1 1.2
0
1000
2000
3000
Q113 Q213 Q313 Q413 Q114 Q214 Q314 Q414 Q115
-3.54
2.18 3.05
4.98
-0.57
3.81 3.88 4.33
-0.17
-6.00
-4.00
-2.00
0.00
2.00
4.00
6.00
8.00
Q113 Q213 Q313 Q413 Q114 Q214 Q314 Q414 Q115

SUMMARY

■ Growth and value creation in Online classifieds
■ Continued organic growth – Southern Europe, large untapped potential
■ Structural agreements – successful integration with OLX in emerging markets
■ Bolt-on acquisitions – Hemnet acquisition to broaden revenue base in Sweden
■ Continued margin contraction in media houses during the print-to-digital transition period going forward; volatile development in Scandinavian ad markets
■ Step up in efforts in technology and online product development to create new revenue opportunities
KEY TAKEAWAYS
Q1 2015 41

APPENDICES
Q1 2015 42
Spreadsheet containing detailed Q1 2015 and Historical and analytical
Information can be downloaded from www.schibsted.com/ir

BASIC INFORMATION Ticker Oslo Stock Exchange: SCH
Reuters: SBST.OL
Bloomberg: SCH NO
Number of shares (5 May 2015) 108,003,615
Treasury shares (5 May 2015) 571,316
Number of shares outstanding 107,421,397
Free float* 73%
Share price (5 May 2015) NOK 461.10
Market cap (5 May 2015) NOK 49.5 bn., EUR 5.9 bn.,
USD 6.7 bn., GBP 4.4 bn.
Average daily trading volume LTM 255,000 shares
*) Total number of shares
excluding treasury shares and
shares owned by
Blommenholm Industrier AS.
Q1 2015 43

Q1 2015 44
KEY FINANCIAL FIGURES
Full year
Schibsted Media Group 2015 2014 2014
Gross operating profit (EBITDA) (NOK million) 376 410 1,941
Gross operating profit (EBITDA) ex new ventures (NOK million) 502 551 2,444
Operating margins (%):
Operating margin (EBITDA) 10 11 13
Operating margin (EBITDA) ex new ventures 14 15 16
EPS (NOK) 6.17 (0.32) (1.67)
Net cash flow from operating activities (NOK million) (18) (61) 1,230
Cash flow from operating activities per share (NOK) (0.17) (0.57) 11.46
Profit attributable to owners of the parent 663 (35) (180)
Average number of shares (1 000) 107.425 107.349 107.389
Per Q1

Q1 2015 45
CAPITAL STRUCTURE
1) Treasury shares are offset against equity
Full year
Schibsted Media Group 2015 2014 2014
Investments (NOK million):
Operational investments (capex) 129 171 630
Shares and other holdings 568 475 1 572
Interest bearing borrowings (NOK million) 2 752 2 078 2 828
Net interest bearing debt (NOK million) 2 467 1 771 2 083
Interest bearing debt ratio (%) 16 13 16
Equity ratio(%) 1)
41 48 38
Per Q1
Q1 2015 46
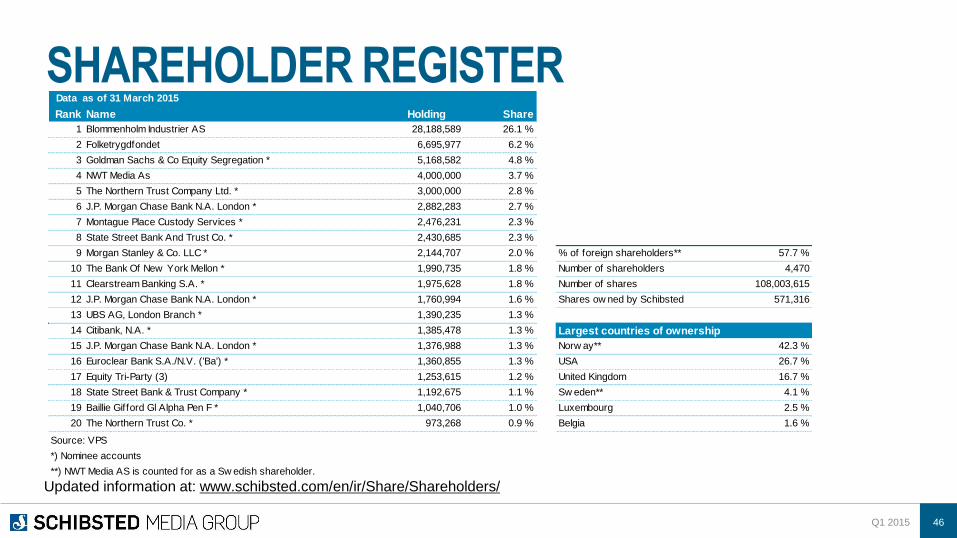
SHAREHOLDER REGISTER
Updated information at: www.schibsted.com/en/ir/Share/Shareholders/
Data as of 31 March 2015
Rank Name Holding Share
1 Blommenholm Industrier AS 28,188,589 26.1 %
2 Folketrygdfondet 6,695,977 6.2 %
3 Goldman Sachs & Co Equity Segregation * 5,168,582 4.8 %
4 NWT Media As 4,000,000 3.7 %
5 The Northern Trust Company Ltd. * 3,000,000 2.8 %
6 J.P. Morgan Chase Bank N.A. London * 2,882,283 2.7 %
7 Montague Place Custody Services * 2,476,231 2.3 %
8 State Street Bank And Trust Co. * 2,430,685 2.3 %
9 Morgan Stanley & Co. LLC * 2,144,707 2.0 % % of foreign shareholders** 57.7 %
10 The Bank Of New York Mellon * 1,990,735 1.8 % Number of shareholders 4,470
11 Clearstream Banking S.A. * 1,975,628 1.8 % Number of shares 108,003,615
12 J.P. Morgan Chase Bank N.A. London * 1,760,994 1.6 % Shares ow ned by Schibsted 571,316
13 UBS AG, London Branch * 1,390,235 1.3 %
14 Citibank, N.A. * 1,385,478 1.3 % Largest countries of ownership
15 J.P. Morgan Chase Bank N.A. London * 1,376,988 1.3 % Norw ay** 42.3 %
16 Euroclear Bank S.A./N.V. ('Ba') * 1,360,855 1.3 % USA 26.7 %
17 Equity Tri-Party (3) 1,253,615 1.2 % United Kingdom 16.7 %
18 State Street Bank & Trust Company * 1,192,675 1.1 % Sw eden** 4.1 %
19 Baillie Gifford Gl Alpha Pen F * 1,040,706 1.0 % Luxembourg 2.5 %
20 The Northern Trust Co. * 973,268 0.9 % Belgia 1.6 %
Source: VPS
*) Nominee accounts
**) NWT Media AS is counted for as a Sw edish shareholder.

Q1 2015 47
SHAREHOLDER ANALYSIS
The shareholder ID data are provided by Nasdaq OMX. The data are
obtained through the analysis of beneficial ownership and fund
manager information provided in replies to disclosure of ownership
notices issued to all custodians on the Schibsted share register.
Whilst every reasonable effort is made to verify all data, neither
Nasdaq OMX or Schibsted can guarantee the accuracy of the
analysis.
Source: Nasdaq OMX.
Data as of 23 April 2015.
Updated information at:
www.schibsted.com/en/ir/Share/Shareholders/
Rank Fund manager % Shares
1 Blommenholm Industrier AS 26.10 28,188,589
2 Baillie Gifford & Co. 8.77 9,472,664
3 Luxor Capital Group, L.P. 6.82 7,360,662
4 Folketrygdfondet 6.34 6,845,977
5 NWT Media As 3.70 4,000,000
6 Adelphi Capital LLP 2.85 3,081,946
7 Capital Research Global Investors 2.67 2,882,283
8 Alecta pensionsförsäkring, ömsesidigt 2.55 2,750,000
9 Caledonia (Private) Investments Pty Limited 2.08 2,246,710
10 Scopia Capital Management LP 2.03 2,196,154
11 Tybourne Capital Management (HK) Limited 1.88 2,028,382
12 SAFE Investment Company Limited 1.80 1,949,364
13 Marathon Asset Management LLP 1.74 1,877,220
14 Falcon Edge Capital, LP 1.55 1,673,160
15 Sw edbank Robur AB 1.27 1,376,988
16 Platinum Investment Management Ltd. 1.22 1,315,763
17 Nordea Funds Oy 1.14 1,235,953
18 The Vanguard Group, Inc. 1.13 1,219,393
19 Danske Capital (Norw ay) 1.02 1,100,926
20 KLP Forsikring 1.02 1,096,506
21 SCGE Management, L.P. 0.86 925,000
22 Tw eedy, Brow ne Company LLC 0.84 902,602
23 Storebrand Kapitalforvaltning AS 0.82 888,269
24 Taube, Hodson, Stonex Partners, LLP 0.78 846,656
25 Ruane, Cunniff & Goldfarb, Inc. 0.74 800,000

Q1 2015 48
KEY OPERATIONS – ONLINE CLASSIFIEDS Q1 Q1 FY
Finn.no (MNOK) 2015 2014 2014
Operating revenues 373 371 1,421
EBITDA 150 155 637
EBITDA margin 40 % 42 % 45 %
Q1 Q1 FY
Blocket.se/Bytbil.se (MSEK) 2015 2014 2014
Operating revenues 221 201 857
EBITDA 115 118 508
EBITDA margin 52 % 59 % 59 %
Q1 Q1 FY
Leboncoin.fr (MEUR) 2015 2014 2014
Operating revenues 42.9 35.8 150.7
EBITDA 30.3 24.5 101.5
EBITDA margin 71 % 68 % 67 %
Q1 Q1 FY
SCM Spain (MEUR) 2015 2014 2014
Operating revenues 22.8 20.9 84.7
EBITDA 2.7 3.4 14.0
EBITDA margin 12 % 16 % 17 %

Q1 2015 49
KEY OPERATIONS – MEDIA HOUSES Norway Sweden
Q1 Q1 FY
Verdens Gang (MNOK) 2015 2014 2014
Operating revenues 458 492 2,009
of which offline 296 320 1,292
of which online 162 172 717
EBITDA 53 72 328
EBITDA margin 12 % 15 % 16 %
Schibsted Norge subscription Q1 Q1 FY
newspapers (MNOK) 2015 2014 2014
Operating revenues 792 858 3,381
of which offline 659 734 2,841
of which online 133 124 540
EBITDA 41 45 253
EBITDA margin 5 % 5 % 7 %
Q1 Q1 FY
Aftonbladet (MSEK) 2015 2014 2014
Operating revenues 455 486 2 019
of which offline 277 315 1 320
of which online 178 171 699
EBITDA 34 45 237
EBITDA margin 7 % 9 % 12 %
Q1 Q1 FY
SvD (MSEK) 2015 2014 2014
Operating revenues 228 242 960
EBITDA 12 2 35
EBITDA margin 5 % 1 % 4 %
Schibsted Growth Q1 Q1 FY
(MSEK) 2015 2014 2014
Operating revenues 241 240 953
EBITDA 41 58 207
EBITDA margin 17 % 24 % 22 %

Visit Schibsted’s web site
www.schibsted.com
IR contacts:
Jo Christian Steigedal
VP, Head of IR
+47 415 08 733
Anders Christian Rønning
IRO
+47 916 05 660
INVESTOR INFORMATION
Q1 2015 50
Schibsted ASA
Apotekergaten 10, P.O. Box 490
Sentrum, NO-0105 Oslo
Tel: +47 23 10 66 00.
E-mail: [email protected]