quarterly station evaluations -...
TRANSCRIPT

Quarterly Station EvaluationsFY19 Q3 (January –March 2019)
Carlos Rico, Transportation AssociateRegional Service Councils

Evaluation Criteria
36 stations were evaluated using 32 measures of performance.
The measures of performance include inspecting: Map cases,Park & Ride lots, stairs, handrails, flooring, walls, bike lockers,escalators, elevators, graffiti, etc.).
2

Performance Ratings
Performance ratings are based on a scale from 0 to 10. Good to Very Good (8-10) –Little or no damage, trash, graffiti, etc. Marginal (4-7.9) –Some damage, trash, graffiti, etc. Unsatisfactory (0-3.99) –Heavy damage, trash, graffiti, etc.
3
Good toVery Good
Marginal
Unsatisfactory

Who evaluates the stations?
36 stations/transit centers are inspected by a small group ofMetro staff to maintain consistency.
4

36 of 36 stations rated “Good to Very Good”
20 of 36 stations evaluated scores showed “No Change”
3 Stations were not inspected due to New Blue project.
7 out of 36 stations evaluated scores showed “Decreased” Despite decrease, all stations remained in “Good to Very Good”
category. Decrease in score can be affected by several factors such as day and
time the station was evaluated and changes in consistency based onevaluations being completed by RSC staff or Rail Fleet QA.
Station Summary for FY19 Q3
5

The stations that experienced a decrease were: Blue Line: Compton Expo Line: Culver City, Downtown Santa Monica Gold Line: Lake Av. Green Line: Long Beach Bl. Silver Line: Carson St. Transit Centers: LAC+USC Medical Center, Pico-Rimpau
Minor score decrease due to issues concerning signage, lightto heavy etching in elevators, graffiti, trash, dirty floors,and/or homelessness issues.
Station Summary for FY19 Q3, continued…
6
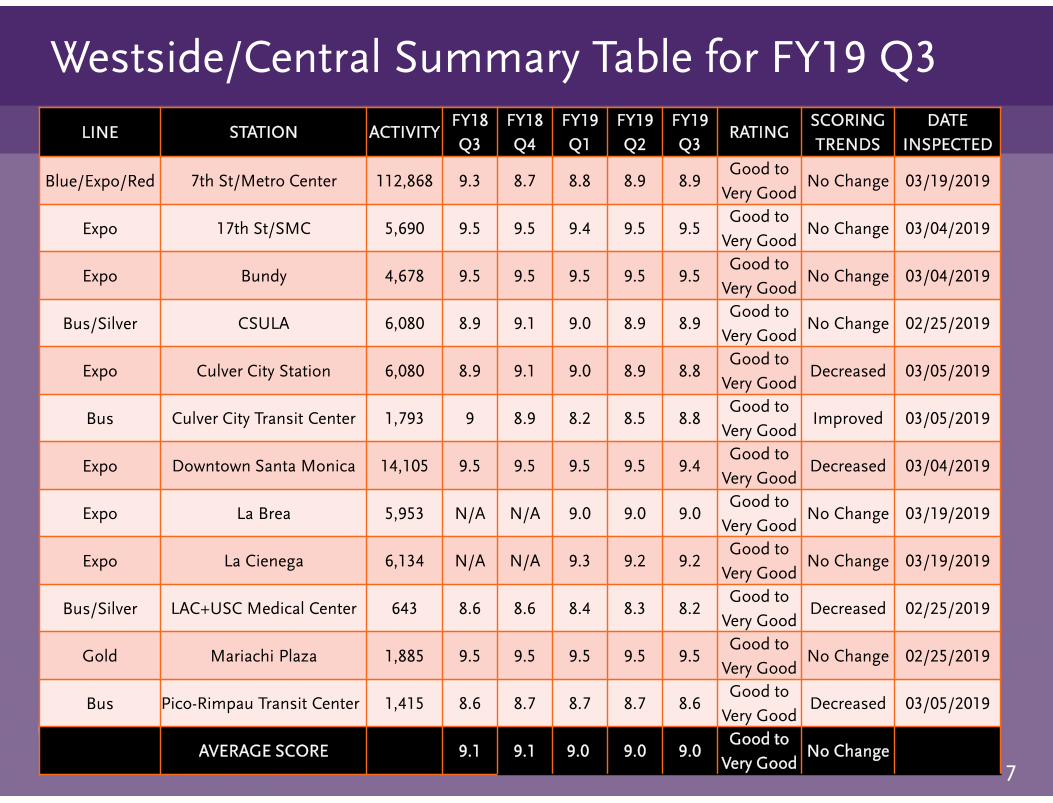
Westside/Central Summary Table for FY19 Q3
7
LINE STATION ACTIVITYFY18
Q3
FY18
Q4
FY19
Q1
FY19
Q2
FY19
Q3RATING
SCORING
TRENDS
DATE
INSPECTED
Blue/Expo/Red 7th St/Metro Center 112,868 9.3 8.7 8.8 8.9 8.9Good to
Very GoodNo Change 03/19/2019
Expo 17th St/SMC 5,690 9.5 9.5 9.4 9.5 9.5Good to
Very GoodNo Change 03/04/2019
Expo Bundy 4,678 9.5 9.5 9.5 9.5 9.5Good to
Very GoodNo Change 03/04/2019
Bus/Silver CSULA 6,080 8.9 9.1 9.0 8.9 8.9Good to
Very GoodNo Change 02/25/2019
Expo Culver City Station 6,080 8.9 9.1 9.0 8.9 8.8Good to
Very GoodDecreased 03/05/2019
Bus Culver City Transit Center 1,793 9 8.9 8.2 8.5 8.8Good to
Very GoodImproved 03/05/2019
Expo Downtown Santa Monica 14,105 9.5 9.5 9.5 9.5 9.4Good to
Very GoodDecreased 03/04/2019
Expo La Brea 5,953 N/A N/A 9.0 9.0 9.0Good to
Very GoodNo Change 03/19/2019
Expo La Cienega 6,134 N/A N/A 9.3 9.2 9.2Good to
Very GoodNo Change 03/19/2019
Bus/Silver LAC+USC Medical Center 643 8.6 8.6 8.4 8.3 8.2Good to
Very GoodDecreased 02/25/2019
Gold Mariachi Plaza 1,885 9.5 9.5 9.5 9.5 9.5Good to
Very GoodNo Change 02/25/2019
Bus Pico-Rimpau Transit Center 1,415 8.6 8.7 8.7 8.7 8.6Good to
Very GoodDecreased 03/05/2019
AVERAGE SCORE 9.1 9.1 9.0 9.0 9.0Good to
Very GoodNo Change
7

7th Street/Metro Center
Westside/Central Service Area
8
LINE STATION ACTIVITYFY18
Q3
FY18
Q4
FY19
Q1
FY19
Q2
FY19
Q3RATING
SCORING
TRENDS
DATE
INSPECTED
Blue/Expo/Red 7th St/Metro Center 112,868 9.3 8.7 8.8 8.9 8.9Good to
Very GoodNo Change 03/19/2019

17th Street/SMC Station
Westside/Central Service Area
9
LINE STATION ACTIVITYFY18
Q3
FY18
Q4
FY19
Q1
FY19
Q2
FY19
Q3RATING
SCORING
TRENDS
DATE
INSPECTED
Expo 17th St/SMC 5,690 9.5 9.5 9.4 9.5 9.5Good to
Very GoodNo Change 03/04/2019

Bundy Station
Westside/Central Service Area
10
LINE STATION ACTIVITYFY18
Q3
FY18
Q4
FY19
Q1
FY19
Q2
FY19
Q3RATING
SCORING
TRENDS
DATE
INSPECTED
Expo Bundy 4,678 9.5 9.5 9.5 9.5 9.5Good to
Very GoodNo Change 03/04/2019

CSULA Station
Westside/Central Service Area
11
LINE STATION ACTIVITYFY18
Q3
FY18
Q4
FY19
Q1
FY19
Q2
FY19
Q3RATING
SCORING
TRENDS
DATE
INSPECTED
Bus/Silver CSULA 6,080 8.9 9.1 9.0 8.9 8.9Good to
Very GoodNo Change 02/25/2019

Culver City Station
Westside/Central Service Area
12
LINE STATION ACTIVITYFY18
Q3
FY18
Q4
FY19
Q1
FY19
Q2
FY19
Q3RATING
SCORING
TRENDS
DATE
INSPECTED
Expo Culver City Station 6,080 8.9 9.1 9.0 8.9 8.8Good to
Very GoodDecreased 03/05/2019

Culver City Transit Center
Westside/Central Service Area
13
LINESTATION ACTIVITY
FY18
Q3
FY18
Q4
FY19
Q1
FY19
Q2
FY19
Q3RATING
SCORING
TRENDS
DATE
INSPECTED
Bus Culver City Transit Center 1,793 9 8.9 8.2 8.5 8.8Good to
Very GoodImproved 03/05/2019
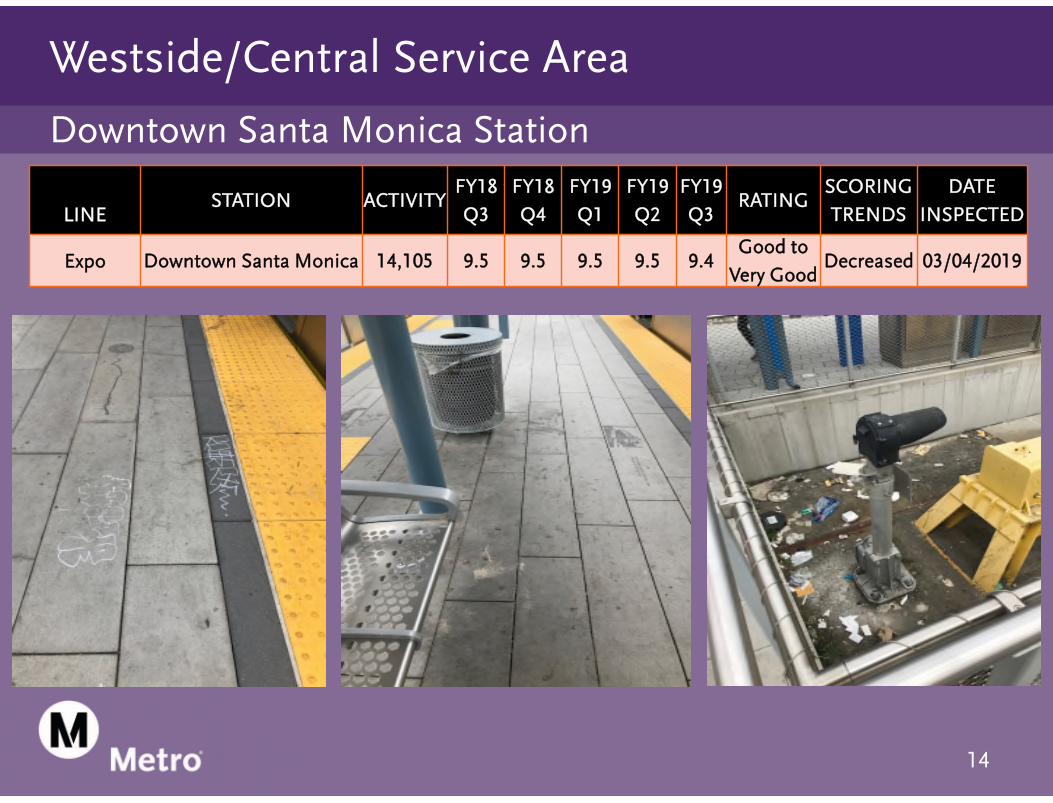
Downtown Santa Monica Station
Westside/Central Service Area
14
LINESTATION ACTIVITY
FY18
Q3
FY18
Q4
FY19
Q1
FY19
Q2
FY19
Q3RATING
SCORING
TRENDS
DATE
INSPECTED
Expo Downtown Santa Monica 14,105 9.5 9.5 9.5 9.5 9.4Good to
Very GoodDecreased 03/04/2019
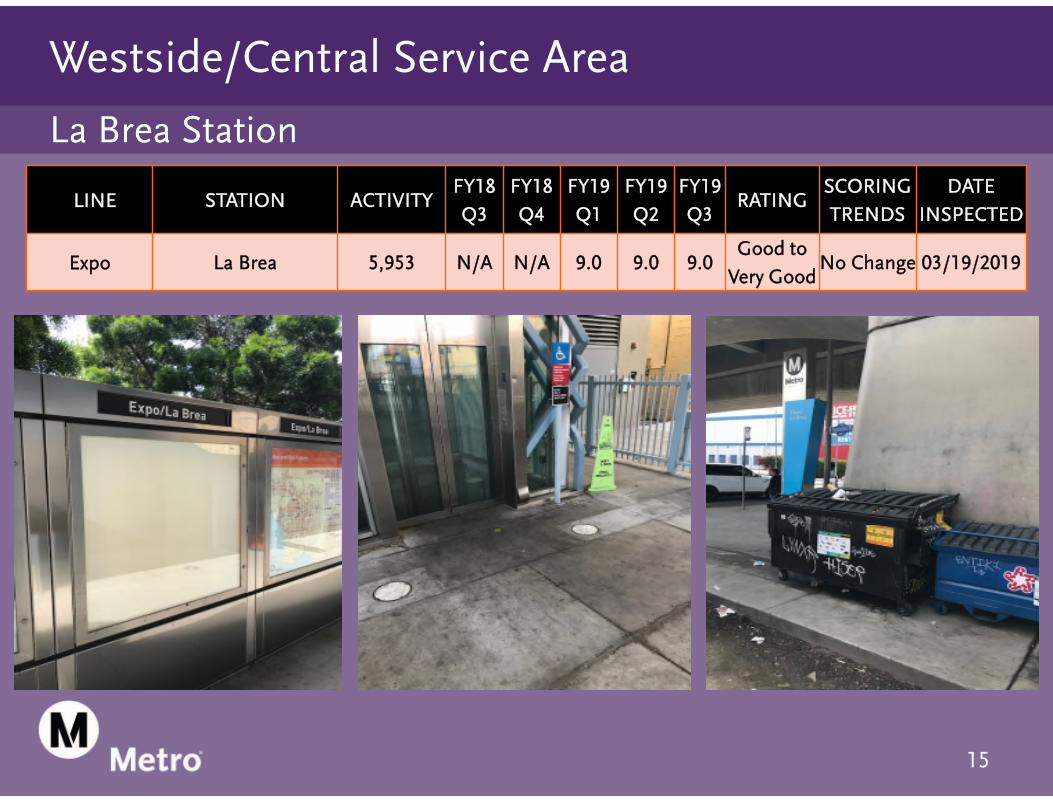
La Brea Station
Westside/Central Service Area
15
LINE STATION ACTIVITYFY18
Q3
FY18
Q4
FY19
Q1
FY19
Q2
FY19
Q3RATING
SCORING
TRENDS
DATE
INSPECTED
Expo La Brea 5,953 N/A N/A 9.0 9.0 9.0Good to
Very GoodNo Change 03/19/2019

La Cienega Station
Westside/Central Service Area
16
LINE STATION ACTIVITYFY18
Q3
FY18
Q4
FY19
Q1
FY19
Q2
FY19
Q3RATING
SCORING
TRENDS
DATE
INSPECTED
Expo La Cienega 6,134 N/A N/A 9.3 9.2 9.2Good to
Very GoodNo Change 03/19/2019

LAC+USC Medical Center Station
Westside/Central Service Area
17
LINE STATION ACTIVITYFY18
Q3
FY18
Q4
FY19
Q1
FY19
Q2
FY19
Q3RATING
SCORING
TRENDS
DATE
INSPECTED
Bus/Silver LAC+USC Medical Center 643 8.6 8.6 8.4 8.3 8.2Good to
Very GoodImproved 02/25/2019

Mariachi Plaza Station
Westside/Central Service Area
18
LINE STATION ACTIVITYFY18
Q3
FY18
Q4
FY19
Q1
FY19
Q2
FY19
Q3RATING
SCORING
TRENDS
DATE
INSPECTED
Gold Mariachi Plaza 1,885 9.5 9.5 9.5 9.5 9.5Good to
Very GoodNo Change 02/25/2019

Pico-Rimpau Transit Center
Westside/Central Service Area
19
LINE STATION ACTIVITYFY18
Q3
FY18
Q4
FY19
Q1
FY19
Q2
FY19
Q3RATING
SCORING
TRENDSDATE
INSPECTED
Bus Pico-Rimpau Transit Center 1,415 8.6 8.7 8.7 8.7 8.6Good to
Very GoodNo Change
03/05/2019

Restructuring and expansion of Station Evaluation Program Staff continues to work on the expansion and restructuring of the
Station Evaluation Program. In FY19 Q4, staff will use automated data collection application
to collect station inspection data. Procurement of the contractor will be finalized and training of
contracted staff will begin. New staff has been added to the RSC Team. A Facilities Maintenance
Supervisor and two Transportation Planners have been assigned tomanage and oversee the new Station Evaluation Program.
Schedule inspections for FY19 Q4.
Next Steps
20

Questions?
21