quartz‐crystal microbalance measurements of cd19 antibody
TRANSCRIPT

123456789
10111213141516171819202122232425262728293031323334353637383940414243444546474849505152535455565758
DOI: 10.1002/elan.201700789
Quartz-crystal Microbalance Measurements of CD19Antibody Immobilization on Gold Surface and Capturing BLymphoblast Cells: Effect of Surface FunctionalizationKutay Icoz+,*[a] Mehmet Cagri Soylu+,[b] Zeynep Canikara,[b] and Ekrem Unal[c]
Abstract: We have investigated different surface function-alization methods to immobilize CD19 antibody on goldsurface to capture B lymphoblast cells associated with theacute lymphoblastic leukemia disease. Quartz CrystalMicrobalance measurements were performed to analyzethe binding kinetics of each layer and determine theoptimum method, which results in higher cell capturerates. The random orientation of antibody and orientedantibody through protein G was investigated and proteinG presence resulted in 15,2 Hz frequency shift for104 cells/mL. The 3-mercaptopropyltrimethoxysilane(MPS) and 11-Mercaptoundecanoic acid (MUA) coatings
of gold surface together with 4-(N-Maleimidomethyl)cyclohexane-1-carboxylic acid 3-sulfo-N-hydroxysuccini-mide ester sodium salt (Sulfo-SMCC) and N-Ethyl-N’-(3-dimethylaminopropyl) carbodiimide hydrochloride(EDC)/N-hydroxysulfosuccinimide (NHS) linker layerswere tested on QCM for protein G and antibody binding.The results indicate that MUA, EDC/NHS, protein G,antibody CD19 is the optimum surface modificationamong the tested combinations. By using the optimumsurface functionalization method, minimum 103 cell permL was measured as 1.9 Hz frequency shift.
Keywords: surface functionalization · acute lymphoblastic leukemia · quartz crystal microbalance with dissipation · CD19immobilization · B lymphoblast · protein G
1 Introduction
According to the American Cancer Society, Leukemia isthe most common type of cancers in childhood. Eventhough some of the children with acute lymphoblasticleukemia achieve complete remission and no clinicalsymptoms are observed, leukemia may relapse know asMinimal Residuel Disease (MRD) [1–3]. There is aconsensus on the necessity of MRD monitoring forincreasing the treatment efficiency [2]. MRD is monitoredusing multicolored Flow cytometry and CD19, CD34 andCD10 antigens are determined as the backbone panel forMRD detection [3]. In order to develop a MRD biochipand capture leukemia cells on a sensor surface, immobili-zation of CD19 on gold surface has to be investigated.Immobilization of antibodies as receptors on the surfacesis of utmost importance for the performance of abiosensor. Antibodies recognize the analyte based onaffinity and this recognition is transduced to another typeof signal that can be measured [4]. Advancements inmicro and nano technology revealed development ofnovel transducers such as cantilevers [5–7], nanowires [8–10], surface plasmon resonators (SPR) [11–13], micro-electrodes [14–16] and micro/nano particles such as gold[17–19], silver [20–22] nanoparticles, and immunomagneticbeads [23–26]. Various methods have been reported forimmobilizing antibodies on transducers [27–29] or micro/nano particles [30–32]. For gold surfaces, self–assembledmonolayers of thiol group (�SH) or carboxyl group(�COOH) are dominantly preferred due to the formation
of stable bonds [33]. Formation of a self-assembledmonolayer of MUA and EDC/NHS activation of thecarboxyl group of MUA layer was extensively used toimmobilize antibodies on a gold surface for SPR basedbiosensing [34,35]. Another thiol group including coatingagent is MPS that is able to easily undergo a hydrolysisand condensation process in aqueous ethanol solution athigh pH. At appropriate conditions, those processes couldbe controlled to provide adequate electrical insulation,favorable surface morphology and chemistry for sensorsused for bio-detection in ionic bio-fluids. The condensedlayer of MPS on a piezoelectric sensor measuring bindingsurface stress induces detection resonance shift, andenables optimal binding on a structurally smooth surface[36].
It has been also shown that the antibody orientationon the transducer surface affects the capture efficiency of
[a] K. Icoz+
BioMINDS (Bio Micro/Nano Devices and Sensors) Lab, De-partment of Electrical and Electronics Engineering, AbdullahGul University, 38080, Kayseri, TurkeyE-mail: [email protected]
[b] M. C. Soylu,+ Z. CanikaraBiomedical Engineering Department, Erciyes University,38030, Kayseri, Turkey
[c] E. UnalDivision of Pediatric Hematology, Department of Pediatrics,Faculty of Medicine, Erciyes University, 38030, Kayseri, Tur-key
[+] Authors contributed equally.
Full Paper
www.electroanalysis.wiley-vch.de � 2018 Wiley-VCH Verlag GmbH & Co. KGaA, Weinheim Electroanalysis 2018, 30, 834 – 841 834

123456789
10111213141516171819202122232425262728293031323334353637383940414243444546474849505152535455565758
the target molecule [37,38]. One strategy of obtaining theoriented antibody is immobilizing antibodies on the sur-face so that antigen binding sites (Fab) are directedtowards the analyte [39]. Protein G has binding sites forthe constant Fc region of mammalian immunoglobulin Gs(IgGs) [40], and antibody immobilization on a preformedlayer of protein G provided improved sensitivity com-pared to the antibody immobilization without protein Glayer [41].
Quartz Crystal Microbalance (QCM) sensor is a nano-gram sensitive technique that has been used in the widerange of bio-detection applications to detect various bio-analytes such as herbicide, virus, bacteria, DNA/RNA,protein, cell and tissue by using resonance frequencychange due to total mass increment on gold coated quartzcrystal surface [42–48]. QCM sensor has been extensivelyused for measuring antigen-antibody interactions [49–53].Quartz Crystal Microbalance with Dissipation (QCM-D)monitoring enables real-time, label free measurements ofmolecular adsorption and/or interaction on crystal surface.Besides, it also enables to monitor the viscoelastic proper-ties of adsorbed layer via dissipation parameter (D)patented by Q-Sense�. Dissipation takes place when thevoltage on the crystal is shut off and the energy ofoscillating crystal dissipates [54, 55].
Sauerbrey Equation explaining linear relation betweenthe changes in the resonance frequency of a quartz crystaland the mass change on its surface. The QCM’s resonancefrequency change, Df, was related to the total mass changeper unit area at the QCM surface, Dm, as;
Dm ¼ �C: Df=n ð1Þ
where f was the resonance frequency of the QCM, C wasthe sensitivity factor (17.7 ng Hz�1 cm�2) [56,57], and n wasthe the overtone number (n=1, 3, 5, 7).
This paper presents the QCM�D experiments of sixdifferent techniques to immobilize CD19 antibody ongold surface (Figure 1) to capture the B lymphoblast cells.In the next sections we detail the experimental procedure,present and discuss the results.
2 Materials and Methods
Direct Protein G adsorption on gold surface, MPS orMUA coatings with Sulfo-SMCC, EDC/NHS linkers andimpact of protein G were experimentally tested (Table 1).
Method A relies on the adsorption of protein G onbare gold surface [58], without any pre-coating of thesurface. The main steps of the immobilization procedureare (Bovine Serum Albumin (BSA)):
Gold� ProteinG� CD19� BSA� Blymphoblast ð2Þ
Method B uses the formation of MPS self assembledmonolayer on gold surface [36], then for activation of thesurface Sulfo-SMCC linker layer was formed. The mainsteps of the immobilization procedure are:
Gold�MPS� Sulfo� SMCC � CD19�BSA� Blymphoblastcells
ð3Þ
Method C includes protein G on gold surface pre-modified with MPS and Sulfo-SMCC layers. The mainsteps of the immobilization procedure are:
Gold�MPS� Sulfo� SMCC � ProteinG
� CD19� BSA� Blymphoblastcellsð4Þ
Method D uses the formation of MUA self assembledmonolayer and EDC/NHS, cross linking followed byprotein G modification [59]. The main steps of theimmobilization procedure are:
Gold�MUA� EDC=NHS� ProteinG�CD19� BSA� Blymphoblastcells
ð5Þ
Method E uses the combination of MPS coating andEDC/NHS linking. The methoxy groups on the free MPSmolecules are hydrolyzed in the aqueous ethanol solution,as well as, the thiol groups on the MPSs are engaged onthe gold surface of QCM via Thiol-Gold interaction. Due
Fig. 1. Illustration of the tested surface modification methods(methods A, B, C, D, E and F) to capture B lymphoblast cells ona gold surface.
Table 1. Tested surface modification methods.
Methods ThiolGroup
Linker OrientationProtein
Antibody
MethodA
– – Protein G CD19
Method B MPS Sulfo-SMCC
– CD19
Method C MPS Sulfo-SMCC
Protein G CD19
MethodD
MUA EDC/NHS Protein G CD19
Method E MPS EDC/NHS Protein G CD19Method F MPS EDC/NHS – CD19
Full Paper
www.electroanalysis.wiley-vch.de � 2018 Wiley-VCH Verlag GmbH & Co. KGaA, Weinheim Electroanalysis 2018, 30, 834 – 841 835

123456789
10111213141516171819202122232425262728293031323334353637383940414243444546474849505152535455565758
to the high pH (pH=9.0), hydroxyl groups on MPSmolecules engaged on the surface commence to condensewith the next engaged MPS molecule’s hydroxyl group,and this condensation forms the tight MPS coating on thegold surface. After condensation, free nucleophilichydroxyl groups remaining on the coating react with theelectrophilic carbodiimides of EDC. The cross-linkingbinding of EDC/NHS produces amine reactive sensorsurface, and provides the Protein Gs’ amine groups tobind with the Sulfo-NHSs. The main steps of theimmobilization procedure are:
Gold�MPS� EDC=NHS� ProteinG�CD19� BSA� Blymphoblastcells
ð6Þ
Method F is designed to investigate the impact ofprotein G. The steps in method E are exactly followedexcept the Protein G step. The main steps of theimmobilization procedure are:
Gold�MPS� EDC=NHS� CD19
� BSA� Blymphoblastcellsð7Þ
By measuring the frequency shift after the B lymphoblastcell capture step on the QCM sensor, we determined themethod with highest efficiency. Also the impact of BSApassivation layer to cell capture ratio for the method Ewas explored as a result of experimental observation.
2.1 Materials
CD19 antibody was purchased from Biolegend (SanDiego, CA). Protein G was purchased from ThermoScientific (Pittsburgh, PA). B lymphoblast cells CCRF-SBwere purchased from ATCC (Rockville, MD), and allother chemicals were purchased from Sigma-Aldrich (St.Louis, MO).
2.2 QCM-D Experiments
The immobilization of B lymphoblast cells on gold surfacewas studied using a quartz crystal microbalance withdissipation monitoring QCM-D (Q-Sense E4, BiolinScientific, Vastra Frolunda, Sweden). Gold-coated quartzcrystals i. e., sensor chips (a fundamental frequency of 5-MHz) were purchased from Biolin and used according tothe manufacturer’s instructions. New gold-coated sensorchips were sequentially rinsed with deionized water andabsolute ethanol and then dried under a nitrogen stream.The chips were next placed in an UV/ozone chamber for20 minutes, and incubated in base piranha solution (20 mLammonia solution, 20 mL hydrogen peroxide in 30 mLdeionized water) for 20 minutes then rinsed with deion-ized water, and dried under a nitrogen stream. A freshlycleaned chip was mounted into the QCM-D chamberbefore every experiment.
2.3 Modifications of the Chip Surface
The chip surface was modified in 2 different ways in theexperiments: MPS or MUA coatings. For MPS coating thesolution of 10 mL MPS, 2,34 mg KOH, 50 mL deionizedwater, and 10 mL ethanol at pH 9 was introduced to thechamber (60 minutes), then the sensor was rinsed withethanol and deionized water to wash out loosely absorbedmaterial. For the MUA coating the solution of 1 mMMUA in ethanol was introduced to the chamber until thesignal is stabilized (60 minutes), then the sensor wasrinsed with ethanol and deionized water to wash looselyabsorbed material. For the uncoated sensor experiments(method A), phosphate buffered saline (PBS) was intro-duced to the chamber and the surface allowed toequilibrate in PBS (pH 7.4) until a stable first overtonefrequency was observed (1 Hz over 10 minutes). Thisprocedure was typically accomplished in 40–50 minutes.
2.3.1 Cross-Linkers
Two different cross-linkers were used in the experiments;EDC/NHS and Sulfo-SMCC. For EDC/NHS crosslinkingthe solution of 5 mg EDC, 5 mg NHS in 1 mL deionizedwater was introduced to the chamber including the sensormodified with MPS for 45 minutes. Then, the surface wasrinsed with deionized water and PBS (pH 7.4) to wash outloosely absorbed material. For Sulfo-SMCC crosslinking,the solution of 1 mg Sulfo-SMCC in 1 mL deionized waterwas introduced to the chamber including the sensormodified with MPS for 45 minutes. Then, the sensor wasrinsed with deionized water and PBS to wash out looselyabsorbed material.
2.3.2 Protein G and CD19 Antibody Immobilization
The protein G solution, 800 mL protein G (5 % protein Gsolution in deionized water) in 5.4 mL PBS was intro-duced to chamber for 60 minutes. Then the sensor surfacewas rinsed with PBS. The 500 mL of stock solution ofCD19 (20 mL CD19 antibody in 1 mL PBS) was diluted in5.4 mL PBS and then introduced to chamber until thesignal was stabilized (60 minutes), followed by PBSrinsing.
2.3.3 BSA Blocking
The solution, 5% BSA solution (0.5 mg BSA in 10 mLPBS) was introduced to the chamber to prevent non-specific binding of cells for 45 minutes, followed by PBSrinsing.
2.3.4 Capturing B Lymphoblast Cells
For determining the optimum surface functionalizationmethod, 104 cells/mL of B lymphoblast cells in PBS wereintroduced into flow chamber for 60 minutes. Afterdetermining the surface functionalization method, solu-
Full Paper
www.electroanalysis.wiley-vch.de � 2018 Wiley-VCH Verlag GmbH & Co. KGaA, Weinheim Electroanalysis 2018, 30, 834 – 841 836
123456789
10111213141516171819202122232425262728293031323334353637383940414243444546474849505152535455565758
tion containing 103, 104, 106 B lymphoblast cells per mL inPBS were introduced into flow chamber containing thefunctionalized sensor for 60 minutes to determine theconcentration dependency. Prior cell count was performedboth with Muse Cell Analyzer (Merck, Billerica MA)device and manually with a Neubauer Chamber.
Each experiment was repeated at least 3 times toobtain the means and standard deviations of the frequencyshift data, the error bars indicate the standard deviationfrom the average values. Statistical significance wasconsidered at P<0.05. Student’s t-test was performed forthe experimental results.
3 Results and Discussion
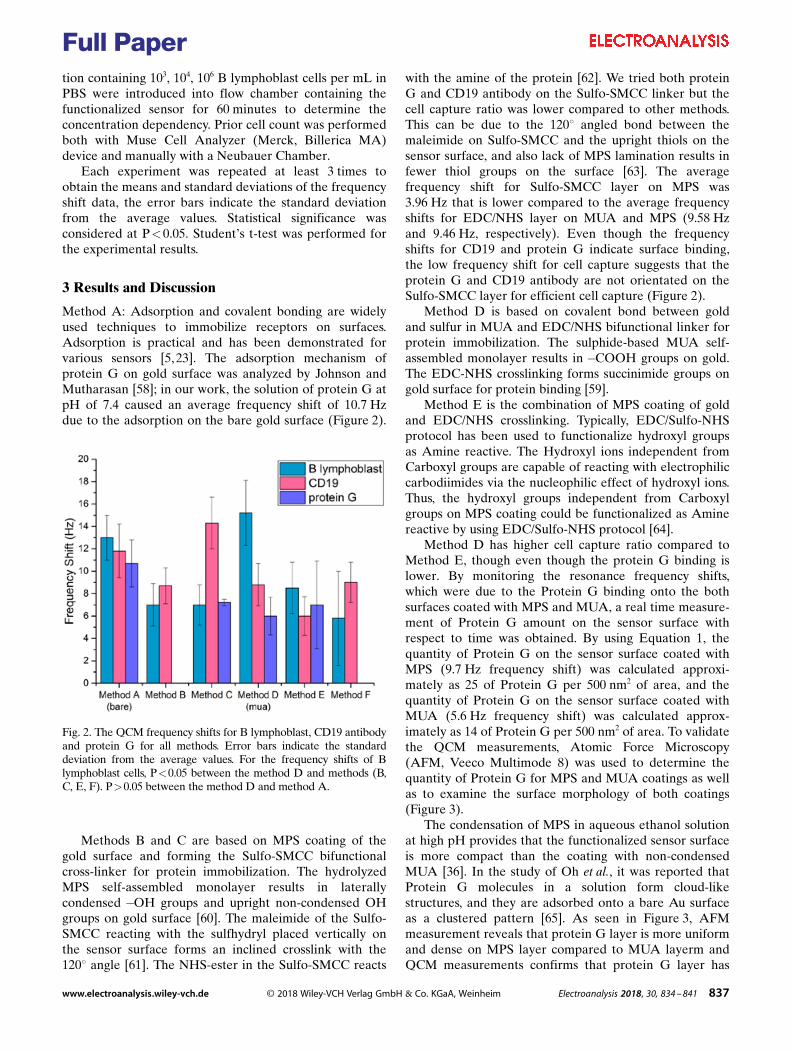
Method A: Adsorption and covalent bonding are widelyused techniques to immobilize receptors on surfaces.Adsorption is practical and has been demonstrated forvarious sensors [5, 23]. The adsorption mechanism ofprotein G on gold surface was analyzed by Johnson andMutharasan [58]; in our work, the solution of protein G atpH of 7.4 caused an average frequency shift of 10.7 Hzdue to the adsorption on the bare gold surface (Figure 2).
Methods B and C are based on MPS coating of thegold surface and forming the Sulfo-SMCC bifunctionalcross-linker for protein immobilization. The hydrolyzedMPS self-assembled monolayer results in laterallycondensed �OH groups and upright non-condensed OHgroups on gold surface [60]. The maleimide of the Sulfo-SMCC reacting with the sulfhydryl placed vertically onthe sensor surface forms an inclined crosslink with the1208 angle [61]. The NHS-ester in the Sulfo-SMCC reacts
with the amine of the protein [62]. We tried both proteinG and CD19 antibody on the Sulfo-SMCC linker but thecell capture ratio was lower compared to other methods.This can be due to the 1208 angled bond between themaleimide on Sulfo-SMCC and the upright thiols on thesensor surface, and also lack of MPS lamination results infewer thiol groups on the surface [63]. The averagefrequency shift for Sulfo-SMCC layer on MPS was3.96 Hz that is lower compared to the average frequencyshifts for EDC/NHS layer on MUA and MPS (9.58 Hzand 9.46 Hz, respectively). Even though the frequencyshifts for CD19 and protein G indicate surface binding,the low frequency shift for cell capture suggests that theprotein G and CD19 antibody are not orientated on theSulfo-SMCC layer for efficient cell capture (Figure 2).
Method D is based on covalent bond between goldand sulfur in MUA and EDC/NHS bifunctional linker forprotein immobilization. The sulphide-based MUA self-assembled monolayer results in �COOH groups on gold.The EDC-NHS crosslinking forms succinimide groups ongold surface for protein binding [59].
Method E is the combination of MPS coating of goldand EDC/NHS crosslinking. Typically, EDC/Sulfo-NHSprotocol has been used to functionalize hydroxyl groupsas Amine reactive. The Hydroxyl ions independent fromCarboxyl groups are capable of reacting with electrophiliccarbodiimides via the nucleophilic effect of hydroxyl ions.Thus, the hydroxyl groups independent from Carboxylgroups on MPS coating could be functionalized as Aminereactive by using EDC/Sulfo-NHS protocol [64].
Method D has higher cell capture ratio compared toMethod E, though even though the protein G binding islower. By monitoring the resonance frequency shifts,which were due to the Protein G binding onto the bothsurfaces coated with MPS and MUA, a real time measure-ment of Protein G amount on the sensor surface withrespect to time was obtained. By using Equation 1, thequantity of Protein G on the sensor surface coated withMPS (9.7 Hz frequency shift) was calculated approxi-mately as 25 of Protein G per 500 nm2 of area, and thequantity of Protein G on the sensor surface coated withMUA (5.6 Hz frequency shift) was calculated approx-imately as 14 of Protein G per 500 nm2 of area. To validatethe QCM measurements, Atomic Force Microscopy(AFM, Veeco Multimode 8) was used to determine thequantity of Protein G for MPS and MUA coatings as wellas to examine the surface morphology of both coatings(Figure 3).
The condensation of MPS in aqueous ethanol solutionat high pH provides that the functionalized sensor surfaceis more compact than the coating with non-condensedMUA [36]. In the study of Oh et al., it was reported thatProtein G molecules in a solution form cloud-likestructures, and they are adsorbed onto a bare Au surfaceas a clustered pattern [65]. As seen in Figure 3, AFMmeasurement reveals that protein G layer is more uniformand dense on MPS layer compared to MUA layerm andQCM measurements confirms that protein G layer has
Fig. 2. The QCM frequency shifts for B lymphoblast, CD19 antibodyand protein G for all methods. Error bars indicate the standarddeviation from the average values. For the frequency shifts of Blymphoblast cells, P<0.05 between the method D and methods (B,C, E, F). P>0.05 between the method D and method A.
Full Paper
www.electroanalysis.wiley-vch.de � 2018 Wiley-VCH Verlag GmbH & Co. KGaA, Weinheim Electroanalysis 2018, 30, 834 – 841 837

123456789
10111213141516171819202122232425262728293031323334353637383940414243444546474849505152535455565758
higher binding on MPS surface for the method E. Whenthe calculations with Sauerbrey Equation and AFManalysis are considered, it can be proved that moreProtein G on the MPS coated surface is preserved, andMPS coating is more compact.
In order to investigate the impact of Protein G to cellcapture, the experiments without Protein G (method F)was performed resulting in the lowest cell capture ratio.Protein G provides appropriate antibody orientation andthus higher cell capture ratio. Higher CD19 antibodybinding to the surface did not result in higher cell captureratio due to the random orientation of the antibody thusdecreased cell binding efficiency.
Even though MPS coated surface has higher bindingfor protein G, the cell capture ratio is lower. To under-stand the impact of BSA passivation layer, method D andmethod E were performed without introducing BSA.Eliminating BSA in Method D did not result in anysignificant difference. However, eliminating BSA layer inMethod E increased the cell capture ratio (Figure 4).
As Protein G’s surface coverage depends on thequantity of amine-reactive groups on the sensor surface itsorientation also depends on another critical parameter,pH. At pH=7.4, which is the same with the PhosphateBuffered Saline (PBS) used as a buffer solution in thisstudy, the immobilized protein G’s active sites (Glu27,Lys28, Lys31, Gln32, and Asn35) concerning with theheavy chain sites of IgG (Fc) directs upward due to theneutral electrostatic effect of medium’s pH [40,58].
As illustrated in Figure 5, Protein G on the MUAcoated Au surface directs upward because of the bondingangle of amine with Sulfo-NHS [66]. On the other hand,Protein G on the MPS coated Au surface makes inclinedbonding with the amine reactive groups, and this angledbonding causes the sloping direction of Protein G.
After BSA blocking, which is used to prevent non-specific binding, BSA is more likely to hinder theantibody to engage the target cell. Because of thehindrance of BSAs on the sensor surface and the angle ofprotein Gs, the resonance frequency shift caused by targetcell capturing with the MPS coated sensor is lower whencompared with the resonance frequency shift for thesystem coated with MUA. The impact of BSA blockingalso investigated by AFM measurements (Figure 6). InFigure 6A, the BSA on the MPS layer is similar to the oneas illustrated in Figure 5A where BSA molecules created amore compact surface. The more compact sensor surfacehaving more amine reactive groups as in Method Enaturally have more BSA attached on the surface. Thedense layer of BSA molecules with dimensions 4 nm 3
4 nm 3 14 nm [67] inhibits the inclined IgGs on the MPScoating with dimensions 4 nm 3 8.5 nm 3 14.5 nm as inexplained in Figure 5. Conversely, it is expected that thehindrance effect of quantitatively fewer BSA moleculeson MUA coating on the IgGs uprightly placed the sensorsurface is much less. This less hindrance effect on the IgGson MUA coating provides the IgGs to capture the targetcells readily.
Fig. 3. The AFM analysis of the protein G layer on A) MPS andB) MUA coatings.
Fig. 4. The QCM frequency shifts for B lymphoblast, CD19antibody and protein G for the method E with and without BSA.Error bars indicate the standard deviation from the averagevalues; P<0.05 between the method E and method E (no BSA).
Fig. 5. The schematic illustrations of surface functionalization andthe impact of BSA blocking A) MPS B) MUA.
Full Paper
www.electroanalysis.wiley-vch.de � 2018 Wiley-VCH Verlag GmbH & Co. KGaA, Weinheim Electroanalysis 2018, 30, 834 – 841 838

123456789
10111213141516171819202122232425262728293031323334353637383940414243444546474849505152535455565758
Even though MPS coating results in a uniform proteinG layer on the sensor surface, the BSA layer on MPS andpH reduces the cell binding. Also MPS is pH, coatingrepetition and time sensitive that makes it difficult tocontrol the surface uniformity [36].
Due to the disadvantages of MPS coating and in thelight of the QCM measurements, method D that includesMUA coating, EDC/NHS cross-linking, protein G, CD19antibody and BSA passivation was determined as theoptimum method for surface functionalization to captureB lymphoblast cells. In order to visualize the cells onfunctionalized gold surfaces, the method D was applied togold-coated surfaces for bright field optical micrographs(Figure 7).
Figure 7A shows a QCM sensor surface and Figure 7Bshows square shaped gold pads on a glass substrate. Theblack arrows indicate the captured cells on the surface.
The method D was also tested by changing theconcentration of the B lymphoblast cells (Figure 8).Injection of 103, 104 and 106 cells per mL to the QCMchamber resulted in 1.9 Hz, 15.2 Hz and 66.2 Hz fre-quency shift, respectively. The QCM frequency responsewas also consistent with the dose increment.
4 Conclusion
Our goal is to develop a biochip to capture B lymphoblastcells on the gold-coated sensor surface and quantify thecells. In order to capture B lymphoblast cells, the goldsurfaces can be functionalized with CD19 antibody asrecognition elements. As a first step towards the biochip,an immobilization technique for the CD19 antibody has tobe determined. Here, we report the QCM results ofvarious surface modification strategies to immobilizeCD19 antibody on gold surface and capture B lympho-blast cells. The protein G has significant impact on cellcapture efficiency. Even though higher amount of CD19antibody bind to surface in method F, higher cell captureratio measured for method E is due to the protein Gpresence and orientation of the CD19 antibody. MPS andSulfo-SMCC combination did not result in high cellcapture ratios for QCM as multiple layers of MPSrequired to increase the Sulfo-SMCC binding. It was alsovalidated that protein G has affinity to bare gold surface(method A). Self assembled monolayer of MUA followed
Fig. 6. The AFM analysis of the BSA layer on A) MPS and B)MUA coatings.
Fig. 7. Bright-Field Optical Micrographs of the cells captured onmodified gold surfaces: A) Planar gold surface, B) Square goldsurface on glass. Black arrows indicate the cells captured on thesurface.
Fig. 8. QCM frequency shifts for the main steps of the method Dand concentration dependency. Error bars indicate the standarddeviation from the average values; P<0.05 between the concen-tration pairs of 103 and 104, 103 and 106, 104 and 106 cell/mL.
Full Paper
www.electroanalysis.wiley-vch.de � 2018 Wiley-VCH Verlag GmbH & Co. KGaA, Weinheim Electroanalysis 2018, 30, 834 – 841 839

123456789
10111213141516171819202122232425262728293031323334353637383940414243444546474849505152535455565758
by EDC/NHS activation has been used for antibodyimmobilization, and the CD19 immobilization resulted inhigher cell capture when used together with protein G.The unprecedented MPS-EDC/NHS method has alsoadvantages for biosensors to enable a smoother sensorsurface and more homogeneous receptor dispersion onthe surface, but BSA blocking and pH dependency reducethe cell binding ratios. In the case of MPS-EDC/NHScombination, another blocking agent other than BSAshould be tested. For these reasons, MUA @EDC/NHC @
protein G @CD19 antibody@ BSA layers are preferred tocapture B lymphoblast cells. After determining theoptimum method, we performed concentration experi-ments. The QCM sensor surface was functionalized usingthe optimum method and different cell concentrationswere introduced to QCM chamber. Minimum 103 cell permL was measured as 1.9 Hz frequency shift whereas106 cell per mL was measured as 66.2 Hz frequency shift.Our next efforts will be to apply and optimize thepreferred immobilization procedure for gold surfaces in amicrofluidic platform. As an alternative to the method D,method A can be also preferred for surface functionaliza-tion. Method D provided higher cell capture ratio, and thestatistical test result suggests method A is not significantlydifferent from method D. For long-term stability covalentbinding provides stronger bonds compared to surfaceadsorption thus method D was chosen as the optimummethod.
Acknowledgements
Authors acknowledge The Scientific and TechnologicalResearch Council of Turkey (TUBITAK Project No:115E020) for financial support and Prof. Servet Ozcanand Prof. Musa Karakukcu from Erciyes University forvaluable discussions for the cell line related issues.Authors also acknowledge Tayyibe Gercek for growingcell cultures and Furkan Soysaldi for helping on prepara-tion of QCM data.
References[1] M. Hauwel, T. Matthes, Swiss Med. Wkly. 2014, 144, DOI
10.4414/smw.2014.13907.[2] J. J. M. van Dongen, V. H. J. van der Velden, M. Brugge-
mann, A. Orfao, Blood 2015, 125, 3996–4009.[3] G. Gaipa, G. Basso, A. Biondi, D. Campana, Cytometry Part
B 2013, 84, 359–369.[4] P. Vadgama, P. W. Crump, Analyst 1992, 117, 1657.[5] K. Icoz, C. Savran, Appl. Phys. Lett. 2010, 97, 123701.[6] B. Dhayal, W. A. Henne, D. D. Doorneweerd, R. G. Reifen-
berger, P. S. Low, J. Am. Chem. Soc. 2006, 128, 3716–3721.[7] P. S. Waggoner, H. G. Craighead, Lab Chip 2007, 7, 1238–
1255.[8] G. Zheng, C. M. Lieber, Methods Mol. Biol. 2011, 790, 223–
237.[9] G. J. Zhang, Y. Ning, Anal. Chim. Acta 2012, 749, 1–15.
[10] P. Namdari, H. Daraee, A. Eatemadi, Nanoscale Res. Lett.2016, 11, 406.
[11] J. Zhang, Y. Sun, B. Xu, H. Zhang, Y. Gao, H. Zhang, D.Song, Biosens. Bioelectron. 2013, 45, 230–236.
[12] H. Sıpova, J. Homola, Anal. Chim. Acta 2013, 773, 9–23.[13] P. Singh, Sens. Actuators B 2016, 229, 110–130.[14] M. Varshney, Y. Li, Biosens. Bioelectron. 2009, 24, 2951–
2960.[15] A. T. Sage, J. D. Besant, B. Lam, E. H. Sargent, S. O. Kelley,
Acc. Chem. Res. 2014, 47, 2417–2425.[16] J. Liu, S. Wagan, M. Davila Morris, J. Taylor, R. J. White,
Anal. Chem. 2014, 86, 11417–11424.[17] R. A. Sperling, P. Rivera Gil, F. Zhang, M. Zanella, W. J.
Parak, Chem. Soc. Rev. 2008, 37, 1896.[18] P. D. Howes, R. Chandrawati, M. M. Stevens, Science (80-. ).
2014, 346, 1247390-1-1247390–10.[19] E. Hutter, D. Maysinger, Trends Pharmacol. Sci. 2013, 34,
497–507.[20] M. S. Szymanski, R. A. Porter, J. Immunol. Methods 2013,
387, 262–269.[21] S. Nantaphol, O. Chailapakul, W. Siangproh, Anal. Chim.
Acta 2015, 891, 136–143.[22] A. Abbaspour, F. Norouz-Sarvestani, A. Noori, N. Soltani,
Biosens. Bioelectron. 2015, 68, 149–155.[23] K. Icoz, O. Mzava, Appl. Sci. 2016, 6, 394.[24] J. Y. Hou, T. C. Liu, G. F. Lin, Z. X. Li, L. P. Zou, M. Li, Y. S.
Wu, Anal. Chim. Acta 2012, 734, 93–98.[25] M. C. Lim, G. H. Lee, D. T. N. Huynh, C. E. Hong, S. Y.
Park, J. Y. Jung, C. S. Park, S. Ko, Y. R. Kim, Colloids Surf.B 2016, 145, 854–861.
[26] I. H. Cho, L. Mauer, J. Irudayaraj, Biosens. Bioelectron.2014, 57, 143–148.
[27] Y. Alapan, K. Icoz, U. A. Gurkan, Biotechnol. Adv. 2015, 33,1727–1743.
[28] S. K. Vashist, E. Lam, S. Hrapovic, K. B. Male, J. H. T.Luong, Chem. Rev. 2014, 114, 11083–11130.
[29] M. Singh, M. Holzinger, M. Tabrizian, S. Winters, N. C.Berner, S. Cosnier, G. S. Duesberg, J. Am. Chem. Soc. 2015,137, 2800–2803.
[30] S. Jiang, K. Y. Win, S. Liu, C. P. Teng, Y. Zheng, M.-Y. Han,Nanoscale 2013, 5, 3127–48.
[31] R. A. Bohara, N. D. Thorat, S. H. Pawar, RSC Adv. 2016, 6,43989–44012.
[32] V. Biju, Chem. Soc. Rev. 2014, 43, 744–764.[33] F. Frederix, K. Bonroy, W. Laureyn, G. Reekmans, A.
Campitelli, W. Dehaen, G. Maes, 2003, DOI 10.1021/LA026908F.
[34] M. G. Kim, Y. B. Shin, J. M. Jung, H. S. Ro, B. H. Chung, J.Immunol. Methods 2005, 297, 125–132.
[35] A. Kausaite-Minkstimiene, A. Ramanaviciene, A. Ramana-vicius, Analyst 2009, 134, 2051–2057.
[36] M. C. Soylu, W.-H. Shih, W. Y. Shih, Ind. Eng. Chem. Res.2013, 52, 2590–2597.
[37] C. Zhou, J.-M. Friedt, A. Angelova, K.-H. Choi, W. Laureyn,F. Frederix, L. A. Francis, A. Campitelli, Y. Engelborghs, G.Borghs, Langmuir 2004, 20, 5870–5878.
[38] J. Baniukevic, J. Kirlyte, A. Ramanavicius, A. Ramanavi-ciene, Sens. Actuators B 2013, 189, 217–223.
[39] A. Makaraviciute, A. Ramanaviciene, Biosens. Bioelectron.2013, 50, 460–471.
[40] A. E. Sauer-Eriksson, G. J. Kleywegt, M. Uhlen, T. A. Jones,Structure 1995, 3, 265–278.
[41] H. Y. Song, X. Zhou, J. Hobley, X. Su, Langmuir 2012, 28,997–1004.
[42] C. Koßlinger, S. Drost, F. Aberl, H. Wolf, S. Koch, P. Woias,Biosens. Bioelectron. 1992, 7, 397–404.
[43] G. G. Guilbault, B. Hock, R. Schimid, Biosens. Bioelectron.1992, 7, 411–419.
Full Paper
www.electroanalysis.wiley-vch.de � 2018 Wiley-VCH Verlag GmbH & Co. KGaA, Weinheim Electroanalysis 2018, 30, 834 – 841 840

123456789
10111213141516171819202122232425262728293031323334353637383940414243444546474849505152535455565758
[44] S. Babacan, P. Pivarnik, S. Letcher, A. G. Rand, Biosens.Bioelectron. 2000, 15, 615–621.
[45] P. Abdul Rasheed, N. Sandhyarani, Anal. Chim. Acta 2016,905, 134–139.
[46] X. Li, S. Song, Y. Pei, H. Dong, T. Aastrup, Z. Pei, Sens.Actuators B 2016, 224, 814–822.
[47] N. A. Masdor, Z. Altintas, I. E. Tothill, Biosens. Bioelectron.2016, 78, 328–336.
[48] T. M. Clausen, M. A. Pereira, H. Z. Oo, M. Resende, T.Gustavson, Y. Mao, N. Sugiura, J. Liew, L. Fazli, T. G.Theander, et al., Sens. Bio-Sensing Res. 2016, 9, 23–30.
[49] C. Koßlinger, S. Drost, F. Aberl, H. Wolf, Fresenius J. Anal.Chem. 1994, 349, 349–354.
[50] J. E. Roederer, G. J. Bastiaans, Anal. Chem. 1983, 55, 2333–2336.
[51] H. Muramatsu, J. M. Dicks, E. Tamiya, I. Karube, Anal.Chem. 1987, 59, 2760–2763.
[52] M. Muratsugu, H. Ikeda, F. Ohta, Y. Miya, T. Hosokawa, S.Kurosawa, N. Kamo, Anal. Chem. 1993, 65, 2933–2937.
[53] K. Nakanishi, H. Muguruma, I. Karube, Anal. Chem. 1996,68, 1695–1700.
[54] M. C. Dixon, J. Biomol. Tech. 2008, 19, 151–158.[55] A. Wargenau, N. Tufenkji, Anal. Chem. 2014, 86, 8017–8020.[56] G. Sauerbrey, Zeitschrift fuer Phys. 1959, 155, 206–222.[57] A. Karczmarczyk, K. Haupt, K. H. Feller, Talanta 2017, 166,
193–197.
[58] B. N. Johnson, R. Mutharasan, Langmuir 2012, 28, 6928–34.[59] F. Inci, C. Filippini, M. Baday, M. O. Ozen, S. Calamak, N. G.
Durmus, S. Wang, E. Hanhauser, K. S. Hobbs, F. Juillard,et al., Proc. Natl. Acad. Sci. USA 2015, 112, E4354-63.
[60] I. Byun, A. W. Coleman, B. Kim, J. Micromech. Microeng.2013, 23, 85016.
[61] C. Walther, K. Meyer, R. Rennert, I. Neundorf, BioconjugateChem. 2008, 19, 2346–2356.
[62] J. A. Capobianco, W. Y. Shih, W. H. Shih, Rev. Sci. Instrum.2007, 78, DOI 10.1063/1.2727466.
[63] W. Wu, W.-H. Shih, W. Y. Shih, J. Appl. Phys. 2016, 119,124512.
[64] R. S. Banegas, C. F. Zornio, A. de M. G. Borges, L. C. Porto,V. Soldi, Polımeros 2013, 23, 182–188.
[65] B. K. Oh, W. Lee, Y. K. Kim, W. H. Lee, J. W. Choi, J.Biotechnol. 2004, 111, 1–8.
[66] J. Bart, R. Tiggelaar, M. Yang, S. Schlautmann, H. Zuilhof,H. Gardeniers, Lab Chip 2009, 9, 3481–3488.
[67] S. J. McClellan, E. I. Franses, Colloids Surf. A 2005, 260,265–275.
Received: December 1, 2017Accepted: January 20, 2018
Published online on February 5, 2018
Full Paper
www.electroanalysis.wiley-vch.de � 2018 Wiley-VCH Verlag GmbH & Co. KGaA, Weinheim Electroanalysis 2018, 30, 834 – 841 841