quasi-decadal signals of sahel rainfall and west …...850–500hpa (i.e., the aej layer) at a...
TRANSCRIPT
Quasi-decadal signals of Sahel rainfall and West Africanmonsoon since the mid-twentieth century
Bastien Dieppois,1 Arona Diedhiou,2 Alain Durand,1 Matthieu Fournier,1 Nicolas Massei,1
David Sebag,1,3 Yongkang Xue,4,5 and Bernard Fontaine6
Received 20 February 2013; revised 9 November 2013; accepted 11 November 2013.
[1] Sahel rainfall shows pronounced decadal variability and a negative trend between wetconditions in the 1950s–1960s and dry ones in the 1970s–1980s. Using continuous wavelettransform, the quasi-decadal variability (QDV) of rainfall reveals zonal contrasts. Thehighest QDV is identified in the 1950s–1960s over western Sahel and in the 1970s–1980sover eastern Sahel. The quasi-decadal atmospheric anomalies have been reconstructed usingFourier transform for the 1950s–1960s and the 1970s–1980s, respectively, and assessed bythe composite analysis of the QDV phases for the periods before and after 1968. Overwestern Sahel, the rainfall QDV in the 1950s–1960s is related to the North Atlantic seasurface temperature (SST) variability, as highlighted by the wavelet coherence. Asouthward shift trend of the Intertropical Convergence Zone (ITCZ) is identified through anenhancement of northeasterly fluxes and moisture convergence over the western part ofWest Africa. A decrease (increase) of southern (northern) subtropical sinking motionsseems to be involved. In the 1970s–1980s, a strengthening of cross-equatorial Atlantic SSTand pressure gradients is related to an increase of monsoon flow from lower troposphere upto the midtroposphere and to the northward shift of the ITCZ, mainly over eastern Sahel.The Pacific SST influence is also identified, which involves changes in the globalzonal circulation.
Citation: Dieppois, B., A. Diedhiou, A. Durand, M. Fournier, N. Massei, D. Sebag, Y. Xue, and B. Fontaine (2013),
Quasi-decadal signals of Sahel rainfall and West African monsoon since the mid-twentieth century, J. Geophys. Res.Atmos., 118, doi:10.1002/2013JD019681.
1. Introduction
[2] The observed widespread drought in West Africaduring the 1970s and 1980s was the most significant droughtat the regional scale during the twentieth century [AfricanMonsoon and Multidisciplinary Analyses InternationalScientific Steering Committee, 2005]. The associated decadalrainfall variability has been associated with the effect ofthree competing factors which contribute differently in theinterhemispheric sea surface temperature (SST) signature
[Mohino et al., 2011]: a multidecadal warming trend of theglobal SSTs and two patterns of decadal variability in theAtlantic Multidecadal Oscillation and the InterdecadalPacific Oscillation. Moreover, decadal rainfall variabilitycould be related to the occurrence of individual rainy systems[Le Barbé and Lebel, 1997] and is part of complex multiple-scale interactions between convection and large-scale dy-namics characterizing the West African monsoon (WAM)[Redelsperger et al., 2002].[3] The documented spatiotemporal variability of rainfall
in West Africa is related to convection processes [e.g.,Janicot, 1992; Rodwell and Hoskins, 1996]. In particular, ithas been shown that 80% of Sahel rainfall is associated withorganized deep convective systems called “mesoscale con-vective systems” (MCSs) [Mathon and Laurent, 2001].Two key convective patterns of the WAM dynamics resultfrom the convergence of the northerly Harmattan and thesouthwesterly monsoon flows along the intertropicaldiscontinuity (ITD) [Peyrille et al., 2007]: (1) the IntertropicalConvergence Zone (ITCZ) corresponding to deep wetconvection and (2) the Saharan Heat Low corresponding todeep dry convection. This meridional circulation is coupledwith a zonal circulation characterized by two major jets: theTropical Easterly Jet (TEJ), at 200 hPa, closely related to thedeep wet convection; the African Easterly Jet (AEJ), at600 hPa, which provides the instability for the growth ofAfrican easterly waves [Burpee, 1972; Reed et al., 1977;
1Laboratoire Morphodynamique Continentale et Côtière, Université deRouen, CNRS, Mont-Saint Aignan, France.
2Laboratoire d’étude des Transferts en Hydrologie et Environnement,Université de Grenoble, IRD, Grenoble, France.
3Laboratoire HydroSciences Montpellier, Université de Montpellier 2,IRD, Montpellier, France.
4Department of Geography, University of California, Los Angeles,California, USA.
5Department of Atmospheric and Oceanic Sciences, University ofCalifornia, Los Angeles, California, USA.
6Centre de Recherches en Climatologie, Université de Bourgogne,CNRS, Dijon, France.
Corresponding author: B. Dieppois, Laboratoire MorphodynamiqueContinentale et Côtière, UMR 6143, CNRS/Université de Rouen, FED4116 SCALE, Place Emile Blondel, FR-76821 Mont-Saint Agnan, France.([email protected])
©2013. American Geophysical Union. All Rights Reserved.2169-897X/13/10.1002/2013JD019681
1
JOURNAL OF GEOPHYSICAL RESEARCH: ATMOSPHERES, VOL. 118, 1–13, doi:10.1002/2013JD019681, 2013
Leroux and Hall, 2009] and MCS [Mohr and Thorncroft,2006]. This classic view of the WAM dynamics is closelyrelated to seasonal and interannual time scale research. The re-search on the decadal variability of the WAM is often focusedon the rainfall/SST teleconnection [e.g., Moron, 1997; Baderand Latif, 2003]. The mechanisms involved in these decadalteleconnections have not yet been investigated, which, conse-quently, affects the ability of coupled models (Climate ModelIntercomparison Project 3 and 5 (CMIP3 and 5)) to producerealistic decadal variability in Sahel rainfall in the twentiethcentury [Joly et al., 2007; Martin et al., 2013]. Until now,the total variance of decadal Sahel rainfall variability of theCMIP5 simulations is less than one third of the observed value[Martin et al., 2013].[4] The decadal changes that appeared to be homogeneous
in the Sahel are superimposed onto the more widely knownclimatological north-to-south gradient [e.g., Dai et al.,2004]. Meanwhile, the Sahel region (i.e., the entire semiaridregion south of the Sahara) has shown zonal contrasts overthe last 25 years [Lebel and Ali, 2009; Fontaine et al.,2011a], as in the future climate changes [Fontaine et al.,2011b;Monerie et al., 2012]. As mentioned above, it is gen-erally accepted that SSTs played a major role in determiningthe decadal variability of the WAM. Ward [1998] firsthighlighted stronger Indo-Pacific connections with easternSahel and stronger North and tropical Atlantic connections
with western Sahel. Subsequent studies highlighted the roleof Indian and tropical Pacific SSTs [Bader and Latif, 2003]and warmer Mediterranean SSTs [Fontaine et al., 2011c] inthe east-west contrast of Sahel rainfall.[5] The objective of this paper is to investigate decadal
variability of the WAM dynamics with a focus on zonalcontrasts of Sahel rainfall. The decadal variability of monsooncirculation is studied through integrated moisture flux andconvergence both around lower (1000–850 hPa) and middle(850–500 hPa) levels of the troposphere during decadal wetand dry phases of western and eastern Sahel rainfall. Thenthe decadal anomalies of eastern and western meridional andzonal dynamics of the WAM are examined through windcomponents and specific humidity from the lower to upper tro-posphere. Finally, based on these results, their teleconnectionswith the Atlantic, Mediterranean, Indian, and Pacific SSTsare discussed.
2. Data and Methods
2.1. Rainfall Data
[6] The time scale of the Sahel rainfall index (Figures 1 and2a) is preprocessed using the continuous wavelet transform(CWT) [Torrence and Compo, 1998]. Although the globalwavelet spectrum highlights two decadal time scales of Sahelrainfall variability (Figure 2b)—quasi-decadal (10–20 years)and multidecadal (>20 years)—it is not representative of timefluctuations for these time scales. According to the local wave-let power spectrum (Morlet wavelet: order 6) analysis(Figure 2c), only the quasi-decadal time scale, marked by highvariance after 1950, is significantly above the red noise back-ground spectrum (AR[1] = 0.47) (Figure 2c).[7] To focus on QDV, each time series is first detrended and
then filtered using fast Fourier transform (FFT) according tothe significant time scale of the continuous wavelet transform.A 10 to 20 year quasi-decadal band-pass filter is used to filterout any multidecadal or interannual variability at each gridpoint of rainfall fields in West Africa. A quite similar proce-dure was already applied to the interannual variability of theWAM by Joly et al. [2007].[8] Over the twentieth century, the quasi-decadal filter re-
constructs the north-to-south climatological gradient ofWest African annual rainfall with a standard deviationaround 2.5–3mmmonth�1 in the Sahel region (Figure 2d).The contribution of QDV, here expressed as a percentageof total variance captured by the FFT filter on the overall pre-cipitation variability, is about 0.39% or 8–12% usingmonthly or annual data. However, east-west contrasts, whichwill be developed in section 3, are identified in analyzing thespatiotemporal fluctuations of QDV (Figure 2d).[9] In order to examine the zonal contrasts of Sahel rain-
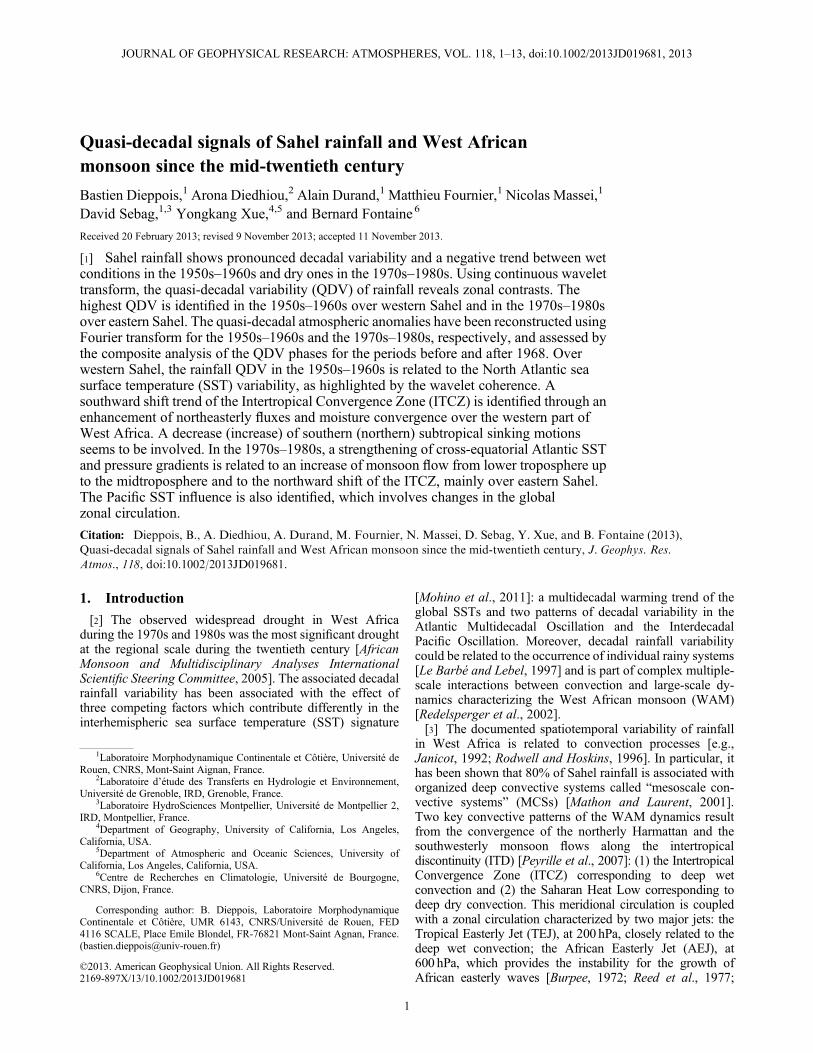
fall, western and eastern rainfall indices were computedfrom the climatic research unit time series 3.10.1 (CRUTS 3.10.1) monthly data sets using an average over13–15°N and 18–2.5°W for western Sahel and 12–14°Nand 2–20°E for eastern Sahel (Figure 1). Because veryfew rain gauges were available over the Sahel to constructthis index before the 1940s, monthly precipitation (fromDakar, Senegal to N’Djamena, Chad) from the GlobalHistorical Climatology Network version-2 (GHCN-2) data-base was used to check the previous western and easternSahel rainfall indices (Figure 1).
Figure 1. Detailed information and geographical locationof selected rainfall stations over western and eastern Sahel.On the map: the bold grey points indicate the Sahel rainfallstations used in Figure 4; the boxes indicate the regions usedfor defining the rainfall regional indices used in Figures 2 and4; Plus signs indicate the rainfall station used for definingCRU TS 3.10.1 rainfall fields in West Africa (light grey:the stations used for defining Sahel index; dark grey: the sta-tions used for defining western and eastern Sahel indices).
DIEPPOIS ET AL.: QUASI-DECADAL VARIABILITY AND THE WAM
2

[10] The FFT reconstructions of QDV of monthly Sahelrainfall time series are also compared with reconstructionscomputed by maximum overlap discrete wavelet transform(MODWT) [Percival and Walden, 2000] and by ensembleempirical mode decomposition (EEMD) [Wu and Huang,2009]. The MODWT (using order S8 Symmlet wavelets)which is an undecimated version of the discrete wavelettransform can be regarded as an approximation of theCWT. With the MODWT, time series of nondyadic lengthcan be analyzed, and neither the filter choice nor the startingpoints of the time series has an influence on the resultingwavelet transform. The EEMD is an autoadaptive, noise-assisted, and data-driven decomposition that extracts internalcomponents of a signal without linear decomposition ofreference scales in the initial series and is particularly welladapted to nonstationary intermittent signals.[11] Finally, the 3month moving average of western and
eastern Sahel rainfall was computed in order to assess thecontribution of the QDV at the seasonal scale, expressed asa percentage of total annual rainfall amounts, using the FFTfilter. Then these seasonal contributions are compared tothe mean annual cycle.
2.2. Atmospheric Data
[12] To identify quasi-decadal signals of WAM since themid-twentieth century and evaluate the uncertainty in currentstate-of-the-art data sets, two reanalysis data sets were
used. The first is the National Centers for EnvironmentalPrediction/National Center for Atmospheric Research-1(NNR-1) which is described in detail in Kalnay et al.[1996]. Camberlin et al. [2001] detected abrupt shifts inNNR-1 geopotential height, temperature, specific humidity,and zonal wind over large parts of tropical Africa around1967/1968. This artifact may be due to changes in data usedfor assimilation (e.g., satellite data).[13] The second data set, the Twentieth Century Reanalysis
version 2 (20CR) [Compo et al., 2011], is also introduced foranalyses to evaluate the data dependence in this study’s re-sults. This is a global reanalysis back in 1850, which has beenproduced by assimilating only surface pressure observationsand using observed SSTs and sea ice concentrations as modelboundary conditions.[14] The moisture flux (Vq) and convergence are integrated
over two layers: 1000–850 hPa (i.e., the monsoon layer) and850–500 hPa (i.e., the AEJ layer) at a quasi-decadal timescale to closely examine the main vertical characteristics ofthe WAM circulation. This gives a synthetic spatial descrip-tion of West African monsoon circulation in the low andmedium levels of the troposphere at a regional scale, sincethe moisture flux and divergence take into account windspeed and specific humidity. The western and eastern merid-ional dynamics from the lower to the upper troposphere (i.e.,1000–300 hPa) are also integrated over meridional cross sec-tions of wind components (v wind and omega) and specific
Figure 2. (a) Monthly (grey shaded) and annual (black lines) Sahel rainfall time series used for the spectralanalysis. (b) The global wavelet spectrum for the annual Sahel rainfall index (lat: 10–20°N; lon: 20°W–20°E).The dashed red line is the mean red noise spectrum (AR[1] = 0.72), while dashed blue line is the mean whitenoise spectrum (AR[1] = 0). (c) Wavelet power spectrum of monthly Sahel rainfall index. Bold line (theso-called cone of influence) delineates the area under which power can be underestimated as a result of edgeeffects, wraparound effects, and zero padding; thin and dashed contour lines show the 90% confidence limitsbased on 5000Monte Carlo simulations of the background spectrumAR[1] = 0.47 before and after removal ofthe seasonal cycle, respectively. (d) Standard deviation of the quasi-decadal Fourier reconstruction of WestAfrican rainfall fields at quasi-decadal time scale for period 1901–2010. Bold red and blue contour linesindicate the high amplitude of quasi-decadal variability, i.e., standard deviation larger than 3.25mmmonths�1
in 1950s–1960s and 1970s–1980s, respectively.
DIEPPOIS ET AL.: QUASI-DECADAL VARIABILITY AND THE WAM
3

humidity (q) over the western part (40°S–40°N, 15–5°W) andeastern part (40°S–40°N, 15–5°E), respectively. Finally, amore global perspective of quasi-decadal dynamic anomaliesis generated through the zonal cross sections of wind compo-nents (u wind and omega) and specific humidity between theAtlantic and Pacific Oceans from the equator to the Sahel(0–20°N, 80°W–180°E).[15] In each grid point with a 2.5° × 2.5° (2° × 2°) horizontal
resolution across 8 (15) vertical levels from 1000 to 300 hPa ofNNR-1 (20CR), the time series are subjected to the FFT filterfollowing the method detailed above from 1948 to the presentand will be compared to the July–September mean of WAMdynamics in sections 4–6. The latter, however, are only shownusing NNR-1 since the patterns are largely similar. There are anumber of shortcomings in each data set for the 1948–1957period [Stickler and Brönnimann, 2011]. Due to these short-comings, which will be introduced in sections 4–6, any identi-fication of quasi-decadal signals of the WAM in this studyis validated by cross interpretations of results detected inNNR-1 and 20CR.
2.3. SST Data and Sahel Rainfall Teleconnections
[16] Using the extended reconstructed SST V3b of theNational Climatic Data Center [Smith et al., 2008], seven re-gional SST indices were computed as a snapshot of SST evo-lution since 1901 by averaging the values over (1) the northernAtlantic (NATL: 25–70°N, 7–75°W), the tropical northernand southern Atlantic (TNA: 5–24°N, 50–15°W; TSA:0–20°S, 30°W–10°E), and the TNA-TSA difference, (2) thewhole Mediterranean basin (MED: 29–45°N, 1°W–45°E), and(3) the tropical Indian Ocean (IND: 24°S–24°N, 35–90°E)and the Niño 3.4 region (NIÑO: 5°S–5°N, 170°W–120°W).The time evolution of the quasi-decadal relationships betweenthe Sahel rainfall field and key SST indices is examinedusing wavelet coherence. Wavelet coherence assesses the lin-ear relationship between two temporal signals x(t) and y(t)around time ti and scale, with the phase diagram describingthe time lag between the signals at any time scale location[Torrence and Webster, 1999; Maraun and Kurths, 2004].Similar procedures to those computed for the wavelet spec-trum have been conducted to testing covarying power (i.e.,5000 Monte Carlo simulations of two independent AR[1] pro-cesses). Processes oscillating on similar frequencies can,however, show patches indicative of an intermittently similarphase evolution. We have, therefore, computed the correlationbetween quasi-decadal signals of SST and Sahel rainfall indi-ces using a 95% confidence level based on an Ebisuzaki ran-dom phase test [Ebisuzaki, 1997]. In section 7, we have onlydisplayed an average of quasi-decadal coherence and phasepatterns, which are significant at the 90% and 95% confidencelevel regarding a red noise test and random phase test, in the1950s–1960s and 1970s–1980s periods.
3. Quasi-Decadal Variability of Eastern/WesternSahel Rainfall
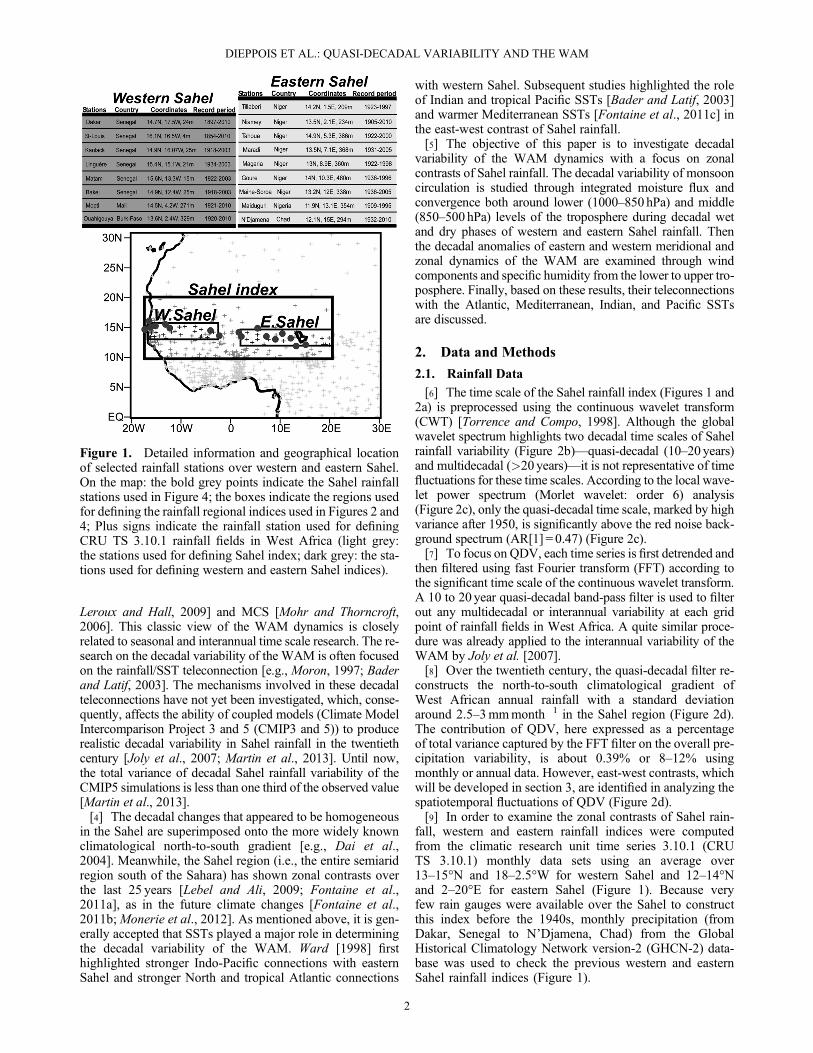
[17] Western and eastern Sahel rainfall indices displaystrong quasi-decadal signals, which appear significantly abovethe background red noise (AR[1]: Western Sahel = 0.473;Eastern Sahel = 0.284), as determined by CWT (not shown).These monthly time series (Figure 3a) are then processed withseveral time scale decompositions. The QDV reconstructed by
FFT of both regional Sahel rainfall indices (black linesin Figure 3b) shows standard deviations of 1.6 and 2mmmonth�1 (including winter months) in western and easternSahel, respectively. The standard deviations of the averagequasi-decadal scale reconstructions are of the same orderusing MODWT (1.8 and 2.3mmmonth�1) and EEMD (2.2and 2.1mmmonth�1). The QDV based on weather stationsis rather high, about 2–5mmmonth�1. Figure 3b illustratesthe time evolution of rainfall QDV over the Sahel for the twen-tieth century. Following the local singularities detected byCWT, periods of high-amplitude fluctuations of the rainfallQDV are detected by the FFT band-pass filter, MODWT,and the EEMD (Figure 3b). These three methods producequite consistent results. In western Sahel (Figure 3b1), QDVsignals are reinforced during the 1940–1960 period, and thecontribution can range between �9 and 10mmmonth�1
(based on weather stations). This reinforcement of QDV sig-nals is related to wet conditions in the 1948–1954 (W1) andthe 1962–1968 (W2) periods, while dry conditions areobserved in the 1940s and the 1955–1961 (D1) periods(Figure 3b). Furthermore, a significant phase shift of westernSahel QDV signals of about 2–4 years is noted due to thesmall number of available weather stations before the1940s (Figure 3b). In eastern Sahel (Figure 3a2), the QDVsignals are reinforced in the 1970s–1980s, and the contribu-tion can range between �9 and 9mmmonth�1 (based onweather stations). This reinforcement of QDV signals is as-sociated with wet conditions in the 1975–1981 (W3) andthe 1987–1992 (W4) periods, while dry conditions areobserved in the 1969–1974 (D2) and the 1982–1987 (D3)periods (Figure 3b2).[18] The contribution of QDV is not constant during the
year and can reach more than 10% of the annual rainfallamount (Figure 3c). During the main rainy seasons of westernSahel (shaded blue), QDV contributes a substantial pro-portion from August to October (with a peak in September)(black line in Figure 3c1). In eastern Sahel, the seasonal con-tribution of QDV is more consistent with the rainy seasonwith the largest contribution from June to September (witha peak in July) (Figure 3c2). Regarding the key phases ofthe annual progression of WAM, the reader is referred toThorncroft et al. [2011]. QDV shows peaks of contributionduring the withdrawal phases of the ITCZ in the westernSahel and during the period when the ITCZ moves northwardand in the eastern Sahel (Figure 3c).
4. Quasi-Decadal Anomalies of Moisture FluxConvergence Within the Lowerand Midtroposphere
[19] This section presents the quasi-decadal signals usingdifferences of wet and dry life cycles of QDV for both pe-riods before and after 1968 in the western Sahel and the east-ern Sahel regions. The composites were examined for thefollowing cycles (Figure 3b): during the 1950s and 1960s,the wet life cycles: W1 (1948–1954) and W2 (1962–1968)and dry life cycle: D1 (1955–1961); during the 1970sand 1980s, the wet life cycles: W3 (1975–1981) and W4(1988–1993) and dry cycles: D2 (1969–1974) and D3(1982–1987).[20] In summer, the lower troposphere displays an en-
hanced southwesterly moisture flux from the Santa Helena
DIEPPOIS ET AL.: QUASI-DECADAL VARIABILITY AND THE WAM
4
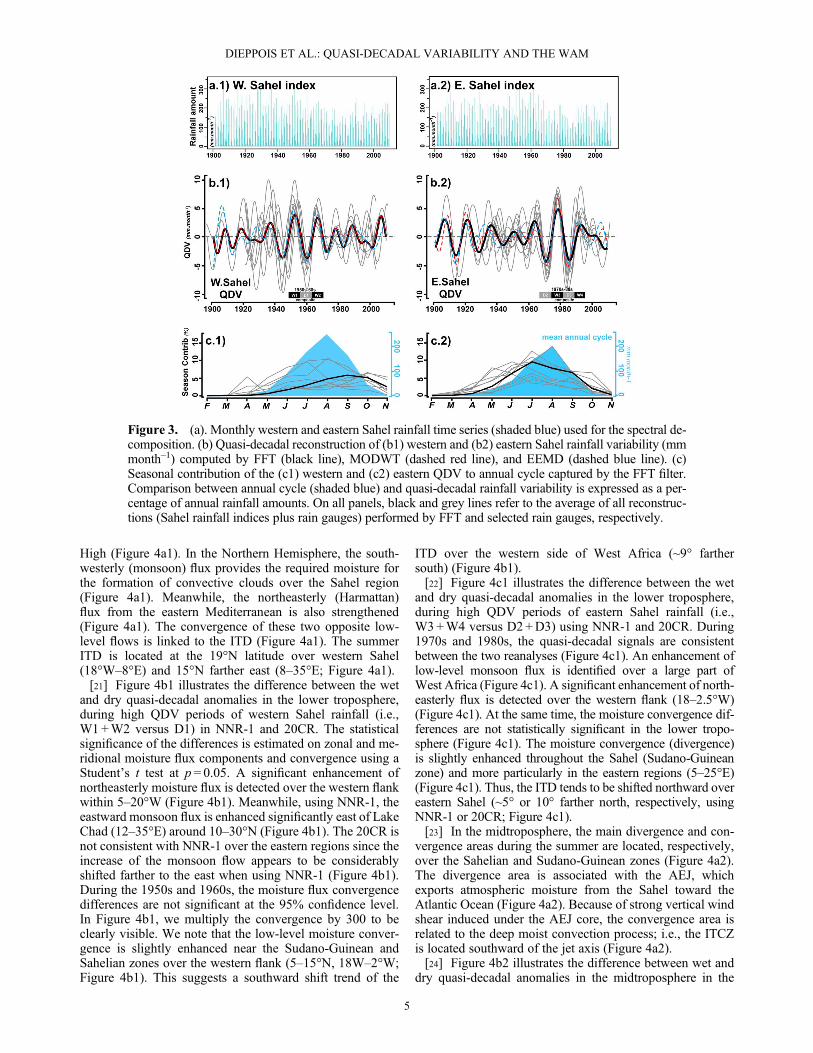
High (Figure 4a1). In the Northern Hemisphere, the south-westerly (monsoon) flux provides the required moisture forthe formation of convective clouds over the Sahel region(Figure 4a1). Meanwhile, the northeasterly (Harmattan)flux from the eastern Mediterranean is also strengthened(Figure 4a1). The convergence of these two opposite low-level flows is linked to the ITD (Figure 4a1). The summerITD is located at the 19°N latitude over western Sahel(18°W–8°E) and 15°N farther east (8–35°E; Figure 4a1).[21] Figure 4b1 illustrates the difference between the wet
and dry quasi-decadal anomalies in the lower troposphere,during high QDV periods of western Sahel rainfall (i.e.,W1 +W2 versus D1) in NNR-1 and 20CR. The statisticalsignificance of the differences is estimated on zonal and me-ridional moisture flux components and convergence using aStudent’s t test at p = 0.05. A significant enhancement ofnortheasterly moisture flux is detected over the western flankwithin 5–20°W (Figure 4b1). Meanwhile, using NNR-1, theeastward monsoon flux is enhanced significantly east of LakeChad (12–35°E) around 10–30°N (Figure 4b1). The 20CR isnot consistent with NNR-1 over the eastern regions since theincrease of the monsoon flow appears to be considerablyshifted farther to the east when using NNR-1 (Figure 4b1).During the 1950s and 1960s, the moisture flux convergencedifferences are not significant at the 95% confidence level.In Figure 4b1, we multiply the convergence by 300 to beclearly visible. We note that the low-level moisture conver-gence is slightly enhanced near the Sudano-Guinean andSahelian zones over the western flank (5–15°N, 18W–2°W;Figure 4b1). This suggests a southward shift trend of the
ITD over the western side of West Africa (~9° farthersouth) (Figure 4b1).[22] Figure 4c1 illustrates the difference between the wet
and dry quasi-decadal anomalies in the lower troposphere,during high QDV periods of eastern Sahel rainfall (i.e.,W3 +W4 versus D2 +D3) using NNR-1 and 20CR. During1970s and 1980s, the quasi-decadal signals are consistentbetween the two reanalyses (Figure 4c1). An enhancement oflow-level monsoon flux is identified over a large part ofWest Africa (Figure 4c1). A significant enhancement of north-easterly flux is detected over the western flank (18–2.5°W)(Figure 4c1). At the same time, the moisture convergence dif-ferences are not statistically significant in the lower tropo-sphere (Figure 4c1). The moisture convergence (divergence)is slightly enhanced throughout the Sahel (Sudano-Guineanzone) and more particularly in the eastern regions (5–25°E)(Figure 4c1). Thus, the ITD tends to be shifted northward overeastern Sahel (~5° or 10° farther north, respectively, usingNNR-1 or 20CR; Figure 4c1).[23] In the midtroposphere, the main divergence and con-
vergence areas during the summer are located, respectively,over the Sahelian and Sudano-Guinean zones (Figure 4a2).The divergence area is associated with the AEJ, whichexports atmospheric moisture from the Sahel toward theAtlantic Ocean (Figure 4a2). Because of strong vertical windshear induced under the AEJ core, the convergence area isrelated to the deep moist convection process; i.e., the ITCZis located southward of the jet axis (Figure 4a2).[24] Figure 4b2 illustrates the difference between wet and
dry quasi-decadal anomalies in the midtroposphere in the
Figure 3. (a). Monthly western and eastern Sahel rainfall time series (shaded blue) used for the spectral de-composition. (b) Quasi-decadal reconstruction of (b1) western and (b2) eastern Sahel rainfall variability (mmmonth–1) computed by FFT (black line), MODWT (dashed red line), and EEMD (dashed blue line). (c)Seasonal contribution of the (c1) western and (c2) eastern QDV to annual cycle captured by the FFT filter.Comparison between annual cycle (shaded blue) and quasi-decadal rainfall variability is expressed as a per-centage of annual rainfall amounts. On all panels, black and grey lines refer to the average of all reconstruc-tions (Sahel rainfall indices plus rain gauges) performed by FFT and selected rain gauges, respectively.
DIEPPOIS ET AL.: QUASI-DECADAL VARIABILITY AND THE WAM
5
1950s–1960s (i.e., W1 +W2 versus D1), which is character-ized by high QDV amplitudes of western Sahel rainfall. Asignificant enhancement of northeasterly moisture flux isidentified using NNR-1 and 20CR over western Sahara andwestern part of West Africa, although moisture convergencedifferences are not statistically significant at the 95% confi-dence level (Figure 4b2). In both reanalyses, an enhancementof midlevel moisture convergence (divergence) is detectedaround 10°W–15°E (18–10°W) between about 5°N and 25°N(Figure 4b2). Over West Africa, the quasi-decadal signalsreveal, therefore, a southward shift trend of the ITCZ. Inthe midtroposphere, quasi-decadal anomalies are not consistent
in these two reanalyses over the eastern regions (Figure 4b2).The differences between NNR-1 and 20CR will be examinedin the following section.[25] Figure 4c2 illustrates the difference between wet and
dry quasi-decadal anomalies in the midtroposphere, duringhigh QDV period of eastern Sahel rainfall (i.e., W3 +W4 ver-sus D2 +D3). As in the lower troposphere, quasi-decadal pat-terns are consistent between NNR-1 and 20CR during thisperiod. The northeastern flux increases in the western region,while a significant enhancement of the southwestern flux isdetected over eastern Sahel (Figure 4c2). Such quasi-decadalcould be associated with two atmospheric processes: (1)
Figure 4. (a) July–September mean integrated moisture fluxes (arrows, in g kg�1m s�1) and divergence(shaded blue (grey): convergence (divergence) fields (in g kg�1 s�1) in (a1) low troposphere and (a2)midtroposhere using NNR-1). (b and c) Significant differences of quasi-decadal integrated moisture fluxesand convergence fields in (b1 and c1) the low troposphere and (b2 and c2) midtroposphere of NNR-1 and20CR for 1950s–1960s (W1+W2 minus D1; Figures 4b1 and 4b2) and 1970s–1980s (W3+W4 minusD2 +D3; Figures 4c1 and 4c2), respectively. Black and red arrows show the integrated moisture fluxesof NNR-1 and 20CR. The statistical significance of differences has been estimated on zonal and meridionalmoisture fluxes and convergence using a Student’s t test at p = 0.05. Note: the moisture flux convergence ismultiplied by 300 and is not shown for the 20CR for display purpose.
DIEPPOIS ET AL.: QUASI-DECADAL VARIABILITY AND THE WAM
6

during a wet summer, the AEJ speed decreases [Newell andKidson, 1984; Fontaine et al., 1995; Grist and Nicholson,2001] and (2) the westerly flow extends well into themidtroposphere during the wet anomalies and accounts forthe northward shift trend of the AEJ [Nicholson and Webster,2007]. Although this is not significant, the moisture conver-gence (divergence) is enhanced in the midtroposphere overthe Sahel (Sudano-Guinean zone) (Figure 4c2). According toTourre et al. [2010], a strong cross-equatorial pressure gradientis detected since both Atlantic subtropical highs are sig-nificantly intensified (Santa Helena High not displayed;Figure 4c2). This is consistent with a development of an equa-torial westerly jet; south of the Sahel appears to be dependenton the surface pressure gradient over the tropical Atlantic in ac-cordance with Thomas and Webster [1997]. As a result, theITCZ tends to be shifted northward throughout West Africa(~10° and 15° farther north, respectively, in NNR-1 and20CR) and especially over the eastern regions (Figure 4c2).
5. Quasi-Decadal Anomaliesin Meridional Circulation
[26] The summer meridional circulations present severalsimilarities over the western (15–5°W) and eastern (5–15°E)cross sections from 1948 to 2012 (Figure 5a). NNR-1 is usedfor Figure 5a. The results of 20CR are not shown since the pat-terns are largely similar. Both cross sections are marked by azone of rising motions between the equator and 22°N, whichreaches the free troposphere at only around 5–15°N, flankedby two overturning cells linked to Hadley circulation dynam-ics (Figure 5a). The sinking branch of the southern (northern)cell is around 30–20°S (25–45°N), while its low-level branchis associated with southwesterly monsoon flow (northeasterlycirculation) (Figure 5a). The convergence zone between thesouthern and northern overturning cells defines the ITD andthe ITCZ at the surface and in the free troposphere, respec-tively (Figure 5a). Note that the ITCZ is southward of theITD (~10° farther south; Figure 5a).[27] Figures 5b1 and 5b2 illustrate the significant differ-
ence between the wet-dry quasi-decadal anomalies of the me-ridional circulation (integrated V and q) during the high QDVperiod of western Sahel rainfall (i.e., W1 +W2 versus D1) for15–5°W and 5–15°E, respectively. Dashed bold lines displayonly the significant anomalies above 300 g kg�1 for the20CR. However, because NNR-1 humidity difference is notconsistent with 20CR, we will mainly focus on wind differ-ences in the following discussion. We note common windanomalies using NNR-1 and 20CR (Figure 5b1): (1) a de-crease of sinking motions between 1000 hPa and 300 hPaover the South Atlantic Ocean, especially between the equa-tor and 20°S, (2) an enhancement (diminution) of northernsubtropical sinking motions from 20 to 30°N (30 to 40°N),and (3) an abnormal southern location of the ITCZ (i.e., ris-ing motion and wet anomaly) over the tropical SouthAtlantic between 10°S and 5°N. However, there are inconsis-tencies of QDV of western Sahel rainfall when using the tworeanalyses. In NNR-1, the increase of northern subtropicalsinking motions is associated with reinforcements of low-level northerlies, rising motions above 900 hPa and a wetanomaly over the western Sahel (Figure 5b1). In 20CR, andas a result of underestimations of the northerlies from 900to 600 hPa along the Atlantic coastal regions between 1948
and 1957 [Stickler and Brönnimann, 2011], such anomaliesare not identified (Figure 5b1). However, only the results ofNNR-1 are in phase with the western Sahel rainfall QDV.[28] During the same period over the eastern meridional
circulation (5–15°E), both reanalyses show significant de-creases (increases) of southern subtropical sinking motionsaround 40–20°S (20–10°S), respectively (Figure 5b2).These two reanalyses reveal different quasi-decadal signals.However, this might be due to overestimations of southwest-erlies in NNR-1 over the eastern part of West Africa in the1950s [Stickler and Brönnimann, 2011]. In NNR-1, an en-hancement of southwesterly flow, which is likely to drive anorthward shift of the ITCZ, is thus identified from 15°S tothe Sahel region and can reach the midtroposphere (within700–500 hPa) above the equator (Figure 5b2). In 20CR, asfor the western cross section (Figures 5b1 and 5b2), thequasi-decadal signals reflect a southward shift of the ITCZleading to a reduction of atmospheric moisture over easternSahel (Figure 5b2), which is more consistent with the lowQDV of eastern Sahel rainfall during this period.[29] During the 1970s and 1980s, the meridional circulations
are generally similar in both reanalyses (20CR humidity is notshown for better legibility) as determined by the difference be-tween the wet and dry quasi-decadal anomalies (i.e., W3+W4versus D2+D3; Figures 5c1 and 5c2). The two cross sections(i.e., western: 15–5°W; eastern: 5–15°E) show different fea-tures. Northern subtropical sinking motions are stronger onthe west side, while monsoon flow became stronger on the eastside. According to Figure 3a, the atmospheric quasi-decadalsignals, nevertheless, are clearer on the eastern cross section(Figures 5c1 and 5c2). A significant increase of southernsubtropical sinking motions is identified around 40–20°S(Figure 5c2). The low-level southwesterly flow enhances sig-nificantly from 20°S to the equator (Figure 5c2). Over theSudano-Guinean zone, rising motions and atmospheric mois-ture are significantly reduced (Figure 5c2). In the Sahel, risingmotions and moisture increase significantly up to 600 hPa(Figure 5c1). The northern subtropical sinking motions are alsostrengthened (Figure 5c1). According to Figures 4c1 and 4c2,the moisture convergence increases (decreases) throughoutthe Sahel (Sudano-Guinean zone) but is more pronounced overeastern Sahel (Figure 5c). This quasi-decadal pattern is there-fore related to a northward shift of the ITCZ (Figure 5c).[30] In summary, quasi-decadal anomalies show different
patterns in meridional circulation before and after 1968and over the eastern and western flanks. In the 1950s and1960s, the anomaly of meridional circulation is not fully un-derstood due to lack of consistent results between NNR-1and 20CR, but, over the western side of West Africa, wecan identify a southward/northward (positive/negativephase) shift of the ITCZ. The latter might be associated witha decrease (increase) of the southern (northern) Hadley cellintensity at a regional scale over the western part ofWest Africa. The 1970s and 1980s periods show a latitudinalshift of the ITCZ related to an intensification of the cross-equatorial pressure gradient and Hadley circulation strongeron the eastern side than on the western side of West Africa.
6. Quasi-Decadal Anomalies in Zonal Circulation
[31] The east-west-oriented Walker circulation is a zonalatmospheric response to zonal thermal contrasts near the
DIEPPOIS ET AL.: QUASI-DECADAL VARIABILITY AND THE WAM
7

equator. Generally, any evolution of the zonal circulation in-fluences the WAM through the generation of anomalies ofsubsidence and air ascents [Caminade and Terray, 2010].This could explain part of the decadal rainfall variability ob-served in the dry 1970s and 1980s or since the mid-1990s
associated with the zonal recovery of Sahel rainfall [Hagosand Cook, 2008]. Figure 6a displays the summer average ofthe zonal circulation around 0–20°N (V and q). In summer,over the Pacific, theWalker circulation intensifies and becomeswell defined, with a branch of strong ascendance concentrated
Figure 5. (a) July–September mean of (a1) western (15–5°W) and (a2) eastern (5–15°E) integratedvertical-meridional cross sections of wind (arrows; in m s�1) and atmospheric moisture fields (shaded; ing kg�1) using NNR-1. (b and c) Significant differences of quasi-decadal anomalies of (b1 and c1) westernand (b2 and c2) eastern integrated vertical-meridional cross sections of wind and atmospheric moisturefields of NNR-1 (wind: black arrows; humidity: shaded) and the 20CR (wind: red arrows; humidity: dashedbold lines) during the 1950s–1960s (W1+W2 minus D1; Figures 5b1 and 5b2) and 1970s–1980s(W3 +W4 minus D2 +D3; Figures 5c1 and 5c2). The statistical significance of differences has beenestimated on zonal and vertical wind components and moisture using a Student’s t test at p = 0.05. Note:vertical velocity is multiplied by 200 to be clearly displayed.
DIEPPOIS ET AL.: QUASI-DECADAL VARIABILITY AND THE WAM
8

near 130°E (warm pool region), and midtroposphere sinkingmotions are found over the western Indian Ocean around48–58°E (Figure 6a). These sinking motions are connectedby low-level westerly wind blowing from the Indian Ocean to-ward the western Pacific, joining the Pacific rising branch.Thus, the overturning is completed by the returning upper-level easterlies over the Indian Ocean to the Atlantic sinkingbranch (Figure 6a). In West Africa, two secondary zonal cellsbetween the Atlantic and Indian Oceans are related to risingmotions up to the free troposphere (Figure 6a), which gener-ates deep moist convection processes.[32] Figure 6b displays the difference between the wet
and dry quasi-decadal anomalies of the integrated zonalcirculation (V and q) around 0–20°N in the 1950s–1960s(i.e., W1+W2 versus D1) in both reanalyses. As a reminder,this period is characterized by high QDV amplitudes of rain-fall over the western Sahel (Figure 3a1). Because the NNR-1humidity difference is not consistent with 20CR, dashed
bold lines display only the significant anomalies above300 g kg�1 for 20CR. Over the Pacific Ocean, a significantdecrease (increase) of rising motions and atmospheric mois-ture is detected around 150–180°E (130–150°E), which sug-gests a westward shift of the rising branch of the Pacificoverturning cell, hence the increase of rising motions overSouth America observed in both reanalyses (Figure 6b). A sig-nificant reduction of moisture and a few decadal wind anoma-lies are common in both reanalyses over the Indian Ocean(Figure 6b): (1) rising motion increases around 105–130°E,(2) the upper level easterly wind increases, and (3) both low-level rising motion and middle- to upper level sinking motionincrease over the western Indian Ocean and eastern Africa.The Walker circulation is therefore intensified over theIndian and Pacific Oceans. Meanwhile, in both reanalyses,very few quasi-decadal signals are significantly detectedin the Walker circulation around 1000–850 hPa over WestAfrica. Differences of QDV signals are nonetheless identified
Figure 6. (a) July–September mean of integrated vertical-zonal cross sections of wind (arrows; in m s�1)and atmospheric moisture fields (shaded; in g kg�1) from the equator to 20°N using NNR-1. (b and c)Significant differences of quasi-decadal anomalies of integrated vertical-zonal cross sections of wind andmoisture fields of NNR-1 (wind: black arrows; humidity: shaded) and 20CR (wind: red arrows; humidity:dashed bold lines) during the 1950s–1960s (W1+W2 minus D1; Figure 6b) and 1970s–1980s (W3+W4minus D2 +D3; Figure 6c). The statistical significance of differences has been estimated on zonal andvertical wind components and atmospheric moisture regarding a Student’s t test at p = 0.05. Note: verticalvelocity is multiplied by 150 to be clearly displayed.
DIEPPOIS ET AL.: QUASI-DECADAL VARIABILITY AND THE WAM
9

over the African continent, but, compared to upper air obser-vations in the 1950s, 20CR shows larger deviations thanNNR-1 over the Africa-Asia longitudinal window [Sticklerand Brönnimann, 2010]; and the quasi-decadal anomalies of20CR are out of phase with western Sahel rainfall QDV.NNR-1 pattern appears more consistent and shows an increaseof rising motions (above 700 hPa) and atmospheric moisturefrom 15°W to 10°E.[33] In the 1970s–1980s, the quasi-decadal signals of the
integrated zonal circulation are also determined around0–20°N using the difference of wet and dry life cycles duringa period of high QDV variance of rainfall in the eastern Sahel(i.e., W3 +W4 versus D2 +D3; Figure 6c). The results ofNNR-1 and 20CR are highly consistent for this period; there-fore, the 20CR humidity is not shown. Over the PacificOcean, a significant increase (decrease) of rising motionsand atmospheric moisture is identified around 140–180°E
(120–140°E). An eastward shift of the Pacific overturningcell could therefore be involved (Figure 6c). Over theIndian Ocean, we observe significant anomalies betweenthe 1970s and 1980s (Figure 6c): (1) within 40–80°E, a de-crease of low-level westerly wind and upper level easterlywind and (2) both low-level rising and middle- to upper levelsinking motions decrease over the western Indian Ocean andeastern Africa. These wind anomalies are related to a weak-ening of the Walker circulation over the Indian and westernPacificOceans (Figure 6c). Over theAtlantic Ocean, an increaseof sinking motions is identified around 60–10°W in NNR-1and is located slightly farther east in 20CR (20–10°W),hence the decrease of atmospheric moisture over westernSahel and the low QDV signal (Figure 6c). Farther east, i.e.,over West Africa, significant increases of rising motions andatmospheric moisture and a decrease of easterly winds aredetected, resulting in an increase of the atmospheric moisture
Figure 7. (left column) Quasi-decadal patterns (10–20 year) of the wavelet coherence (contour) and phase(shaded) betweenWest African rainfall fields and selected SST indices ((a) NATL; (b) TSA; (c) TNA-TSA;(d) NIÑO 3.4) (10–20 year) in the period 1950s–1960s. (right column) The period 1970s–1980s. Thin andthick contours, respectively, refer to significant coherence performed by Monte Carlo simulations at the90% and 95% confidence limits. Positive time lag is masked due to the weakness of logical interpretations.
DIEPPOIS ET AL.: QUASI-DECADAL VARIABILITY AND THE WAM
10

and the QDV signal of eastern Sahel rainfall (Figure 6c). Thislatter anomaly is also consistent with a decrease of easterlywind components in the middle and upper tropospheres,i.e., in the AEJ and the TEJ layers (Figure 6c).
7. Time Evolution of SST Teleconnections
[34] Figure 7 shows significant results of wavelet coher-ence and phase applied to key SST indices and WestAfrican rainfall fields. At the quasi-decadal time scale, thecoherence of rainfall with Mediterranean, Indian, and tropi-cal North Atlantic SSTs is rejected at the 90% and 95% con-fidence level using a red noise test or random phase test (notshown). The time evolution of rainfall/SST teleconnectionsdisplays zonal contrasts at this scale, which can be fully asso-ciated with various WAM anomalies.[35] In the 1950s–1960s, the quasi-decadal covarying
power between the Sahelian rainfall field and the SST indicesis only significant within the extratropical North AtlanticSST (NATL), especially over western Sahel and eastwardof Lake Chad (Figure 7a1). Quasi-decadal coherence patternsof NATL and Sahel rainfall are in phase. Enhanced rainfallover the Sahel is related to the positive phase of NATL in ac-cordance with previous studies [e.g., Folland et al., 1986;Zhang and Delworth, 2006]. Moreover, NATL mainly leadsthe statistical relationship from a �3 year to +1 year lag(Figure 7a1). Although this relationship remains weak, theycan be partly related to quasi-decadal atmospheric anomaliesalready detected in NNR-1 and 20CR over the westernflank of West Africa as well as eastward of Lake Chad(Figures 4–7). This might imply changes in both the meridio-nal and zonal cell circulations over monsoon regions, althoughthis cannot be directly proved here. Indeed, inconsistencies be-tween the results of NNR-1 and 20CR make interpretationsvery difficult. Nevertheless, in the 1950s–1960s, an overviewof anomalies points to a large-scale relationship impactingboth the African and Indian longitudinal windows, since atthe quasi-decadal time scale, NATL variability contributes toregulating a significant part of the mean cross-hemispherictemperature gradient, which controls the northward penetra-tion of the monsoon in these regions.[36] At the quasi-decadal time scales, both tropical Atlantic
(TSA, TNA�TSA) and Pacific (NIÑO 3.4) SST variationsare coherent with those recorded in Sahel rainfall, althoughmore strongly across the eastern flank and during the 1970sand 1980s (Figures 7b2–7d2, right column). Tropical SouthAtlantic SST (TSA) and Sahel rainfall show an out-phasequasi-decadal pattern, in agreement with Polo et al. [2008]and Losada et al. [2009], showing that warmer (cooler)TSA is related to a decrease (increase) of Sahelian(Sudano-Guinean) convergence and southward (northward)displacement of the ITCZ. Moreover, TSA leads Sahelrainfall by ~2–5 years (Figure 7b2). According to earlierstudies [Allen and Smith, 1994; Mehta and Delworth, 1995;Moron, 1997; Giannini et al., 2003; Tourre et al., 2010],the TNA-TSA and Sahel rainfall relationship reveals anin-phase coherence pattern at the quasi-decadal time scale(Figure 7d2). The SST signal leads Sahel rainfall variabilityby ~2–4 years (Figure 7c2). Such fluctuations of thethermal gradient over the tropical Atlantic region are thuslikely to drive monsoon flow variations and to the deve-lopment of an equatorial westerly jet around 850–700 hPa,
in agreement with the northward/southward shift of theITCZ (Figures 4–6).[37] Quasi-decadal fluctuations (~12–20 years) in the
Pacific Ocean have been significantly identified using spec-tral analyses [Torrence and Webster, 1999; Tourre et al.,2001]. Some aspects of these fluctuations have been modeled[Pierce et al., 2001; Qiu, 2003] and fully described in Whiteet al. [2003] and Tourre et al. [2005]. Its characteristics canbe seen as an amplitude modulation of El Niño–SouthernOscillation events [Tourre et al., 2005]. QDV of PacificSST (NIÑO 3.4) leads Sahel rainfall from 4 to 7 years(Figure 7d2) but is significant regarding the random phasetest (correlation [r] = 0.3267> probability at the 95 % level[p] = 0.1605). The African/Pacific teleconnection is probablymodulated by fluctuations affecting the Pacific region versusthe Atlantic modes of variability: this changes SST anoma-lies and modifies the frequency/intensity of atmosphericwaves over African regions. According to Wang [2001], theNIÑO-like pattern could be associated with a decrease ofthe Walker circulation over the Indian and an eastward shiftof the Pacific overturning cell (Figure 6c). Such inducedanomalies would likely to drive an increase of subsidenceover the equatorial Atlantic up to western Sahel (reducingthe QDV signal in western Sahel rainfall) in agreement withMohino et al. [2011] (Figure 6c).
8. Discussion and Conclusion
[38] The quasi-decadal time scale is detected, and zonalcontrasts in Sahel rainfall are displayed. Western Sahel rain-fall shows high-variance QDV in the 1950s–1960s, whileeastern Sahel rainfall reveals high-amplitude QDV in the1970s–1980s. This quasi-decadal rainfall variability is con-sistent with the Sahel rainy season in eastern Sahel but isexpressed from August to October in western Sahel.[39] Across the quasi-decadal time scales, time periods of
high QDV variance in both western and eastern Sahel rainfallare examined through quasi-decadal WAM anomalies. In the1950s and 1960s, quasi-decadal anomalies of WAM are lo-cated over the western part of West Africa and eastward toLake Chad. This pattern, however, is not widely known sinceit can only be related to the North Atlantic SST. Moreover,during this period, inconsistencies in the results usingNNR-1 and 20CR show the relative weakness in the resultsbefore 1968, especially over the eastern region. Some consis-tent quasi-decadal anomalies are nonetheless identified inboth reanalyses over the western side of West Africa. Thekey features of the 1950s–1960s quasi-decadal anomalies inthe wet period are (1) an enhancement of a low- to middle-level northeasterly flux and southward/northward variationsof the ITCZ, (2) an enhancement of moisture convergenceover the western Sahel, (3) a decrease (increase) of southern(northern) subtropical sinking motions, and (4) as shown inNNR-1, an increase of rising motions above 900 hPa and at-mospheric moisture advected from the north over the westernSahel. However, the latter should be checked by analysis ofquasi-decadal signals using observed upper air data beforethe 1960s following Stickler and Brönimann [2010, 2011],or with atmospheric general circulation model (AGCM)ensemble forced by retrospective SSTs. It should also benoted that these observations must systematically integratesynoptic-, annual-, and interannual-scale interactions since,
DIEPPOIS ET AL.: QUASI-DECADAL VARIABILITY AND THE WAM
11

physically, most of the atmospheric moisture is contained inthe monsoon flow.[40] In the 1970–1980 wet life cycles, through NNR-1 and
20CR, a strengthening of both cross-equatorial Atlantic SSTand pressure gradient can be related to an enhancement ofmonsoon flow up to the midtroposphere (850–700 hPa) andto moisture convergence, especially over eastern Sahel, there-fore implying a northward shift of the ITCZ. Such patternsseem similar to the anomalous inertial instability involved inthe development of the African Westerly Jet [Nicholsonand Webster, 2007], which could therefore play a role at thequasi-decadal time scale. AEJ speed variations could also besupported by the observed zonal circulation anomalies.Nevertheless, the combination of meridional gradients of soilmoisture and vegetation properties (including albedo) is alsocrucial for generating and maintaining the AEJ [Cook, 1999;Wu et al., 2009]. In this period, the Pacific SSTs could alsoplay a key role in driving the quasi-decadal anomalies ofSahel rainfall. The NIÑO-like pattern can probably be associ-ated with the decrease of the Walker circulation over theIndian Ocean and of the eastward shift of the Pacific risingbranch. These fluctuations can contribute to an increase ofsubsidence over the equatorial Atlantic up to the western sideof the African continent, hence the low QDV in western Sahelrainfall. Another important aspect of 1970s–1980s anomaliesis the decrease of easterly wind components at TEJ levelsand the associated divergence in the high troposphere. Thissuggests a reduction of the deep wet convection activity overWAM and in the Indian monsoon region, although this cannotbe proved here [Sathiyamoorthy et al., 2007].[41] This study explores the Sahel rainfall decadal variabil-
ity and its associations with zonal contrasts through an inves-tigation of decadal WAM variability and SST forcing. Asdescribed by Jury [2010], the interaction of Walker andHadley cells over Africa appears to be a key feature thatmodulates climate at decadal frequency through anomalousnorth-south displacement of the near-equatorial trough.However, SST forcing is not the only factor impacting bothdecadal variability of Sahel rainfall and WAM. Atmosphericinternal variability [Caminade and Terray, 2010], globalwarming [Paeth and Hense, 2004], and vegetation feedbackprocesses [Zeng et al., 1999] may also contribute substantiallyto driving decadal to multidecadal rainfall variability. Infact, upcoming investigations will be based on sensitivityexperiments focusing on multiple factors and conducted withseveral AGCMs forced by SSTs such as in the second phaseof the West African Monsoon Modeling and Evaluation(WAMME-2) project [Xue et al., 2012].
[42] Acknowledgments. This study was conducted as part to theCORUS2 project entitled “Impact de la pression anthropique et duchangement global sur les flux sédimentaires en zone sahélienne” (grant6116) supported by the French Institute of Research for Development(Institut de Recherche pour le Développement, IRD). This topic has been acontribution to the AMEDE (Analyse Multi-Echelle de la DynamiqueEolienne au Sahel) action based on the FED 4116 SCALE (TEQQ project)supported by the Upper Normandy region (France), as well as US NSFAGS-1115506. The authors are also grateful to Pr. Mathieu Rouault for hishelpful friendly review of the manuscript.
ReferencesAllen, M. R., and L. A. Smith (1994), Investigating the origins and signifi-cance of low-frequency modes of climate variability, Geophys Res Lett,21, 883–886.
African Monsoon and Multidisciplinary Analyses International ScientificSteering Committee (AMMA ISSC) (2005), The international scienceplan for AMMA. http://www.amma.mediasfrance.org/library/docs/AMMA_ISP_May2005.pdf.
Bader, J., and M. Latif (2003), The impact of decadal-scale Indian Ocean seasurface temperature anomalies on Sahelian rainfall and the North AtlanticOscillation,Geophys. Res. Lett., 30(22), 2169, doi:10.1029/2003GL018426.
Burpee, R. W. (1972), The origin and structure of easterly waves in the lowertroposphere of North Africa, J. Atmos. Sci., 29, 77–-90.
Camberlin, P., S. Janicot, and I. Poccard (2001), Seasonality and atmosphericdynamics of teleconnection between African and tropical sea-surface tem-perature: Atlantic vs. ENSO, Int. J. Climatol., 21, 973–1005.
Caminade, C., and L. Terray (2010), Twentieth century Sahel rainfall vari-ability as simulated by the ARPEGE AGCM, and futures changes, Clim.Dyn., 35, 75–94.
Compo, G. P., et al. (2011), The Twentieth Century Reanalysis Project,Q. J.R. Meteorol. Soc., 137, 1–28.
Cook, K. H. (1999), Generation of the African easterly jet and its role indetermining West African precipitation, J. Clim., 12, 1165–1184.
Dai, A., P. J. Lamb, K. E. Trenberth,M.Hulme, P. D. Jones, and P. Xie (2004),The recent Sahel drought is real, Int. J. Climatol., 24, 1323–1331.
Ebisuzaki, W. (1997), A method to estimate the statistical significance of acorrelation when the data are serially correlated, J. Clim., 10, 2147–2153.
Folland, C. K., T. N. Palmer, and D. E. Parker (1986), Sahel rainfall world-wide sea temperatures, 1901-85, Nature, 320, 602–606.
Fontaine, B., S. Janicot, and V.Moron (1995), Rainfall anomaly patterns andwind field signals over West Africa in August (1958-1989), J. Clim., 8,1503–1510.
Fontaine, B., P. Roucou, M. Gaetani, and R. Marteau (2011a), Recentchanges in precipitations, ITCZ convection and northern tropical circula-tion over North Africa (1979-2007), Int. J. Climatol., 31, 633–648.
Fontaine, B., P. Roucou, and P. A. Monerie (2011b), Changes in the Africanmonsoon region at medium-term time horizon using 12 AR4 coupledmodels under the A1b emissions scenario, Atmos. Sci. Lett., 12, 83–88.
Fontaine, B., M. Gaetani, A. Ullman, and P. Roucou (2011c), Time evolutionof observed July-September sea surface temperature-Sahel climateteleconnection with removed quasi-global effect (1900-2008), J. Geophys.Res., 116, D041105, doi:10.1029/2010JD014843.
Giannini, A., R. P. Saravannan, and P. Chang (2003), Ocean forcing of Sahelrainfall on interannual to interdecadal time scales, Science, 302, 1027–1030.
Grist, J. P., and S. E. Nicholson (2001), A study of the dynamical factorsinfluencing the interannual variability of rainfall in the West AfricanSahel, J. Clim., 14, 1337–1359.
Hagos, S. M., and K. H. Cook (2008), Ocean warming and late-twentiethcentury Sahel drought and recovery, J. Clim., 21, 3797–3814.
Janicot, S. (1992), Spatio-temporal variability of West African rainfall. PartI: Regionalizations and typings, J. Clim., 5, 489–497.
Joly, M., and A. Voldoire (2010), Role of the Gulf of Guinea in the inter-an-nual variability of the West African monsoon: What do we learn fromCMIP3 coupled simulations, Int. J. Climatol., 30, 1843–1856.
Joly, M., A. Voldoire, H. Douville, P. Terray, and J.-F. Royer (2007),African monsoon teleconnections with tropical SSTs: Validation andevolution in a set of IPCC4 simulations, Clim. Dyn., 29, 1–20.
Jury, M. K. (2010), Ethiopian decadal climate variability, Theor. Appl.Climatol., 101, 29–40.
Kalnay, E., et al. (1996), The NCEP/NCAR 40-year reanalysis project, Bull.Am. Meteorol. Soc., 77, 437–471.
Le Barbé, L., and T. Lebel (1997), Rainfall climatology of the HAPEX-Sahelregion during the years 1950-1990, J. Hydrol., 189, 43–73.
Lebel, T., and A. Ali (2009), Recent trends in the Central and Western Sahelrainfall regime 1990-1997, J. Hydrol., 375, 52–64.
Leroux, S., and N. M. J. Hall (2009), On the relationship between AfricanEasterly Waves and the African Easterly Jet, J. Atmos. Sci., 66,2303–2316.
Losada, T., B. Rodriguez-Fonseca, I. Polo, S. Janicot, S. Gervois, F. Chauvin,and P. Ruti (2009), A multimodel approach to the Atlantic equatorial mode:Impact on the West African monsoon, Clim. Dyn., 35, 29–43.
Maraun, D., and J. Kurths (2004), Cross wavelet analysis: Significance test-ing and pitfalls, Non Linear Processes Geophys., 11, 505–514.
Martin, E. R., C. D. Thorncroft, and B. Booth (2013), The multi-decadalAtlantic SST-Sahel rainfall teleconnection in CMIP5 simulations,J. Clim., doi:10.1175/JCLI-D-13-00242.1, in press.
Mathon, V., and H. Laurent (2001), Life cycle of Sahelian mesoscale con-vective cloud systems, Q. J. R. Meteorol. Soc., 127, 377–406.
Mehta, V. M., and T. Delworth (1995), Decadal variability of the tropicalAtlantic Ocean surface temperature in shipboard measurements and inglobal ocean-atmosphere model, J. Clim., 8, 172–190.
Mohino, E., S. Janicot, and J. Bader (2011), Sahel rainfall and decadalto multi-decadal sea surface temperature variability, Clim. Dyn., 37,419–440.
DIEPPOIS ET AL.: QUASI-DECADAL VARIABILITY AND THE WAM
12
Mohr, K. I., and C. D. Thorncroft (2006), Intense convective systems inWest Africa and their relationship to the Africa easterly jet, Q. J. R.Meteorol. Soc., 132, 163–176.
Monerie, P. A., P. Roucou, and B. Fontaine (2012), Mid-century effects ofClimate Change on African monsoon dynamics using the A1B emissionscenario, Int. J. Climatol., online doi:10.1002/joc.3476.
Moron, V. (1997), Trend, decadal and interannual variability in annualrainfall of subequatorial and tropical North Africa (1900-1994), Int. J.Climatol., 17, 785–805.
Newell, R. E., and J.W. Kidson (1984), Africanmean wind changes betweenSahelian wet and dry periods, J. Clim., 4, 27–33.
Nicholson, S. E., and P. J. Webster (2007), A physical basis for theinterannual variability of rainfall in the Sahel,Q. J. R. Meteorol. Soc., 133,2065–2084.
Paeth, H., and A. Hense (2004), SST versus climate change signals in WestAfrican rainfall: 20th century variations and future projections, Clim.Change, 65, 179–208.
Percival, D. B., and A. T. Walden (2000), Wavelet Methods for Time SeriesAnalysis, Cambridge Univ. Press, Cambridge, UK.
Peyrille, P., J. P. Lafore, and J. L. Redelsperger (2007), An idealized two-dimensional framework to study the West African monsoon. Part I:Validation and key controlling factors, J. Atmos. Sci., 64, 2765–2782.
Pierce, D. W., T. P. Barnett, R. Schneider, R. Saravanan, D. Domenguet, andM. Latif (2001), The role of ocean dynamics in producing decadal climatevariability in the North Pacific, Clim. Dyn., 18, 51–70.
Polo, I., B. Rodriguez-Fonseca, T. Losada, and J. Garcia-Serrano (2008),Tropical Atlantic variability modes (1979–2002). Part I: Time-evolvingSST modes related to West African rainfall, J. Clim., 21, 6457–6475.
Qiu, B. (2003), Kuroshio extension variability and forcing of Pacific decadaloscillations: Responses and potential feedback, J. Phys. Oceanogr., 33,2465–2482.
Redelsperger, J. L., A. Diongue, A. Diedhiou, J. P. Ceron, M. Diop,J. F. Gueremy, and J. P. Lafore (2002), Multi-scale description of aSahelian synoptic weather system representative of the West Africanmonsoon, Q. J. R. Meteorol. Soc., 128, 1229–1257.
Reed, R., D. Norquist, and E. Recker (1977), The structure and properties ofAfrican wave disturbances as observed during Phase III of GATE, Mon.Weather Rev., 105, 317–333.
Rodwell, M. J., and B. J. Hoskins (1996), Monsoons and the dynamics of de-serts, Q. J. R. Meteorol. Soc., 122, 1385–1404.
Sathiyamoorthy, V., P. K. Pal, and P. C. Joshi (2007), Intraseasonnal vari-ability of the Tropical Easterly Jet, Meteorol. Atmos. Phys., 96, 305–316.
Smith, T. M., R. W. Reynolds, T. C. Peterson, and J. Lawrimore (2008),Improvements to NOAA’s historical merged land-ocean surface tempera-ture analysis (1880-2006), J. Clim., 13, 538–549.
Stickler, S., and S. Brönnimann (2010), Wind bias of the NCEP/NCAR andTwentieth Century Reanalyses over the West African and Asian MonsoonRegions during the years 1940-1957, ECAC/EMS annual meeting. Zürich,CH, 13-17 September 2010.
Stickler, S., and S. Brönnimann (2011), Significant bias of the NCEP/NCARand Twentieth Century Reanalyses relative to pilot balloon observationsover the West African monsoon region (1940-57), Q. J. R. Meteorol.Soc., 137, 1400–1416.
Thomas, R. A., and P. J. Webster (1997), The role of inertial instability in de-termining the location and strength of near-equatorial convection, Q. J. R.Meteorol. Soc., 123, 1445–1482.
Thorncroft, C. D., H. Nguyen, C. Zhang, and P. Peyrillé (2011), Annual cy-cle of the West African monsoon: Regional circulations and associatedwater vapour transport, Q. J. R. Meteorol. Soc., 137, 129–147.
Torrence, C., and G. P. Compo (1998), A practical guide to wavelet analysis,Bull Am. Soc Metrol Soc, 79, 61–78.
Torrence, C., and P. Webster (1999), Interdecadal changes in the ENSO-monsoon system, J. Clim., 12, 2,679–2,690.
Tourre, Y. M., B. Rajagopalan, Y. Kushnir, M. Barlow, and W. B. White(2001), Patterns of coherent ocean decadal and interdecadal climate sig-nals in the Pacific Basin during the 20th century, Geophys Res Lett, 28,2069–2072.
Tourre, Y. M., C. Cibot, L. Terray, W. B. White, and B. Dewitte(2005), Quasi-decadal and interdecadal climate fluctuations in the PacificOcean from CGCM. Geophys Res Lett, 32, L07710, doi:10.1029/2004GL022087.
Tourre, Y. M., S. Paz, Y. Kushnir, and B. White (2010), Low-frequencyclimate variability in the Atlantic basin during the 20th century, Atmos.Sci Lett, 11, 180–185.
Wang, C. (2001), Atmospheric circulation cells associated with the El Niño-Southern Oscillation, J. Clim., 15, 399–419.
Ward, N. M. (1998), Diagnosis and short-lead time prediction of summerrainfall in tropical North Africa at interannual andmultidecadal timescales,J. Clim., 11, 3167–3191.
White, W. B., Y. M. Tourre, M. Barlow, and M. Dettinger (2003), A delayedaction oscillator shared by biennial, interannual, and decadal signals in thePacific Basin, J. Geophys. Res., 108(C3), 3070, doi:10.1029/2002JC001490.
Wu, Z., and N. E. Huang (2009), Ensemble empirical mode decomposition:A noise-assisted data analysis method, AADA, 1, 1–41.
Wu, M. L., O. Reale, S. D. Schubert, M. J. Suarez, R. D. Koster, andP. J. Pegion (2009), African easterly jet: Structure and maintenance,J. Clim., 22, 4459–4480.
Xue, Y., K. M. W. Lau, L. Boone, I. Druyan, S. Seidou, and WAMME team(2012), Evaluation of West African Monsoon processes and feedback:Second WAMME (West African Monsoon Modeling and EvaluationProject) Experiment. 4th AMMA International Conference. Toulouse,FRA, 2-6 July 2012.
Zeng, N., J. D. Neelin, K. M. Lau, and C. J. Tucker (1999), Enhancements ofinterdecadal climate variability in the Sahel by vegetation interaction,Science, 286, 1537–1540.
Zhang, R., and T. L. Delworth (2006), Impact of Atlantic multidecadal oscil-lations on India/Sahel rainfall and Atlantic hurricanes, Geophys Res Lett,33, L17712, doi:10.1029/2006GL026267.
DIEPPOIS ET AL.: QUASI-DECADAL VARIABILITY AND THE WAM
13