quasi-static compression properties of bamboo and pvc …
TRANSCRIPT
polymers
Article
Quasi-Static Compression Properties of Bamboo and PVC TubeReinforced Polymer Foam Structures
J. J. N. Amelia 1, M. Y. M. Zuhri 1,2,* , Z. Leman 1 , N. I. Zahari 1, A. As’arry 3 and R. A. Ilyas 4,5
�����������������
Citation: Amelia, J.J.N.; Zuhri,
M.Y.M.; Leman, Z.; Zahari, N.I.;
As’arry, A.; Ilyas, R.A. Quasi-Static
Compression Properties of Bamboo
and PVC Tube Reinforced Polymer
Foam Structures. Polymers 2021, 13,
3603. https://doi.org/10.3390/
polym13203603
Academic Editor: Emanoil Linul
Received: 30 September 2021
Accepted: 13 October 2021
Published: 19 October 2021
Publisher’s Note: MDPI stays neutral
with regard to jurisdictional claims in
published maps and institutional affil-
iations.
Copyright: © 2021 by the authors.
Licensee MDPI, Basel, Switzerland.
This article is an open access article
distributed under the terms and
conditions of the Creative Commons
Attribution (CC BY) license (https://
creativecommons.org/licenses/by/
4.0/).
1 Advanced Engineering Materials and Composites Research Centre, Department of Mechanical andManufacturing Engineering, Faculty of Engineering, Universiti Putra Malaysia, Serdang 43400, Malaysia;[email protected] (J.J.N.A.); [email protected] (Z.L.); [email protected] (N.I.Z.)
2 Laboratory of Biocomposite Technology, Institute of Tropical Forestry and Forest Product (INTROP),Universiti Putra Malaysia, Serdang 43400, Malaysia
3 Department of Mechanical and Manufacturing Engineering, Faculty of Engineering, Universiti PutraMalaysia, Serdang 43400, Malaysia; [email protected]
4 School of Chemical and Energy Engineering, Faculty of Engineering, Universiti Teknologi Malaysia, UTM,Johor Bahru 81310, Malaysia; [email protected]
5 Centre for Advanced Composite Materials (CACM), Universiti Teknologi Malaysia, UTM, Johor Bahru 81310,Malaysia
* Correspondence: [email protected]
Abstract: In recent years, there has been a growing interest for composite materials due to thesuperior capability to absorb energy and lightweight factor. These properties are compatible to beutilized in the development for transportation system as it can reduce the fuel consumption andalso minimize the effect of crash to the passenger. Therefore, the aim for this project is to study thecompression strength and energy absorbing capability for Polyvinyl chloride (PVC) and bambootubes reinforced with foam. Several parameters are being considered, these being the effect of singleand multiple tube reinforced foam structure, foam density, diameter of the tube as well as effect ofdifferent crosshead speed. The results showed that increasing the relative foam density will led to anincrease in the compression strength and specific energy absorption (SEA) values. Furthermore, asignificant increase of compression strength can be seen when several tubes are introduced into thefoam while SEA remained almost the same. Finally, the influence of crosshead below 20 mm/mindid not vary significantly for both compression strength and SEA.
Keywords: compression strength; foam; specific energy absorption; tube
1. Introduction
An energy absorbent structure can be a structure that exchanges half or all of themechanical energy into another sort of energy. The energy recover will either be reversiblesimilarly in the case of elastic strain energy in solids or it will be irreversible like plasticdissemination of energy related with lasting distortion of the strong structure. Energyabsorbing structure design and analysis differ significantly from standard structural designand analysis. Energy absorbing structures must withstand high impact loads due to thecomplicated deformation and failure by significant geometry changes, strain hardeningeffects, strain-rate effects, and interactions between distinct deformation modes includingbending and stretching [1]. There are several types of sandwich cores that have been studiedin recent years. The determination for the core material and its design are crucial and mightbe vary depending on the application. In addition, structural elements are inserted intothe core structures such as foams and honeycombs to modify mechanical properties of thesandwich structures such as core compression strength, buckling instability and in-planeshear [2]. In typical structural applications, the thickness of the face sheet rarely exceedsseveral millimetres, whereas the thickness of core can be over 50 mm [3]. In a study byColloca et al. [4] they have reported that the compressive modulus of the foam (Divinycell
Polymers 2021, 13, 3603. https://doi.org/10.3390/polym13203603 https://www.mdpi.com/journal/polymers

Polymers 2021, 13, 3603 2 of 14
PVC) increases as the relative density of the foam increases, but the densification straindecreases. Also, a comparison of absorbed energy shows that the energy absorption duringcompression process rise up to 600% more than under tension due to greater strain value.
To develop crashworthy structures, tubular structures have been commonly usedin the design of tube reinforced foam structure. The most frequent and oldest type offoldable energy absorber is thin tubes. When a thin-walled steel tube is subjected to anaxial compressive load, it can generate either a concertina (axisymmetric buckle) or adiamond (non-axisymmetric buckle). A concertina deformation mode is most efficientenergy absorbing mode [5]. Khan et al. [6] explained that failure mode for thin wallcylindrical composite tube can be divided into three modes; (1) mushrooming failure,(2) brittle fracture of the composite tube and (3) increasing folding and hinging. In addition,the energy absorbing capacity is highest at the first mode, medium at third mode and theleast at second mode. Zuhri et al. [7] examined the energy absorbing properties of bamboo-based structure by conducting quasi-static and dynamic tests. According to the data, theenergy absorbing capability of individual bamboo tubes increases when the diameter-to-thickness ratio (D/t) decreases. Also, the small diameter of bamboo tubes showed morenoticeable crushing than the larger size. A study from Zhou et al. [8] suggested that byembedding tubes in a foam panel, it will influence the failure process within the compositetubes by significantly improving their ability to absorb energy. However, the SEA values ofthe hybrid tube reinforced foams were found to be insensitive to variations in foam density.It is important to note that tube-based foams have a larger energy-absorbing capacity thanmany comparable core systems, emphasising its potential for usage in extreme crushingsituations. In a study conducted by Alhawamdeh et al. [9] shows that the failure modeof the axially loaded hollow pultruded fibre-reinforced polymer (PFRP) profiles varieddepending on their cross-sectional shape. The hollow box profiles are dominated by localbuckling of the walls, whereas the hollow circular profiles dominated by compressive andshear failure at the profiles ends. The results stated that the hollow circular PFRP profiles,the failure mode is the same for all length-to-width (L/D) ratios.
This paper introduces a new combination structure for the purpose to enhance anenergy absorption of the current foam structure. Attention is focused on understandingthe energy absorbing characteristics of single and multiple tubes reinforced foam structureunder quasi-static loading conditions.
2. Materials and Methods2.1. Material
Two types of crosslinked PVC foams with different densities are used in this study,which are Divinycell F50 and Divinycell HP80 foams with a density of 50 kg/m3 and80 kg/m3, respectively. The foams are supplied by DiabGroup and comes in the shapeof flat panel, which are color-coded to differentiate the foam type and both are havingthickness of 20 mm. The selected tubes are Polyvinyl chloride (PVC) and eco-friendlybamboo tube. The commercial PVC tubes used are round conduit where it is mainly usedfor construction, electrical, etc. Two different sizes of tubing are selected, where the outerdiameters (Do) are 20 mm and 25 mm. Then, it is cut into 20 mm length to ensure it havingthe same height as the foam. The length of the specimen is similar to work conducted byAlia et al. [10] and Cinar [2]. On the other hand, bamboo tubes used are readily availablein the laboratory and it is light brown in colour. This bamboo is originally used to create abeautiful garden edging and is chosen due to their highly versatile natural resource thatis easily to sustained and eco-friendly. The selection of Do for the bamboo tube is basedon diameter size that is close to 25 mm, due to it is not uniform in nature. Prior to testing,the tubes are cut into 20 mm length (similar reason as for PVC tube) using the circularsaw from the internode parts of the bamboo. It is known that the diameter of the nodepart is slightly larger than the internode part and can affect the structural performance, asinvestigated by Molari et al. [11]. However, in this study, the node is not considered to
Polymers 2021, 13, 3603 3 of 14
ensure the insertion tube having an interference fit to the foam. The physical properties ofthe tested tubes are shown in Table 1.
Table 1. Physical properties of PVC and Bamboo tubes.
Tube Outer Diameter, Do (mm) Inner Diameter, Di (mm) Thickness(mm)
Di/tRatio
PVC 20 20 17 1.5 11.3PVC 25 25 21 2.0 10.5Bamboo 25 18 3.5 5.1
2.2. Fabrication and Mechanical Testing
Initially, foam thickness of 20 mm is cut into block of square with a dimension of50 × 50 mm. Then, a hole is formed using circular drill at the centre of the foam to allowan identical size of tube to be inserted. Single tube-reinforced foam samples are designedby embedding a 20 mm long PVC and bamboo tubes into the Divinycell F50 and HP80foam. In addition, for multiple tubes, the size of the square block is double than the singletube and using the same method as for single tube. Figure 1 shows the illustration andsample of the structure (the unit is in mm).
Polymers 2021, 13, x FOR PEER REVIEW 3 of 14
slightly larger than the internode part and can affect the structural performance, as
investigated by Molari et al. [11]. However, in this study, the node is not considered to
ensure the insertion tube having an interference fit to the foam. The physical properties of
the tested tubes are shown in Table 1.
Table 1. Physical properties of PVC and Bamboo tubes.
Tube Outer Diameter, Do (mm) Inner Diameter, Di (mm) Thickness (mm) Di/t
Ratio
PVC 20 20 17 1.5 11.3
PVC 25 25 21 2.0 10.5
Bamboo 25 18 3.5 5.1
2.2. Fabrication and Mechanical Testing
Initially, foam thickness of 20 mm is cut into block of square with a dimension of 50
× 50 mm. Then, a hole is formed using circular drill at the centre of the foam to allow an
identical size of tube to be inserted. Single tube-reinforced foam samples are designed by
embedding a 20 mm long PVC and bamboo tubes into the Divinycell F50 and HP80 foam.
In addition, for multiple tubes, the size of the square block is double than the single tube
and using the same method as for single tube. Figure 1 shows the illustration and sample
of the structure (the unit is in mm).
(a)
(b)
Figure 1. Dimension and positioning for (a) single tube and (b) multiple tube reinforced foam
structure.
Later, a series of axial quasi-static compression testing is performed using Universal
Testing Machine Instron model 3382 with a load cell of 100 kN as shown in Figure 2. Each
of the specimens are tested at a constant crosshead speed of 2 mm/min. For this purpose,
compression test is carried out in accordance to ASTM C365 [12]. For each of the test
configurations, three specimens are replicated.
Figure 1. Dimension and positioning for (a) single tube and (b) multiple tube reinforced foamstructure.
Later, a series of axial quasi-static compression testing is performed using UniversalTesting Machine Instron model 3382 with a load cell of 100 kN as shown in Figure 2. Eachof the specimens are tested at a constant crosshead speed of 2 mm/min. For this purpose,compression test is carried out in accordance to ASTM C365 [12]. For each of the testconfigurations, three specimens are replicated.

Polymers 2021, 13, 3603 4 of 14Polymers 2021, 13, x FOR PEER REVIEW 4 of 14
Figure 2. Quasi-static compression testing of specimen.
The specimen is axially crushed between the parallel steel flat platens by placing it
on the bottom platen. The crosshead is then lowered until the specimen come into touched
with the surface of the top platen. The quasi-static tests are continued until it reaches a
compaction point where the curve begins to rise up steeply after completing the sustained
crushing [13]. For analysis purposes, the mechanism of failures is monitored, and the
deformation process images are taken throughout the tests. The load-displacement raw
data is used to determine the compression strength and specific energy absorption
characteristics of the structures. Finally, the multiple tubes reinforced foam structures also
being tested using different crosshead speed of 5 and 20 mm/min. Prior to testing the
specimens, each specimen is labelled with a code for easily identification. Table 2 shows
the code used for single and multiple tube reinforced foam structures.
Table 2. Code used for the tube reinforced foam structures.
Type of Specimen Code
Foam Tube Single Multiple
F50 Bamboo Ø 25 mm FBS FBM
F50 PVC Ø 20 mm FSS FSM
F50 PVC Ø 25 mm FLS FLM
HP80 Bamboo Ø 25 mm HBS HBM
HP80 PVC Ø 20 mm HSS HSM
HP80 PVC Ø 25 mm HLS HLM
3. Results and Discussion
3.1. Compressive Behaviour of Foam Material
A typical stress-strain curves following quasi-static test on the F50 and HP80 foam is
shown in Figure 3. There are three phases during the compression process. Initially, in the
elastic regime, the material response is roughly linearly occurred up to approximately 4%
strain and near to the yield point where the elastic response ends. This is following the
Hooke’s law, which stated that the strain is proportionate to the applied stress. Next, at
the beginning of the crushing regime, a constant plateau stress is forming after the first
substantial deviation from the linear regime. Finally, the densification regime begins
where the force increases drastically with little deformation. This illustrates on how the
foam materials have unique properties such as the ability to deform extensively while
sustaining modest amounts of stress before reaching the densification regime [1,14].
Finally, the plateau region gradually ends as stiffening occurs when the cell walls
collapse and started to interact with the neighbouring cell walls of the foam. This
continuous interaction condition results in a rapidly increasing strain where the
Figure 2. Quasi-static compression testing of specimen.
The specimen is axially crushed between the parallel steel flat platens by placingit on the bottom platen. The crosshead is then lowered until the specimen come intotouched with the surface of the top platen. The quasi-static tests are continued until itreaches a compaction point where the curve begins to rise up steeply after completing thesustained crushing [13]. For analysis purposes, the mechanism of failures is monitored,and the deformation process images are taken throughout the tests. The load-displacementraw data is used to determine the compression strength and specific energy absorptioncharacteristics of the structures. Finally, the multiple tubes reinforced foam structures alsobeing tested using different crosshead speed of 5 and 20 mm/min. Prior to testing thespecimens, each specimen is labelled with a code for easily identification. Table 2 showsthe code used for single and multiple tube reinforced foam structures.
Table 2. Code used for the tube reinforced foam structures.
Type of Specimen Code
Foam Tube Single MultipleF50 Bamboo Ø 25 mm FBS FBMF50 PVC Ø 20 mm FSS FSMF50 PVC Ø 25 mm FLS FLM
HP80 Bamboo Ø 25 mm HBS HBMHP80 PVC Ø 20 mm HSS HSMHP80 PVC Ø 25 mm HLS HLM
3. Results and Discussion3.1. Compressive Behaviour of Foam Material
A typical stress-strain curves following quasi-static test on the F50 and HP80 foam isshown in Figure 3. There are three phases during the compression process. Initially, in theelastic regime, the material response is roughly linearly occurred up to approximately 4%strain and near to the yield point where the elastic response ends. This is following theHooke’s law, which stated that the strain is proportionate to the applied stress. Next, atthe beginning of the crushing regime, a constant plateau stress is forming after the firstsubstantial deviation from the linear regime. Finally, the densification regime begins wherethe force increases drastically with little deformation. This illustrates on how the foammaterials have unique properties such as the ability to deform extensively while sustainingmodest amounts of stress before reaching the densification regime [1,14].
Polymers 2021, 13, 3603 5 of 14
Polymers 2021, 13, x FOR PEER REVIEW 5 of 14
densification take place at 70 to 80% strain. It is also can be seen that an increase in density
will also increase the compressive strength and the SEA. For example, an increase in
density from 50 to 80 kg/m3 resulted in 71% increase in the compressive strength. The
values obtained from the experimental testing is summarised in Table 3.
Figure 3. Stress-strain curves of F50 and HP80 foam.
Table 3. Compression properties of foam.
Foam Density
(kg/m3)
Compressive
Load (kN)
Compressive
Strength (MPa)
Compressive
Modulus (MPa) SEA (kJ/kg)
F50 50 1.76 0.70 26.45 7.89
HP80 80 2.99 1.20 29.66 9.46
3.2. Compression Behaviour of Single Tube
In Figure 4, the load-displacement curves present the behaviour of PVC and bamboo
tubes. As for PVC tubes, identical traces of compressive force applied is observed, where
the force rose until it reached a point before the tube wall buckled and formed a fold due
to interpenetration collapsed. The development of the first fold in the PVC tube occurred
at the same time that the initial peak force is obtained. Following this, the two sections of
formation plastic hinges at cell wall junctions are compacted together while folding
process continued to occur. Compaction of the PVC tube would typically cause to increase
the load as the curve displayed a second peak. However, folding process will weaken the
PVC tubes which causes the load to drop after second peak until the tube is fully
compacted as shown in Figure 5a,b. Khan et al. [6] suggested that compaction and
delamination can be happened at the same time, where they balanced each other out
which yielding in a relatively sustained crushed until reached the densification point.
Similarly for the individual bamboo tube, during the crushing process of the bamboo
tube, the tube wall did not fail as in PVC tube, this is due to the bamboo has higher
stiffness compared to PVC. The longitudinal fractures of bamboo developed when the
load exerted on the tube resulting in tube wall separated into several part as shown in
Figure 5a’–e’ or Figure 6c. Thus, this event further clarifies why the second peak did not
occur for bamboo tube as in the case with the PVC tube.
0.0
0.5
1.0
1.5
2.0
2.5
3.0
0.0 0.1 0.2 0.3 0.4 0.5 0.6 0.7 0.8 0.9 1.0
Str
ess
(MP
a)
Strain
F50
HP80
Figure 3. Stress-strain curves of F50 and HP80 foam.
Finally, the plateau region gradually ends as stiffening occurs when the cell wallscollapse and started to interact with the neighbouring cell walls of the foam. This contin-uous interaction condition results in a rapidly increasing strain where the densificationtake place at 70 to 80% strain. It is also can be seen that an increase in density will alsoincrease the compressive strength and the SEA. For example, an increase in density from50 to 80 kg/m3 resulted in 71% increase in the compressive strength. The values obtainedfrom the experimental testing is summarised in Table 3.
Table 3. Compression properties of foam.
Foam Density(kg/m3)
CompressiveLoad (kN)
CompressiveStrength (MPa)
CompressiveModulus (MPa) SEA (kJ/kg)
F50 50 1.76 0.70 26.45 7.89HP80 80 2.99 1.20 29.66 9.46
3.2. Compression Behaviour of Single Tube
In Figure 4, the load-displacement curves present the behaviour of PVC and bambootubes. As for PVC tubes, identical traces of compressive force applied is observed, wherethe force rose until it reached a point before the tube wall buckled and formed a fold dueto interpenetration collapsed. The development of the first fold in the PVC tube occurredat the same time that the initial peak force is obtained. Following this, the two sections offormation plastic hinges at cell wall junctions are compacted together while folding processcontinued to occur. Compaction of the PVC tube would typically cause to increase theload as the curve displayed a second peak. However, folding process will weaken the PVCtubes which causes the load to drop after second peak until the tube is fully compactedas shown in Figure 5a,b. Khan et al. [6] suggested that compaction and delamination canbe happened at the same time, where they balanced each other out which yielding in arelatively sustained crushed until reached the densification point.

Polymers 2021, 13, 3603 6 of 14Polymers 2021, 13, x FOR PEER REVIEW 6 of 14
Figure 4. Load-displacement curves for three types of tube.
0 mm 2 mm 4 mm 6 mm 12 mm
(a) (b) (c) (d) (e)
0 mm 2 mm 4 mm 6 mm 12 mm
(a’) (b’) (c’) (d’) (e’)
Figure 5. The compression modes at several displacement values of (a)–(e) PVC tube and (a’)–(e’)
Bamboo tube.
(a) (b) (c)
Figure 6. Shape of tube after deformation: (a) PVC Ø 20 (b) PVC Ø 25 and (c) Bamboo.
In comparison, the individual 25 mm diameter of PVC tube (D/t = 12.5) offer greater
compression strength compared to the 20 mm of PVC tube (D/t = 13.4) counterpart. It is
noted that the SEA value for 20 mm PVC tube is 7.74 kJ/kg which is less than 25 mm PVC
tube, that is 9.58 kJ/kg. With the increasing of D/t ratio, lower value in compressive
strength and the specific energy absorption have been recorded during the testing process.
In addition, the SEA value for bamboo tube (D/t = 4.82) is approximately 21.95 kJ/kg,
which is greater than both PVC tubes due to the lower diameter-to-thickness ratio as
suggested by [7]. In terms of compressive strength and modulus, the bamboo tube
0
5
10
15
20
25
30
0 2 4 6 8 10 12 14 16 18 20
Lo
ad (
kN
)
Displacement (mm)
PVC 20 mm
PVC 25 mm
Bamboo 25 mm
Figure 4. Load-displacement curves for three types of tube.
Polymers 2021, 13, x FOR PEER REVIEW 6 of 14
Figure 4. Load-displacement curves for three types of tube.
0 mm 2 mm 4 mm 6 mm 12 mm
(a) (b) (c) (d) (e)
0 mm 2 mm 4 mm 6 mm 12 mm
(a’) (b’) (c’) (d’) (e’)
Figure 5. The compression modes at several displacement values of (a)–(e) PVC tube and (a’)–(e’)
Bamboo tube.
(a) (b) (c)
Figure 6. Shape of tube after deformation: (a) PVC Ø 20 (b) PVC Ø 25 and (c) Bamboo.
In comparison, the individual 25 mm diameter of PVC tube (D/t = 12.5) offer greater
compression strength compared to the 20 mm of PVC tube (D/t = 13.4) counterpart. It is
noted that the SEA value for 20 mm PVC tube is 7.74 kJ/kg which is less than 25 mm PVC
tube, that is 9.58 kJ/kg. With the increasing of D/t ratio, lower value in compressive
strength and the specific energy absorption have been recorded during the testing process.
In addition, the SEA value for bamboo tube (D/t = 4.82) is approximately 21.95 kJ/kg,
which is greater than both PVC tubes due to the lower diameter-to-thickness ratio as
suggested by [7]. In terms of compressive strength and modulus, the bamboo tube
0
5
10
15
20
25
30
0 2 4 6 8 10 12 14 16 18 20
Lo
ad (
kN
)
Displacement (mm)
PVC 20 mm
PVC 25 mm
Bamboo 25 mm
Figure 5. The compression modes at several displacement values of (a)–(e) PVC tube and (a’)–(e’)Bamboo tube.
Similarly for the individual bamboo tube, during the crushing process of the bambootube, the tube wall did not fail as in PVC tube, this is due to the bamboo has higher stiffnesscompared to PVC. The longitudinal fractures of bamboo developed when the load exertedon the tube resulting in tube wall separated into several part as shown in Figure 5a’–e’ orFigure 6c. Thus, this event further clarifies why the second peak did not occur for bambootube as in the case with the PVC tube.
Polymers 2021, 13, x FOR PEER REVIEW 6 of 14
Figure 4. Load-displacement curves for three types of tube.
0 mm 2 mm 4 mm 6 mm 12 mm
(a) (b) (c) (d) (e)
0 mm 2 mm 4 mm 6 mm 12 mm
(a’) (b’) (c’) (d’) (e’)
Figure 5. The compression modes at several displacement values of (a)–(e) PVC tube and (a’)–(e’)
Bamboo tube.
(a) (b) (c)
Figure 6. Shape of tube after deformation: (a) PVC Ø 20 (b) PVC Ø 25 and (c) Bamboo.
In comparison, the individual 25 mm diameter of PVC tube (D/t = 12.5) offer greater
compression strength compared to the 20 mm of PVC tube (D/t = 13.4) counterpart. It is
noted that the SEA value for 20 mm PVC tube is 7.74 kJ/kg which is less than 25 mm PVC
tube, that is 9.58 kJ/kg. With the increasing of D/t ratio, lower value in compressive
strength and the specific energy absorption have been recorded during the testing process.
In addition, the SEA value for bamboo tube (D/t = 4.82) is approximately 21.95 kJ/kg,
which is greater than both PVC tubes due to the lower diameter-to-thickness ratio as
suggested by [7]. In terms of compressive strength and modulus, the bamboo tube
0
5
10
15
20
25
30
0 2 4 6 8 10 12 14 16 18 20
Lo
ad (
kN
)
Displacement (mm)
PVC 20 mm
PVC 25 mm
Bamboo 25 mm
Figure 6. Shape of tube after deformation: (a) PVC Ø 20 (b) PVC Ø 25 and (c) Bamboo.
Polymers 2021, 13, 3603 7 of 14
In comparison, the individual 25 mm diameter of PVC tube (D/t = 12.5) offer greatercompression strength compared to the 20 mm of PVC tube (D/t = 13.4) counterpart.It is noted that the SEA value for 20 mm PVC tube is 7.74 kJ/kg which is less than25 mm PVC tube, that is 9.58 kJ/kg. With the increasing of D/t ratio, lower value incompressive strength and the specific energy absorption have been recorded during thetesting process. In addition, the SEA value for bamboo tube (D/t = 4.82) is approximately21.95 kJ/kg, which is greater than both PVC tubes due to the lower diameter-to-thicknessratio as suggested by [7]. In terms of compressive strength and modulus, the bamboo tubedominates the response of axial compression loading as shown in Figure 4. The failuredeformation of the PVC and bamboo tubes are photographed in Figures 5 and 6.
3.3. Single Tube Reinforced Foam Structures
A series of tests are undertaken to characterize the energy-absorbing behaviour of thesingle-tube reinforced foam structure. Figure 7 shows a comparison of typical compressiveload-displacement curves following tests on F50, FBS, FSS and FLS. The curves for all tubereinforced structures exhibited similar traits, which is linear response before the fractureoccurred to the structure at approximately 1 mm. During this phenomenon, the stiffnessfor the tube reinforced foam structure will reduce. Non-linear response appears in thecurve after the peak load is attained until the compression is in a stable mode with anapproximately constant force, before declining throughout the last phase of the test. Anexamination of the curves for FBS structure indicates that the load increases linearly up toroughly 26.6 kN. This is followed by FLS and FSS which have the peak load at 6.9 kN and4.5 kN respectively. The benchmark sample, which is F50, provide the lowest maximumload when it started to fracture compared to the other three types of tube reinforced foamstructure.
Polymers 2021, 13, x FOR PEER REVIEW 8 of 14
Figure 7. Load-displacement curve for F50 reinforced with different type of single tubes.
Figure 8. Load-displacement curve for HP80 reinforced with different type of single tubes.
The deformation of the single tube reinforced foam structure after completing the
compression process is shown in Figure 9. All the tubes were compacted and locked up at
densification region when the tube walls have fully collapsed, as suggested by Rajput et
al. [14]. Here, the lateral movement of tube reinforced structure is limited by increasing
the foam density from 50 to 80 kg/m3. In Figure 9b, there is only a small amount of bamboo
tube splitting is visible on the outside diameter. A closer look reveals that numerous of
these fractures have penetrated to the neighbouring foam, similar to [15]. For PVC
reinforced foam structures, the buckling and folding failure also being restricted with the
increasing of foam density. Thus, the foam has been successful in constraining the lateral
movement and failure mechanism.
0
5
10
15
20
25
30
35
40
45
0 2 4 6 8 10 12 14 16 18 20
Load
(k
N)
Displacement (mm)
F50
FBS
FSS
FLS
0
5
10
15
20
25
30
35
40
45
0 2 4 6 8 10 12 14 16 18 20
Lo
ad (
kN
)
Displacement (mm)
HP80
HBS
HSS
HLS
Figure 7. Load-displacement curve for F50 reinforced with different type of single tubes.
A typical load-displacement curve for tube reinforced with HP80 foam is presentedin Figure 8. The density of the foam used is 80 kg/m3 which is denser than the F50 foam.Here, the HBS structure load clearly rise up to 27 kN at 1.3 mm and drop gradually beforethe densification point at approximately 12.5 mm. Conversely, the curve for HSS andHLS exhibit similar traits under compression load. The initial fracture of HSS structuretakes place when the load increases up to 6.3 kN while the HLS structure starts to fail at7.3 kN which is slightly higher than HSS structure. The curve for three tube reinforcedfoam structures obviously showed that the strength of the reinforced structure is betterthan the benchmark sample, i.e., HP80. The increase of density foam in the tube reinforced

Polymers 2021, 13, 3603 8 of 14
foam structure leading to slightly changes in the strength of the structure. The incrementof strength value for HBS and HLS structures are not more than 6% when compared to FBSand FLS structures. However, for the HSS structure, an increment of approximately 40% instrength is recorded.
Polymers 2021, 13, x FOR PEER REVIEW 8 of 14
Figure 7. Load-displacement curve for F50 reinforced with different type of single tubes.
Figure 8. Load-displacement curve for HP80 reinforced with different type of single tubes.
The deformation of the single tube reinforced foam structure after completing the
compression process is shown in Figure 9. All the tubes were compacted and locked up at
densification region when the tube walls have fully collapsed, as suggested by Rajput et
al. [14]. Here, the lateral movement of tube reinforced structure is limited by increasing
the foam density from 50 to 80 kg/m3. In Figure 9b, there is only a small amount of bamboo
tube splitting is visible on the outside diameter. A closer look reveals that numerous of
these fractures have penetrated to the neighbouring foam, similar to [15]. For PVC
reinforced foam structures, the buckling and folding failure also being restricted with the
increasing of foam density. Thus, the foam has been successful in constraining the lateral
movement and failure mechanism.
0
5
10
15
20
25
30
35
40
45
0 2 4 6 8 10 12 14 16 18 20
Load
(k
N)
Displacement (mm)
F50
FBS
FSS
FLS
0
5
10
15
20
25
30
35
40
45
0 2 4 6 8 10 12 14 16 18 20
Lo
ad (
kN
)
Displacement (mm)
HP80
HBS
HSS
HLS
Figure 8. Load-displacement curve for HP80 reinforced with different type of single tubes.
Based on the energy absorption under the load-displacement curves for both F50 andHP80 foams, the bamboo reinforced foam structure offers an energy-absorbing capabilitygreater than both PVC reinforced foam structures. The SEA values for FBS, FLS and FSSstructures are found to be 17.9, 10.0 and 8.2 kJ/kg, respectively. In contrast, the SEA valuefor HBS, HLS and HSS are 24.5, 10.9 and 10.1 kJ/kg, respectively. Previous study byUmer et al. [15] has found that the SEA values is around 20 kJ/kg for single bamboo tube(D/t = 4.6) reinforced foam structure which is almost similar to the value for FBS and HBS.However, it is interesting to note that the SEA increases with the increasing density foam,similar to study conducted by Alia [1].
The deformation of the single tube reinforced foam structure after completing thecompression process is shown in Figure 9. All the tubes were compacted and locked upat densification region when the tube walls have fully collapsed, as suggested by Rajputet al. [14]. Here, the lateral movement of tube reinforced structure is limited by increasingthe foam density from 50 to 80 kg/m3. In Figure 9b, there is only a small amount of bambootube splitting is visible on the outside diameter. A closer look reveals that numerous of thesefractures have penetrated to the neighbouring foam, similar to [15]. For PVC reinforcedfoam structures, the buckling and folding failure also being restricted with the increasingof foam density. Thus, the foam has been successful in constraining the lateral movementand failure mechanism.
3.4. Multi Tube Reinforced Foam Structures
The following part of this study focused into the effect of multiple tube reinforcedfoam structures on its energy-absorbing response. Here, four tubes are used and embeddedinto the foam similar to the single tube.
Polymers 2021, 13, 3603 9 of 14Polymers 2021, 13, x FOR PEER REVIEW 9 of 14
FSS FLS FBS
Aft
er
B
efo
re
(a)
HSS HLS HBS
Aft
er
Bef
ore
(b)
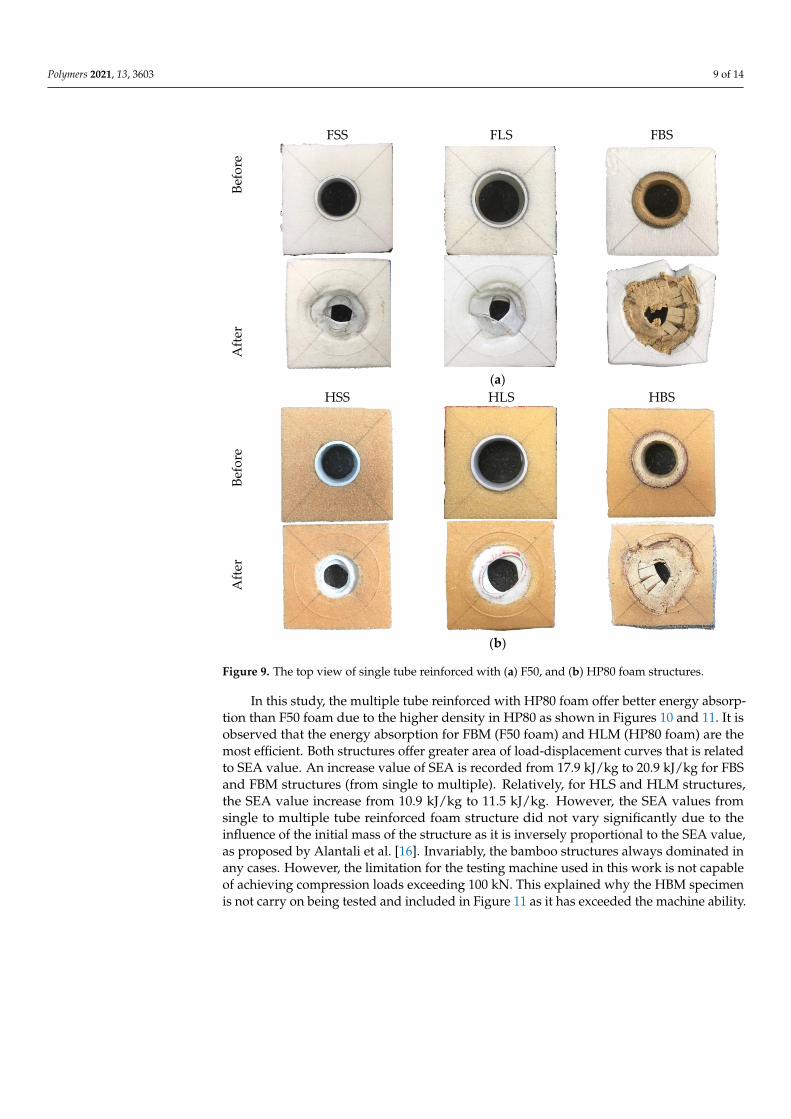
Figure 9. The top view of single tube reinforced with (a) F50, and (b) HP80 foam structures.
3.4. Multi Tube Reinforced Foam Structures
The following part of this study focused into the effect of multiple tube reinforced
foam structures on its energy-absorbing response. Here, four tubes are used and
embedded into the foam similar to the single tube.
In this study, the multiple tube reinforced with HP80 foam offer better energy
absorption than F50 foam due to the higher density in HP80 as shown in Figures 10 and
11. It is observed that the energy absorption for FBM (F50 foam) and HLM (HP80 foam)
are the most efficient. Both structures offer greater area of load-displacement curves that
is related to SEA value. An increase value of SEA is recorded from 17.9 kJ/kg to 20.9 kJ/kg
for FBS and FBM structures (from single to multiple). Relatively, for HLS and HLM
structures, the SEA value increase from 10.9 kJ/kg to 11.5 kJ/kg. However, the SEA values
from single to multiple tube reinforced foam structure did not vary significantly due to
the influence of the initial mass of the structure as it is inversely proportional to the SEA
value, as proposed by Alantali et al. [16]. Invariably, the bamboo structures always
dominated in any cases. However, the limitation for the testing machine used in this work
is not capable of achieving compression loads exceeding 100 kN. This explained why the
HBM specimen is not carry on being tested and included in Figure 11 as it has exceeded
the machine ability.
Figure 9. The top view of single tube reinforced with (a) F50, and (b) HP80 foam structures.
In this study, the multiple tube reinforced with HP80 foam offer better energy absorp-tion than F50 foam due to the higher density in HP80 as shown in Figures 10 and 11. It isobserved that the energy absorption for FBM (F50 foam) and HLM (HP80 foam) are themost efficient. Both structures offer greater area of load-displacement curves that is relatedto SEA value. An increase value of SEA is recorded from 17.9 kJ/kg to 20.9 kJ/kg for FBSand FBM structures (from single to multiple). Relatively, for HLS and HLM structures,the SEA value increase from 10.9 kJ/kg to 11.5 kJ/kg. However, the SEA values fromsingle to multiple tube reinforced foam structure did not vary significantly due to theinfluence of the initial mass of the structure as it is inversely proportional to the SEA value,as proposed by Alantali et al. [16]. Invariably, the bamboo structures always dominated inany cases. However, the limitation for the testing machine used in this work is not capableof achieving compression loads exceeding 100 kN. This explained why the HBM specimenis not carry on being tested and included in Figure 11 as it has exceeded the machine ability.

Polymers 2021, 13, 3603 10 of 14Polymers 2021, 13, x FOR PEER REVIEW 10 of 14
Figure 10. Load-displacement curve for multiple tube reinforced with F50 foam structure.
Figure 11. Load-displacement curve for multiple tube reinforced with HP80 foam structure.
Furthermore, the SEA value and strength found to be increased when there is an
increasing in tube diameter as well as the foam density. This shows that the local
limitation imposed by the F50 and HP80 foam has a significant impact on the failure
processes in tubes. In Figure 12, the deformation failure of multiple tube reinforced foam
structures after testing is presented. The top section of the PVC tube shift slightly to one
side when interpenetration occurred due to the transverse shear while the fracture of fibre
occurred in the bamboo tube causes the tube to fractured into radial cracks and
longitudinal splitting [7,17]. The failure of the bamboo tube can be seen clearly from the
top view. As comparison to the Figure 9a, the failure of the single bamboo tube reinforced
foam structure (FBS) is similar to the multiple bamboo tube reinforced foam structure
(FBM) as shown in Figure 12a. The failed bamboo tube pushed the foam and leads to a
crack in the foam structure. This means that the neighbouring tube properties can be
affected as well. Figure 13 compares the single and multiple tubes reinforced foam
structures.
0
20
40
60
80
100
0 2 4 6 8 10 12 14 16 18 20
Lo
ad (
kN
)
Displacement (mm)
F50FBMFSM
0
20
40
60
80
100
0 2 4 6 8 10 12 14 16 18 20
Load
(k
N)
Displacement (mm)
HP80
HSM
HLM
Figure 10. Load-displacement curve for multiple tube reinforced with F50 foam structure.
Polymers 2021, 13, x FOR PEER REVIEW 10 of 14
Figure 10. Load-displacement curve for multiple tube reinforced with F50 foam structure.
Figure 11. Load-displacement curve for multiple tube reinforced with HP80 foam structure.
Furthermore, the SEA value and strength found to be increased when there is an
increasing in tube diameter as well as the foam density. This shows that the local
limitation imposed by the F50 and HP80 foam has a significant impact on the failure
processes in tubes. In Figure 12, the deformation failure of multiple tube reinforced foam
structures after testing is presented. The top section of the PVC tube shift slightly to one
side when interpenetration occurred due to the transverse shear while the fracture of fibre
occurred in the bamboo tube causes the tube to fractured into radial cracks and
longitudinal splitting [7,17]. The failure of the bamboo tube can be seen clearly from the
top view. As comparison to the Figure 9a, the failure of the single bamboo tube reinforced
foam structure (FBS) is similar to the multiple bamboo tube reinforced foam structure
(FBM) as shown in Figure 12a. The failed bamboo tube pushed the foam and leads to a
crack in the foam structure. This means that the neighbouring tube properties can be
affected as well. Figure 13 compares the single and multiple tubes reinforced foam
structures.
0
20
40
60
80
100
0 2 4 6 8 10 12 14 16 18 20
Lo
ad (
kN
)
Displacement (mm)
F50FBMFSM
0
20
40
60
80
100
0 2 4 6 8 10 12 14 16 18 20
Lo
ad (
kN
)
Displacement (mm)
HP80
HSM
HLM
Figure 11. Load-displacement curve for multiple tube reinforced with HP80 foam structure.
Furthermore, the SEA value and strength found to be increased when there is anincreasing in tube diameter as well as the foam density. This shows that the local limitationimposed by the F50 and HP80 foam has a significant impact on the failure processes in tubes.In Figure 13, the deformation failure of multiple tube reinforced foam structures after testingis presented. The top section of the PVC tube shift slightly to one side when interpenetrationoccurred due to the transverse shear while the fracture of fibre occurred in the bambootube causes the tube to fractured into radial cracks and longitudinal splitting [7,17]. Thefailure of the bamboo tube can be seen clearly from the top view. As comparison to theFigure 9a, the failure of the single bamboo tube reinforced foam structure (FBS) is similarto the multiple bamboo tube reinforced foam structure (FBM) as shown in Figure 13a. Thefailed bamboo tube pushed the foam and leads to a crack in the foam structure. This meansthat the neighbouring tube properties can be affected as well. Figure 13 compares the singleand multiple tubes reinforced foam structures.

Polymers 2021, 13, 3603 11 of 14Polymers 2021, 13, x FOR PEER REVIEW 11 of 14
FSM FLM FBM
Aft
er
Bef
ore
(a)
HSM HLM
Aft
er
B
efo
re
(b)
Figure 12. The top view of multiple tube structure with (a) F50 and (b) HP80 foam strucctures.
(a)
0
5
10
15
20
25
30
0
20
40
60
80
100
FBS FSS FLS FBM FSM FLM
Single-tube Multi-tube
SE
A (
kJ/
kg
)
Str
ength
(kN
)
Strength
SEA
Figure 12. The top view of multiple tube structure with (a) F50 and (b) HP80 foam strucctures.
Polymers 2021, 13, x FOR PEER REVIEW 11 of 14
FSM FLM FBM
Aft
er
Bef
ore
(a)
HSM HLM
Aft
er
B
efo
re
(b)
Figure 12. The top view of multiple tube structure with (a) F50 and (b) HP80 foam strucctures.
(a)
0
5
10
15
20
25
30
0
20
40
60
80
100
FBS FSS FLS FBM FSM FLM
Single-tube Multi-tube
SE
A (
kJ/
kg
)
Str
ength
(kN
)
Strength
SEA
Figure 13. Cont.
Polymers 2021, 13, 3603 12 of 14Polymers 2021, 13, x FOR PEER REVIEW 12 of 14
(b)
Figure 13. Compressive strength and SEA for single and multiple tube embedded in (a) F50 and (b)
HP80 foams.
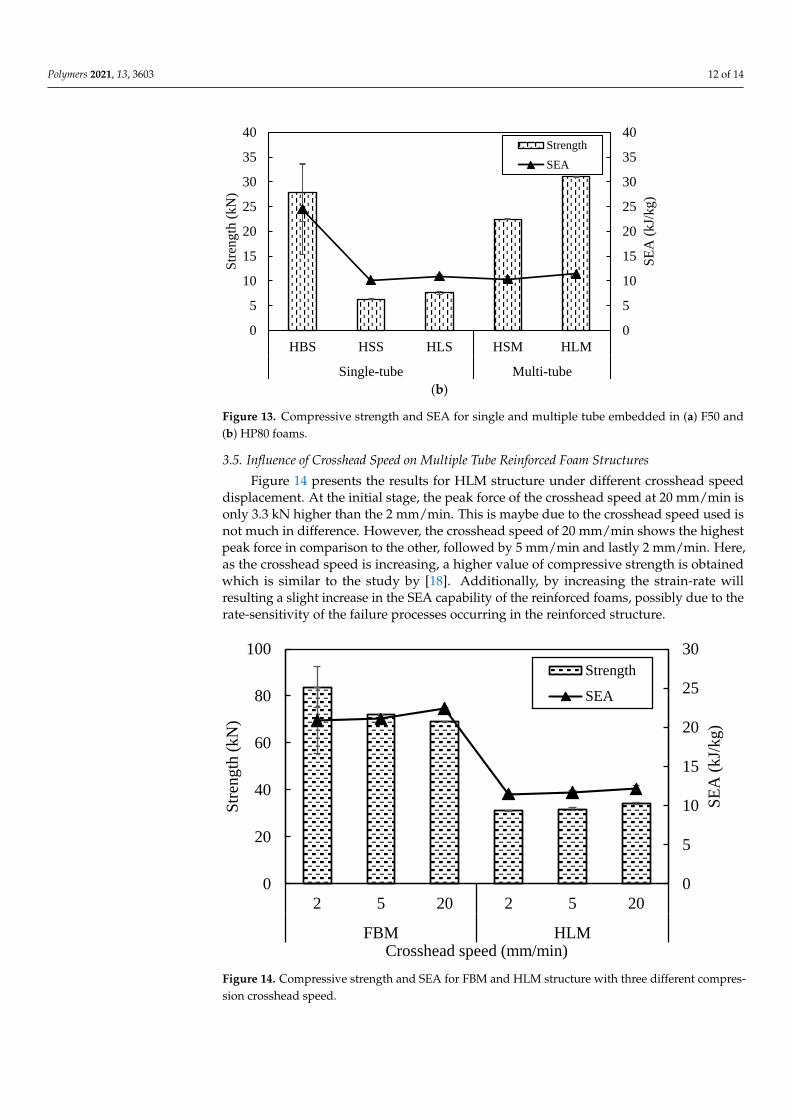
3.5. Influence of Crosshead Speed on Multiple Tube Reinforced Foam Structures
Figure 14 presents the results for HLM structure under different crosshead speed
displacement. At the initial stage, the peak force of the crosshead speed at 20 mm/min is
only 3.3 kN higher than the 2 mm/min. This is maybe due to the crosshead speed used is
not much in difference. However, the crosshead speed of 20 mm/min shows the highest
peak force in comparison to the other, followed by 5 mm/min and lastly 2 mm/min. Here,
as the crosshead speed is increasing, a higher value of compressive strength is obtained
which is similar to the study by [18]. Additionally, by increasing the strain-rate will
resulting a slight increase in the SEA capability of the reinforced foams, possibly due to
the rate-sensitivity of the failure processes occurring in the reinforced structure.
Figure 14. Compressive strength and SEA for FBM and HLM structure with three different
compression crosshead speed.
4. Conclusions
The conclusions of this study can be drawn as follow:
1. Single bamboo tube reinforced foam structure offers highest value in specific energy
absorption and compression strength. By increasing the foam density, it will increase
0
5
10
15
20
25
30
35
40
0
5
10
15
20
25
30
35
40
HBS HSS HLS HSM HLM
Single-tube Multi-tube
SE
A (
kJ/
kg
)
Str
ength
(kN
)
Strength
SEA
0
5
10
15
20
25
30
0
20
40
60
80
100
2 5 20 2 5 20
FBM HLM
SE
A (
kJ/
kg
)
Str
eng
th (
kN
)
Crosshead speed (mm/min)
Strength
SEA
Figure 13. Compressive strength and SEA for single and multiple tube embedded in (a) F50 and(b) HP80 foams.
3.5. Influence of Crosshead Speed on Multiple Tube Reinforced Foam Structures
Figure 14 presents the results for HLM structure under different crosshead speeddisplacement. At the initial stage, the peak force of the crosshead speed at 20 mm/min isonly 3.3 kN higher than the 2 mm/min. This is maybe due to the crosshead speed used isnot much in difference. However, the crosshead speed of 20 mm/min shows the highestpeak force in comparison to the other, followed by 5 mm/min and lastly 2 mm/min. Here,as the crosshead speed is increasing, a higher value of compressive strength is obtainedwhich is similar to the study by [18]. Additionally, by increasing the strain-rate willresulting a slight increase in the SEA capability of the reinforced foams, possibly due to therate-sensitivity of the failure processes occurring in the reinforced structure.
Polymers 2021, 13, x FOR PEER REVIEW 12 of 14
(b)
Figure 13. Compressive strength and SEA for single and multiple tube embedded in (a) F50 and (b)
HP80 foams.
3.5. Influence of Crosshead Speed on Multiple Tube Reinforced Foam Structures
Figure 14 presents the results for HLM structure under different crosshead speed
displacement. At the initial stage, the peak force of the crosshead speed at 20 mm/min is
only 3.3 kN higher than the 2 mm/min. This is maybe due to the crosshead speed used is
not much in difference. However, the crosshead speed of 20 mm/min shows the highest
peak force in comparison to the other, followed by 5 mm/min and lastly 2 mm/min. Here,
as the crosshead speed is increasing, a higher value of compressive strength is obtained
which is similar to the study by [18]. Additionally, by increasing the strain-rate will
resulting a slight increase in the SEA capability of the reinforced foams, possibly due to
the rate-sensitivity of the failure processes occurring in the reinforced structure.
Figure 14. Compressive strength and SEA for FBM and HLM structure with three different
compression crosshead speed.
4. Conclusions
The conclusions of this study can be drawn as follow:
1. Single bamboo tube reinforced foam structure offers highest value in specific energy
absorption and compression strength. By increasing the foam density, it will increase
0
5
10
15
20
25
30
35
40
0
5
10
15
20
25
30
35
40
HBS HSS HLS HSM HLM
Single-tube Multi-tube
SE
A (
kJ/
kg
)
Str
ength
(kN
)
Strength
SEA
0
5
10
15
20
25
30
0
20
40
60
80
100
2 5 20 2 5 20
FBM HLM
SE
A (
kJ/
kg
)
Str
eng
th (
kN
)
Crosshead speed (mm/min)
Strength
SEA
Figure 14. Compressive strength and SEA for FBM and HLM structure with three different compres-sion crosshead speed.

Polymers 2021, 13, 3603 13 of 14
4. Conclusions
The conclusions of this study can be drawn as follow:
1. Single bamboo tube reinforced foam structure offers highest value in specific energyabsorption and compression strength. By increasing the foam density, it will increasethe specific energy absorption and compressive strength value. A larger size ofdiameter of tube can enhance the specific energy absorption and compressive strength.
2. The compressive strength increases significantly when several tubes are introduced in-side the foam. In contrast, the specific energy absorption does not change significantlyfor multiple tube reinforced foam structure. The multiple bamboo tube reinforcedF50 foam structure offers better value of compression properties. In addition, themultiple PVC tube reinforced foam structure with a diameter of 25 mm gives thehighest energy absorbing capability in HP80 foam.
3. The specific energy absorption does not vary significantly under the different crossheadspeed below 20 mm/min. However, an increase in crosshead speed during testing canleads a slightly higher value of specific energy absorption. Therefore, the structuresare believed to have a strain-rate effect when a higher speed is applied.
Author Contributions: Project administration, M.Y.M.Z. and J.J.N.A.; Visualization, J.J.N.A.; Writing—original draft, J.J.N.A. and M.Y.M.Z.; Writing—review & editing, Z.L., N.I.Z., A.A. and R.A.I. Allauthors have read and agreed to the published version of the manuscript.
Funding: This work is supported by Universiti Putra Malaysia through Putra Grant (GP-IPS/2018/9663200).
Acknowledgments: Gratitude also expressed to Muhammad Wildan Ilyas Mohamed Ghazali for hisassistance in conducting this experimental work.
Conflicts of Interest: The authors declare no conflict of interest.
References1. Alia, R.A. The Energy-Absorbing Characteristics of Novel Tube-Reinforced Sandwich Structures. Ph.D. Thesis, University of
Liverpool, Liverpool, UK, 2015.2. Cinar, K. Evaluation of sandwich panels with composite tube-reinforced foam core under bending and flatwise compression. J.
Sandw. Struct. Mater. 2020, 22, 480–493. [CrossRef]3. Birman, V.; Kardomateas, G.A. Review of current trends in research and applications of sandwich structures. Compos. Part B Eng.
2018, 142, 221–240. [CrossRef]4. Colloca, M.; Dorogokupets, G.; Gupta, N.; Porfiri, M. Mechanical properties and failure mechanisms of closed-cell PVC foams.
Int. J. Crashworthiness 2012, 17, 327–336. [CrossRef]5. Shinde, R.B.; Mali, K.D. An Overview on Impact Behaviour and Energy Absorption of Collapsible Metallic and Non-Metallic
Energy Absorbers used in Automotive Applications. IOP Conf. Ser. Mater. Sci. Eng. 2018, 346, 2018. [CrossRef]6. Khan, R.A.; Mahdi, E.; Cabibihan, J.J. Effect of fibre orientation on the quasi-static axial crushing behaviour of glass fibre reinforced
polyvinyl chloride composite tubes. Materials 2021, 14, 2235. [CrossRef] [PubMed]7. Zuhri, M.Y.M.; Liao, Y.; Wang, Q.Y.; Guan, Z.W. The energy absorbing properties of bamboo-based structures. J. Sandw. Struct.
Mater. 2019, 21, 1032–1054. [CrossRef]8. Zhou, J.; Guan, Z.; Cantwell, W.J. The energy-absorbing behaviour of composite tube-reinforced foams. Compos. Part B Eng. 2018,
139, 227–237. [CrossRef]9. Alhawamdeh, M.; Alajarmeh, O.; Aravinthan, T.; Shelley, T.; Schubel, P.; Kemp, M.; Zeng, X. Modelling hollow pultruded FRP
profiles under axial compression: Local buckling and progressive failure. Compos. Struct. 2021, 262, 113650. [CrossRef]10. Alia, R.A.; Cantwell, W.J.; Langdon, G.S.; Yuen, S.C.K.; Nurick, G.N. The energy-absorbing characteristics of composite tube-
reinforced foam structures. Compos. Part B Eng. 2014, 61, 127–135. [CrossRef]11. Molari, L.; Mentrasti, L.; Fabiani, M. Mechanical characterization of five species of Italian bamboo. Structures 2020, 24, 59–72.
[CrossRef]12. ASTM. Standard Test Method for Flatwise Compressive Properties of Sandwich Cores 1. Am. Soc. Test. Mater. 2003, 2–4.
[CrossRef]13. Li, Q.M.; Magkiriadis, I.; Harrigan, J.J. Compressive strain at the onset of densification of cellular solids. J. Cell. Plast. 2006, 42,
371–392. [CrossRef]14. Rajput, M.S.; Burman, M.; Köll, J.; Hallström, S. Compression of structural foam materials—Experimental and numerical
assessment of test procedure and specimen size effects. J. Sandw. Struct. Mater. 2019, 21, 260–288. [CrossRef]

Polymers 2021, 13, 3603 14 of 14
15. Umer, R.; Balawi, S.; Raja, P.; Cantwell, W.J. The energy-absorbing characteristics of polymer foams reinforced with bamboo tubes.J. Sandw. Struct. Mater. 2014, 16, 108–122. [CrossRef]
16. Alantali, A.; Alia, R.A.; Umer, R.; Cantwell, W.J. Energy absorption in aluminium honeycomb cores reinforced with carbon fibrereinforced plastic tubes. J. Sandw. Struct. Mater. 2019, 21, 2801–2815. [CrossRef]
17. Wei, Y.; Zhou, M.; Zhao, K.; Zhao, K.; Li, G. Stress–strain relationship model of glulam bamboo under axial loading. Adv. Compos.Lett. 2020, 29, 1–11. [CrossRef]
18. Xiang, C.; Xiao, Z.; Ding, H.; Wang, Z. Compressive Properties and Energy Absorption Characteristics of Extruded Mg-Al-Ca-MnAlloy at Various High Strain Rates. Materials 2020, 14, 87. [CrossRef] [PubMed]