queen mary university of london · queen mary university of london (qmul) is an exempt charity...
TRANSCRIPT
Queen Mary University of LondonFinancial Statements 2015/2016

Contents
Report by the President and Principal 3
Charitable Status and Public Benefit 6
Strategic Review 9
Statement of Corporate Governanceand Internal Control 18
Independent Auditor’s Report 23
Consolidated Statement of Comprehensive Income and Expenditure 25
Consolidated and QMUL Statement of Changes in Reserves 26
Consolidated and QMUL Balance Sheets 28
Consolidated Cash Flow 30
Notes to the Financial Statements 32
Council and Audit and RiskCommittee Membership 60
2 Queen Mary University of London
Report by the President and Principal
Queen Mary University of London (QMUL) recorded another period of overall success and development in 2015/16, building on the outstanding progress of recent years. This success was once again achieved against a backdrop of significant challenge and change in the external environment. Most noticeably, the outcome of the referendum on the UK’s membership of the EU was announced towards the end of this period. The decision to leave will pose a significant challenge to the sector in terms of maintaining the attractiveness of our universities to talented students and staff (from the EU and also from other countries, recognising that the UK may be perceived as a less welcoming destination) and also in maintaining access to research funding and networks. In addition, a Higher Education White Paper was published by the Government, later to be followed by the introduction of a Bill, which heralds the introduction of a new regulatory framework for the sector and also the implementation of a Teaching Excellence Framework exercise. The exact detail and full effect of these developments will become apparent in future years but work was set in train in 2015/16 to ensure that the institution is well prepared and that steps are being taken to mitigate any potentially destabilising effects.
In the area of knowledge creation we have continued to build on our outstanding results in the 2014 UK-wide assessment of research (the Research Excellence Framework), which placed QMUL ninth in the UK (amongst multi-faculty institutions) for the quality of its research outputs. The recently published Times Higher Education (THE) World Rankings place QMUL 44th in the world and eighth in the UK for research influence, based on the number of times that the published work of a university’s academics is cited by scholars globally. This clearly demonstrates that our academics are undertaking research of the highest quality and is a source of considerable pride. Our challenge is to ensure that our research activity can grow whilst also retaining this high quality, by attracting more external funding and by ensuring that the appropriate supporting infrastructure is in place. We are also mindful that our reputation for research, as evidenced by surveys such as the THE rankings, does not reflect the excellence of our activity and so a focus for the coming year will be to secure a much better and broader external recognition of the quality of our research work.
In the area of knowledge dissemination, we have seen strong recruitment of students in 2015/16, reflecting the continued growth of QMUL’s stature and profile. Recruitment onto our undergraduate programmes in London increased by almost 9%1 compared to the previous year, a particularly noteworthy achievement given the increasingly competitive environment for student recruitment following the removal of student number controls (apart from those relating to Medical and Dental undergraduate programmes). Recruitment at Postgraduate level was broadly level with that of the previous year, and further resources have been allocated to ensure that we are able to process a greater volume of applications at Postgraduate
Taught level and better translate our popularity with prospective students into successfully enrolled students.
We continue to celebrate our status as one of the most internationally-orientated universities in the world (within the top 25, based on the THE rankings), recognising that the entire QMUL community is enhanced by the presence of staff and students from a range of nationalities (a message that is even more important to emphasise in the wake of the EU referendum outcome). Accordingly, we were pleased to note that our total number of non-UK students increased in 2015/16 by 4%.
QMUL also continues to be an institution that is at the forefront of transnational education, with student numbers on our existing joint programmes in China, delivered in partnership with the Beijing University of Post and Telecommunications and Nanchang University, rising by 13% compared to the previous year. During the year we also gained approval from the Chinese Ministry of Education for the establishment of a new joint programme in material science with Northwestern Polytechnical University in Xi’an, which will enrol its first students in 2017. We will continue to explore opportunities for partnerships with other high quality institutions across the globe, which can support new teaching opportunities and help mitigate the effects of Brexit and Government immigration policies on the recruitment of international students into the UK. Our focus on only working with leading universities also ensures that these partnerships can foster significant research collaborations, to the benefit of both parties.
QMUL’s tradition of achieving academic excellence whilst also remaining deeply embedded in our local communities is a defining feature of this institution. The diversity of our student body is a reflection of our locality and is something of which we continue to be proud. We recognise, however, that alongside a first-rate education we must also work to address a possible deficit in social capital that may be associated with non-traditional backgrounds. To build on recent progress and start to have an even greater impact in terms of widening opportunities as well as access, we have worked during the year on developing a major initiative that will transform our undergraduate programmes and offer a distinct student experience, which will support the development of our students’ social and cultural capital, and prepare them for the complexities of the 21st century. Preparations are on-track to support the launch of the initiative in 2017/18.
Public engagement is another key expression of our commitment to our communities. We do not see engagement solely as an end product of our research, but rather view it as a means of enriching our academic endeavour, which can then be used to help advance the public mission of the university. Accordingly, we were delighted to have been the first UK university to be awarded a Public Engagement ‘Watermark’ by the National Co-ordinating Centre for Public Engagement,
1 Student numbers are based on Full-Time Equivalent population for all levels and modes of study as at 1 December 2015, with comparisons based on the equivalent data as at 1 December 2014. Undergraduate numbers include students being taught on Joint Programmes in China. 3 Queen Mary University of London

in recognition of the effectiveness of our approach and of the commitment to this ethos by colleagues from across the institution.
Our Life Sciences Initiative illustrates the benefits of this approach to engagement for both the university and our communities. This is a multidisciplinary endeavour that bridges our three Faculties and involves close working with patient and community groups in order to support research that can improve health care and outcomes in east London and beyond. Central to our vision is the establishment of an extended Life Sciences campus at our Whitechapel campus, developed in close collaboration with our NHS partner and with other universities, industry, and charitable foundations. We believe this initiative will have a transformative effect on the locality, not only in terms of the health and well-being of the population, but also through the regeneration of the locality and the creation of learning and employment opportunities.
We recognise that the achievement of our ambitions in areas such as Life Sciences and more broadly across our strategic aims will rely on the institution having the financial strength and capacity to deliver the necessary level of investment. The generation of a surplus of £12.5m in 2015/16 was - while lower than we would wish - an important part of this process and allowed us to support key initiatives such as the ongoing refurbishment of our Engineering Building and the near completion of our new Graduate Centre.
Our focus continues to be on ensuring that we are able to generate the capacity to invest into the facilities and equipment required by our staff and students. We will also look to invest in new initiatives that will help support the delivery of our academic ambitions, where these are financially viable at an institutional level and also only where these align with our values as an institution. These values are rooted in a strong sense of purpose and social justice, and they will continue to guide us as we look to achieve excellence across all our activities during a challenging time for the sector.
Professor Simon Gaskell, President and Principal
November 2016
4 Queen Mary University of London
Report by the President and Principal (continued)
5 Queen Mary University of London

Charitable Status and Public Benefit
Queen Mary University of London (QMUL) is an exempt charity regulated by the Higher Education Funding Council for England (HEFCE). In determining QMUL’s strategic direction, and ensuring the effective management and control of QMUL’s affairs, property and finances, the members of our governing body, as trustees, have due regard to the Charity Commission’s guidance on public benefit.
Public benefitQMUL was established through the Queen Mary and Westfield College Act and the granting of a Royal Charter ‘to promote, for the public benefit, education, research and scholarship, to provide courses and instruction leading to degrees and other academic awards of the University of London and/or QMUL and to promote and undertake research, and to disseminate the results of such research’. The ‘advancement of education’, identified as a key charitable criterion in the Charities Act 2011, therefore underpins our Purpose and Values.
QMUL is widely recognised as a leading research-intensive university, both in the UK and globally. We are a member of the Russell Group and one of the larger constituent colleges of the University of London. One of our defining characteristics is that we are equally committed to the achievement of the highest international standards in education and research, and to the service of our local communities through public engagement and the promotion of opportunity to individuals less favoured by financial or social background.
Public benefit is embedded in our strategic aims and objectives, and reporting of progress towards achieving these is contained in the Strategic Review. The primary beneficiaries are current and potential students of QMUL and members of the general public who benefit from QMUL’s research and engagement activities.
Access to world class learningQMUL is committed to maintaining its proud tradition of nurturing the brightest and best talents, regardless of background. In 2015/16 we committed 30% of the additional fee income raised from tuition fees above the basic fee level to support additional outreach and retention measures.
QMUL provides a generous package of bursaries and scholarships, including the QMUL Bursary which supports undergraduate students from low income households; and a range of Excellence Scholarships. In 2015/16, 5060 students were awarded a QMUL Bursary, 126 students received Science and Engineering Excellence Scholarships worth £378,000 and 28 students received Economics and Finance Excellence Scholarships worth £84,000. A Hardship fund exists to provide assistance for students who need extra financial support to remain in higher education and provision was made within this allocation to address issues arising from changes to the Disabled Students’ Allowance from September 2015.
We have an excellent record in attracting talented students from a wide range of social backgrounds. QMUL performance is the best in the Russell Group when judged against two of the three main HESA widening participation performance indicators. Current data shows that Queen Mary has the highest percentage of students from NS-SEC socio-economic class 4-7 within the Russell Group institutions and is top within this Group when ranked by the number of percentage points above the location adjusted benchmark for percentage of students from state schools.
Working in partnership with schoolsQueen Mary is involved in a number of innovative partnerships with independent state-maintained schools in the local boroughs of Havering and Tower Hamlets, helping to improve standards of education and inspiring young people to fulfil their potential.
QMUL is the lead partner in a new National Challenge Trust School, St Paul’s Way Trust School in Tower Hamlets, just a 20-minute walk from our Mile End campus, and co-sponsors the Drapers’ Multi-Academy Trust (MAT) with the Drapers’ Company, a leading City Livery Company with which QMUL has a long-standing partnership. QMUL and the Drapers’ Company have now approved further expansion of the Drapers’ MAT to a maximum of 12 schools over the coming years.
Partnership with these schools has enabled QMUL to make major contributions to educational attainment and aspiration in the London Boroughs of Havering and Tower Hamlets, which experience high levels of unemployment and poor progression to further and higher education, as well as providing invaluable development opportunities for our staff and students. Our academics are involved in curriculum development, our students are given mentoring and tutoring opportunities and several QMUL staff members have non-executive board roles.
Wider outreachQMUL is committed to raising awareness of the benefits of higher education through its extensive range of outreach activities. The Widening Participation team works with young people, from 10-18 years old, from under-represented groups that are statistically less likely to consider higher education. Our work focuses on dispelling assumptions, building aspirations and providing insight and first-hand experience of university, helping students to make informed choices about higher education, and delivering a range of programmes both in-school and at QMUL. Activities include Coding Clubs and Reading Challenge for primary school students, campus visit days, subject specific summer schools, and mentoring and shadowing schemes. In addition, we deliver long term programmes working with the same young people over sustained periods of time, such as our work with the Sutton Trust on Pathways to Coding and Pathways to Law, and the Bridge the Gap programme which aims to increase children’s awareness of medicine and dentistry as a career pathway and support them on their journey towards these professions.
6 Queen Mary University of London
The Centre of the Cell in Whitechapel is an educational resource dedicated to inspiring curiosity and learning by connecting science to everyday life. Centre of the Cell is an online resource, a science education centre and outreach project aimed at young people, teachers, families and community group. Since opening in 2009, the Centre has welcomed over 100,000 visitors from all over the world and over one million visits to their website. However, it remains deeply rooted within its diverse local communities, with around 50 per cent of all school participants coming from a ten-mile radius of Whitechapel, with 81 per cent of Tower Hamlets primary schools and 100 per cent of Tower Hamlets secondary schools having taken part in their activities.
Student experienceWe offer students a stimulating, supportive and high-quality learning experience, with teaching inspired by our world-leading research. Although London universities do not score highly, Queen Mary ranks top in London among Russell Group universities for student satisfaction (National Student Survey 2016), with a number of our subject areas receiving over 90 per cent for ‘overall satisfaction’ including Medicine, Dentistry, Law and English. We recognise the need to ensure that we provide a consistently high quality student experience across all disciplines and we are now developing and implementing action plans to ensure that this occurs.
Our Student Experience, Learning Teaching and Assessment Strategy sets out our aims to ensure a high equality student experience for all students and to support students’ achievements through all stages of their educational, personal and professional development. To help students achieve their potential we offer a range of services to support their learning, including drop-in services, group study sessions and individual access to our Royal Literary Fund Fellows, who are all published writers and offer considerable flexibility within many of our degree programmes giving students the freedom to design a programme of study that reflects their individual interests.
QMUL offers students a variety of structured schemes to help build their social capital, gain work experience and enhance their cvs, ranging from internships and gaining work experience in charities to our QConsult scheme, which won the Employability Initiative category at The Guardian University Awards 2016 and gives bursary students the opportunity to gain client focused work experience through a part-time consulting project.
The award-winning Queen Mary Legal Advice Centre (LAC), opened by its Patron, Lord Goldsmith, in 2006 provides a free, accessible, client centred advice service to the public and on a range of legal areas including housing, immigration, family, employment, data protection and corporate law. It is staffed by volunteer law students advised and supported by more than 150 solicitors. Acting as a first-tier advice agency and attracting clients from a wide variety of backgrounds and presenting a
wide range of legal issues, it provides our students with the opportunity to experience law in a practical context and to develop many of the skills required for successful entry into the profession.
This approach to learning, teaching and employability will be developed during the next couple of years through a new and innovative initiative designed to broaden undergraduate education and increase our students’ social capital. Building on QMUL’s strong record of widening participation, it aims to widen opportunities after graduation. This scheme will have an emphasis on increased active learning, personalisation and co-creation and will enhance the student experience and engagement and the contribution that students and graduates are able to make to society.
Research and impactQueen Mary has made a strategic commitment to the highest quality of research. We have invested in this principle by systematically recruiting the best academics in their disciplines from around the world. The results of the most recent national assessment of research – the Research Excellence Framework (REF 2014) – have confirmed our place in the very top group of research-led universities in the UK. Overall we were ranked 9th in the UK among multi-faculty universities and 5th in the UK for the percentage of our international and world class research outputs.
QMUL researchers make major contributions in a wide range of disciplines including cancer and cardiovascular studies, intellectual property law, equality, inequalities and diversity, nanomaterials, and astronomy and QMUL lists a number of prestigious prize-winners amongst their number, including Dr Susana Godinho, awarded the Lister Prize Fellowship for her visionary work on cancer and Professor Yang Hao, the winner of the IET A F Harvey Engineering Research Prize.
QMUL is proud of our heritage and remains committed to our roots in both the local area and local community. This is exemplified through much of our research, including the East London Genes & Health project, a unique long-term study of 100,000 local volunteers of Bangladeshi and Pakistani origin that links genes with health records, to study disease and treatments and the Airway Cells and Air Pollution (ACAP) study investigating the impact of air pollution on immune cells within children’s lungs by combining research with school workshops.
Working with and for our communitiesThe university has embedded public engagement within its research and learning activities and is committed to creating and disseminating our research in interesting and innovative ways. The Dental Detectives project involved researchers from Queen Mary’s Dental Institute and the Drama department coming together to collaborate with a small group of Year 5 school pupils to explore the relationship between young people and the dentist, whilst The Carnival of Lost Emotions used
7 Queen Mary University of London
Charitable Status and Public Benefit (continued)

theatrical props and fancy dress to stimulate discussions about the relationship between humans, biology, history and culture and provoke people to think about emotions in new ways.
Our rich culture of engaging the community in our research ensures two-way conversations are had and meaningful partnerships are formed. These lead to benefits for all sides, both enriching the quality of our research and involving those that will be affected by the results to help shape research questions and processes.
8 Queen Mary University of London
Charitable Status and Public Benefit (continued)

Strategic Review
9 Queen Mary University of London
2015/16 £’000
2014/15 £’000
Change %
Financials (consolidated)
Total Income 405,493 381,077 +6%
Total Expenditure 393,019 372,549 +5%
Surplus for the Year 12,514 10,119 +23%
Purchase of Intangible & Fixed Assets 56,329 50,612 +11%
Increase /(Decrease) in Cash (including Endowment Assets) 2,538 (12,603)
Cash and Cash Equivalents 17,876 15,338 +17%
Borrowings 113,068 97,646 +16%
Income Highlights
Funding Body Grants 73,762 70,388 +5%
Full-time Home and EU Students 97,812 86,205 +13%
Full-time International Students 73,784 68,657 +7%
Research Grants and Contracts 101,483 99,243 +2%
Non-Financial
No. No.
Staff Numbers 3,803 3,699 +3%
Student Numbers (FTE)
Undergraduate 15,467 14,191 +9%
Postgraduate 4,132 4,105 +1%
Associate 425 423 0%
Total 20,023 18,718 +7%
Home (UK and EU) 12,491 11,663 +7%
Overseas (International) 7,532 7,055 +7%
Total 20,023 18,718 +7%
Highlights
Financial ReviewOverall QMUL recorded a surplus in our first year of reporting under FRS102 of £12.5m, an increase on the prior year’s £10.1m on the same basis.
Total income increased 6% year on year with the largest single contributor to this increase being home and EU tuition fees, reflecting higher student numbers and the continued, though lessening, impact of changes to the UK student funding regime. International tuition fees also increased reflecting growing overseas student numbers.
Other sources of income also increased, notably funding body grants where we were successful in gaining £9.4m of capital grants.
Total expenditure also grew by 5%, mainly due to higher depreciation and other operating expenditure in areas including research grant spend.

Strategic Review (continued)
10 Queen Mary University of London
IncomeThe recurrent grant that the university receives from the Higher Education Funding Council for England (HEFCE) was level year on year as growth in home student numbers and higher capital grants were offset as funding for teaching continued to move from central grants to the student. 2015/16 represented the fourth year of full tuition fees, so that the only impact will have been on the minority of undergraduates who started their fourth year. This recurrent grant now represents 16% of our total income (2014/15 17%).
Across both recurrent and specific grants we received £9.4m in capital funding (2014/15 £5.0m). Highlights here included £4.2m of research funding which is enabling us to renew old research equipment, and £3.8m of Science, Technology, Engineering and Maths (STEM) funding which is supporting a major refurbishment of our engineering building. Under FRS102 this funding is now recorded in the year of receipt rather than being matched against depreciation of funded assets.
Student tuition fees and education contract income grew by £17.4m (10%) driven by the growth in both home and overseas student numbers of 7%. As noted above, we continue to see some benefit here from the introduction of full tuition fees.
The undergraduate student numbers include around 3,100 based in China studying on joint degree programmes run in collaboration with the Beijing University of Post and Telecommunications and Nanchang University, up from 2,800 last year as the Nanchang programme ramps up from its first year in 2013/14.
Research grant and contract income increased by £2.2m (2%); we recorded a third year consecutive of substantial (over 20%) increases in funding from UK industry and commerce, up 25%, in line with our stated aim of diversifying our research income and reducing our dependence on government grants which now represent 21% of the total (2014/15 22%). We also saw a significant increase in income from research councils which include a major award relating to Genomics England.
Other operating income, deriving from sources other than teaching and research, such as student residences, showed an increase of 4% (£1.7m).
Costs59% of total expenditure is staff costs. Excluding the impact of FRS102, the holiday pay accrual and USS and SAUL pension provisions, underlying staff costs increased by £12.1m (6%) which was in line with the increase in staff numbers (up 3%), a general pay award of 1% and an element of incremental drift as staff move up spine points on the pay scales. The increase in staff reflects higher student numbers and research activity. The Higher Education (HE) sector has a widely used benchmark, staff costs as a percentage of income. Underlying staff costs
as a percentage of income excluding FRS102 adjustments and RDEC tax credits fell by 1.0 percentage points to under 58%.
Other operating expenses increased by £14.2m (12%) primarily in academic departments and administration. Depreciation increased by £4.3m (19%) as a result of investment in fixed assets, particularly short life IT software and fixtures, fittings and equipment, which combined saw £22.0m of assets capitalised in the year.
Fixed AssetsThere were £6.3m of intangible asset additions (software) and £50.0m of tangible fixed asset additions in the year.
The largest single spend on estates was on the construction of our new Graduate Centre (also the new home for the School of Economics and Finance) (£22.6m spend in the year) which is set to open in January 2017. Other significant estates projects involved ongoing investment in the Faculty of Science and Engineering with a further £8.4m spent on a major transformation of the engineering building. We are also investing in a major refurbishment of our Maths building. This project was suspended in the year whilst we reconsidered what could be delivered within the scope of the project. This project will resume in 2016/17 with a total budget of nearly £20m. Total spend across IT projects was £9.6m with major ongoing investment in infrastructure and centralisation of schools’ applications into new data centres as well as upgrades to campus wi-fi.
Cash and DebtCash balances ended the year at £17.9m (2014/15 £15.3m). This is in line with what we aim to hold to fund short term operational needs.
Total borrowings for the university and its subsidiaries stood at £113.1m at 31 July 2016, an increase of £15.4m from last year (2014/15 £97.6m) which broadly represents financing for some of our major fixed asset projects such as the Graduate Centre. £109.6m (2014/15 £72.4m) of this borrowing is in bank loans, most of which is at variable interest rates. £54.6m of these loans are long term where repayment of the full amount of the principal is not due for at least 20 years. £38.0m is in loans due to expire on or before 2018 which will be renegotiated dependent on our long term financing needs.
A further £3.5m (2014/15 £25.2m) is in the form of finance leases for equipment to support research and teaching and improvements in the IT infrastructure. Our general policy currently is to reduce the level of leased assets in favour of purchasing them and effectively financing via our bank loans as this provides better value for money.
The university’s short term investment of working cash balances is with an approved list of organisations, all of which are required to have strong, externally rated creditworthiness.

11 Queen Mary University of London
Strategic Review (continued)
Investments and Treasury ManagementEndowment investments stood at £30.3m (2014/15 £30.4m). Our investment manager is Ruffer LLP.
The investment strategy is a single investment approach – an absolute return. This seeks capital preservation, not to lose money on a rolling annual basis and consistent positive returns, significantly greater than the return from cash.
Other Balance Sheet MovementsDebtor balances have increased by £6.8m (+15%) which has been driven by research grant debtors. These are dependent on the timing of awards and payment milestones and can be difficult to predict.
Creditor balances have increased by £20.9m (+10%). Most of this is in borrowings which are discussed above, with an additional £6.2m of research grant creditors which offsets the increase in research grant debtors.
Cash FlowCash balances increased by £2.5m (2014/15 £12.6m decrease). Cash expended on the capital programme is balanced by capital grant receipts and new borrowings so that operating cashflows have effectively financed a reduction in finance lease debt.
Operating ReviewQMUL’s five-year Strategy, which was adopted in 2014/15 following extensive consultation with staff, sets out an appropriately ambitious set of objectives for our institution across the full range of activities that would be expected of a leading university. These objectives are allocated across six broad Strategic Aims and the following sections identify highlights during 2015/16 from each of these areas.
The Indicators of Progress (loP) contained in the Strategy have, where possible and relevant, been benchmarked against the median performance within the Russell Group set of universities. In some instances, it has been appropriate to use the performance of the top ten universities in the UK, where strong performance on a certain measure is not confined to the Russell Group. Some IoPs are not set against a benchmark, commonly where the measure is an internal one and no comparable sector data is available. This report considers performance predominantly in 2015/16, noting that in some instances the most recent data are from 2014/15.
Strategic Aim 1 - PeopleFundamental to our activity is the recruitment and teaching of students of the highest intrinsic talent. Recruitment increased across all levels, with the total number of students enrolled (FTE) increasing to 20,023, a 7% increase on the previous year. There was a particularly pronounced increase in the number of undergraduate students, which was up 9% on 2014/15.
As an institution, we have a proud record of combining a pursuit of international excellence in our academic activities with a strong and longstanding commitment to public engagement and to our local communities. We are proud to note that we have maintained our record of admitting the highest proportion of students from state schools and from the most disadvantaged social backgrounds amongst Russell Group institutions, performing well above our HEFCE benchmark (Charts 1 and 2).
(Note - the triangle mark on the charts refer to the target position. Often these are linked to the benchmark for that particular measure. Internally generated targets are marked in red.)
As well as widening access, we are also committed to widening opportunities for our students and ensuring that they are able to make the most of their talents. QMUL has therefore invested considerably in a range of programmes to enhance the social capital of our students through a broadening of their experience and networks, through initiatives such as internships, projects in the workplace, or through support to develop their own business ideas. Employment outcomes are one marker of success in this area, and we are pleased to note an increase in the number of our students in employment six months after graduating, so that we now exceed our benchmark and are aligned with the Russell Group median (Chart 3).
100%
95%
90%
85%
80%
75%
70%
65%
60%
2011-12 2012-13
QMUL Location adjusted benchmark
2013-14 2014-15 2015-16 2016-17 2017-18 2018-19
Chart 1 - Percentage of Students from State Schools or Colleges
Chart 2 - Percentage of Students from NS-SEC 4-7 (socioeconomic group)50%
40%
30%
20%
10%
0%
2011-12 2012-13
QMUL Location adjusted benchmark
2013-14 2014-15 2015-16 2016-17 2017-18 2018-19
Chart 3 - HESA Employment Indicator - Percentage of Students in Employment or Further Study WIthin Six Months of Graduating
99.0%
97.0%
95.0%
93.0%
91.0%
89.0%
87.0%
85.0%2011-12 2012-13
QMUL HEFCE benchmark for QMUL
Empl
oym
ent i
ndic
ator
RG median
2013-14 2014-15 2015-16 2016-17 2017-18 2018-19
12 Queen Mary University of London
Strategic Review (continued)
We recognise that being in employment is an indicator of achievement but our aspirations for our students extend much further, and we wish to ensure that they are able to maximise their impact on society and pursue an occupation that is commensurate with their talents and interests. We have therefore been working to design a new approach to teaching at undergraduate level, which will aim to significantly broaden the learning experience of our students and equip them for the challenges and complexities of the 21st Century. This new approach will be implemented for students starting their degrees in 2017/18.
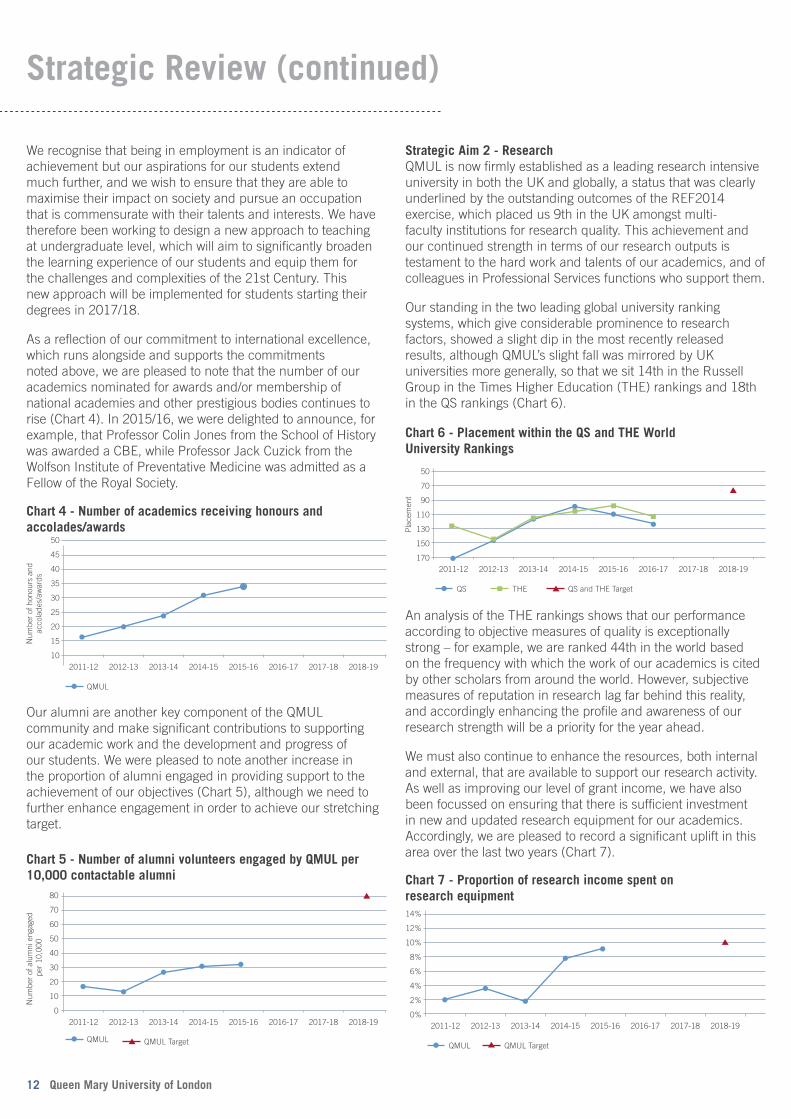
As a reflection of our commitment to international excellence, which runs alongside and supports the commitments noted above, we are pleased to note that the number of our academics nominated for awards and/or membership of national academies and other prestigious bodies continues to rise (Chart 4). In 2015/16, we were delighted to announce, for example, that Professor Colin Jones from the School of History was awarded a CBE, while Professor Jack Cuzick from the Wolfson Institute of Preventative Medicine was admitted as a Fellow of the Royal Society.
Our alumni are another key component of the QMUL community and make significant contributions to supporting our academic work and the development and progress of our students. We were pleased to note another increase in the proportion of alumni engaged in providing support to the achievement of our objectives (Chart 5), although we need to further enhance engagement in order to achieve our stretching target.
Strategic Aim 2 - ResearchQMUL is now firmly established as a leading research intensive university in both the UK and globally, a status that was clearly underlined by the outstanding outcomes of the REF2014 exercise, which placed us 9th in the UK amongst multi-faculty institutions for research quality. This achievement and our continued strength in terms of our research outputs is testament to the hard work and talents of our academics, and of colleagues in Professional Services functions who support them.
Our standing in the two leading global university ranking systems, which give considerable prominence to research factors, showed a slight dip in the most recently released results, although QMUL’s slight fall was mirrored by UK universities more generally, so that we sit 14th in the Russell Group in the Times Higher Education (THE) rankings and 18th in the QS rankings (Chart 6).
An analysis of the THE rankings shows that our performance according to objective measures of quality is exceptionally strong – for example, we are ranked 44th in the world based on the frequency with which the work of our academics is cited by other scholars from around the world. However, subjective measures of reputation in research lag far behind this reality, and accordingly enhancing the profile and awareness of our research strength will be a priority for the year ahead.
We must also continue to enhance the resources, both internal and external, that are available to support our research activity. As well as improving our level of grant income, we have also been focussed on ensuring that there is sufficient investment in new and updated research equipment for our academics. Accordingly, we are pleased to record a significant uplift in this area over the last two years (Chart 7).
Chart 4 - Number of academics receiving honours and accolades/awards
50
45
40
35
30
25
20
15
102011-12 2012-13
QMUL
Num
ber
of h
onou
rs a
nd
acco
lade
s/aw
ards
2013-14 2014-15 2015-16 2016-17 2017-18 2018-19
Chart 5 - Number of alumni volunteers engaged by QMUL per 10,000 contactable alumni
QMUL Target
80
70
60
50
40
30
20
10
02011-12 2012-13
QMUL
Num
ber
of a
lum
ni e
ngag
ed
per
10,
000
2013-14 2014-15 2015-16 2016-17 2017-18 2018-19
Chart 6 - Placement within the QS and THE World University Rankings
50
70
90
110
130
150
1702011-12 2012-13
QS THE
Pla
cem
ent
QS and THE Target
2013-14 2014-15 2015-16 2016-17 2017-18 2018-19
Chart 7 - Proportion of research income spent on research equipment14%
12%
10%
8%
6%
4%
2%
0%2011-12 2012-13
QMUL QMUL Target
2013-14 2014-15 2015-16 2016-17 2017-18 2018-19
13 Queen Mary University of London
Strategic Review (continued)
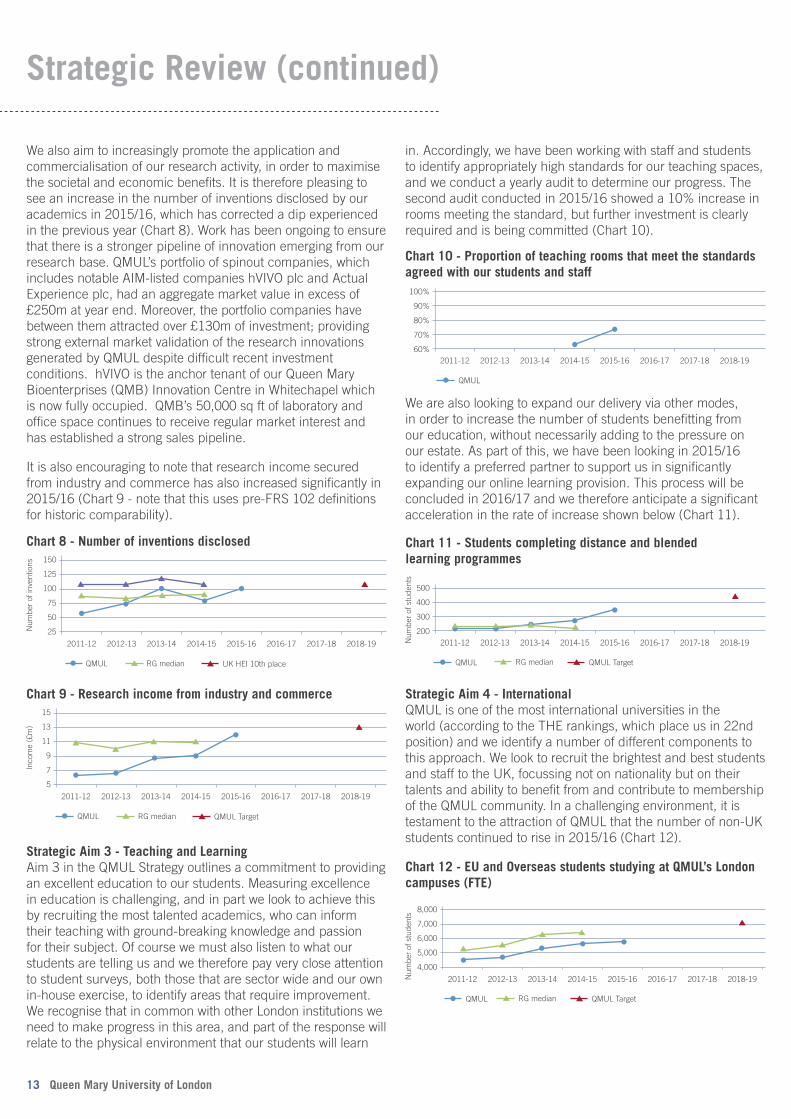
We also aim to increasingly promote the application and commercialisation of our research activity, in order to maximise the societal and economic benefits. It is therefore pleasing to see an increase in the number of inventions disclosed by our academics in 2015/16, which has corrected a dip experienced in the previous year (Chart 8). Work has been ongoing to ensure that there is a stronger pipeline of innovation emerging from our research base. QMUL’s portfolio of spinout companies, which includes notable AIM-listed companies hVIVO plc and Actual Experience plc, had an aggregate market value in excess of £250m at year end. Moreover, the portfolio companies have between them attracted over £130m of investment; providing strong external market validation of the research innovations generated by QMUL despite difficult recent investment conditions. hVIVO is the anchor tenant of our Queen Mary Bioenterprises (QMB) Innovation Centre in Whitechapel which is now fully occupied. QMB’s 50,000 sq ft of laboratory and office space continues to receive regular market interest and has established a strong sales pipeline.
It is also encouraging to note that research income secured from industry and commerce has also increased significantly in 2015/16 (Chart 9 - note that this uses pre-FRS 102 definitions for historic comparability).
Strategic Aim 3 - Teaching and LearningAim 3 in the QMUL Strategy outlines a commitment to providing an excellent education to our students. Measuring excellence in education is challenging, and in part we look to achieve this by recruiting the most talented academics, who can inform their teaching with ground-breaking knowledge and passion for their subject. Of course we must also listen to what our students are telling us and we therefore pay very close attention to student surveys, both those that are sector wide and our own in-house exercise, to identify areas that require improvement. We recognise that in common with other London institutions we need to make progress in this area, and part of the response will relate to the physical environment that our students will learn
We are also looking to expand our delivery via other modes, in order to increase the number of students benefitting from our education, without necessarily adding to the pressure on our estate. As part of this, we have been looking in 2015/16 to identify a preferred partner to support us in significantly expanding our online learning provision. This process will be concluded in 2016/17 and we therefore anticipate a significant acceleration in the rate of increase shown below (Chart 11).
Strategic Aim 4 - InternationalQMUL is one of the most international universities in the world (according to the THE rankings, which place us in 22nd position) and we identify a number of different components to this approach. We look to recruit the brightest and best students and staff to the UK, focussing not on nationality but on their talents and ability to benefit from and contribute to membership of the QMUL community. In a challenging environment, it is testament to the attraction of QMUL that the number of non-UK students continued to rise in 2015/16 (Chart 12).
in. Accordingly, we have been working with staff and students to identify appropriately high standards for our teaching spaces, and we conduct a yearly audit to determine our progress. The second audit conducted in 2015/16 showed a 10% increase in rooms meeting the standard, but further investment is clearly required and is being committed (Chart 10).
Num
ber
of in
vent
ions
UK HEI 10th place
Chart 8 - Number of inventions disclosed150
125
100
75
50
25
2011-12 2012-13
QMUL RG median
2013-14 2014-15 2015-16 2016-17 2017-18 2018-19
Inco
me
(£m
)
QMUL Target
Chart 9 - Research income from industry and commerce15
13
11
9
7
5
2011-12 2012-13
QMUL RG median
2013-14 2014-15 2015-16 2016-17 2017-18 2018-19
Chart 10 - Proportion of teaching rooms that meet the standards agreed with our students and staff100%
90%
80%
70%
60%2011-12 2012-13
QMUL
2013-14 2014-15 2015-16 2016-17 2017-18 2018-19
Chart 11 - Students completing distance and blended learning programmes
500
400
300
2002011-12 2012-13
QMUL
2013-14 2014-15 2015-16 2016-17 2017-18 2018-19Num
ber
of s
tude
nts
QMUL TargetRG median
Chart 12 - EU and Overseas students studying at QMUL’s London campuses (FTE)
8,000
7,000
6,000
5,000
4,000
2011-12 2012-13
QMUL
2013-14 2014-15 2015-16 2016-17 2017-18 2018-19Num
ber
of s
tude
nts
QMUL TargetRG median

14 Queen Mary University of London
Strategic Review (continued)
We also want to encourage our UK students to develop an international perspective and therefore have an aim to double study-related opportunities outside of the UK for London-based students. There was an increase in take up in 2015/16 compared to the previous year but the chart below illustrates that further encouragement is needed if we are to meet our target (Chart 13). We have recently held our first ‘Go Abroad’ fair for students to make them aware of the opportunities and benefits, and we aim to use our new approach to undergraduate teaching to enhance this strand of activity.
We also seek to retain our position as one of the leading exponents of transnational education, built on robust and in-depth partnerships with high quality institutions, which cover not only teaching but also research and innovation activities. Joint provision through these partnerships is built on equal contributions from both sides and a marrying of the strengths of both institutions and their respective national systems. Recruitment in 2015/16 to our existing transnational programmes increased by 13% to over 3,600 students (Chart 14), and there will be recruitment to two new programmes (in Malta and Xi’an, China) from September 2017.
Strategic Aim 5 - Impact and Public EngagementOur national leadership in the field of public engagement has been confirmed by our award of a National Coordinating Centre for Public Engagement ‘Watermark’, in recognition of the embedded nature of the approach at QMUL and the centrality of engagement to our academic endeavour. We are the first UK university to be awarded a Watermark and the frequency with which overseas institutions visit us to discuss engagement is testament to the fact that we have a considerable international as well as national profile.
In order to sustain and further embed our approach to public engagement, we have an aim to increase by 200% (on 2012/13 levels) the number of staff and students attending public
engagement training programmes. We are well on track to achieve this and will look to continue this growth (Chart 15).
Further to our aim to develop the social capital of our students, the Strategy committed us to increase the number of students accessing entrepreneur support services by 100% by 2018/19. We have already exceeded this target and will continue to increase the available support, particularly via partnerships with external partners (Chart 16).
Strategic Aim 6 - Financial StrengthA key objective under this Aim is to improve the level of operating surplus generated by the institution, so that we can sustain investment into our estate and infrastructure to support the ambitions articulated in the Strategy (Chart 17). The operating surplus as a proportion of turnover in 2015/16 was below that of the previous year largely due to loss of RDEC income, but we retain a target to generate £50m cash for investment and our planning processes will be aligned to achieve this, in a way that is in line with our academic objectives and values. Nevertheless, we recognise that in the current climate this is a substantial challenge.
These numbers, shown in the chart below, are based on UK GAAP in order to be presented consistently over time. We intend to adjust this metric to reflect FRS102 in 2016/17’s report when we will have two years of history.
Chart 13 - Number of London-based students who undertake some proportion of their studies and/or work experience outside of the UK
1,100
900
700
500
3002011-12 2012-13
QMUL
2013-14 2014-15 2015-16 2016-17 2017-18 2018-19
Num
ber
of s
tude
nts
QMUL Target
Chart 14 - Number of students studying offshore on QMUL programmes
5,500
4,500
3,500
2,500
1,5002011-12 2012-13
QMUL
2013-14 2014-15 2015-16 2016-17 2017-18 2018-19
Num
ber
of s
tude
nts
QMUL Target
200
150
100
50
02011-12 2012-13
QMUL
2013-14 2014-15 2015-16 2016-17 2017-18 2018-19
Num
ber
of s
taff
an
d st
uden
ts
QMUL Target
Chart 15 - Number of staff and students attending public engagement training courses
Num
ber
of s
tude
nts
QMUL Target
Chart 16 - Number of individual students using entrepreneur support services
375
300
225
150
75
0
2011-12 2012-13
QMUL
2013-14 2014-15 2015-16 2016-17 2017-18 2018-19
RG Median QMUL Target
Chart 17 - Operating surplus as a proportion of turnover
8%
6%
4%
2%
0%
-2%
-4%2011-12 2012-13
QMUL
2013-14 2014-15 2015-16 2016-17 2017-18 2018-19
15 Queen Mary University of London
Strategic Review (continued)
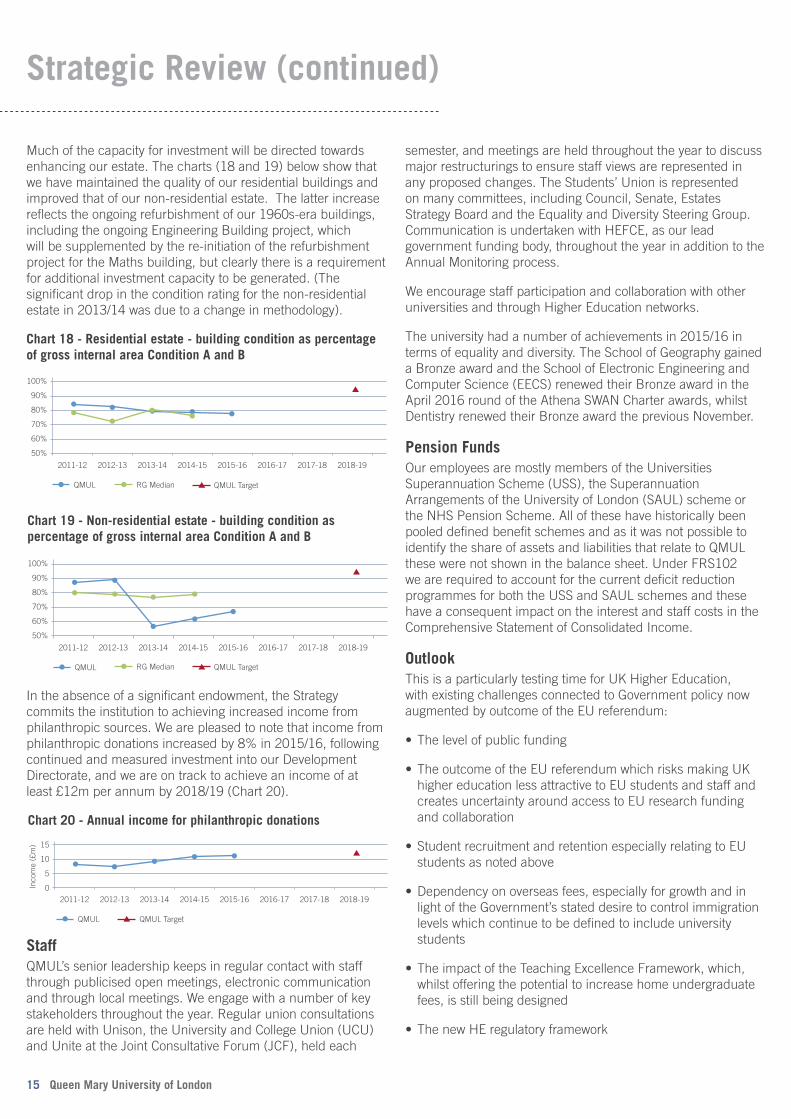
Much of the capacity for investment will be directed towards enhancing our estate. The charts (18 and 19) below show that we have maintained the quality of our residential buildings and improved that of our non-residential estate. The latter increase reflects the ongoing refurbishment of our 1960s-era buildings, including the ongoing Engineering Building project, which will be supplemented by the re-initiation of the refurbishment project for the Maths building, but clearly there is a requirement for additional investment capacity to be generated. (The significant drop in the condition rating for the non-residential estate in 2013/14 was due to a change in methodology).
In the absence of a significant endowment, the Strategy commits the institution to achieving increased income from philanthropic sources. We are pleased to note that income from philanthropic donations increased by 8% in 2015/16, following continued and measured investment into our Development Directorate, and we are on track to achieve an income of at least £12m per annum by 2018/19 (Chart 20).
StaffQMUL’s senior leadership keeps in regular contact with staff through publicised open meetings, electronic communication and through local meetings. We engage with a number of key stakeholders throughout the year. Regular union consultations are held with Unison, the University and College Union (UCU) and Unite at the Joint Consultative Forum (JCF), held each
semester, and meetings are held throughout the year to discuss major restructurings to ensure staff views are represented in any proposed changes. The Students’ Union is represented on many committees, including Council, Senate, Estates Strategy Board and the Equality and Diversity Steering Group. Communication is undertaken with HEFCE, as our lead government funding body, throughout the year in addition to the Annual Monitoring process.
We encourage staff participation and collaboration with other universities and through Higher Education networks.
The university had a number of achievements in 2015/16 in terms of equality and diversity. The School of Geography gained a Bronze award and the School of Electronic Engineering and Computer Science (EECS) renewed their Bronze award in the April 2016 round of the Athena SWAN Charter awards, whilst Dentistry renewed their Bronze award the previous November.
Pension FundsOur employees are mostly members of the Universities Superannuation Scheme (USS), the Superannuation Arrangements of the University of London (SAUL) scheme or the NHS Pension Scheme. All of these have historically been pooled defined benefit schemes and as it was not possible to identify the share of assets and liabilities that relate to QMUL these were not shown in the balance sheet. Under FRS102 we are required to account for the current deficit reduction programmes for both the USS and SAUL schemes and these have a consequent impact on the interest and staff costs in the Comprehensive Statement of Consolidated Income.
OutlookThis is a particularly testing time for UK Higher Education, with existing challenges connected to Government policy now augmented by outcome of the EU referendum:
• Thelevelofpublicfunding
• TheoutcomeoftheEUreferendumwhichrisksmakingUKhigher education less attractive to EU students and staff and creates uncertainty around access to EU research funding and collaboration
• StudentrecruitmentandretentionespeciallyrelatingtoEUstudents as noted above
• Dependencyonoverseasfees,especiallyforgrowthandinlight of the Government’s stated desire to control immigration levels which continue to be defined to include university students
• TheimpactoftheTeachingExcellenceFramework,which,whilst offering the potential to increase home undergraduate fees, is still being designed
• ThenewHEregulatoryframework
QMUL Target
QMUL Target
Chart 18 - Residential estate - building condition as percentageof gross internal area Condition A and B
100%
90%
80%
70%
60%
50%
2011-12 2012-13
QMUL RG Median
RG Median
2013-14 2014-15 2015-16 2016-17 2017-18 2018-19
Chart 19 - Non-residential estate - building condition as percentage of gross internal area Condition A and B
100%
90%
80%
70%
60%
50%
2011-12 2012-13
QMUL
2013-14 2014-15 2015-16 2016-17 2017-18 2018-19
Chart 20 - Annual income for philanthropic donations
15
10
5
02011-12 2012-13
QMUL QMUL Target
2013-14 2014-15 2015-16 2016-17 2017-18 2018-19
Inco
me
(£m
)
16 Queen Mary University of London
Strategic Review (continued)
• Payandpensioncontributions
• Theneedtofundinvestmentsfromdebtfinance
• CompetitionfromprivateHEproviders
These external factors do not and will not alter our fundamental commitments and values as an institution, although they will require us to consider new approaches to achieving our objectives.
We will continue to seek to grow and develop as an institution, recognising that growth in different ways may be more appropriate in the current climate. We will continue to bring forward new initiatives in support of our academic objectives, where these are financially sustainable at an institutional level and on the condition that they are aligned with our values. This will include our ongoing focus on the development of a major Life Sciences centre at Whitechapel, as well as a range of significant projects and new developments across all three Faculties.
There will also be a focus on ensuring that there is sufficient investment capacity to support the delivery of these initiatives and ambitions. We will continue with major refurbishment projects across all our campuses and we will move into our new Graduate Centre in January 2017, which will be a major statement regarding the ambition of the institution.
AuditorsA resolution for the re-appointment of Deloitte LLP as auditors of the university is to be proposed at the Council Meeting.

17 Queen Mary University of London
Statement of Corporate Governance and Internal Control
Purpose of this statement The following statement is provided to enable readers of the Financial Statements of the Group, which comprises the university and its subsidiaries, to obtain a better understanding of the governance, management and legal structure of the university.
QMUL is committed to conducting its business in accordance with the seven principles identified by the Committee on Standards in Public Life. QMUL’s governing body is guided, but not limited, by the Committee of University Chairs’ (CUC) Higher Education Code of Governance issued in 2014. QMUL’s practices are consistent with the provisions of the code.
In addition, QMUL corporately, through its arrangements for governance, is committed in a demonstrable way to the principles of academic freedom and equality of opportunity, which are embodied in its Charter and Ordinances.
Constitution and Governing BodyQueen Mary University of London was established by Act of Parliament and granting of a Royal Charter in 1989 following the merger of Queen Mary College (incorporated by Royal Charter in 1934) and Westfield College (incorporated by Royal Charter in 1933). The Charter has been revised on a number of occasions: 1995 to reflect the merger of Queen Mary with the Barts and the London School of Medicine and Dentistry; 2008, following QMUL’s successful application to the Privy Council for Degree Awarding Powers; July 2010, following a governance review which led to the deletion of the Statutes in their entirety. In 2013 QMUL elected to change its name to Queen Mary University of London and to exercise its degree awarding powers from 2014.
The Charter and Ordinances are the primary governing instruments of QMUL, and are the framework within which the governance structure of the university operates.
The Charter establishes the Council and Senate, each with clearly defined functions and responsibilities detailed in the Ordinances, to oversee and manage QMUL’s activities.
The Council is QMUL’s governing body and is responsible for the strategic oversight of the university. Its specific responsibility includes approval of the financial strategy and securing its assets. The Council comprises a majority of external members whose principal role is to bring independent expertise from a range of sectors and professional spheres and to hold, collectively, the executive to account.
The Chairman of Council is required to be elected from among the external members of the Council. There is provision for the election of members of the academic staff, and representatives of other staff groups, to Council and for a Students’ Union representative. No members of the Council
receive remuneration for their role, apart from staff members and the QMSU sabbatical officer, solely in the context of their employment.
Subject to the overall superintendence of the Council, the Senate has oversight of the academic affairs of QMUL and draws its membership entirely from the academic staff and students, with a majority of elected representatives. It is particularly concerned with issues relating to academic policy, setting and maintaining academic standards, the quality of the student experience and academic freedom.
In accordance with the CUC Higher Education Code of Governance, Council keeps its effectiveness under regular review. A full effectiveness review of Council was undertaken during 2014/15. It concluded that the University may have a high level of confidence in the effectiveness of Council. Its recommendations have now been implemented; the next full review will take place in 2019/20. In addition, members’ opinions on the effectiveness of Council and its committees are sought regularly, whether through an annual survey designed for this purpose, or through individual meetings held with the Chairman each summer.
During 2015/16, an effectiveness review of Senate was undertaken and reported to the Council. Recommendations implemented have included the presentation of extended reports of Senate meetings to the Council.
QMUL maintains a Register of Interests of members of the Council and of members of the executive which is published on the Council and Governance web pages (www.qmul.ac.uk). The register is updated at least annually and includes details of charity trusteeships.
The Role of the President and PrincipalThe President and Principal is appointed by the Council as chief academic and accounting officer to head QMUL. The President and Principal is accountable to the Council for the organisation, direction and management of QMUL. Under the terms of the memorandum of assurance and accountability between QMUL and HEFCE, the President and Principal is the designated officer of QMUL and in that capacity can be summoned to appear before the Public Accounts Committee of the House of Commons.
The President and Principal exercises considerable influence upon the development of QMUL strategy, the identification and planning of new developments and the shaping of the QMUL ethos and values. The President and Principal is assisted in this by the Senior Executive comprising the Vice Principal & Executive Dean (Health), Vice Principal & Executive Dean (Humanities and Social Sciences), Vice Principal & Executive Dean (Science and Engineering), Vice Principal (Student Experience, Teaching and Learning), Vice Principal (Research),
18 Queen Mary University of London
• reviewstheeffectivenessofQMUL’ssystemsforsubmissionof regulatory returns, financial control, value for money, data assurance and responding to alleged financial irregularities;
• reviewstheeffectivenessofmechanismsoperatedbytheSenior Executive for identifying, assessing and mitigating risks;
• overseesQMUL’sPublicInterestDisclosure(whistle-blowing)policy and receives regular reports from the Senior Executive on cases.
The Governance Committee exists, with a majority of external members, to recommend nomination to the committees of the Council and so fulfils the roles and expectations of a nominations committee within the CUC guidance.
The Remuneration Committee is responsible for determining the salaries, emoluments, terms and conditions (and, where appropriate, severance payments) of the President and Principal and members of the Senior Executive. Decisions to change salaries and emoluments are made based on the appropriate benchmark information and a review of performance against previously agreed objectives. It is also responsible for decisions in relation to the salaries, emoluments and terms and conditions (and, where appropriate, severance payments) of other staff when these decisions exceed a threshold which is reviewed and set by Council annually.
On an annual basis the Committee receives reports on the salary profiles, increases and other payments including severance, for all professorial and grade 8 staff to advise with particular regard to Queen Mary’s equality duties and retention and market factors.
The Committee is chaired by the Chairman of Council and has three other lay members; the President and Principal is also a member of the Committee. The Director of Human Resources attends meetings in an advisory capacity. The President and Principal is not present for the discussion of his own remuneration. The Committee meets at least twice each year.
Revised terms of reference for the Remuneration Committee were approved by Council in 2015/16. The new terms of reference provide a clearer definition of the group of staff for whom the Committee has responsibility for determining salaries, ensure consideration of equality and diversity matters are embedded within its operations, and strengthen reporting mechanisms.
The Honorary Degrees and Fellowship Committee makes recommendations to Senate and Council on the conferment of Fellowships and Honorary Degrees of Queen Mary University of London, and the award of the Queen Mary Medal.
19 Queen Mary University of London
Statement of Corporate Governance and Internal Control (continued)
Vice Principal (External Partnerships and Public Engagement), Vice Principal (International), Chief Operating Officer and Chief Strategy Officer.
Committees of Council The Council meets up to six times in each academic year and members are invited to a residential event each year attended by the Senior Executive. The Council has five committees, laid down by Ordinance, to which it delegates much of its detailed work. These committees are the Finance and Investment Committee, the Audit and Risk Committee, the Governance Committee, the Remuneration Committee and the Honorary Degrees and Fellowships Committee. Each of these committees is formally constituted with written terms of reference and specified membership, including a significant proportion of lay members, from whom its Chairman is drawn; each reports regularly to the Council.
Details of membership of the Council and of the Audit and Risk Committee are set out as the final page of these Financial Statements.
The Finance and Investment Committee focuses on oversight of the Senior Executive’s planning and management of the finance, investments and assets of QMUL. It has a particular remit in respect of the following:
• recommendstoCouncilafinancestrategy;
• recommendstoCounciltheannualbudgetsandfinancialforecasts;
• monitorsthefinancialsituationofQMUL,bothcapitalandrevenue;
• advisesCouncilonplansandbudgetsproducedbytheSeniorExecutive for large capital projects;
• considersproposalsaffectingmajorQMULassets,inparticular the estate;
•approvesQMUL’svalueformoneystrategy;
• approvesastrategyforborrowing,investmentoffundsandraising of monies.
The Audit and Risk Committee oversees QMUL’s procedures for external and internal audit, financial control and risk management, and provides assurances in these key areas through its annual report to the Council which is copied to HEFCE. More specifically, the Committee:
• overseesexternalandinternalauditservices,includingreceiving reports and recommendations from both on the results of their work;

An honorary degree may be conferred on a person of conspicuous merit, who is outstanding in their field, commands international or at least national recognition, or who has given exceptional service to QMUL. Fellows of QMUL are elected from persons of distinction or persons who have in the opinion of Council and Senate rendered significant service to QMUL or to the community, or with a demonstrable connection to or affiliation with the institution. A Queen Mary Staff Medal may be awarded to individual members of staff on, or following retirement from employment of QMUL, who in the opinion of Council have made an exceptional, sustained contribution and addition of value to QMUL activities.
Equality and DiversityQMUL is fully committed to fulfilling its duties under the Equality Act 2010 and responsibilities under the Public Sector Equality Duty and has approved the Equality, Diversity and Inclusion (EDI) Strategy & Objectives for 2016-2020. These will support the university in complying with the Equality Act and the Public Sector Equality Duty. A programme of mandatory EDI training is to be introduced during 2016/17 beginning with Unconscious Bias training in November 2016, which was successfully piloted in 2015/16.
The university is proud that all STEMM departments hold either a Bronze or Silver Athena SWAN award to demonstrate their commitment to gender equality. During 2015/16, the School of Geography and the School of Electronic Engineering and Computer Science (EECS) achieved bronze in the latest round of the Athena SWAN Charter awards. QMUL currently holds an institutional bronze award for its achievements, and will be submitting for the silver award at the end of November 2016.
Internal Control and Management of RiskThe Council, as the governing body of QMUL, has responsibility for maintaining a sound system of internal control that supports the achievement of policies, aims and objectives, while safeguarding the public and other funds and assets for which the Council is responsible, in accordance with the responsibilities assigned to the governing body in the Charter and Ordinances and the memorandum of assurance and accountability with HEFCE.
The system of internal control is designed to manage rather than eliminate the risk of failure to achieve policies, aims and objectives; it can therefore only provide reasonable and not absolute assurance of effectiveness.
The system of internal control is based on an ongoing process designed to identify the principal risks; to evaluate the nature and extent of those risks; and to manage them efficiently and effectively.
This process was in place for the year ended 31 July 2016 and up to the date of the approval of the Financial Statements, and accords with HEFCE guidance. The Council has responsibility for reviewing the effectiveness of the system of internal control. The following processes have been established:
• TheCouncilconsiderstheplansandstrategicdirectionoftheuniversity on an annual basis.
• TheAuditandRiskCommitteeindependentlyreviewsthe effectiveness of internal control systems and the risk-management process.
• TheCouncilreceivesperiodicreportsfromtheChairmanof the Audit and Risk Committee concerning issues of risk, internal controls and their effectiveness, which are informed by regular reports from Vice Principals and other managers on the steps they are taking to manage risks in their areas of responsibility, including progress reports on key projects.
• TheAuditandRiskCommitteereportstoCouncilitsfindingsin respect of the effectiveness of the risk-management process. This is informed by the categorisation of risks and the maintenance of an institution-wide strategic risk register.
• QMULprocuresitsinternalauditservicefromKPMG,whichoperates to standards defined in the HEFCE Audit Code of Practice. The work of the internal audit service is informed by an analysis of risks to which QMUL is exposed, and annual internal audit plan is based on this analysis. The Audit and Risk Committee approves the internal audit plan.
• KPMGsubmitsregularreportstotheAuditandRiskCommittee that include an independent opinion on the adequacy and effectiveness of the university’s system of internal control, based on work undertaken in accordance with its approved audit plan, together with recommendations for improvement.
• TheStrategicRiskManagementGrouphasdelegatedresponsibility for strategic risk and risk management processes throughout QMUL. The group works with the Senior Executive to monitor and review the high-level strategic risk register and risk matrix, which documents the impact and likelihood of a risk. The group meets quarterly and provides regular reports on the monitoring of the strategic risk register to the Senior Executive and the Audit and Risk Committee.
• AlongsidetheStrategicRiskRegister,eachFacultyandSchool and Professional Service department maintains its own Risk Register. The Strategic Risk Management group reviews these local registers on a cyclical basis for monitoring purposes and to ensure they are aligned with the Strategic Risk Register.
20 Queen Mary University of London
Statement of Corporate Governance and Internal Control (continued)
• Eachyear,QMULconducts“deepdive”assessmentsofparticular management functions within QMUL or risk groups within the Strategic Risk Register. These assessments explore risk monitoring, links to the Strategic Risk Register and the alignment of risk registers across the institution. During theyearunderreview,“deepdives”includedtheareasofcost control and value for money, emergency planning and business continuity, research impact and innovation.
• Asystemofkeyperformanceandriskindicatorshasbeendeveloped to enable the Council to monitor progress towards the achievement of strategic objectives.
• TheAuditandRiskCommitteereceivesanannualreporton legal compliance. QMUL maintains a legal compliance register, updated during 2015/16 following the commission of an independent report to review the coverage of the register and to advise on forthcoming legislation in the context of the QMUL Strategy 2014. Based on the information received, the Committee was satisfied that QMUL has appropriate processes in place to meet its legal requirements and obligations.
The Council’s full review of the effectiveness of the system of internal control for the year ended 31 July 2016 was informed by the Audit and Risk Committee, the work of the Internal Auditors and the executive managers within the university who have responsibility for the development and maintenance of the internal control framework.
Responsibilities of the CouncilCouncil is responsible for the appointment of the Auditors and approval of the Financial Statements which are prepared in accordance with the Statement of Recommended Practice: Accounting for Further and Higher Education and other relevant accounting standards. In addition, within the terms and conditions of the memorandum of assurance and accountability between HEFCE and the Council of QMUL, the Council, through its designated office holder, the President and Principal, is required to prepare Financial Statements for each financial year which give a true and fair view of the state of affairs of QMUL and of the surplus or deficit and cash flows for that year.
The Financial Statements are adopted by the Council following review by Finance and Investment Committee and on the recommendation of the Audit and Risk Committee after it has received a report from the Auditors.
In causing the Financial Statements to be prepared, the Council is assured that:
• suitableaccountingpoliciesareselectedandappliedconsistently;
• judgementsandestimatesaremadethatarereasonableandprudent;
• applicableaccountingstandardshavebeenfollowed,subjectto any material departures disclosed and explained in the Financial Statements; and
• theFinancialStatementsarepreparedonthegoingconcernbasis unless it is inappropriate to presume that QMUL will continue in operation. The Council is satisfied that it has adequate resources to continue in operation for the foreseeable future; for this reason the going concern basis continues to be adopted in the preparation of the Financial Statements.
So far as the Council is aware, there is no relevant audit information of which QMUL’s Auditors are unaware. Relevant information is defined as information needed by QMUL’s Auditors in connection with preparing their report.
The Council, through its designated officer, the President and Principal, has taken reasonable steps to:
• ensurethatfundsfromHEFCEareusedonlyforthepurposesfor which they have been given and in accordance with the memorandum of assurance and accountability with HEFCE and any other conditions which HEFCE may from time to time prescribe;
• ensurethatthereareappropriatefinancialandmanagementcontrols in place to safeguard public funds and funds from other sources;
• safeguardtheassetsofQMULandpreventanddetectfraud;and
• securetheeconomical,efficientandeffectivemanagementofQMUL’s resources and expenditure.
The key elements of QMUL’s system of internal financial control, designed to discharge these responsibilities include the following:
• cleardefinitionoftheresponsibilitiesof,andtheauthoritydelegated to, heads of academic and administrative departments;
• clearlydefinedandformalisedrequirementsforapprovalandcontrol of expenditure, with investment decisions involving capital or revenue expenditure being subject to formal detailed appraisal and review according to approval levels set by the Council;
21 Queen Mary University of London
Statement of Corporate Governance and Internal Control (continued)
22 Queen Mary University of London
Statement of Corporate Governance and Internal Control (continued)
• comprehensiveFinancialRegulations,detailingfinancialcontrols and procedures, approved by the Finance and Investment Committee under delegated authority from the Council;
• internalauditcarriedoutbyanexternalfirmofauditors.Theprogramme is approved by the Audit and Risk Committee; and
• regularreviewsoffinancialperformanceinvolvingvariancereporting, sensitivity analysis and updates of forecast out-turn.
Council’s review of the effectiveness of the system of internal financial control is informed by the work of the internal auditors, the Audit and Risk Committee, the individual members of staff within the university who have responsibility for the development and maintenance of the financial control framework and comments made by the External Auditors in the management letter and in other reports.
Any system of internal financial control can only provide reasonable, but not absolute, assurance against material misstatement or loss.
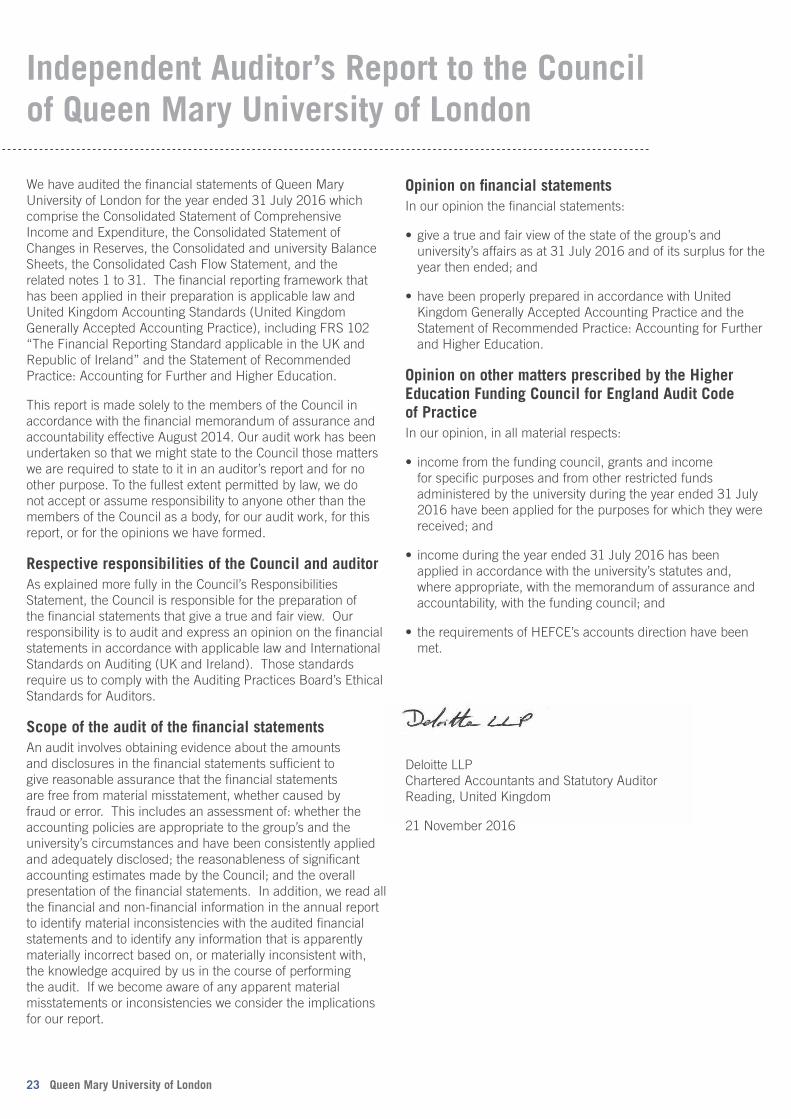
Independent Auditor’s Report to the Council of Queen Mary University of London
We have audited the financial statements of Queen Mary University of London for the year ended 31 July 2016 which comprise the Consolidated Statement of Comprehensive Income and Expenditure, the Consolidated Statement of Changes in Reserves, the Consolidated and university Balance Sheets, the Consolidated Cash Flow Statement, and the related notes 1 to 31. The financial reporting framework that has been applied in their preparation is applicable law and United Kingdom Accounting Standards (United Kingdom Generally Accepted Accounting Practice), including FRS 102 “TheFinancialReportingStandardapplicableintheUKandRepublicofIreland”andtheStatementofRecommendedPractice: Accounting for Further and Higher Education.
This report is made solely to the members of the Council in accordance with the financial memorandum of assurance and accountability effective August 2014. Our audit work has been undertaken so that we might state to the Council those matters we are required to state to it in an auditor’s report and for no other purpose. To the fullest extent permitted by law, we do not accept or assume responsibility to anyone other than the members of the Council as a body, for our audit work, for this report, or for the opinions we have formed.
Respective responsibilities of the Council and auditorAs explained more fully in the Council’s Responsibilities Statement, the Council is responsible for the preparation of the financial statements that give a true and fair view. Our responsibility is to audit and express an opinion on the financial statements in accordance with applicable law and International Standards on Auditing (UK and Ireland). Those standards require us to comply with the Auditing Practices Board’s Ethical Standards for Auditors.
Scope of the audit of the financial statementsAn audit involves obtaining evidence about the amounts and disclosures in the financial statements sufficient to give reasonable assurance that the financial statements are free from material misstatement, whether caused by fraud or error. This includes an assessment of: whether the accounting policies are appropriate to the group’s and the university’s circumstances and have been consistently applied and adequately disclosed; the reasonableness of significant accounting estimates made by the Council; and the overall presentation of the financial statements. In addition, we read all the financial and non-financial information in the annual report to identify material inconsistencies with the audited financial statements and to identify any information that is apparently materially incorrect based on, or materially inconsistent with, the knowledge acquired by us in the course of performing the audit. If we become aware of any apparent material misstatements or inconsistencies we consider the implications for our report.
Opinion on financial statementsIn our opinion the financial statements:
• giveatrueandfairviewofthestateofthegroup’sanduniversity’s affairs as at 31 July 2016 and of its surplus for the year then ended; and
• havebeenproperlypreparedinaccordancewithUnitedKingdom Generally Accepted Accounting Practice and the Statement of Recommended Practice: Accounting for Further and Higher Education.
Opinion on other matters prescribed by the Higher Education Funding Council for England Audit Code of PracticeIn our opinion, in all material respects:
• incomefromthefundingcouncil,grantsandincomefor specific purposes and from other restricted funds administered by the university during the year ended 31 July 2016 have been applied for the purposes for which they were received; and
• incomeduringtheyearended31July2016hasbeenapplied in accordance with the university’s statutes and, where appropriate, with the memorandum of assurance and accountability, with the funding council; and
• therequirementsofHEFCE’saccountsdirectionhavebeenmet.
Deloitte LLP Chartered Accountants and Statutory Auditor Reading, United Kingdom
21 November 2016
23 Queen Mary University of London

24 Queen Mary University of London

Consolidated Statement of Comprehensive Income and Expenditure Year ended 31 July 2016
25 Queen Mary University of London
Year ended 31 July 2016 Year ended 31 July 2015Notes Consolidated QMUL Consolidated QMUL
£’000 £’000 £’000 £’000 Income
Tuition fees and education contracts 2 184,277 184,277 166,904 166,904 Funding body grants 3 73,762 73,762 70,388 70,388 Research grants and contracts 4 101,483 101,049 99,243 98,859 Other income 5 42,917 41,643 41,171 40,212 Investment income 6 732 1,420 713 1,394
Total income before endowments and donations 403,171 402,151 378,419 377,757
Donations and endowments 7 2,322 2,165 2,658 2,524
Total income 405,493 404,316 381,077 380,281
Expenditure
Staff costs 8 232,062 231,667 230,663 230,312 Other operating expenses 131,000 130,978 116,807 117,778 Depreciation and amortisation 12,13 26,373 25,581 22,121 21,375 Interest and other finance costs 9 3,584 2,719 2,960 2,067
Total expenditure 10 393,019 390,945 372,551 371,532
Surplus before other gains losses and share of operating surplus/(deficit) of associates
12,474 13,371 8,526 8,749
Gain on investments 429 727 3,919 3,941 Share of operating surplus/(deficit) in associate - - ( 5) -
Surplus before tax 12,903 14,098 12,440 12,690
Taxation 11 ( 389) ( 386) ( 2,321) ( 2,318)
Surplus for the year 12,514 13,712 10,119 10,372 (Loss)/Gain on associate 15 ( 12) - 19 -Actuarial (loss) in respect of pension schemes 28 ( 462) ( 462) ( 84) ( 84)
Total comprehensive income for the year 12,040 13,250 10,054 10,288 Represented by: Endowment comprehensive income for the year ( 96) ( 96) 2,137 2,122 Restricted comprehensive income for the year ( 414) ( 435) ( 1,128) ( 1,129) Unrestricted comprehensive income for the year 12,550 13,781 9,045 9,295
Attributable to QMUL 12,040 13,250 10,054 10,288 Attributable to the non-controlling interest - - - -
12,040 13,250 10,054 10,288
Surplus for the year attributable to: Non controlling interest - - - - QMUL 12,514 13,712 10,119 10,372
All items of income and expenditure relate to continuing activities
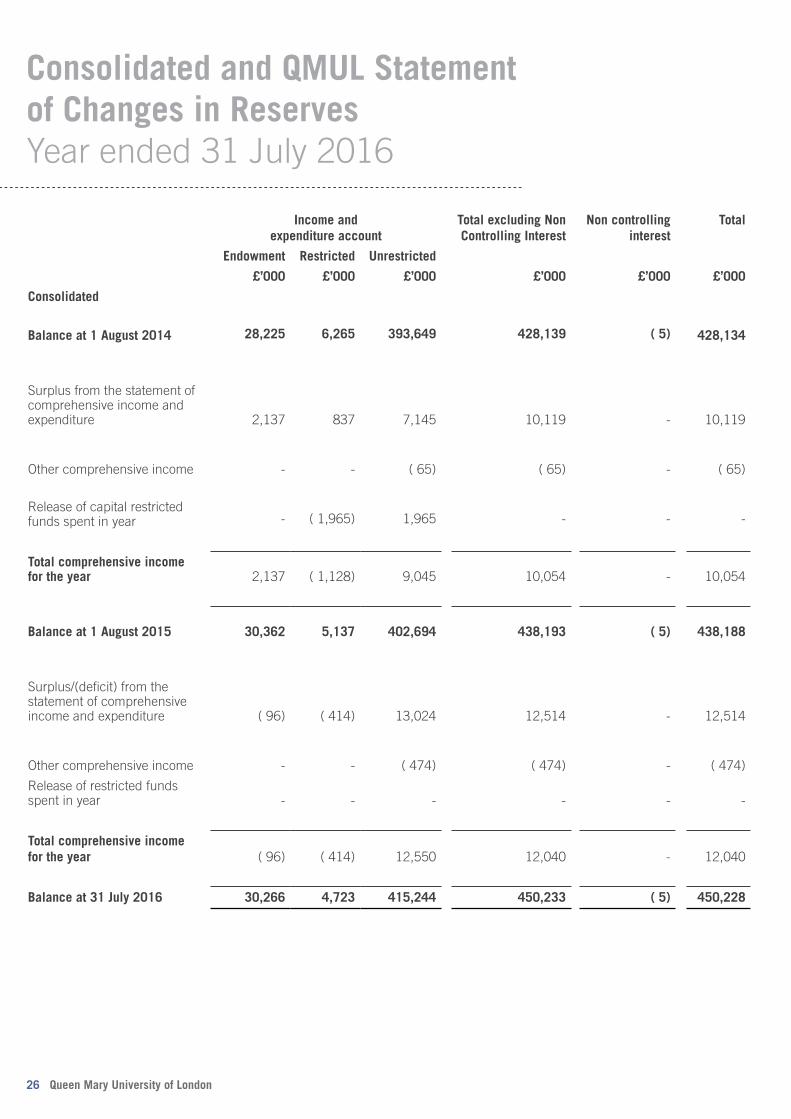
Income and expenditure account
Total excluding Non Controlling Interest
Non controlling interest
Total
Endowment Restricted Unrestricted
£’000 £’000 £’000 £’000 £’000 £’000
Consolidated
Balance at 1 August 2014
28,225
6,265
393,649
428,139
( 5) 428,134
Surplus from the statement of comprehensive income and expenditure
2,137
837
7,145
10,119
-
10,119
Other comprehensive income
-
-
( 65)
( 65)
-
( 65)
Release of capital restricted funds spent in year
-
( 1,965)
1,965
-
-
-
Total comprehensive income for the year
2,137
( 1,128)
9,045
10,054
- 10,054
Balance at 1 August 2015
30,362
5,137
402,694
438,193
( 5) 438,188
Surplus/(deficit) from the statement of comprehensive income and expenditure
( 96)
( 414)
13,024
12,514
-
12,514
Other comprehensive income
-
-
( 474)
( 474)
-
( 474)
Release of restricted funds spent in year
-
-
-
-
-
-
Total comprehensive income for the year ( 96) ( 414) 12,550 12,040 - 12,040
Balance at 31 July 2016 30,266 4,723 415,244 450,233 ( 5) 450,228
26 Queen Mary University of London
Consolidated and QMUL Statement of Changes in Reserves Year ended 31 July 2016

27 Queen Mary University of London
Consolidated and QMUL Statement of Changes in Reserves (continued) Year ended 31 July 2016
Income and expenditure account Total excluding Non Controlling Interest
Non controlling interest
Total
Endowment Restricted Unrestricted
£’000 £’000 £’000 £’000 £’000 £’000
QMUL
Balance at 1 August 2014
28,225
6,007
394,901
429,133 - 429,133
Surplus from the statement of comprehensive income and expenditure
2,122
836
7,414
10,372
-
10,372
Other comprehensive income
-
-
( 84)
( 84)
-
( 84)
Release of capital restricted funds spent in year
-
( 1,965)
1,965
-
-
-
Total comprehensive income for the year
2,122
( 1,129)
9,295
10,288
- 10,288
Balance at 1 August 2015
30,347
4,878
404,196
439,421
- 439,421
Surplus/(deficit) from the statement of comprehensive income and expenditure
( 96)
( 435)
14,243
13,712
-
13,712
Other comprehensive income
-
-
( 462)
( 462)
-
( 462)
Release of restricted funds spent in year
-
-
-
-
-
-
Total comprehensive income for the year
( 96)
( 435)
13,781
13,250
- 13,250
Balance at 31 July 2016 30,251 4,443 417,977 452,671 - 452,671

Consolidated and QMUL Balance Sheet As at 31 July 2016
28 Queen Mary University of London
As at 31 July 2016 As at 31 July 2015Notes Consolidated QMUL Consolidated QMUL
£’000 £’000 £’000 £’000 Non-current assetsIntangible assets 12 13,631 13,631 9,458 9,458 Fixed assets 13 585,188 572,027 559,405 545,451 Investments 14 37,375 40,355 38,750 41,431 Investments in associates 15 58 1 70 1
636,252 626,014 607,683 596,341
Current assetsStock 205 205 232 232 Trade and other receivables 16 51,780 51,835 44,987 44,845 Investments 17 10,657 10,657 10,770 10,770 Cash and cash equivalents 23 17,876 15,369 15,338 13,139
80,518 78,066 71,327 68,986 Less: Creditors: amounts falling due within one year 18 ( 124,808) ( 126,721) ( 115,789) ( 117,855)
Net current (liabilities) ( 44,290) ( 48,655) ( 44,462) ( 48,869)
Total assets less current liabilities 591,962 577,359 563,221 547,472
Creditors: amounts falling due after more than one year 19 ( 98,190) ( 81,144) ( 86,308) ( 69,327)
ProvisionsPension provisions 20 ( 43,519) ( 43,519) ( 38,725) ( 38,725)Other provisions 20 ( 25) ( 25) - -
Total net assets 450,228 452,671 438,188 439,420
Restricted Reserves Income and expenditure reserve - endowment reserve 21 30,267 30,252 30,363 30,348 Income and expenditure reserve - restricted reserve 22 4,723 4,443 5,137 4,877 Unrestricted ReservesIncome and expenditure reserve - unrestricted 415,243 417,976 402,693 404,195
450,233 452,671 438,193 439,420 Non-controlling interest ( 5) - ( 5) - Total Reserves 450,228 452,671 438,188 439,420
The financial statements were approved by Council on 21 November 2016 and were signed on its behalf on that date by:
Sir N Montagu, Chairman Professor S Gaskell, President and Principal

29 Queen Mary University of London

Consolidated Cash Flow Year ended 31 July 2016
30 Queen Mary University of London
Notes Year ended 31 July 2016 Year ended 31 July 2015£’000 £’000
Cash flow from operating activitiesSurplus for the year 12,513 10,120 Adjustment for non-cash itemsDepreciation 13 24,234 20,471 Amortisation of intangible assets 12 2,140 1,650 (Gain) on investments ( 429) ( 3,919)Decrease/(increase) in stock 27 ( 44)(Increase) in debtors 16 ( 6,982) ( 4,975)(Decrease)/increase in short-term creditors 18 ( 6,683) 26,314 Increase/(decrease) in long-term creditors 19 11,818 ( 17,317)Increase in pension provision 20 4,793 18,826 Increase in other provisions 20 25 - Actuarial (loss) in respect of pension schemes ( 462) ( 84)Share of operating deficit in associate 15 - 5
Adjustment for investing or financing activitiesInvestment income 6 ( 732) ( 1,394)Interest payable 9 3,584 2,067 Endowment income 7 ( 47) ( 66)Negative goodwill written off - ( 518)Capital grant income ( 18,083) ( 11,940)Net cash inflow from operating activities 25,716 39,196
Cash flows from investing activitiesCapital grants receipts 18,083 11,940 Disposal of non-current asset investments 1,018 929 Withdrawal of deposits 7,857 14,800 Investment income 732 1,394 Payments made to acquire fixed assets ( 50,017) ( 46,379)Payments made to acquire intangible assets ( 6,312) ( 4,233)New deposits ( 6,959) ( 15,932)
( 35,598) ( 37,481)
Cash flows from financing activitiesInterest paid ( 3,862) ( 2,425)Interest element of finance lease payments 278 358 Endowment cash received 47 66 New unsecured loans 38,000 - Repayments of amounts borrowed ( 849) ( 802)Capital element of finance lease payments ( 21,194) ( 11,514)
12,420 ( 14,317)Increase/(decrease) in cash and cash equivalents in the year 2,538 ( 12,602)
Cash and cash equivalents at beginning of the year 15,338 27,940 Cash and cash equivalents at end of the year 17,876 15,338
23 2,538 ( 12,602)
31 Queen Mary University of London

Notes to the Financial Statements
1. Accounting Policies
Basis of preparation These financial statements have been prepared on a going concern basis and in accordance with the Statement of Recommended Practice (SORP): Accounting for Further and Higher Education 2015 and in accordance with Financial Reporting Standards (FRS 102). QMUL is a public benefit entity and therefore has applied the relevant public benefit requirement of FRS 102. The financial statements are prepared in accordance with the historical cost convention, modified by the revaluation of fixed assets.
Basis of consolidation The consolidated financial statements include QMUL and all its subsidiaries for the financial year to 31 July 2016. Intra-group transactions are eliminated on consolidation. The consolidated financial statements do not include the income and expenditure of the Students’ Union as QMUL does not exert control or dominant influence over policy decisions. Associated companies and joint ventures are accounted for using the equity method.
Income recognition i. Income from the sale of goods or services is credited to
the Consolidated Statement of Comprehensive Income and Expenditure when the goods or services are supplied to the external customers or the terms of the contract have been satisfied.
ii. Fee income is credited to the Consolidated Statement of Comprehensive Income and Expenditure over the period in which students are studying. Where the amount of the tuition fee is reduced by a prompt payment discount, a fee waiver or scholarships which reduce the tuition fee payable, the net amount is taken to income. Where bursaries and student support payments are customarily made, income receivable is stated net of the payments. All other bursaries and student support payments are accounted for gross as expenditure and not deducted from income.
iii. Grant funding including funding body grants, research and other grants from government and non government sources are recognised as income when QMUL is entitled to it and the performance related conditions have been met. Income received in advance of performance related conditions being met is recognised as deferred income within creditors on the balance sheet and released to income as the conditions are met.
iv. Donations and endowments are recognised in income when QMUL is entitled to the funds. Income from donations with donor imposed restrictions is retained within the restricted or endowment reserve until such time that it is utilised in line with the restrictions when the income is released to general reserves through a reserve transfer. Donations with no restrictions are recognised in income when QMUL is entitled to the funds and retained within unrestricted reserves.
There are four main types of donations and endowments identified within reserves:
a. Restricted donations - the donor has specified that the donation must be used for a particular objective.
b. Unrestricted permanent endowments - the donor has specified that the fund is to be permanently invested to generate an income for the general purposes of QMUL.
c. Restricted expendable endowments - the donor has specified a particular objective other than the purchase or construction of tangible fixed assets, and QMUL has the power to use the capital.
d. Restricted permanent endowments - the donor has specified that the fund is to be permanently invested to generate an income stream to be applied to a particular objective.
v. Investment income is credited to the Consolidated Statement of Comprehensive Income and Expenditure on a receivable basis as restricted or unrestricted income according to the terms of the donation or endowment.
vi. Increases or decreases in value arising on the revaluation or disposal of fixed asset investments are added to or subtracted from the investment concerned and recognised in the Consolidated Statement of Comprehensive Income and Expenditure.
vii. Capital grants are recognised in income when QMUL is entitled to the funds subject to any performance related conditions being met. Where grant funded assets are in the course of construction, we consider on a case by case basis whether their construction constitutes a performance related condition. In the event that it does, income will be recognised as the expenditure to complete the asset is incurred.
viii. Funds QMUL receives and disburses as paying agent on behalf of a funding body are excluded from the income and expenditure of QMUL where QMUL is exposed to minimal risk or enjoys minimal economic benefit related to the transaction.
Employment benefits
Short term employment benefits such as salaries and compensated absences are recognised as an expense in the year in which the employees render service to QMUL. Any unused benefits are accrued and measured as the additional amount QMUL expects to pay as a result of the unused entitlement.
Accounting for retirement benefits
As described in note 28, QMUL is a member of three defined benefit pension schemes: the Superannuation Arrangements of the University of London (SAUL), the Universities
32 Queen Mary University of London
Superannuation Scheme (USS), and the NHS Public Service Scheme (NHS). QMUL also operates a closed defined benefit pension scheme for former non-teaching staff of the London Hospital and St Bartholomew’s Hospital medical colleges.
The SAUL and USS schemes are defined benefit schemes which are externally funded and are valued every three years by professionally qualified independent actuaries. Both SAUL and USS are multi-employer schemes for which it is not possible to identify the assets and liabilities applying to QMUL’s membership due to the mutual nature of the scheme and therefore these schemes are accounted for as a defined contribution scheme. Contributions to the scheme are recognised as an expense in the Consolidated Statement of Comprehensive Income and Expenditure in the periods during which services are rendered by employees. In addition, a liability is recorded in the Consolidated Statement of Comprehensive Income and Expenditure when a contractual commitment to fund past deficits is made. The liability is held within provisions and released to expenditure to decrease pension payments made over the term of the commitment.
The NHS pension scheme is an unfunded multi-employer scheme. Contributions to the scheme are recognised as an expense in the Consolidated Statement of Comprehensive Income and Expenditure in the periods during which services are rendered by employees on the basis of contributions payable.
London Hospital and St Bartholomew’s Hospital medical colleges pension scheme is a defined benefit plan. QMUL has an obligation is to provide the agreed benefits to former employees, and actuarial risk (that benefits will cost more or less than expected) and investment risk (that returns on assets set aside to fund the benefits will differ from expectations) are borne, in substance, by QMUL. QMUL recognises a liability for its obligations under defined benefit plans net of plan assets. This net defined benefit liability is measured as the estimated amount of benefit that employees have earned in return for their service in prior periods, discounted to determine its present value, less the fair value (at bid price) of plan assets. The calculation is performed by a qualified actuary using the projected unit credit method. Where the calculation results in a net asset, recognition of the asset is limited to the extent to which QMUL is able to recover the surplus through refunds from the plan.
Finance Leases Leases in which QMUL assumes substantially all the risks and rewards of ownership of the leased asset are classified as finance leases. Leased assets acquired by way of finance lease and the corresponding lease liabilities are initially recognised at an amount equal to the lower of their fair value and the present value of the minimum lease payments at inception of the lease. Minimum lease payments are apportioned between the finance charge and the reduction of the outstanding liability. The finance charge is allocated to each period during the lease
term so as to produce a constant periodic rate of interest on the remaining balance of the liability.
Operating leases Costs in respect of operating leases are charged on a straight-line basis over the lease term. Any lease premiums or incentives are spread over the minimum lease term.
Foreign currencyTransactions denominated in foreign currencies are recorded at the rate of exchange ruling at the dates of the transactions. Monetary assets and liabilities in foreign currencies are translated into sterling at the rates of exchange ruling at the balance sheet date. Exchange differences arising have been included in the Consolidated Statement of Comprehensive Income and Expenditure.
The assets and liabilities of foreign operations, arising on consolidation, are translated into sterling at the rate of exchange at the balance sheet date. The revenues and expenses of foreign operations are translated at an average rate for the year where this rate approximates to the foreign exchange rates ruling at the dates of the transactions. Exchange differences arising from this translation of foreign operations are reported in the Consolidated Statement of Comprehensive Income and Expenditure.
Intangible assetsIntangible assets are stated at cost or at impaired value. Where it is considered that there has been any impairment in the value of an asset, the difference between the carrying value and the higher of its net realisable value or value in use is expensed in the Consolidated Statement of Comprehensive Income and Expenditure.
Third party software and the costs associated with its implementation costing less than £10,000 per individual item or group of related items is written off in the year of acquisition. All other costs are amortised over 3-8 years, the period of its estimated useful life.
Fixed assetsFixed assets are stated at cost or deemed cost less accumulated depreciation. Cost includes the original purchase price of the asset and the costs attributable to bringing the asset to its working condition for intended use. Where parts of a fixed asset have different useful lives, they are accounted for as separate items of fixed assets.
Land and buildings were revalued to fair value on 31 July 2014. QMUL has taken advantage of the transitional arrangements in FRS 102 to apply this valuation as deemed cost but not to adopt a valuation policy going forward. Additions to land and buildings since 1 August 2014 have been at cost.
i. Buildings are depreciated over 50 years. Depreciation on leased buildings is calculated over the life of the lease if the lease is less than 50 years. No provision for depreciation is made against the value of land.
33 Queen Mary University of London
Notes to the Financial Statements (continued)
1. Accounting Policies (continued)
ii. Assets in the course of construction are stated at cost and are not depreciated until they are transferred to the completed asset class when ready for use.
iii. Freehold improvement works are depreciated over 20-40 years.
iv. Leasehold improvement works are depreciated over 20-40 years or the term of the lease if shorter.
v. Plant & Machinery is depreciated over 15 years.
vi. Fixtures & Fittings are depreciated over 10 years.
vii. Equipment is depreciated over 3-8 years.
viii. Plant & Machinery, Equipment and Fixtures & Fittings costing less than £10,000 per individual item or group of related items is written off in the year of acquisition. All other items are capitalised.
ix. Where assets are acquired with the aid of specific grants they are capitalised and depreciated over the shorter of the term of the grant or the depreciation terms as set out above.
x. Assets held under finance leases are depreciated over the period of the finance lease or the depreciation terms as set out above whichever is shorter.
xi. Improvements to properties held under short leases are depreciated over the life of the lease.
xii. Expenditure on an asset after it is purchased is capitalised when the expected future benefits from that asset as a result of the expenditure are greater than those previously assessed.
xiii. Where it is considered that there has been any impairment in the value of an asset, the difference between the carrying value and the higher of its net realisable value or value in use is expensed in the Consolidated Statement of Comprehensive Income and Expenditure. Circumstances which could give rise to an impairment are reviewed annually.
xiv. QMUL owns heritage assets, none of which either individually or collectively are material to these Financial Statements, which have not been capitalised.
xv. Expenditure to ensure that a tangible fixed asset maintains its previously recognised standard of performance is recognised in the Consolidated Statement of Comprehensive Income and Expenditure in the year it is incurred. QMUL has a planned maintenance programme which is reviewed annually.
Investmentsi. Investments in associates and subsidiaries are shown at the
lower of cost or net realisable value.
ii. Associate undertakings are shown at QMUL’s attributable share of net assets in the Consolidated Balance sheet.
iii. Listed investments held for the benefit of the endowment portfolio are shown at market valuation with movements recognised in the Consolidated Statement of Comprehensive Income and Expenditure.
iv. Shares held in other fixed asset investments are initially held at their transaction price. Thereafter, they are measured at fair value through the Consolidated Statement of Comprehensive Income and Expenditure except for those equity investments that are not publicly traded and whose fair value cannot otherwise be measured reliably which are recognised at cost less impairment until a reliable measure of fair value becomes available. If a reliable measure of fair value is no longer available, the equity instrument’s fair value on the last date the instrument was reliably measurable is treated as the cost of the instrument.
v. Current asset investments are held at fair value with movements recognised in the Consolidated Statement of Comprehensive Income and Expenditure.
StockStock is valued on a first in first out basis and stated at the lower of cost and net realisable value. Included in the valuation are stocks in the refectories and central and departmental stores. An annual review is undertaken of slow moving, obsolete and defective stock and the difference between the carrying value and the higher of its net realisable value or value in use is expensed in the Consolidated Statement of Comprehensive Income and Expenditure.
Cash and cash equivalentsCash includes cash in hand, deposits repayable on demand and overdrafts. Deposits are repayable on demand if they are in practice available within 24 hours without penalty. Cash equivalents are short term, highly liquid investments, typically with a maturity of up to 3 months from the initial investment, that are readily convertible to known amounts of cash with insignificant risk of change in value.
Provisions Provisions are recognised in the financial statements when:
i. QMUL has a present obligation (legal or constructive) as a result of a past event;
ii. it is probable that an outflow of economic benefits will be required to settle the obligation; and
iii. a reliable estimate can be made of the amount of the obligation.
The amount recognised as a provision is determined by discounting the expected future cash flows at a pre-tax rate that reflects risks specific to the liability.
34 Queen Mary University of London
Notes to the Financial Statements (continued)
1. Accounting Policies (continued)
Contingent LiabilitiesA contingent liability arises from a past event that gives QMUL a possible obligation whose existence will only be confirmed by the occurrence or otherwise of uncertain future events not wholly within the control of QMUL or where it is not probable that an outflow of resources will be required or the amount of the obligation cannot be measured reliably.
Contingent liabilities are not recognised in the Balance Sheet but are disclosed in the notes.
Accounting for Intercompany LoansQMUL accounts for intercompany loans using the accounting treatment for public benefit entities in Section 34 of FRS102.
Accounting for Jointly Controlled Operations QMUL accounts for its share of transactions from joint operations in the Consolidated Statement of Comprehensive Income and Expenditure.
TaxationQMUL is an exempt charity within the meaning of Schedule 3 of the Charities Act 2011 and is considered to pass the tests set out in Paragraph 1 Schedule 6 Finance Act 2010 and therefore meets the definition of a charity for corporation tax purposes. Accordingly, QMUL is potentially exempt from tax in respect of income or capital gains received within categories covered by Sections 478-488 CTA 2010 or Section 256 of the Taxation of Chargeable Gains Act 1992 to the extent that such income or gains are applied to exclusively charitable purposes. QMUL is registered for Value Added Tax (VAT) but is unable to recover input tax incurred on the majority of its expenditure, most education and research being exempt or outside the scope activities under VAT legislation. Irrecoverable VAT is included in the cost of the goods or service.
ReservesReserves are classified as restricted or unrestricted.
i. The restricted endowment reserves comprises endowments made to QMUL where the donor has specified that the fund is to be permanently invested to generate an income stream to be applied to a specific purpose.
ii. The restricted reserves include balances where the donor has designated a specific purpose and therefore QMUL is restricted in the use of these funds.
Transition to 2015 SORPQMUL is preparing its financial statements in accordance with FRS 102 for the first time and consequently has applied the first time adoption requirements. An explanation of how the transition to Statement of Recommended Practice: Accounting for Further and Higher Education 2015 has affected the reported financial position, financial performance and cash flows of the consolidated results of QMUL is provided in note 29.
Application of first time adoption grants certain exemption from the full requirements of the Statement of Recommended
Practice: Accounting for Further and Higher Education 2015 in the transition period. QMUL has taken advantage of this exemption to revalue land and buildings on first adoption and apply this valuation as deemed cost.
Accounting Estimates and JudgmentsThe following are the critical judgements that the group has made in the process of applying the accounting policies and that have the most significant effect on the amounts recognised in the financial statements.
i. Pension provision assumptions. The rate used to discount future contributions to the SAUL and USS deficit recovery programmes at the balance sheet date reflects the yield on high quality corporate bonds consistent with the currency and estimated period of the future payments. The rates used are based on work commissioned by the British Universities’ Finance Directors’ Group (BUFDG) from Mercer for the HE sector as a whole. The other assumptions used for calculation of the provisions are the estimated salary inflation in future years and estimated changes in number of staff who are members of the respective pension schemes in future years. These are both consistent with our internal financial forecasting assumptions.
ii. Valuation of unquoted investments. The group is required to make appropriate judgments to derive the value of unquoted equity investments. Where available, the judgment is based on recent equity transactions entered into by the respective investment companies as these would represent the clearest indication of their fair value. Such equity transactions would include the issue of new shares by the investment company or the investment company entering in to a convertible debt agreement with a fixed share price. Where recent equity transactions are not available then the investments are held at cost less impairment.
iii. Valuation of land and buildings for deemed cost. The group’s land and buildings were valued at 31 July 2014 by JLL, an external valuer, in accordance with RICS Valuation - Professional Standards. JLL were provided with the following information and reports which they relied upon in preparing their valuation:
•Leaseinformationforthosepropertieswithintheportfolioheld leasehold; and
•Floorareasandplans.
All significant parts of the properties were inspected by surveyors employed by JLL.
iv. Estimation of doubtful debts. The group is required to make judgments about the recoverability of its debtor balances and to make provision for doubtful debts as appropriate. The estimates and associated assumptions are based on historical experience and other factors that are considered to be relevant. In making its judgment, QMUL has considered the recoverability of the loan to its subsidiary Queen Mary Bioenterprises Limited. Due to Queen Mary Bioenterprises Limited net liability position, QMUL has fully provided for the amount due from the subsidiary.
35 Queen Mary University of London
Notes to the Financial Statements (continued)
1. Accounting Policies (continued)
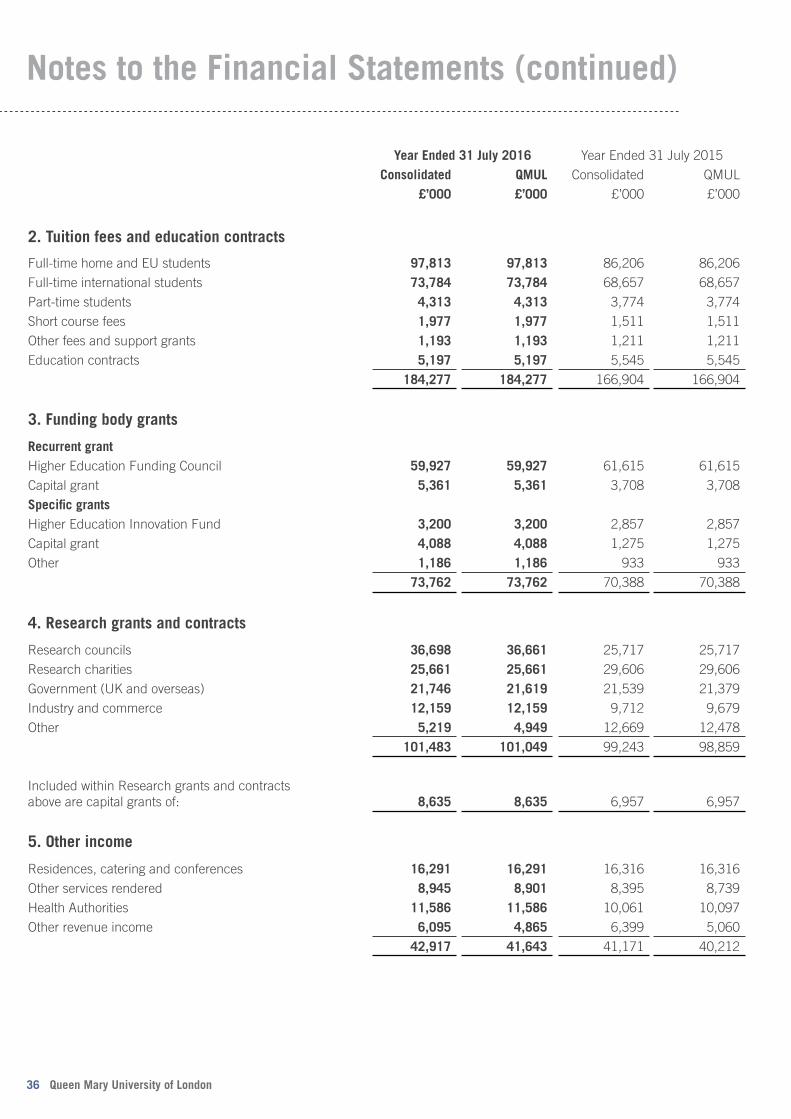
36 Queen Mary University of London
Notes to the Financial Statements (continued)
Year Ended 31 July 2016 Year Ended 31 July 2015
Consolidated QMUL Consolidated QMUL
£’000 £’000 £’000 £’000
2. Tuition fees and education contracts
Full-time home and EU students 97,813 97,813 86,206 86,206
Full-time international students 73,784 73,784 68,657 68,657
Part-time students 4,313 4,313 3,774 3,774
Short course fees 1,977 1,977 1,511 1,511
Other fees and support grants 1,193 1,193 1,211 1,211
Education contracts 5,197 5,197 5,545 5,545
184,277 184,277 166,904 166,904
3. Funding body grants
Recurrent grantHigher Education Funding Council 59,927 59,927 61,615 61,615
Capital grant 5,361 5,361 3,708 3,708
Specific grantsHigher Education Innovation Fund 3,200 3,200 2,857 2,857
Capital grant 4,088 4,088 1,275 1,275
Other 1,186 1,186 933 933
73,762 73,762 70,388 70,388
4. Research grants and contracts
Research councils 36,698 36,661 25,717 25,717
Research charities 25,661 25,661 29,606 29,606
Government (UK and overseas) 21,746 21,619 21,539 21,379
Industry and commerce 12,159 12,159 9,712 9,679
Other 5,219 4,949 12,669 12,478
101,483 101,049 99,243 98,859
Included within Research grants and contracts above are capital grants of: 8,635 8,635 6,957 6,957
5. Other income
Residences, catering and conferences 16,291 16,291 16,316 16,316
Other services rendered 8,945 8,901 8,395 8,739
Health Authorities 11,586 11,586 10,061 10,097
Other revenue income 6,095 4,865 6,399 5,060
42,917 41,643 41,171 40,212

6. Investment income
Investment income on expendable endowments 21 56 56 60 60
Investment income on permanent endowments 21 199 199 222 222
Investment income on restricted reserves 22 22 22 22 23
Other investment income 240 928 319 999
Net return on pension scheme 28 215 215 90 90
732 1,420 713 1,394
7. Donations and endowments
New endowments 21 47 47 66 50
Donations with restrictions 22 1,060 903 1,587 1,500
Unrestricted donations 1,215 1,215 1,005 974
2,322 2,165 2,658 2,524
37 Queen Mary University of London
Notes to the Financial Statements (continued)
Year Ended 31 July 2016 Year Ended 31 July 2015
Consolidated QMUL Consolidated QMUL
Notes £’000 £’000 £’000 £’000
8. Staff costs
Salaries 185,013 184,658 176,387 176,083
Social security costs 16,971 16,947 15,197 15,168
Movement in holiday pay accrual 729 729 ( 3,435) ( 3,435)
Movement on USS provision 1,330 1,330 18,357 18,357
Movement on SAUL provision 2,165 2,165 - -
Other pension costs 25,251 25,235 23,196 23,181
Compensation for loss of office 603 603 961 958
Total staff costs 232,062 231,667 230,663 230,312
Emoluments of the President and Principal: £’000 £’000
Salary 275 275
Benefits in kind 9 9
284 284
The emoluments of the President and Principal are shown on the same basis as for higher paid staff. From 1 October 2013 to 31 March 2016 QMUL did not pay any pension contributions to USS for the President and Principal. From 1 April 2016 QMUL has paid USS pension contributions at 2.1% for the President and Principal and these amount to £1,298 (2015: £nil).

38 Queen Mary University of London
Notes to the Financial Statements (continued)
2016 2015No. No.
£100,001 - £110,000 28 20£110,001 - £120,000 13 16£120,001 - £130,000 18 19£130,001 - £140,000 10 8£140,001 - £150,000 10 15£150,001 - £160,000 15 12£160,001 - £170,000 10 6£170,001 - £180,000 6 6£180,001 - £190,000 3 8£190,001 - £200,000 2 1£200,001 - £210,000 2 2£210,001 - £220,000 2 0£220,001 - £230,000 2 2£230,001 - £240,000 1 0£240,001 - £250,000 2 2£250,001 - £260,000 1 1£260,001 - £270,000 0 0£270,001 - £280,000 1 1£280,001 - £290,000 0 0£290,001 - £300,000 0 0£300,001 - £310,000 0 0£310,001 - £320,000 0 0£320,001 - £330,000 0 0£330,001 - £340,000 0 0£340,001 - £350,000 0 1
126 120
Remuneration of other higher paid staff, excluding employer’s pension contributions but including payments made on behalf of the NHS in respect of its contractual obligations to QMUL staff. All shown before any salary sacrifice:
2016 2015
Average staff numbers by major category: No. No.
Academic, education and research 1,820 1,779
Professional services 1,458 1,422
Technical services 260 242
Operational services 267 256
3,804 3,699
No compensation for loss of office was made to higher-paid staff in the year to 31 July 2016 (2015: £nil)
Key management personnel
£’000 £’000
Key management personnel compensation 1,473 1,556
Key management personnel are those persons having authority and responsibility for planning, directing and controlling the activities of QMUL. Staff costs include any compensation paid to key management personnel.
Trustees (Council Members) The Trustees neither received nor waived any emoluments during the year (2015: £nil) in respect of their position as Trustees. All Trustees are entitled to be reimbursed for reasonable travel and subsistence expenses incurred in the performance of their duties. In 2016 9 Trustees (2015: 3) were reimbursed a total of £1,235 (2015: £994).
8. Staff costs (continued)
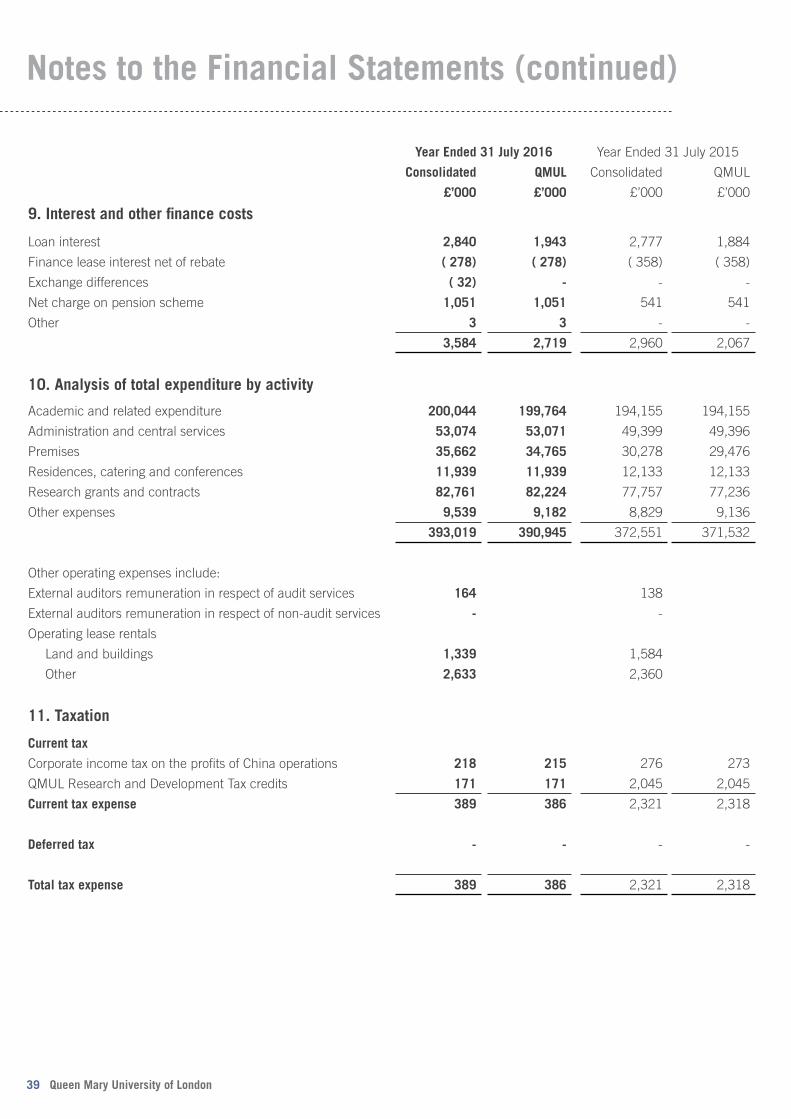
Year Ended 31 July 2016 Year Ended 31 July 2015
Consolidated QMUL Consolidated QMUL
£’000 £’000 £’000 £’000
9. Interest and other finance costs
Loan interest 2,840 1,943 2,777 1,884
Finance lease interest net of rebate ( 278) ( 278) ( 358) ( 358)
Exchange differences ( 32) - - -
Net charge on pension scheme 1,051 1,051 541 541
Other 3 3 - -
3,584 2,719 2,960 2,067
10. Analysis of total expenditure by activity
Academic and related expenditure 200,044 199,764 194,155 194,155
Administration and central services 53,074 53,071 49,399 49,396
Premises 35,662 34,765 30,278 29,476
Residences, catering and conferences 11,939 11,939 12,133 12,133
Research grants and contracts 82,761 82,224 77,757 77,236
Other expenses 9,539 9,182 8,829 9,136
393,019 390,945 372,551 371,532
Other operating expenses include:
External auditors remuneration in respect of audit services 164 138
External auditors remuneration in respect of non-audit services - -
Operating lease rentals
Land and buildings 1,339 1,584
Other 2,633 2,360
11. Taxation
Current tax
Corporate income tax on the profits of China operations 218 215 276 273
QMUL Research and Development Tax credits 171 171 2,045 2,045
Current tax expense 389 386 2,321 2,318
Deferred tax - - - -
Total tax expense 389 386 2,321 2,318
39 Queen Mary University of London
Notes to the Financial Statements (continued)
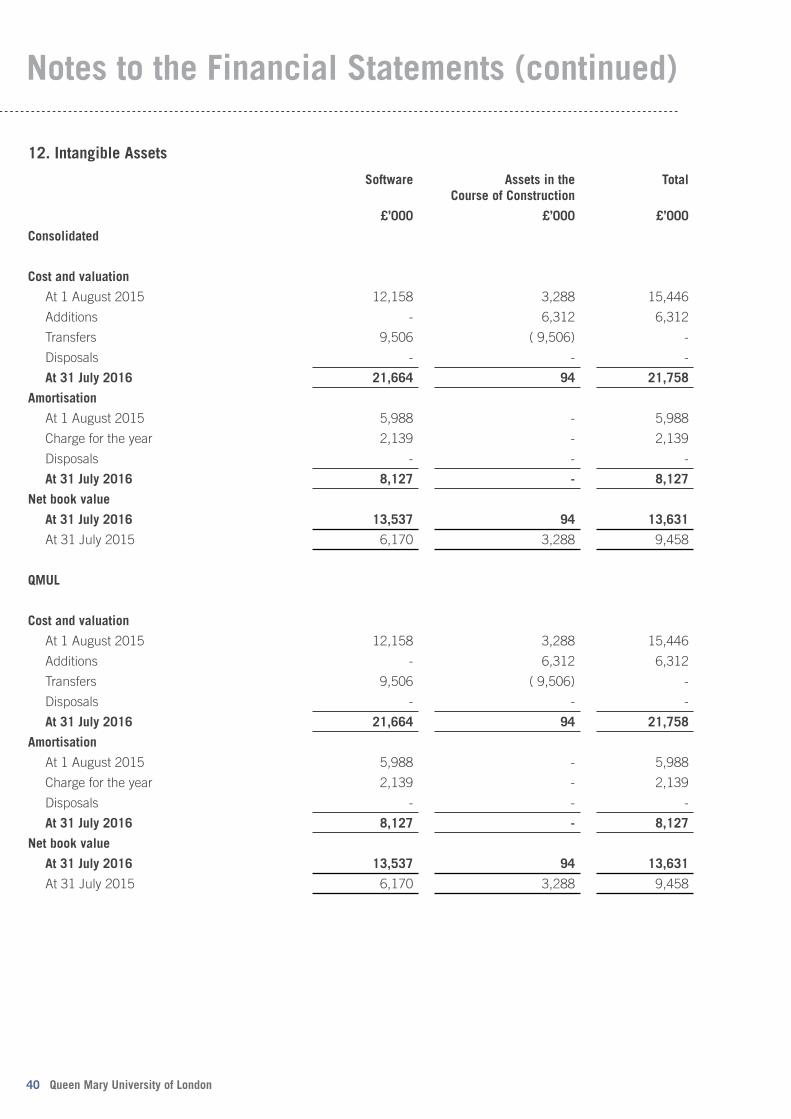
40 Queen Mary University of London
Notes to the Financial Statements (continued)
12. Intangible Assets
Software Assets in the Course of Construction
Total
£’000 £’000 £’000
Consolidated
Cost and valuation
At 1 August 2015 12,158 3,288 15,446
Additions - 6,312 6,312
Transfers 9,506 ( 9,506) -
Disposals - - -
At 31 July 2016 21,664 94 21,758
Amortisation
At 1 August 2015 5,988 - 5,988
Charge for the year 2,139 - 2,139
Disposals - - -
At 31 July 2016 8,127 - 8,127
Net book value
At 31 July 2016 13,537 94 13,631
At 31 July 2015 6,170 3,288 9,458
QMUL
Cost and valuation
At 1 August 2015 12,158 3,288 15,446
Additions - 6,312 6,312
Transfers 9,506 ( 9,506) -
Disposals - - -
At 31 July 2016 21,664 94 21,758
Amortisation
At 1 August 2015 5,988 - 5,988
Charge for the year 2,139 - 2,139
Disposals - - -
At 31 July 2016 8,127 - 8,127
Net book value
At 31 July 2016 13,537 94 13,631
At 31 July 2015 6,170 3,288 9,458
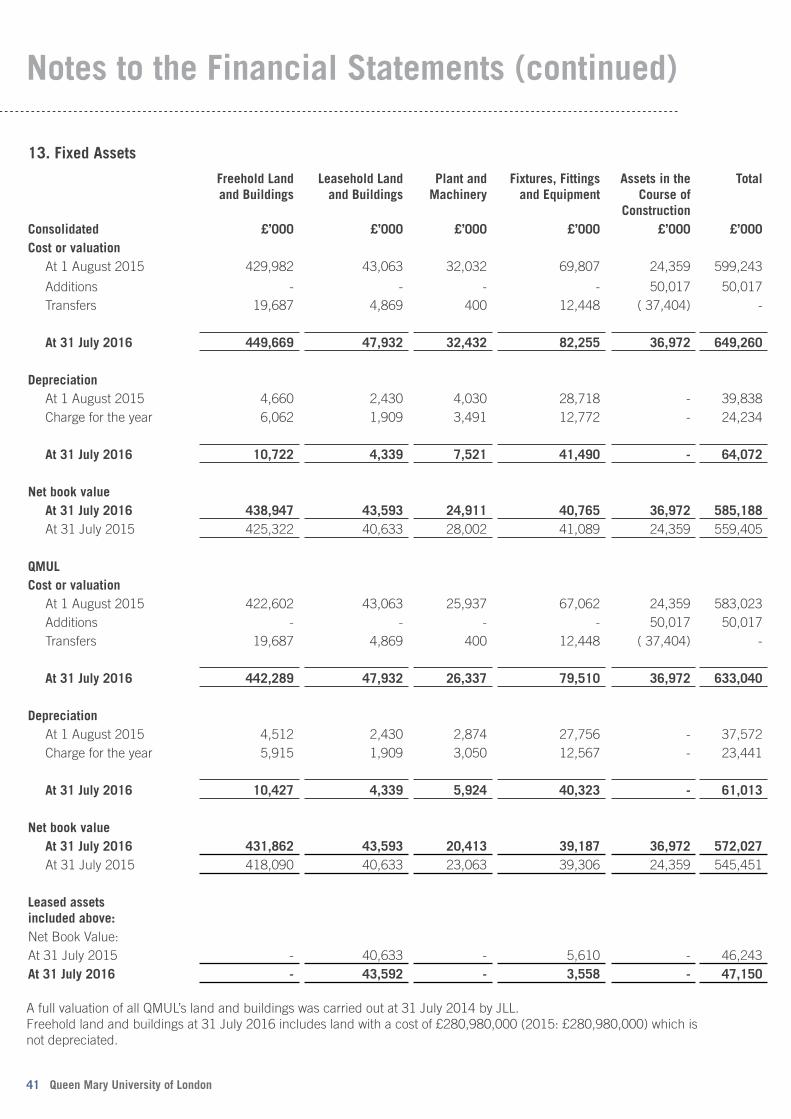
41 Queen Mary University of London
Notes to the Financial Statements (continued)
13. Fixed Assets
Freehold Land and Buildings
Leasehold Land and Buildings
Plant and Machinery
Fixtures, Fittings and Equipment
Assets in the Course of
Construction
Total
Consolidated £’000 £’000 £’000 £’000 £’000 £’000Cost or valuation
At 1 August 2015 429,982 43,063 32,032 69,807 24,359 599,243
Additions - - - - 50,017 50,017 Transfers 19,687 4,869 400 12,448 ( 37,404) -
At 31 July 2016 449,669 47,932 32,432 82,255 36,972 649,260
DepreciationAt 1 August 2015 4,660 2,430 4,030 28,718 - 39,838 Charge for the year 6,062 1,909 3,491 12,772 - 24,234
At 31 July 2016 10,722 4,339 7,521 41,490 - 64,072
Net book valueAt 31 July 2016 438,947 43,593 24,911 40,765 36,972 585,188 At 31 July 2015 425,322 40,633 28,002 41,089 24,359 559,405
QMULCost or valuation
At 1 August 2015 422,602 43,063 25,937 67,062 24,359 583,023 Additions - - - - 50,017 50,017 Transfers 19,687 4,869 400 12,448 ( 37,404) -
At 31 July 2016 442,289 47,932 26,337 79,510 36,972 633,040
DepreciationAt 1 August 2015 4,512 2,430 2,874 27,756 - 37,572 Charge for the year 5,915 1,909 3,050 12,567 - 23,441
At 31 July 2016 10,427 4,339 5,924 40,323 - 61,013
Net book valueAt 31 July 2016 431,862 43,593 20,413 39,187 36,972 572,027 At 31 July 2015 418,090 40,633 23,063 39,306 24,359 545,451
Leased assets included above:Net Book Value:At 31 July 2015 - 40,633 - 5,610 - 46,243 At 31 July 2016 - 43,592 - 3,558 - 47,150
A full valuation of all QMUL’s land and buildings was carried out at 31 July 2014 by JLL. Freehold land and buildings at 31 July 2016 includes land with a cost of £280,980,000 (2015: £280,980,000) which is not depreciated.

42 Queen Mary University of London
Notes to the Financial Statements (continued)
31 July 2016 31 July 2015
£’000 £’000
Cost 8,816 8,816
Accumulated depreciation ( 3,205) ( 1,482)
Charge for year ( 2,052) ( 1,723)
Net book value 3,558 5,610
13. Fixed Assets (continued)
QMUL holds two main classes of heritage assets: one comprises portraits of former Principals of QMUL and instititutions with which it merged; and the other is silverware. The value of neither class is material to these financial statements.
Consolidated fixtures, fittings and equipment include assets held under finance leases as follows:
14. Non-Current Investments
Subsidiary companies Other Investments Shared Equity Property Total
£’000 £’000 £’000 £’000
Consolidated
At 1 August 2015 - 36,136 2,614 38,750
Additions - - - -
Disposals - - (707) (707)
Change in Fair Value - ( 668) - (668)
At 31 July 2016 - 35,468 1,907 37,375
QMUL
At 1 August 2015 3,516 35,301 2,614 41,431
Additions - - - -
Disposals - - (707) (707)
Change in Fair Value - (369) - (369)
At 31 July 2016 3,516 34,932 1,907 40,355
During the year, QMUL sold its investments in 3 shared equity properties for £1,018,000, a profit of £311,000.
Other non-current investments consist of: Consolidated QMUL
£’000 £’000
hVIVO plc 4,188 3,778
Actual Experience plc 7,173 7,047
Biomoti Limited 90 90
Landr Audio Inc 1,063 1,063
Stealthyx Therapeutics Limited 298 298
CVCP Properties 53 53
Managed Investment Portfolio for Endowment Funds:
- Fixed interest stocks 10,785 10,785
- Equities 10,488 10,488
- Options, futures and illiquid funds 1,330 1,330
35,468 34,932
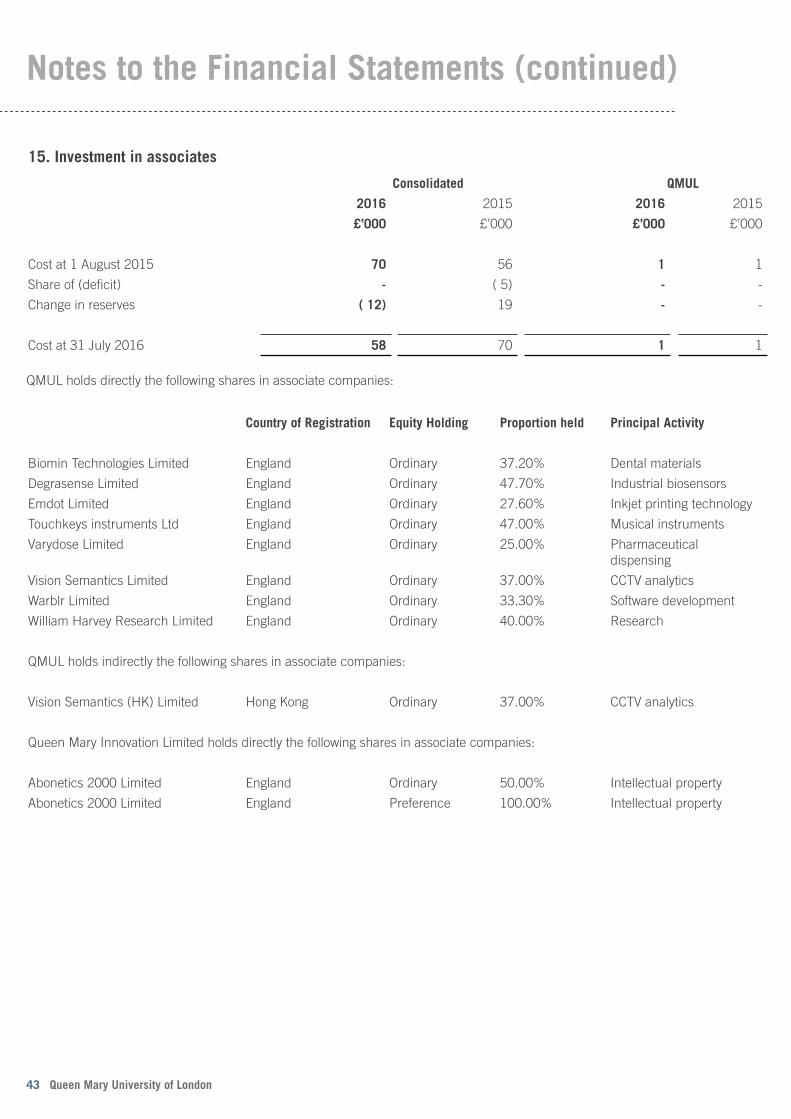
43 Queen Mary University of London
Notes to the Financial Statements (continued)
Country of Registration Equity Holding Proportion held Principal Activity
Biomin Technologies Limited England Ordinary 37.20% Dental materials
Degrasense Limited England Ordinary 47.70% Industrial biosensors
Emdot Limited England Ordinary 27.60% Inkjet printing technology
Touchkeys instruments Ltd England Ordinary 47.00% Musical instruments
Varydose Limited England Ordinary 25.00% Pharmaceutical dispensing
Vision Semantics Limited England Ordinary 37.00% CCTV analytics
Warblr Limited England Ordinary 33.30% Software development
William Harvey Research Limited England Ordinary 40.00% Research
QMUL holds indirectly the following shares in associate companies:
Vision Semantics (HK) Limited Hong Kong Ordinary 37.00% CCTV analytics
Queen Mary Innovation Limited holds directly the following shares in associate companies:
Abonetics 2000 Limited England Ordinary 50.00% Intellectual property
Abonetics 2000 Limited England Preference 100.00% Intellectual property
15. Investment in associates
Consolidated QMUL
2016 2015 2016 2015
£’000 £’000 £’000 £’000
Cost at 1 August 2015 70 56 1 1
Share of (deficit) - ( 5) - -
Change in reserves ( 12) 19 - -
Cost at 31 July 2016 58 70 1 1
QMUL holds directly the following shares in associate companies:
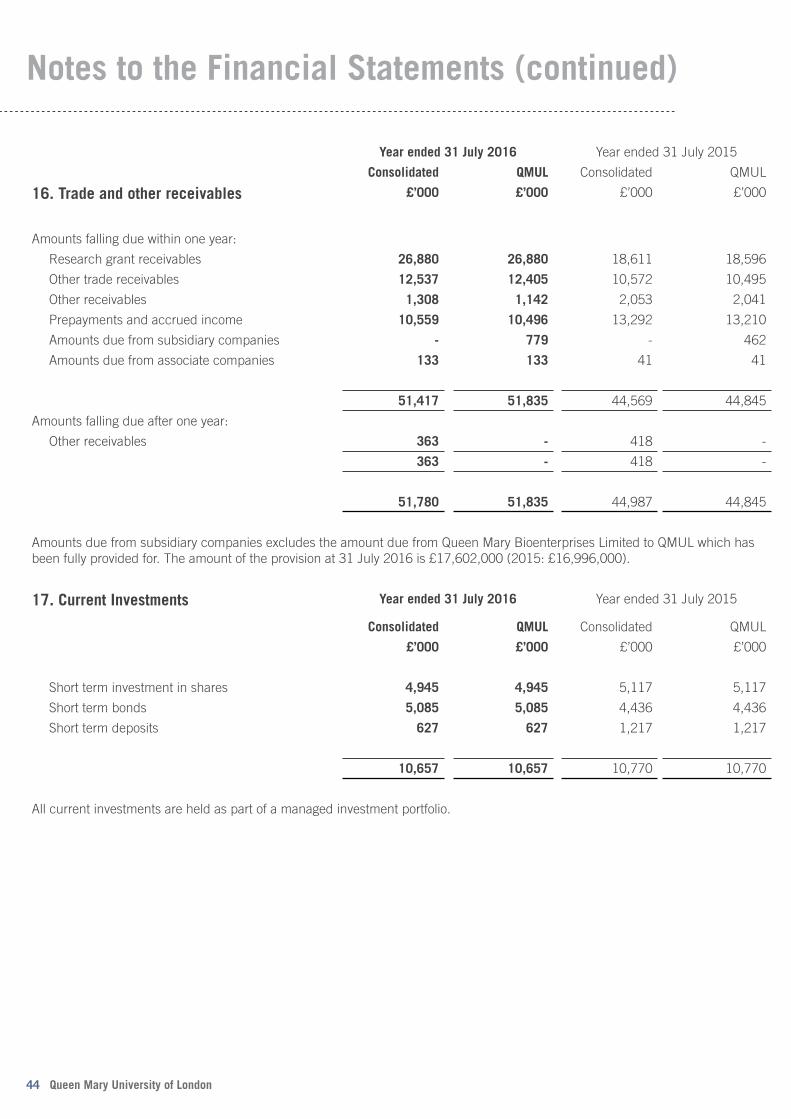
44 Queen Mary University of London
Notes to the Financial Statements (continued)
Year ended 31 July 2016 Year ended 31 July 2015
Consolidated QMUL Consolidated QMUL
16. Trade and other receivables £’000 £’000 £’000 £’000
Amounts falling due within one year:
Research grant receivables 26,880 26,880 18,611 18,596
Other trade receivables 12,537 12,405 10,572 10,495
Other receivables 1,308 1,142 2,053 2,041
Prepayments and accrued income 10,559 10,496 13,292 13,210
Amounts due from subsidiary companies - 779 - 462
Amounts due from associate companies 133 133 41 41
51,417 51,835 44,569 44,845
Amounts falling due after one year:
Other receivables 363 - 418 -
363 - 418 -
51,780 51,835 44,987 44,845
Amounts due from subsidiary companies excludes the amount due from Queen Mary Bioenterprises Limited to QMUL which has been fully provided for. The amount of the provision at 31 July 2016 is £17,602,000 (2015: £16,996,000).
17. Current Investments Year ended 31 July 2016 Year ended 31 July 2015
Consolidated QMUL Consolidated QMUL
£’000 £’000 £’000 £’000
Short term investment in shares 4,945 4,945 5,117 5,117
Short term bonds 5,085 5,085 4,436 4,436
Short term deposits 627 627 1,217 1,217
10,657 10,657 10,770 10,770
All current investments are held as part of a managed investment portfolio.
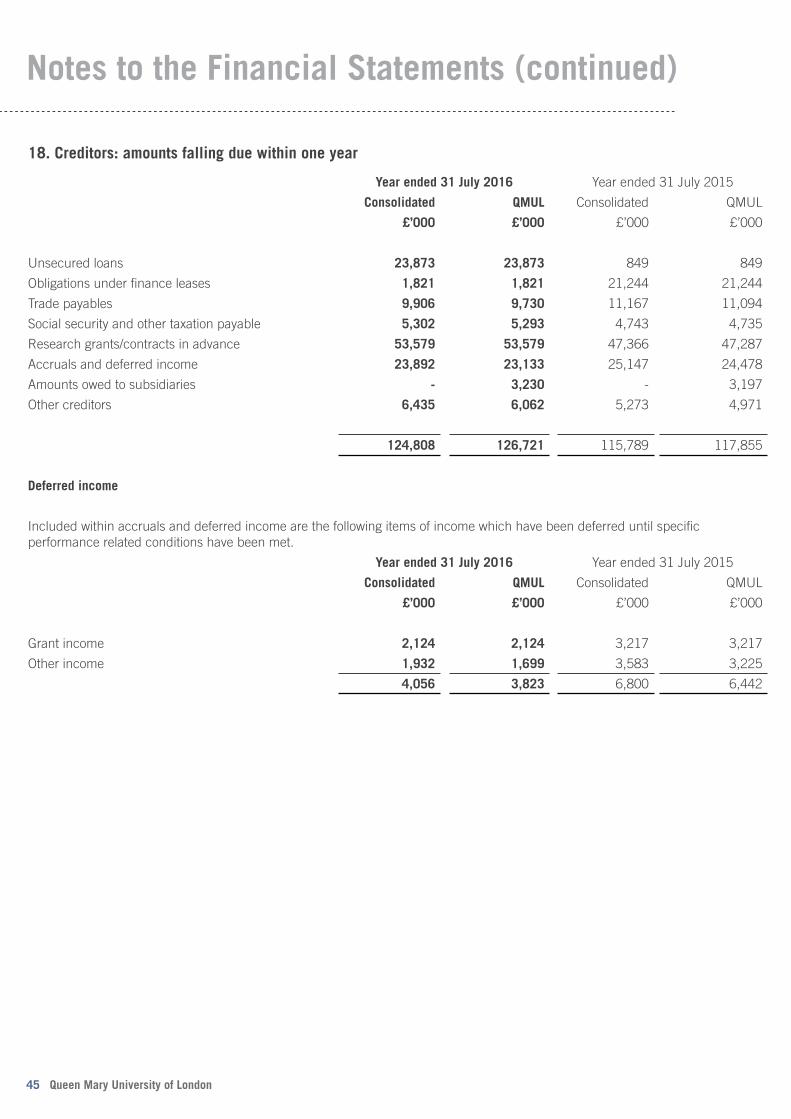
18. Creditors: amounts falling due within one year
Year ended 31 July 2016 Year ended 31 July 2015
Consolidated QMUL Consolidated QMUL
£’000 £’000 £’000 £’000
Unsecured loans 23,873 23,873 849 849
Obligations under finance leases 1,821 1,821 21,244 21,244
Trade payables 9,906 9,730 11,167 11,094
Social security and other taxation payable 5,302 5,293 4,743 4,735
Research grants/contracts in advance 53,579 53,579 47,366 47,287
Accruals and deferred income 23,892 23,133 25,147 24,478
Amounts owed to subsidiaries - 3,230 - 3,197
Other creditors 6,435 6,062 5,273 4,971
124,808 126,721 115,789 117,855
Deferred income
Included within accruals and deferred income are the following items of income which have been deferred until specific performance related conditions have been met.
Year ended 31 July 2016 Year ended 31 July 2015
Consolidated QMUL Consolidated QMUL
£’000 £’000 £’000 £’000
Grant income 2,124 2,124 3,217 3,217
Other income 1,932 1,699 3,583 3,225
4,056 3,823 6,800 6,442
45 Queen Mary University of London
Notes to the Financial Statements (continued)
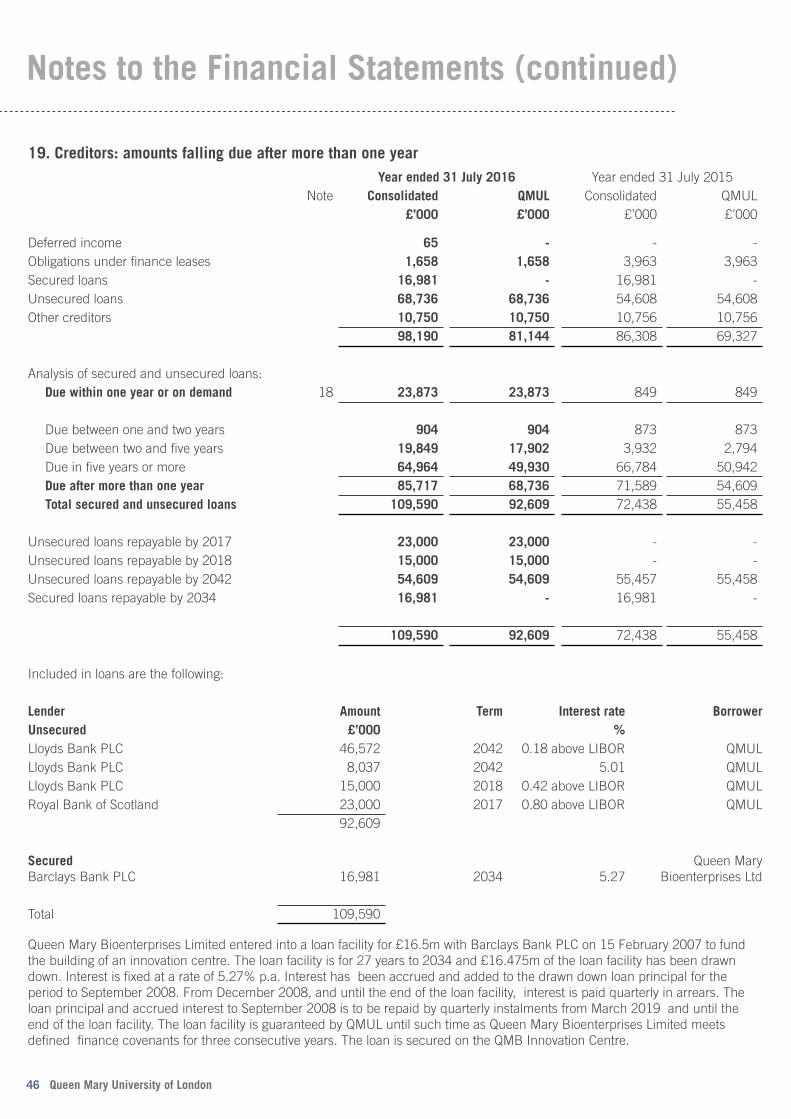
46 Queen Mary University of London
Notes to the Financial Statements (continued)
19. Creditors: amounts falling due after more than one yearYear ended 31 July 2016 Year ended 31 July 2015
Note Consolidated QMUL Consolidated QMUL£’000 £’000 £’000 £’000
Deferred income 65 - - - Obligations under finance leases 1,658 1,658 3,963 3,963 Secured loans 16,981 - 16,981 - Unsecured loans 68,736 68,736 54,608 54,608 Other creditors 10,750 10,750 10,756 10,756
98,190 81,144 86,308 69,327
Analysis of secured and unsecured loans:Due within one year or on demand 18 23,873 23,873 849 849
Due between one and two years 904 904 873 873 Due between two and five years 19,849 17,902 3,932 2,794 Due in five years or more 64,964 49,930 66,784 50,942 Due after more than one year 85,717 68,736 71,589 54,609 Total secured and unsecured loans 109,590 92,609 72,438 55,458
Unsecured loans repayable by 2017 23,000 23,000 - - Unsecured loans repayable by 2018 15,000 15,000 - - Unsecured loans repayable by 2042 54,609 54,609 55,457 55,458 Secured loans repayable by 2034 16,981 - 16,981 -
109,590 92,609 72,438 55,458
Included in loans are the following:
Lender Amount Term Interest rate BorrowerUnsecured £’000 %Lloyds Bank PLC 46,572 2042 0.18 above LIBOR QMULLloyds Bank PLC 8,037 2042 5.01 QMULLloyds Bank PLC 15,000 2018 0.42 above LIBOR QMULRoyal Bank of Scotland 23,000 2017 0.80 above LIBOR QMUL
92,609
Secured Barclays Bank PLC 16,981 2034 5.27
Queen Mary Bioenterprises Ltd
Total 109,590
Queen Mary Bioenterprises Limited entered into a loan facility for £16.5m with Barclays Bank PLC on 15 February 2007 to fund the building of an innovation centre. The loan facility is for 27 years to 2034 and £16.475m of the loan facility has been drawn down. Interest is fixed at a rate of 5.27% p.a. Interest has been accrued and added to the drawn down loan principal for the period to September 2008. From December 2008, and until the end of the loan facility, interest is paid quarterly in arrears. The loan principal and accrued interest to September 2008 is to be repaid by quarterly instalments from March 2019 and until the end of the loan facility. The loan facility is guaranteed by QMUL until such time as Queen Mary Bioenterprises Limited meets defined finance covenants for three consecutive years. The loan is secured on the QMB Innovation Centre.
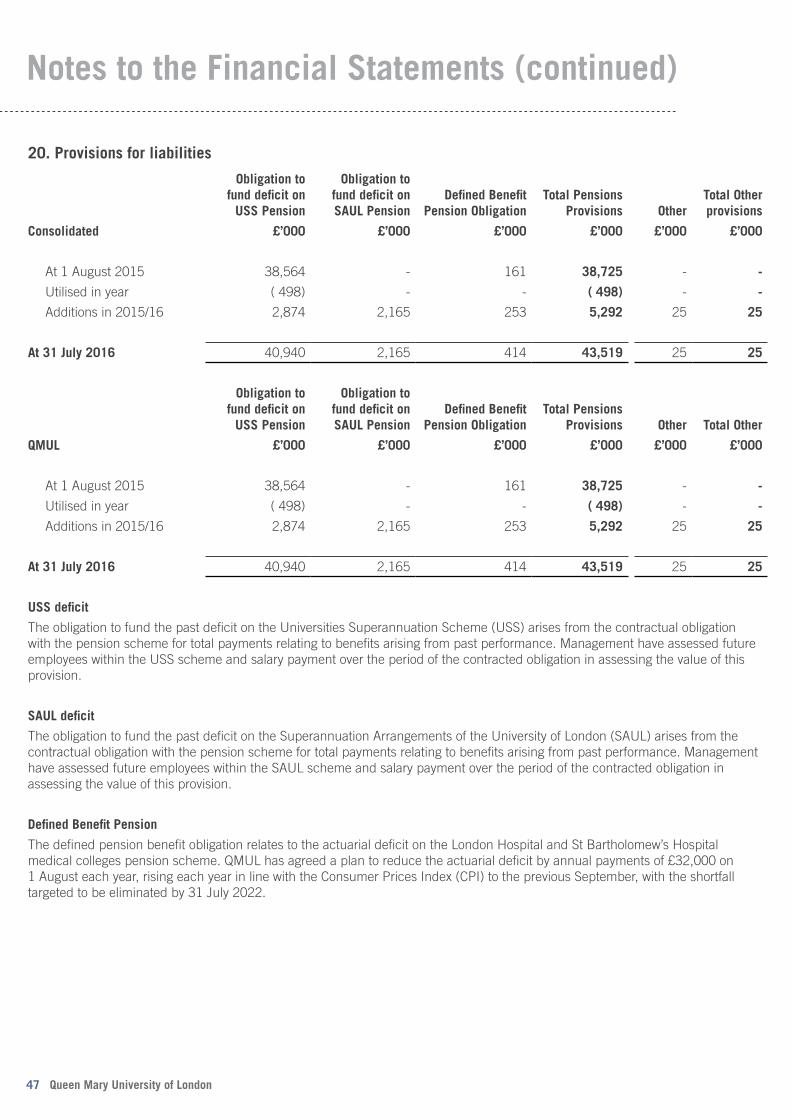
20. Provisions for liabilities
Obligation to fund deficit on
USS Pension
Obligation to fund deficit on SAUL Pension
Defined Benefit Pension Obligation
Total Pensions Provisions Other
Total Other provisions
Consolidated £’000 £’000 £’000 £’000 £’000 £’000
At 1 August 2015 38,564 - 161 38,725 - -
Utilised in year ( 498) - - ( 498) - -
Additions in 2015/16 2,874 2,165 253 5,292 25 25
At 31 July 2016 40,940 2,165 414 43,519 25 25
Obligation to fund deficit on
USS Pension
Obligation to fund deficit on SAUL Pension
Defined Benefit Pension Obligation
Total Pensions Provisions Other Total Other
QMUL £’000 £’000 £’000 £’000 £’000 £’000
At 1 August 2015 38,564 - 161 38,725 - -
Utilised in year ( 498) - - ( 498) - -
Additions in 2015/16 2,874 2,165 253 5,292 25 25
At 31 July 2016 40,940 2,165 414 43,519 25 25
USS deficit
The obligation to fund the past deficit on the Universities Superannuation Scheme (USS) arises from the contractual obligation with the pension scheme for total payments relating to benefits arising from past performance. Management have assessed future employees within the USS scheme and salary payment over the period of the contracted obligation in assessing the value of this provision.
SAUL deficit
The obligation to fund the past deficit on the Superannuation Arrangements of the University of London (SAUL) arises from the contractual obligation with the pension scheme for total payments relating to benefits arising from past performance. Management have assessed future employees within the SAUL scheme and salary payment over the period of the contracted obligation in assessing the value of this provision.
Defined Benefit Pension
The defined pension benefit obligation relates to the actuarial deficit on the London Hospital and St Bartholomew’s Hospital medical colleges pension scheme. QMUL has agreed a plan to reduce the actuarial deficit by annual payments of £32,000 on 1 August each year, rising each year in line with the Consumer Prices Index (CPI) to the previous September, with the shortfall targeted to be eliminated by 31 July 2022.
47 Queen Mary University of London
Notes to the Financial Statements (continued)
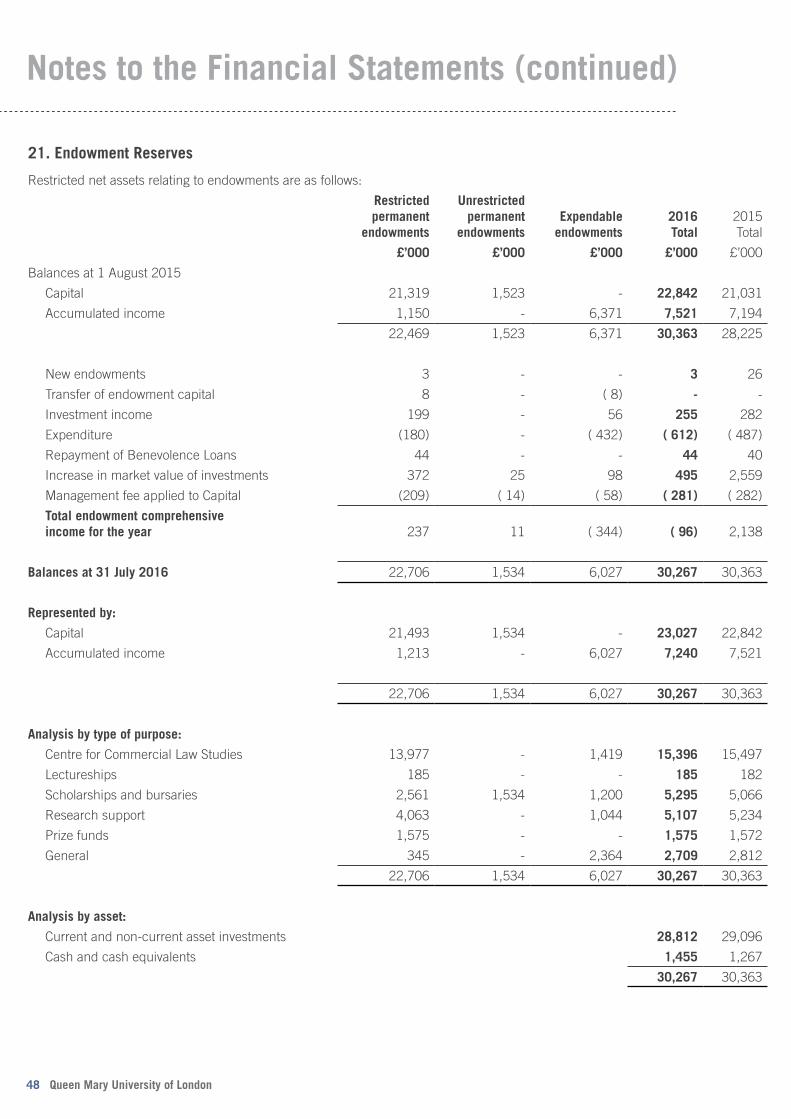
21. Endowment Reserves
Restricted net assets relating to endowments are as follows:
Restricted permanent
endowments
Unrestricted permanent
endowments Expendable endowments
2016 Total
2015 Total
£’000 £’000 £’000 £’000 £’000
Balances at 1 August 2015
Capital 21,319 1,523 - 22,842 21,031
Accumulated income 1,150 - 6,371 7,521 7,194
22,469 1,523 6,371 30,363 28,225
New endowments 3 - - 3 26
Transfer of endowment capital 8 - ( 8) - -
Investment income 199 - 56 255 282
Expenditure (180) - ( 432) ( 612) ( 487)
Repayment of Benevolence Loans 44 - - 44 40
Increase in market value of investments 372 25 98 495 2,559
Management fee applied to Capital (209) ( 14) ( 58) ( 281) ( 282)
Total endowment comprehensive income for the year 237 11 ( 344) ( 96) 2,138
Balances at 31 July 2016 22,706 1,534 6,027 30,267 30,363
Represented by:
Capital 21,493 1,534 - 23,027 22,842
Accumulated income 1,213 - 6,027 7,240 7,521
22,706 1,534 6,027 30,267 30,363
Analysis by type of purpose:
Centre for Commercial Law Studies 13,977 - 1,419 15,396 15,497
Lectureships 185 - - 185 182
Scholarships and bursaries 2,561 1,534 1,200 5,295 5,066
Research support 4,063 - 1,044 5,107 5,234
Prize funds 1,575 - - 1,575 1,572
General 345 - 2,364 2,709 2,812
22,706 1,534 6,027 30,267 30,363
Analysis by asset:
Current and non-current asset investments 28,812 29,096
Cash and cash equivalents 1,455 1,267
30,267 30,363
48 Queen Mary University of London
Notes to the Financial Statements (continued)
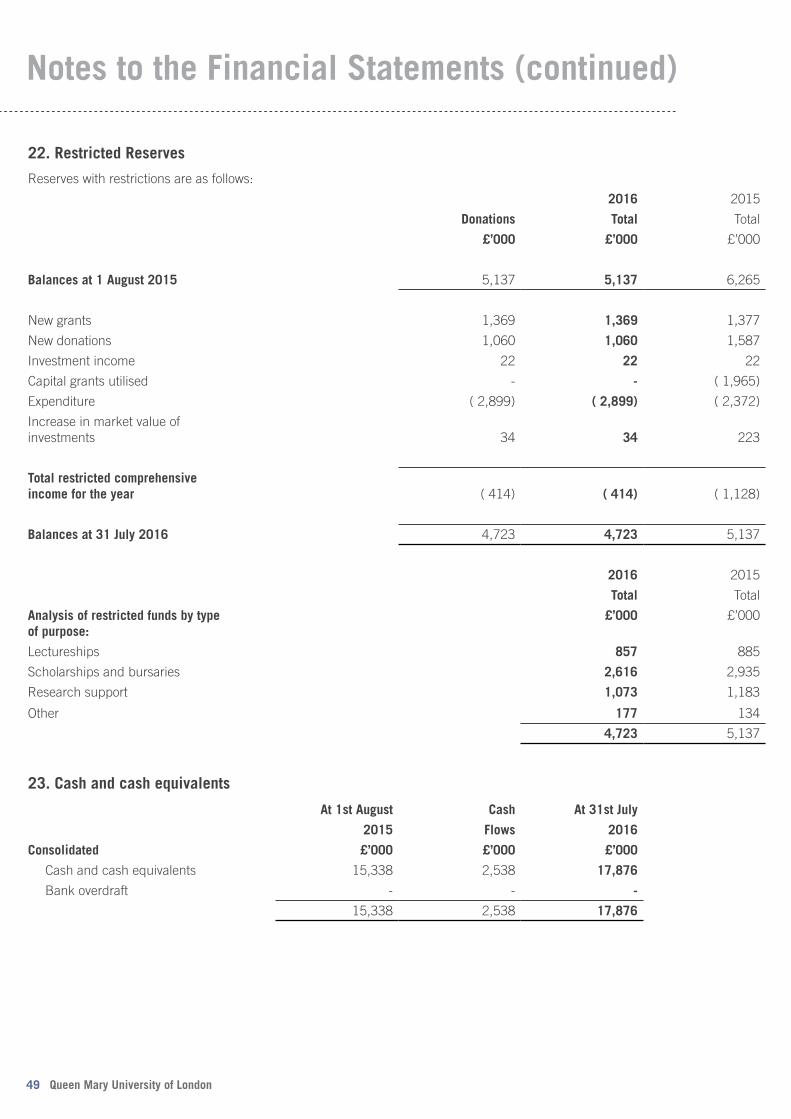
49 Queen Mary University of London
Notes to the Financial Statements (continued)
22. Restricted Reserves
Reserves with restrictions are as follows:
2016 2015
Donations Total Total
£’000 £’000 £’000
Balances at 1 August 2015 5,137 5,137 6,265
New grants 1,369 1,369 1,377
New donations 1,060 1,060 1,587
Investment income 22 22 22
Capital grants utilised - - ( 1,965)
Expenditure ( 2,899) ( 2,899) ( 2,372)
Increase in market value of investments 34 34 223
Total restricted comprehensive income for the year ( 414) ( 414) ( 1,128)
Balances at 31 July 2016 4,723 4,723 5,137
2016 2015
Total Total
Analysis of restricted funds by type of purpose:
£’000 £’000
Lectureships 857 885
Scholarships and bursaries 2,616 2,935
Research support 1,073 1,183
Other 177 134
4,723 5,137
23. Cash and cash equivalents
At 1st August Cash At 31st July
2015 Flows 2016
Consolidated £’000 £’000 £’000
Cash and cash equivalents 15,338 2,538 17,876
Bank overdraft - - -
15,338 2,538 17,876
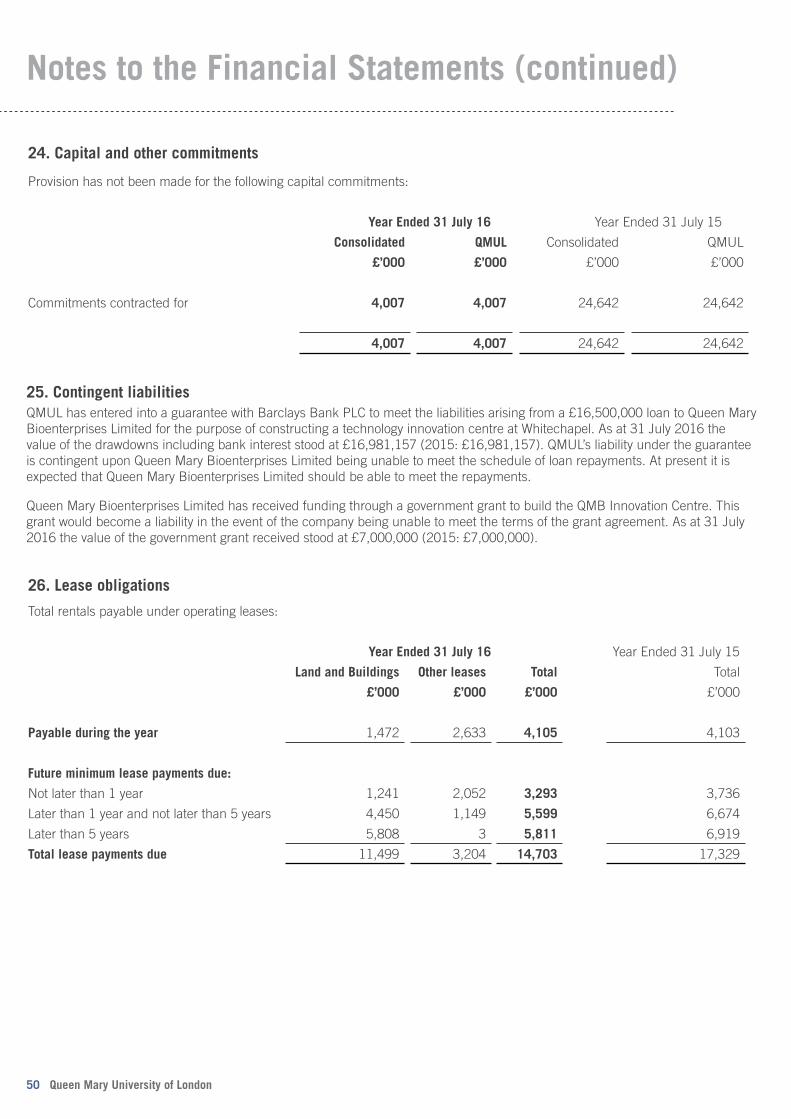
50 Queen Mary University of London
Notes to the Financial Statements (continued)
25. Contingent liabilitiesQMUL has entered into a guarantee with Barclays Bank PLC to meet the liabilities arising from a £16,500,000 loan to Queen Mary Bioenterprises Limited for the purpose of constructing a technology innovation centre at Whitechapel. As at 31 July 2016 the value of the drawdowns including bank interest stood at £16,981,157 (2015: £16,981,157). QMUL’s liability under the guarantee is contingent upon Queen Mary Bioenterprises Limited being unable to meet the schedule of loan repayments. At present it is expected that Queen Mary Bioenterprises Limited should be able to meet the repayments.
Queen Mary Bioenterprises Limited has received funding through a government grant to build the QMB Innovation Centre. This grant would become a liability in the event of the company being unable to meet the terms of the grant agreement. As at 31 July 2016 the value of the government grant received stood at £7,000,000 (2015: £7,000,000).
24. Capital and other commitments
Provision has not been made for the following capital commitments:
Year Ended 31 July 16 Year Ended 31 July 15
Consolidated QMUL Consolidated QMUL
£’000 £’000 £’000 £’000
Commitments contracted for 4,007 4,007 24,642 24,642
4,007 4,007 24,642 24,642
26. Lease obligations
Total rentals payable under operating leases:
Year Ended 31 July 16 Year Ended 31 July 15
Land and Buildings Other leases Total Total
£’000 £’000 £’000 £’000
Payable during the year 1,472 2,633 4,105 4,103
Future minimum lease payments due:
Not later than 1 year 1,241 2,052 3,293 3,736
Later than 1 year and not later than 5 years 4,450 1,149 5,599 6,674
Later than 5 years 5,808 3 5,811 6,919
Total lease payments due 11,499 3,204 14,703 17,329
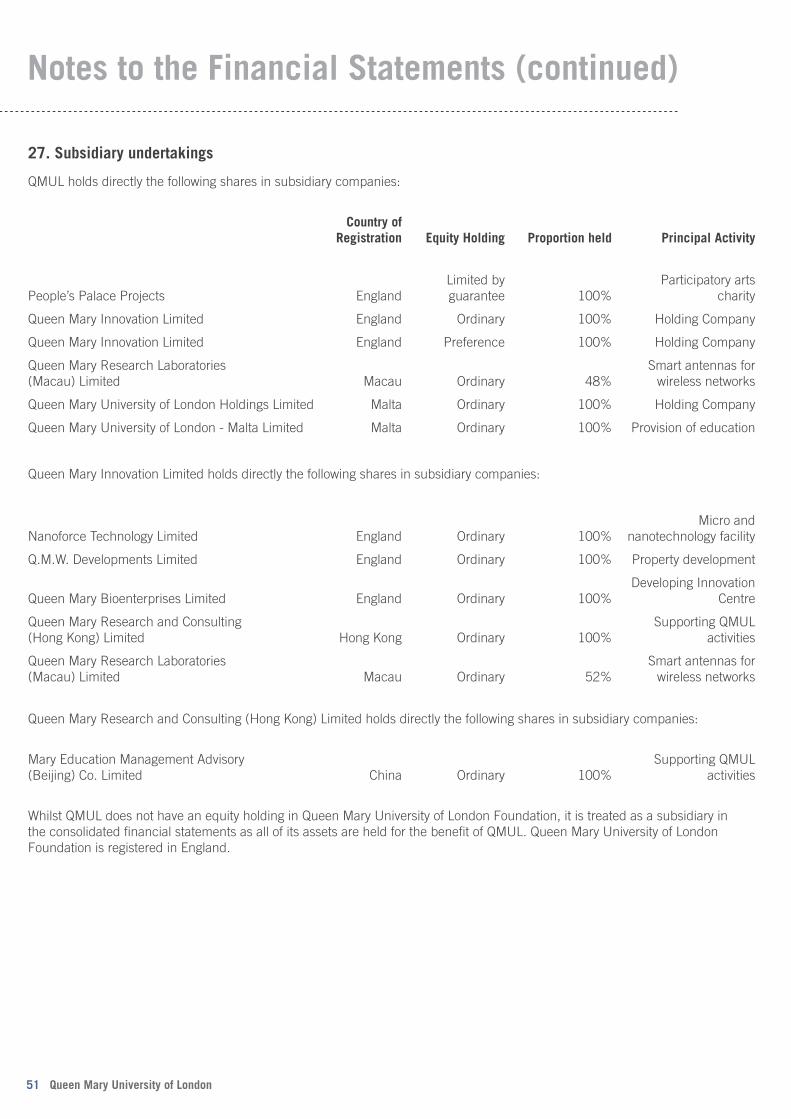
27. Subsidiary undertakings
QMUL holds directly the following shares in subsidiary companies:
Country of Registration Equity Holding Proportion held Principal Activity
People’s Palace Projects EnglandLimited by guarantee 100%
Participatory arts charity
Queen Mary Innovation Limited England Ordinary 100% Holding Company
Queen Mary Innovation Limited England Preference 100% Holding Company
Queen Mary Research Laboratories (Macau) Limited Macau Ordinary 48%
Smart antennas for wireless networks
Queen Mary University of London Holdings Limited Malta Ordinary 100% Holding Company
Queen Mary University of London - Malta Limited Malta Ordinary 100% Provision of education
Queen Mary Innovation Limited holds directly the following shares in subsidiary companies:
Nanoforce Technology Limited England Ordinary 100%Micro and
nanotechnology facility
Q.M.W. Developments Limited England Ordinary 100% Property development
Queen Mary Bioenterprises Limited England Ordinary 100%Developing Innovation
Centre
Queen Mary Research and Consulting (Hong Kong) Limited Hong Kong Ordinary 100%
Supporting QMUL activities
Queen Mary Research Laboratories (Macau) Limited Macau Ordinary 52%
Smart antennas for wireless networks
Queen Mary Research and Consulting (Hong Kong) Limited holds directly the following shares in subsidiary companies:
Mary Education Management Advisory (Beijing) Co. Limited China Ordinary 100%
Supporting QMUL activities
Whilst QMUL does not have an equity holding in Queen Mary University of London Foundation, it is treated as a subsidiary in the consolidated financial statements as all of its assets are held for the benefit of QMUL. Queen Mary University of London Foundation is registered in England.
51 Queen Mary University of London
Notes to the Financial Statements (continued)

28. Pension schemesThe three principal pension schemes for QMUL’s staff are the Superannuation Arrangements for the University of London (SAUL), the Universities Superannuation Scheme (USS) and the NHS Public Service Scheme (NHS). QMUL also operates a closed scheme for the non teaching staff of the London Hospital and St Bartholomew’s Hospital medical colleges prior to their merger with
(i) USSQMUL participates in the Universities Superannuation Scheme (the scheme). Throughout the current and preceding periods, the scheme was a defined benefit only pension scheme until 31 March 2016 which was contracted out of the State Second Pension (S2P). The assets of the scheme are held in a separate trustee-administered fund. Because of the nature of the scheme, the scheme’s assets are not hypothecated to individual institutions and a scheme wide contribution rate is set. QMUL is therefore exposed to actuarial risks associated with other institutions’ employees and is unable to identify its share of the underlying assets andliabilitiesoftheschemeonaconsistentandreasonablebasisandtherefore,asrequiredbySection28ofFRS102“Employeebenefits”,accountsfortheschemeasifitwereadefinedcontributionscheme.Asaresult,theamountchargedtotheincomeandexpenditure account represents the contributions payable to the scheme in respect of the accounting period. Since QMUL has entered into an agreement (the Recovery Plan that determines how each employer within the scheme will fund the overall deficit), QMUL recognises a liability for the contributions payable that arise from the agreement to the extent that they relate to the deficit and the resulting expense in the income and expenditure account. QMUL’s USS pension liability at 31 July 2016 is £40,939,891 (2015: £38,564,379) see pension provision note 20.
52 Queen Mary University of London
Notes to the Financial Statements (continued)
QMUL’s contributions to the schemes are shown below:
At 31 July 2016
USS SAUL NHS
% % %
Employees’ contributions - final salary scheme N/A N/A 5 - 14.5*
Employees’ contributions - career revalued benefits scheme 8.0 6.0 5 - 14.5*
Employer’s contributions 18.0 16.0 14.3
At 31 July 2015
USS SAUL NHS
% % %
Employees’ contributions - final salary scheme 7.5 6.0 5 - 14.5*
Employees’ contributions - career revalued benefits scheme 6.5 6.0 5 - 14.5*
Employer’s contributions 16.0 13.0 14.0
* tiered contribution rates depending on salary
2016 2015
£000 £000
Contribution to USS 19,781 18,142
Contribution to SAUL 3,278 2,896
NHS Public Service Scheme 2,176 2,143
Contribution paid to other pension schemes 16 15
25,251 23,196
At 31 July 2016 £3,603,000 (2015: £3,030,000) of pension payments were outstanding which were paid when due in August.
There were no prepayments in either year.
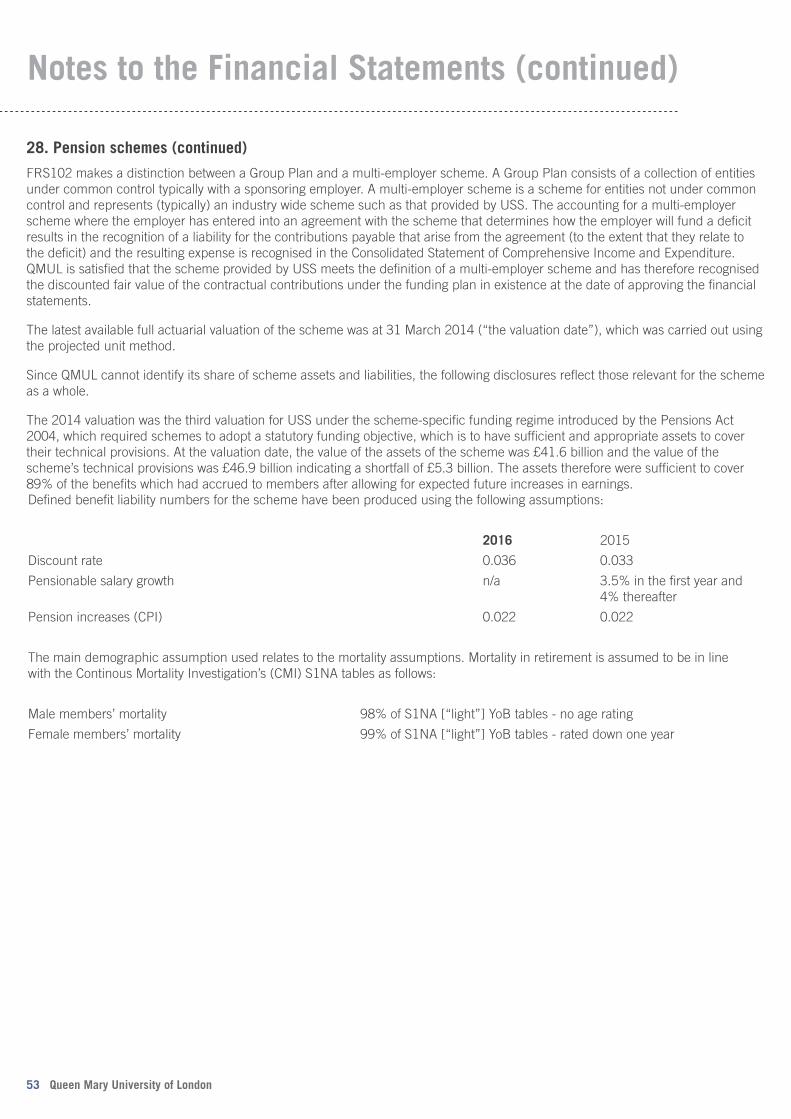
53 Queen Mary University of London
Notes to the Financial Statements (continued)
FRS102 makes a distinction between a Group Plan and a multi-employer scheme. A Group Plan consists of a collection of entities under common control typically with a sponsoring employer. A multi-employer scheme is a scheme for entities not under common control and represents (typically) an industry wide scheme such as that provided by USS. The accounting for a multi-employer scheme where the employer has entered into an agreement with the scheme that determines how the employer will fund a deficit results in the recognition of a liability for the contributions payable that arise from the agreement (to the extent that they relate to the deficit) and the resulting expense is recognised in the Consolidated Statement of Comprehensive Income and Expenditure. QMUL is satisfied that the scheme provided by USS meets the definition of a multi-employer scheme and has therefore recognised the discounted fair value of the contractual contributions under the funding plan in existence at the date of approving the financial statements.
Thelatestavailablefullactuarialvaluationoftheschemewasat31March2014(“thevaluationdate”),whichwascarriedoutusingthe projected unit method.
Since QMUL cannot identify its share of scheme assets and liabilities, the following disclosures reflect those relevant for the scheme as a whole.
The 2014 valuation was the third valuation for USS under the scheme-specific funding regime introduced by the Pensions Act 2004, which required schemes to adopt a statutory funding objective, which is to have sufficient and appropriate assets to cover their technical provisions. At the valuation date, the value of the assets of the scheme was £41.6 billion and the value of the scheme’s technical provisions was £46.9 billion indicating a shortfall of £5.3 billion. The assets therefore were sufficient to cover 89% of the benefits which had accrued to members after allowing for expected future increases in earnings.Defined benefit liability numbers for the scheme have been produced using the following assumptions:
2016 2015
Discount rate 0.036 0.033
Pensionable salary growth n/a 3.5% in the first year and 4% thereafter
Pension increases (CPI) 0.022 0.022
The main demographic assumption used relates to the mortality assumptions. Mortality in retirement is assumed to be in line with the Continous Mortality Investigation’s (CMI) S1NA tables as follows:
Male members’ mortality 98%ofS1NA[“light”]YoBtables-noagerating
Female members’ mortality 99%ofS1NA[“light”]YoBtables-rateddownoneyear
28. Pension schemes (continued)
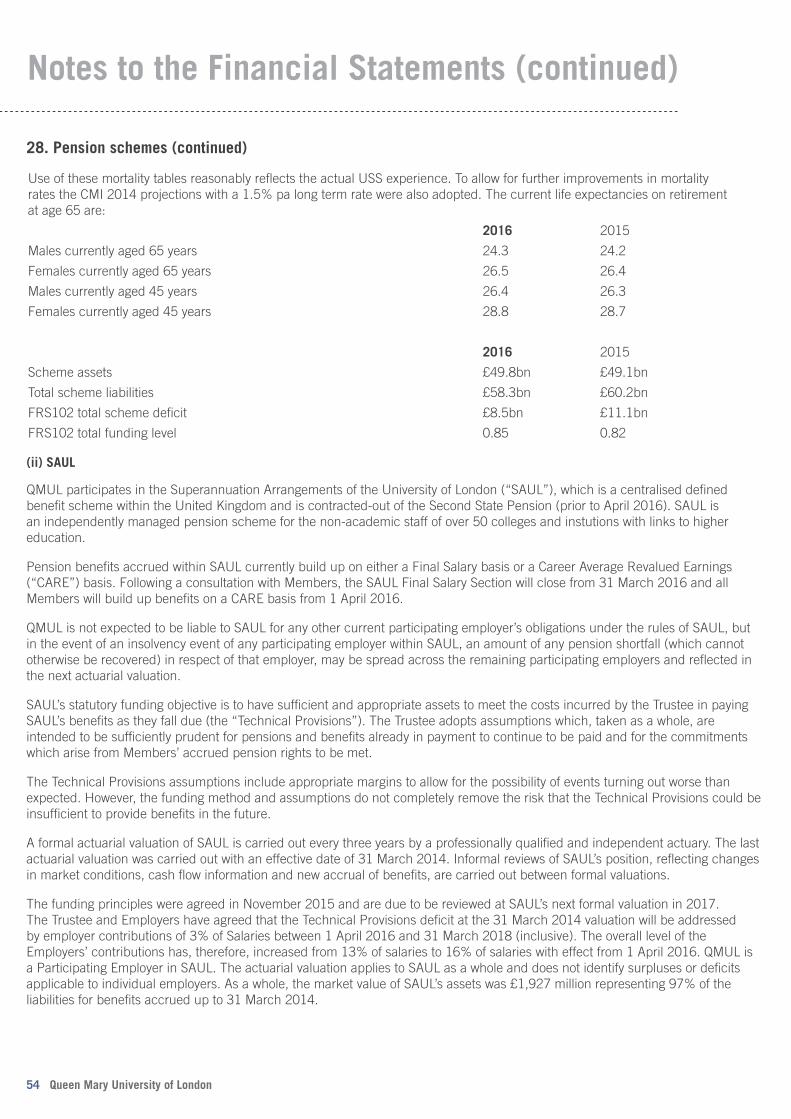
54 Queen Mary University of London
Notes to the Financial Statements (continued)
Use of these mortality tables reasonably reflects the actual USS experience. To allow for further improvements in mortality rates the CMI 2014 projections with a 1.5% pa long term rate were also adopted. The current life expectancies on retirement at age 65 are:
2016 2015
Males currently aged 65 years 24.3 24.2
Females currently aged 65 years 26.5 26.4
Males currently aged 45 years 26.4 26.3
Females currently aged 45 years 28.8 28.7
2016 2015
Scheme assets £49.8bn £49.1bn
Total scheme liabilities £58.3bn £60.2bn
FRS102 total scheme deficit £8.5bn £11.1bn
FRS102 total funding level 0.85 0.82
(ii) SAUL
QMULparticipatesintheSuperannuationArrangementsoftheUniversityofLondon(“SAUL”),whichisacentraliseddefinedbenefit scheme within the United Kingdom and is contracted-out of the Second State Pension (prior to April 2016). SAUL is an independently managed pension scheme for the non-academic staff of over 50 colleges and instutions with links to higher education.
Pension benefits accrued within SAUL currently build up on either a Final Salary basis or a Career Average Revalued Earnings (“CARE”)basis.FollowingaconsultationwithMembers,theSAULFinalSalarySectionwillclosefrom31March2016andallMembers will build up benefits on a CARE basis from 1 April 2016.
QMUL is not expected to be liable to SAUL for any other current participating employer’s obligations under the rules of SAUL, but in the event of an insolvency event of any participating employer within SAUL, an amount of any pension shortfall (which cannot otherwise be recovered) in respect of that employer, may be spread across the remaining participating employers and reflected in the next actuarial valuation.
SAUL’s statutory funding objective is to have sufficient and appropriate assets to meet the costs incurred by the Trustee in paying SAUL’sbenefitsastheyfalldue(the“TechnicalProvisions”).TheTrusteeadoptsassumptionswhich,takenasawhole,areintended to be sufficiently prudent for pensions and benefits already in payment to continue to be paid and for the commitments which arise from Members’ accrued pension rights to be met.
The Technical Provisions assumptions include appropriate margins to allow for the possibility of events turning out worse than expected. However, the funding method and assumptions do not completely remove the risk that the Technical Provisions could be insufficient to provide benefits in the future.
A formal actuarial valuation of SAUL is carried out every three years by a professionally qualified and independent actuary. The last actuarial valuation was carried out with an effective date of 31 March 2014. Informal reviews of SAUL’s position, reflecting changes in market conditions, cash flow information and new accrual of benefits, are carried out between formal valuations.
The funding principles were agreed in November 2015 and are due to be reviewed at SAUL’s next formal valuation in 2017. The Trustee and Employers have agreed that the Technical Provisions deficit at the 31 March 2014 valuation will be addressed by employer contributions of 3% of Salaries between 1 April 2016 and 31 March 2018 (inclusive). The overall level of the Employers’ contributions has, therefore, increased from 13% of salaries to 16% of salaries with effect from 1 April 2016. QMUL is a Participating Employer in SAUL. The actuarial valuation applies to SAUL as a whole and does not identify surpluses or deficits applicable to individual employers. As a whole, the market value of SAUL’s assets was £1,927 million representing 97% of the liabilities for benefits accrued up to 31 March 2014.
28. Pension schemes (continued)

It is not possible to identify an individual Employer’s share of the underlying assets and liabilities of SAUL. QMUL accounts for its participation in SAUL as if it were a defined contribution scheme and pension costs are based on the amounts actually paid (i.e. cash amounts) in accordance with paragraphs 28.11 of FRS102. The Trustee and Employers have agreed that the Technical Provisions deficit at the 31 March 2014 valuation will be addressed by employer contributions of 3% of Salaries between 1 April 2016 and 31 March 2018 (inclusive). The defined benefit liability to be recognised by QMUL at 31 July 2016 in respect of the deficit contributions due to SAUL (i.e. the present value of the deficit contributions) is £2,164,819 (2015: £nil) see pension provision note 20. This liability is based on a projection of salaries over the period to 31 March 2018.
(iii) NHS Public Service Scheme
The public service scheme is an unfunded defined benefit scheme that covers NHS employers, General Practices and other bodies, allowed under the direction of the Secretary of State in England and Wales. As a consequence it is not possible for QMUL to identify its share of the underlying scheme assets and liabilities. QMUL therefore accounts for its pension costs on a defined contribution basis as permitted by FRS102.
Membership of this scheme is restricted to existing staff who are members and new staff who were already members by virtue of their previous National Health Service employment. The NHS scheme is funded centrally by the Treasury on a current cost basis.
(iv) London Hospital and St Bartholomew’s Hospital non teaching staff scheme
QMUL operates a defined benefit scheme in the UK, which provided both pensions in retirement and death benefits to non teaching staff of the London Hospital and St Bartholomew’s Hospital medical colleges. Pension benefits are related to member’s final salary at retirement and their length of service. Following the merger of the two medical colleges with QMUL, the members were offered membership of SAUL and ceased to accrue benefits in the scheme on 1 August 1996. There are no active members in the scheme.
The last triennial valuation of the scheme was at 31 July 2015. At that date the value of the assets was lower than the actuarial valuation by £249,000. QMUL has agreed a plan to reduce the actuarial deficit by annual payments of £32,000 on 1 August each year, rising each year in line with the Consumer Prices Index (CPI) to the previous September, with the shortfall targeted to be eliminated by 31 July 2022. QMUL meets the ongoing running expenses of the scheme together with any PPF levies.
55 Queen Mary University of London
Notes to the Financial Statements (continued)
The movement in the Deficit in the year was: Value at 31/07/2016
Value at 31/07/2015
Deficit in scheme at 1 August (161) (225)
Contribution by employer - 66
Current service cost (6) (8)
Return on assets excluding interest income 215 90
Actuarial loss (462) (84)
Deficit in scheme at 31 July (414) (161)
28. Pension schemes (continued)
Discretionary pension increases in the London Hospital section are set with reference to CPI subject to a maximum of 5% per annum. Pension increases for the St Bartholomew’s Hospital section are fixed at 3% per annum. £253,000 has been charged to the income and expenditure account in the year (2015: £64,000).
(v) Defined contribution schemeOne of QMUL’s subsidiaries offered a defined contribution scheme to its staff. The cost for the year was £16,000 (2015: £15,000). There were no outstanding contributions or prepaid contributions at the balance sheet date.

29. Transition to FRS102 and the 2015 SORP
As explained in the accounting policies, these are QMUL’s first financial statements prepared in accordance with FRS 102 and the SORP. The accounting policies set out in Note 1 have been applied in preparing the financial statements for the year ended 31 July 2016, the comparative information presented in these financial statements for the year ended 31 July 2015 and in the preparation of an opening FRS 102 Statement of Financial Position at 1 April 2014. In preparing its FRS 102, SORP based Statement of Financial Position, QMUL has adjusted amounts reported previously in financial statements prepared in accordance with its old basis of accounting (2007 SORP). An explanation of how the transition to FRS 102 and the SORP has affected QMUL’s financial position, financial performance and cash flows is set out in the following tables.
1 August 2014 31 July 2015
Consolidated QMUL Consolidated QMUL
Financial position £’000 £’000 £’000 £’000
Total reserves under 2007 SORP 81,557 99,055 101,377 118,359
Adjustments to opening balance sheet - - 346,576 330,078
Capital grants to reserves 180,877 176,536 2,154 2,363
Endowments to reserves 33,048 32,790 2,284 2,270
Revaluation of land and buildings 151,234 140,865 (1,219) (1,089)
Revaluation of investments 12,840 11,548 285 708
USS pension provision (19,675) (19,675) (18,889) (18,889)
Break cost of SWAPS embedded into higher rate of interest (11,354) (11,354) 553 553
Recognition of grant and donation income 4,703 4,449 1,163 1,163
Employee leave accrual (5,097) (5,081) 3,434 3,435
Goodwill - - 470 470
Total effect of transition to FRS 102 346,576 330,078 336,811 321,062
Total reserves under 2015 SORP 428,133 429,133 438,188 439,421
56 Queen Mary University of London
Notes to the Financial Statements (continued)

Year ended 31 July 2015
Consolidated QMUL
Financial performance £’000 £’000
Surplus for the year under 2007 SORP 18,274 18,575
Items previously in Statement of Total Recognised Gains and Losses:
Currency translation gain on net foreign investment 16 -
Management fee charged to capital endowment balances (328) (328)
Revaluation gains on investments 3,434 2,998
Endowments received 704 325
Actuarial gain on defined benefit pension scheme 4 4
Capital grants received 11,487 11,487
Reversal of deferred capital grants released to income and expenditure account
(9,334) (9,124)
Revaluation of land and buildings (1,219) (1,089)
Revaluation of investments 285 708
USS pension provision (18,889) (18,889)
Break cost of SWAPS embedded into higher rate of interest 553 553
Recognition of grant and donation income 1,163 1,163
Employee leave accrual 3,434 3,435
Goodwill 470 470
Total effect of transition to FRS 102 (8,220) (8,287)
Total comprehensive income for the year under 2015 SORP 10,054 10,288
Cash Flows
The only impact of the transition to FRS 102 on the cash flows of QMUL or the Group is the reclassification of some short term investments to cash and cash equivalents.
57 Queen Mary University of London
Notes to the Financial Statements (continued)
29. Transition to FRS102 and the 2015 SORP (continued)
30. Post Balance Sheet EventOn 1 September 2016 QMUL entered into a lease agreement with a developer. The developer agrees to procure the construction of a student development by the target date of 28 August 2018. On completion of the development, the landlord shall grant QMUL a 25 year lease of the premises.
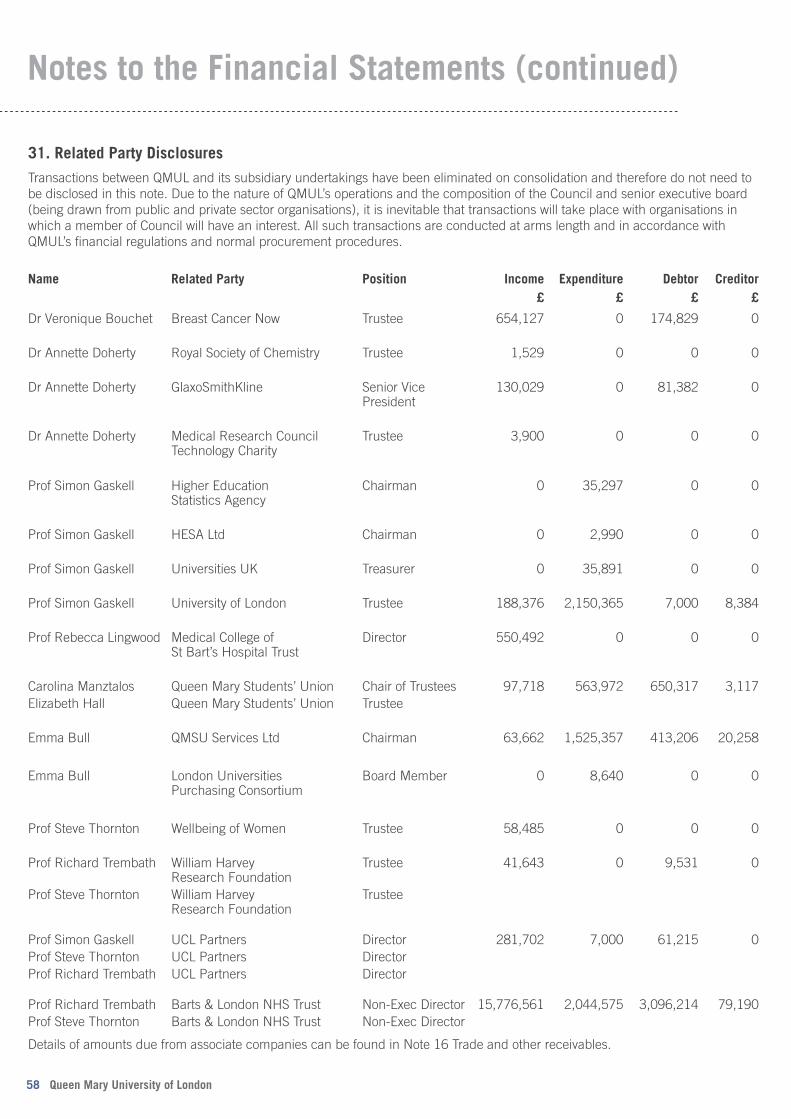
31. Related Party DisclosuresTransactions between QMUL and its subsidiary undertakings have been eliminated on consolidation and therefore do not need to be disclosed in this note. Due to the nature of QMUL’s operations and the composition of the Council and senior executive board (being drawn from public and private sector organisations), it is inevitable that transactions will take place with organisations in which a member of Council will have an interest. All such transactions are conducted at arms length and in accordance with QMUL’s financial regulations and normal procurement procedures.
Name Related Party Position Income Expenditure Debtor Creditor£ £ £ £
Dr Veronique Bouchet Breast Cancer Now Trustee 654,127 0 174,829 0
Dr Annette Doherty Royal Society of Chemistry Trustee 1,529 0 0 0
Dr Annette Doherty GlaxoSmithKline Senior Vice President
130,029 0 81,382 0
Dr Annette Doherty Medical Research Council Technology Charity
Trustee 3,900 0 0 0
Prof Simon Gaskell Higher Education Statistics Agency
Chairman 0 35,297 0 0
Prof Simon Gaskell HESA Ltd Chairman 0 2,990 0 0
Prof Simon Gaskell Universities UK Treasurer 0 35,891 0 0
Prof Simon Gaskell University of London Trustee 188,376 2,150,365 7,000 8,384
Prof Rebecca Lingwood Medical College of St Bart’s Hospital Trust
Director 550,492 0 0 0
Carolina Manztalos Queen Mary Students’ Union Chair of Trustees 97,718 563,972 650,317 3,117Elizabeth Hall Queen Mary Students’ Union Trustee
Emma Bull QMSU Services Ltd Chairman 63,662 1,525,357 413,206 20,258
Emma Bull London Universities Purchasing Consortium
Board Member 0 8,640 0 0
Prof Steve Thornton Wellbeing of Women Trustee 58,485 0 0 0
Prof Richard Trembath William Harvey Research Foundation
Trustee 41,643 0 9,531 0
Prof Steve Thornton William Harvey Research Foundation
Trustee
Prof Simon Gaskell UCL Partners Director 281,702 7,000 61,215 0Prof Steve Thornton UCL Partners DirectorProf Richard Trembath UCL Partners Director
Prof Richard Trembath Barts & London NHS Trust Non-Exec Director 15,776,561 2,044,575 3,096,214 79,190Prof Steve Thornton Barts & London NHS Trust Non-Exec Director
Details of amounts due from associate companies can be found in Note 16 Trade and other receivables.
58 Queen Mary University of London
Notes to the Financial Statements (continued)

59 Queen Mary University of London

Council Membership 2015/16
Chairman Sir Nicholas Montagu
Treasurer Mr Simon Linnett
Vice-Chairman Mr John Yard
Ex Officio MembersThe President and Principal Professor Simon GaskellThe President of the Students’ Union 2015/16 Carolina Mantzalos (appointed 01/08/15,
tenure ends 31/07/16)
Nominees of the President and Principal Tenure endsVice Principal and Executive Dean (Humanities and Social Sciences) Professor Morag Shiach 31/08/2016Vice Principal, School of Medicine and Dentistry Professor Richard Trembath (resigned 31/08/15) 31/08/2015Vice Principal, School of Medicine and Dentistry Professor Steve Thornton (appointed 17/02/16) 16/02/2020
Elected Members [Staff]Professor Paul Anderson 30/09/2017Professor Richard Ashcroft 30/09/2018Professor Raymond Kuhn (resigned 27/06/16) 27/06/2016Professor Geraint Wiggins 30/09/2018Ms Cheryl Mason (tenure ended 17/07/16) 17/07/2016
External MembersMs Kathryn Barrow 31/12/2016Dr Veronique Bouchet 31/12/2019Ms Monica Chadha (appointed 04/02/16) 04/02/2020Dr Annette Doherty (appointed 01/10/15) 01/10/2019Ms Elizabeth Hall (tenure ended 12/12/15) 12/12/2015Ms Stella Hall 06/07/2019Mr Richard Learwood (Resigned 27/10/15) 27/10/2015Mr Simon Linnett 19/10/2017Sir Nicholas Montagu 18/01/2018Ms Bushra Nasir 31/08/2017Ms Patricia Newton (tenure ended 31/08/16 ) 31/08/2016Mr Luke Savage 31/01/2018Mr David Willis 31/12/2017Mr John Yard 31/08/2018
Audit and Risk Committee Membership 2015/16Chairman [an external member of Council]Mr David Willis
Up to four other external members of CouncilMs Kathryn Barrow Ms Elizabeth Hall (tenure ended 12/12/15)Mr Richard Learwood (resigned 27/10/15)Ms Monica Chadha (appointed 03/03/2016)
Up to two co-opted membersMs Melissa TattonMr Nadim Choudhary (appointed 15/10/15)
60 Queen Mary University of London
Council and Audit and Risk Committee Membership Year ended 31 July 2016
61 Queen Mary University of London
This report has been produced by the Marketing and Communications forthe Finance Department. 757_16
QMUL is a company incorporated by Royal Charter registered in England. Its registered address is:Queen Mary University of LondonMile End Road,London E1 4NS
Tel: +44 (0)20 7882 5555Fax: +44 (0)20 8981 9110www.qmul.ac.uk