queensland health financial statements 2011–12 · 124 statement of comprehensive income..... 125...
TRANSCRIPT

124
Statement of Comprehensive Income . . . . . . . . . . . . . . . . . . . . . . . . . . . . . . . . . . . . . . . . . . . . . . . . . . . . . . . . . . . . . . . . . . . . . . . . . . . . . . . . . . . . . . 125
Statement of Financial Position . . . . . . . . . . . . . . . . . . . . . . . . . . . . . . . . . . . . . . . . . . . . . . . . . . . . . . . . . . . . . . . . . . . . . . . . . . . . . . . . . . . . . . . . . . . . . . 126
StatementofChangesinEquity . . . . . . . . . . . . . . . . . . . . . . . . . . . . . . . . . . . . . . . . . . . . . . . . . . . . . . . . . . . . . . . . . . . . . . . . . . . . . . . . . . . . . . . . . . . . . . 127
Statement of Cash Flows. . . . . . . . . . . . . . . . . . . . . . . . . . . . . . . . . . . . . . . . . . . . . . . . . . . . . . . . . . . . . . . . . . . . . . . . . . . . . . . . . . . . . . . . . . . . . . . . . . . . . . . . . 128
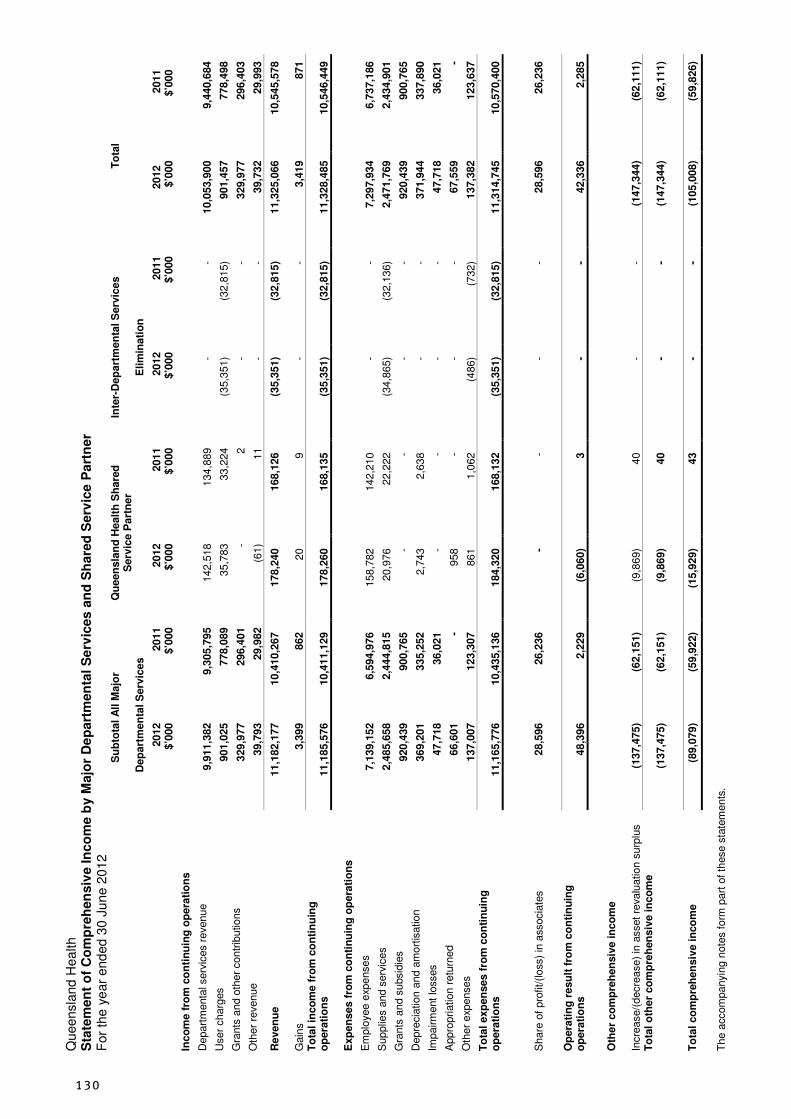
Statement of Comprehensive Income by Major Departmental Services and SSP . . . . . . . . . . . . . . . . . . . . . . . 129
Statement of Assets and Liabilities by Major Departmental Services and SSP . . . . . . . . . . . . . . . . . . . . . . . . . . 131
Notes to the Financial Statements . . . . . . . . . . . . . . . . . . . . . . . . . . . . . . . . . . . . . . . . . . . . . . . . . . . . . . . . . . . . . . . . . . . . . . . . . . . . . . . . . . . . . . . . . . . 133
Management Certificate . . . . . . . . . . . . . . . . . . . . . . . . . . . . . . . . . . . . . . . . . . . . . . . . . . . . . . . . . . . . . . . . . . . . . . . . . . . . . . . . . . . . . . . . . . . . . . . . . . . . . . . . . . 175
Independent Auditor’s Report. . . . . . . . . . . . . . . . . . . . . . . . . . . . . . . . . . . . . . . . . . . . . . . . . . . . . . . . . . . . . . . . . . . . . . . . . . . . . . . . . . . . . . . . . . . . . . . . . . 176
General InformationThe Department of Health is a Queensland Government department established under the Public Service Act 2008 and its registered trading name is Queensland Health
Queensland Health is controlled by the State of Queensland which is the ultimate parent entity.
The principal address of the department is: 147-163 Charlotte Street Brisbane QLD 4000
A description of the nature of the department’s operations and its principal activities is included in the notes to the financial statements.
For information in relation to Queensland Health’s financial statements:•[email protected] •visittheQueenslandHealthwebsiteat:www.health.qld.gov.au
Amounts shown in these financial statements may not add to the correct subtotals or totals due to rounding.
Queensland Health Financial statements 2011–12
Se
ctio
n 1
2
|
Fin
an
cia
l st
ate
me
nts
125
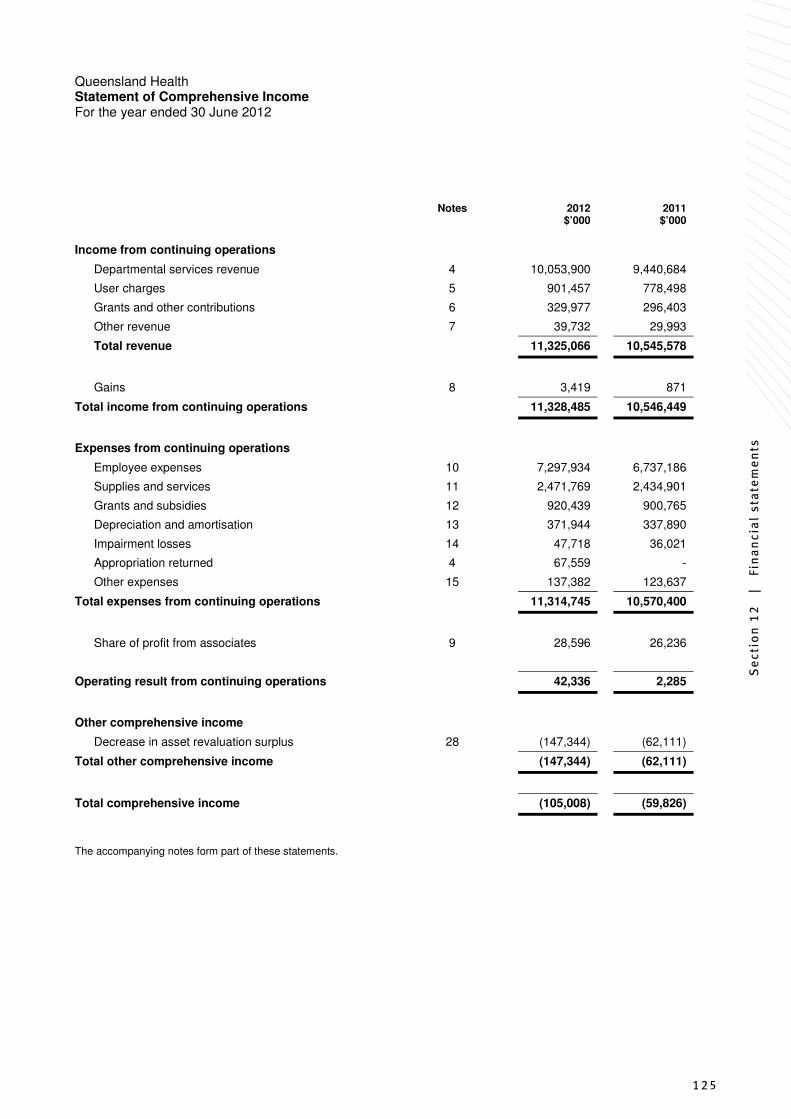
Queensland Health Statement of Comprehensive Income For the year ended 30 June 2012
Statement of Comprehensive Inco
Notes 2012 2011 $’000 $’000
Income from continuing operations
Departmental services revenue 4 10,053,900 9,440,684
User charges 5 901,457 778,498
Grants and other contributions 6 329,977 296,403
Other revenue 7 39,732 29,993
Total revenue 11,325,066 10,545,578
Gains 8 3,419 871
Total income from continuing operations 11,328,485 10,546,449
Expenses from continuing operations
Employee expenses 10 7,297,934 6,737,186
Supplies and services 11 2,471,769 2,434,901
Grants and subsidies 12 920,439 900,765
Depreciation and amortisation 13 371,944 337,890
Impairment losses 14 47,718 36,021
Appropriation returned 4 67,559 -
Other expenses 15 137,382 123,637
Total expenses from continuing operations 11,314,745 10,570,400
Share of profit from associates 9 28,596 26,236
Operating result from continuing operations 42,336 2,285
Other comprehensive income
Decrease in asset revaluation surplus 28 (147,344) (62,111)
Total other comprehensive income (147,344) (62,111)
Total comprehensive income (105,008) (59,826)
The accompanying notes form part of these statements.

126
Queensland Health Statement of Financial Position As at 30 June 2012
Notes 2012 2011 $’000 $’000
Current assets
Cash and cash equivalents 16 (64,741) (30,188)
Loans and receivables 17 636,886 547,332
Inventories 18 130,086 121,803
Assets held for sale 23 75 -
Other 21 111,618 93,996
Total current assets 813,924 732,943
Non-current assets
Loans and receivables 17 20,911 10,715
Intangible assets 22 149,464 121,595
Property, plant and equipment 23 8,384,794 7,178,564
Other financial assets 19 20,000 20,000
Investment in associate 20 69,192 40,923
Other 21 7,629 3,066
Total non-current assets 8,651,990 7,374,863
Total assets 9,465,914 8,107,806
Current liabilities
Payables 24 496,560 407,033
Accrued employee benefits 25 406,523 330,530
Unearned revenue 27 466 463
Total current liabilities 903,549 738,026
Non-current liabilities
Other financial liabilities 26 194,398 59,977
Unearned revenue 27 2,536 1,075
Total non-current liabilities 196,934 61,052
Total liabilities 1,100,483 799,078
Net assets 8,365,431 7,308,728
Equity
Contributed equity 4,984,167 3,815,959
Accumulated surplus 2,436,803 2,400,964
Asset revaluation surplus 28 944,461 1,091,805
Total equity 8,365,431 7,308,728
The accompanying notes form part of these statements.
Se
ctio
n 1
2
|
Fin
an
cia
l st
ate
me
nts
127
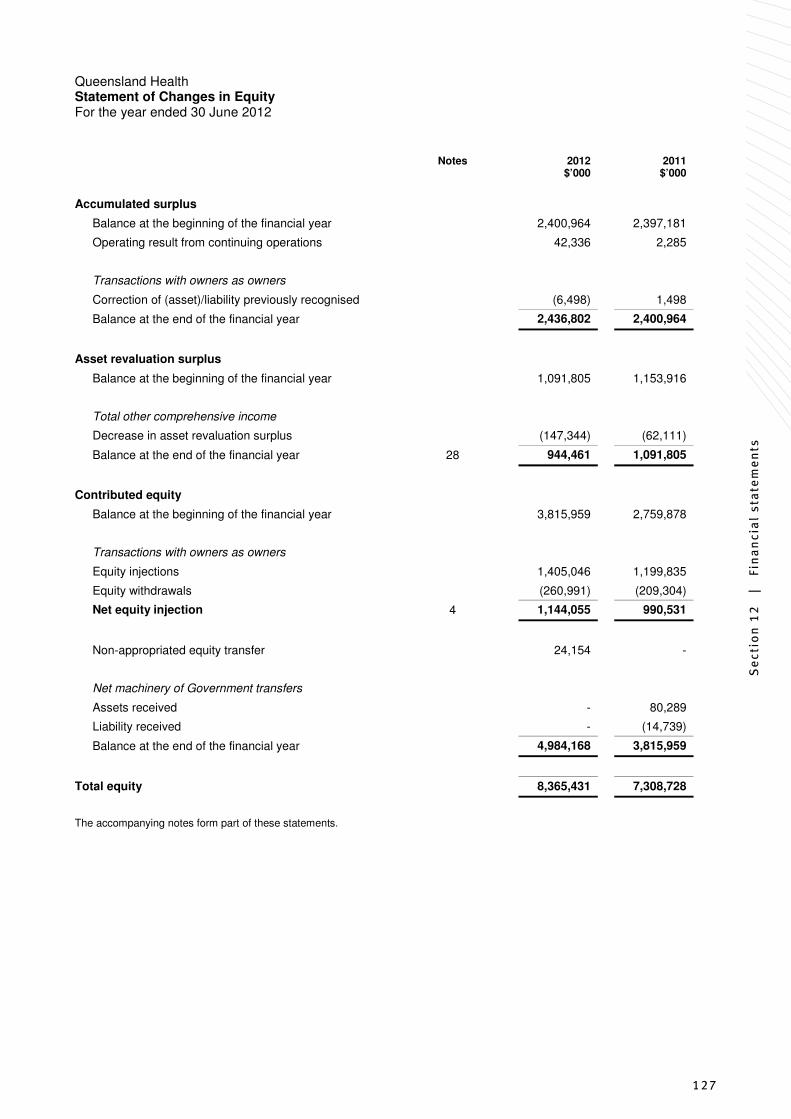
Queensland Health Statement of Changes in Equity For the year ended 30 June 2012
Statement of Changes in Equity
Notes 2012 2011 $’000 $’000
Accumulated surplus
Balance at the beginning of the financial year 2,400,964 2,397,181
Operating result from continuing operations 42,336 2,285
Transactions with owners as owners
Correction of (asset)/liability previously recognised (6,498) 1,498
Balance at the end of the financial year 2,436,802 2,400,964
Asset revaluation surplus
Balance at the beginning of the financial year 1,091,805 1,153,916
Total other comprehensive income
Decrease in asset revaluation surplus (147,344) (62,111)
Balance at the end of the financial year 28 944,461 1,091,805
Contributed equity
Balance at the beginning of the financial year 3,815,959 2,759,878
Transactions with owners as owners
Equity injections 1,405,046 1,199,835
Equity withdrawals (260,991) (209,304)
Net equity injection 4 1,144,055 990,531
Non-appropriated equity transfer 24,154 -
Net machinery of Government transfers
Assets received - 80,289
Liability received - (14,739)
Balance at the end of the financial year 4,984,168 3,815,959
Total equity 8,365,431 7,308,728
The accompanying notes form part of these statements.

128
Queensland Health Statement of Cash Flows For the year ended 30 June 2012
Statement of Cash Flows
Notes 2012 2011 $’000 $’000
Cash flows from operating activities
Inflows
Departmental services receipts 10,053,900 9,470,897
User charges 783,110 634,284
Grants and other contributions 322,673 272,349
Interest received 6,075 5,177
GST collected from customers 45,419 30,975
GST input tax credits 476,712 434,491
Other 33,216 22,992
Outflows
Employee expenses (7,249,547) (6,739,784)
Supplies and services (2,464,440) (2,377,871)
Grants and subsidies (918,362) (903,390)
Insurance (90,407) (75,167)
GST paid to suppliers (475,008) (435,216)
GST remitted (43,389) (32,944)
Other (50,674) (46,943)
Net cash provided by (used in) operating activities 29 429,278 259,850
Cash flows from investing activities
Inflows
Sales of property, plant and equipment 11,854 3,364
Loans and advances redeemed 5,255 27,770
Outflows
Payments for property, plant and equipment (1,722,850) (1,296,031)
Payments for intangible assets (44,080) (41,059)
Loans and advances made (16,640) (32,210)
Net cash provided by (used in) investing activities (1,766,461) (1,338,166)
Cash flows from financing activities
Inflows
Equity injections 1,429,200 1,199,835
Finance lease advanced 134,421 42,742
Outflows
Equity withdrawals (260,991) (227,517)
Net cash provided by (used in) financing activities 1,302,630 1,015,060
Net increase/(decrease) in cash and cash equivalents (34,553) (63,256)
Cash and cash equivalents at the beginning of the financial year (30,188) 33,068
Cash and cash equivalents at the end of the financial year 16 (64,741) (30,188)
The accompanying notes form part of these statements.

Se
ctio
n 1
2
|
Fin
an
cia
l st
ate
me
nts
129
Queensla
nd
Hea
lth
S
tate
men
t o
f C
om
pre
hen
siv
e In
co
me b
y M
ajo
r D
ep
art
men
tal
Se
rvic
es a
nd
Sh
are
d S
erv
ice P
art
ner
For
the y
ear
end
ed 3
0 J
un
e 2
012
Sta
tem
en
t o
f C
om
pre
hen
siv
e In
co
me b
y M
ajo
r D
ep
art
men
tal
Se
rvic
es a
nd
SS
P
P
reven
tio
n,
Pri
mary
Healt
h C
are
A
mb
ula
tory
Care
A
cu
te C
are
R
eh
ab
ilit
ati
on
an
d
Inte
gra
ted
Men
tal
Su
bto
tal
All
Majo
r
Pro
mo
tio
n,
E
xte
nd
ed
Care
H
ealt
h S
erv
ices
Dep
art
men
tal S
erv
ices
P
rote
cti
on
2012
2011
2012
2011
2012
2011
2012
2011
2012
2011
2012
2011
2012
2011
$’0
00
$’0
00
$’0
00
$’0
00
$’0
00
$’0
00
$’0
00
$’0
00
$’0
00
$’0
00
$’0
00
$’0
00
$’0
00
$’0
00
Inco
me f
rom
co
nti
nu
ing
op
era
tio
ns
D
epart
menta
l serv
ices
reve
nue
497,9
84
459,7
19
627,0
83
595,7
27
2,0
85,9
72
1,9
56,2
89
5,0
79,6
88
4,8
05,0
23
700,5
32
620,2
00
920,1
23
868,8
37
9,9
11,3
82
9,3
05,7
95
User
charg
es
18,0
53
19,2
55
2,6
57
1,9
34
144,0
23
127,3
82
677,5
76
573,6
88
42,4
68
40,8
25
16,2
48
15,0
05
901,0
25
778,0
89
Gra
nts
and o
ther
contr
ibutions
12,7
41
12,4
87
22,4
87
16,2
74
17,4
50
14,9
53
40,0
07
33,0
81
232,6
32
215,4
19
4,6
60
4,1
87
329,9
77
296,4
01
Oth
er
reve
nue
13,4
51
4,1
78
878
968
5,7
87
5,1
70
17,8
80
17,6
44
858
1,0
11
939
1,0
11
39,7
93
29,9
82
Reven
ue
542,2
29
495,6
39
653,1
05
614,9
03
2,2
53,2
32
2,1
03,7
94
5,8
15,1
51
5,4
29,4
36
976,4
90
877,4
55
941,9
70
889,0
40
11,1
82,1
77
10,4
10,2
67
Gain
s
95
20
228
50
571
132
1,7
21
407
533
192
251
61
3,3
99
862
To
tal
inco
me f
rom
co
nti
nu
ing
op
era
tio
ns
542,3
24
495,6
59
653,3
33
614,9
53
2,2
53,8
03
2,1
03,9
26
5,8
16,8
72
5,4
29,8
43
977,0
23
877,6
47
942,2
21
889,1
01
11,1
85,5
76
10,4
11,1
29
E
xp
en
ses f
rom
co
nti
nu
ing
op
era
tio
ns
E
mplo
yee e
xpenses
264,8
43
245,1
32
427,2
82
395,1
41
1,4
33,3
51
1,3
09,0
31
3,6
10,7
67
3,3
52,5
17
657,3
31
609,1
90
745,5
78
683,9
65
7,1
39,1
52
6,5
94,9
76
Supplie
s and s
erv
ices
144,9
83
143,4
18
140,1
16
137,0
24
575,9
62
549,6
95
1,2
95,0
94
1,2
96,3
71
191,3
30
178,0
06
138,1
73
140,3
01
2,4
85,6
58
2,4
44,8
15
Gra
nts
and s
ubsid
ies
66,1
75
79,3
09
51,9
47
50,0
64
163,4
63
157,3
62
570,0
52
542,9
04
48,1
88
47,6
58
20,6
14
23,4
68
920,4
39
900,7
65
Depre
cia
tion a
nd
am
ort
isation
18,2
65
16,3
30
20,7
31
18,5
13
74,2
71
66,6
85
195,4
84
176,7
81
33,9
43
31,9
63
26,5
07
24,9
80
369,2
01
335,2
52
Impairm
ent
losses
2,2
28
2,8
94
2,2
40
1,9
94
7,1
68
5,9
85
20,9
04
16,5
31
3,8
78
3,1
91
11,3
00
5,4
26
47,7
18
36,0
21
Appro
priation r
etu
rned
3,3
46
- 4,2
14
- 14,0
17
- 34,1
34
- 4,7
07
- 6,1
83
- 66,6
01
- O
ther
exp
enses
15,7
04
9,7
73
13,2
43
13,8
68
21,5
45
19,8
66
59,8
80
56,4
29
10,6
81
9,8
22
15,9
54
13,5
49
137,0
07
123,3
07
To
tal
exp
en
ses f
rom
co
nti
nu
ing
op
era
tio
ns
515,5
44
496,8
56
659,7
73
616,6
04
2,2
89,7
77
2,1
08,6
24
5,7
86,3
15
5,4
41,5
33
950,0
58
879,8
30
964,3
09
891,6
89
11,1
65,7
76
10,4
35,1
36
S
hare
of
pro
fit/(loss
) in
associa
tes
1,4
70
1,3
49
1,6
09
1,4
77
5,6
96
5,2
26
14,8
48
13,6
22
2,4
31
2,2
30
2,5
42
2,3
32
28,5
96
26,2
36
O
pera
tin
g r
esu
lt f
rom
co
nti
nu
ing
op
era
tio
ns
28,2
50
152
(4
,831)
(1
74)
(3
0,2
78)
528
45,4
05
1,9
32
29,3
96
47
(1
9,5
46)
(2
56)
48,3
96
2,2
29
O
ther
co
mp
reh
en
siv
e in
co
me
In
cre
ase/(
decre
ase)
in
asset
reva
luation s
urp
lus
(6
,359)
(2
,960)
(8
,136)
(3
,670)
(2
8,1
80)
(1
2,5
60)
(7
1,2
42)
(3
2,4
14)
(1
1,7
14)
(5
,239)
(1
1,8
44)
(5
,308)
(1
37,4
75)
(6
2,1
51)
To
tal
oth
er
co
mp
reh
en
siv
e in
co
me
(6
,359)
(2
,960)
(8
,136)
(3
,670)
(2
8,1
80)
(1
2,5
60)
(7
1,2
42)
(3
2,4
14)
(1
1,7
14)
(5
,239)
(1
1,8
44)
(5
,308)
(1
37,4
75)
(6
2,1
51)
T
ota
l co
mp
reh
en
siv
e
inco
me
21,8
91
(2
,808)
(1
2,9
67)
(3
,844)
(5
8,4
58)
(1
2,0
32)
(2
5,8
37)
(3
0,4
82)
17,6
82
(5
,192)
(3
1,3
90)
(5
,564)
(8
9,0
79)
(5
9,9
22)
The a
ccom
panyi
ng n
ote
s fo
rm p
art
of th
ese s
tate
ments
.
130
Queensla
nd
Hea
lth
S
tate
men
t o
f C
om
pre
hen
siv
e In
co
me b
y M
ajo
r D
ep
art
men
tal
Se
rvic
es a
nd
Sh
are
d S
erv
ice P
art
ner
For
the y
ear
end
ed 3
0 J
un
e 2
012
S
ub
tota
l A
ll M
ajo
r Q
ueen
sla
nd
Healt
h S
hare
d
Serv
ice P
art
ner
Inte
r-D
ep
art
men
tal S
erv
ices
To
tal
D
ep
art
men
tal S
erv
ices
E
lim
inati
on
2012
2011
2012
2011
2012
2011
2012
2011
$’0
00
$’0
00
$’0
00
$’0
00
$’0
00
$’0
00
$’0
00
$’0
00
Inco
me f
rom
co
nti
nu
ing
op
era
tio
ns
Depart
menta
l serv
ices r
eve
nue
9,9
11,3
82
9,3
05,7
95
142,5
18
134,8
89
- -
10,0
53,9
00
9,4
40,6
84
User
charg
es
901,0
25
778,0
89
35,7
83
33,2
24
(35,3
51)
(32,8
15)
901,4
57
778,4
98
Gra
nts
and o
ther
contr
ibutio
ns
329,9
77
296,4
01
- 2
- -
329,9
77
296,4
03
Oth
er
reve
nue
39,7
93
29,9
82
(61)
11
- -
39,7
32
29,9
93
Reven
ue
11,1
82,1
77
10,4
10,2
67
178,2
40
168,1
26
(35,3
51)
(32,8
15)
11,3
25,0
66
10,5
45,5
78
Gain
s
3,3
99
862
20
9
- -
3,4
19
871
To
tal
inco
me f
rom
co
nti
nu
ing
o
pera
tio
ns
11,1
85,5
76
10,4
11,1
29
178,2
60
168,1
35
(3
5,3
51)
(3
2,8
15)
11,3
28,4
85
10,5
46,4
49
Exp
en
ses f
rom
co
nti
nu
ing
op
era
tio
ns
Em
plo
yee e
xpenses
7,1
39,1
52
6,5
94,9
76
158,7
82
142,2
10
- -
7,2
97,9
34
6,7
37,1
86
Supplie
s and s
erv
ices
2,4
85,6
58
2,4
44,8
15
20,9
76
22,2
22
(34,8
65)
(32,1
36)
2,4
71,7
69
2,4
34,9
01
Gra
nts
and s
ubsid
ies
920,4
39
900,7
65
- -
-
- 920,4
39
900,7
65
Depre
cia
tion a
nd a
mort
isation
369,2
01
335,2
52
2,7
43
2,6
38
- -
371,9
44
337,8
90
Impairm
ent
losses
47,7
18
36,0
21
- -
-
- 47,7
18
36,0
21
Appro
priation r
etu
rned
66,6
01
- 958
- -
- 67,5
59
- O
ther
exp
enses
137,0
07
123,3
07
861
1,0
62
(486)
(732)
137,3
82
123,6
37
To
tal
exp
en
ses f
rom
co
nti
nu
ing
o
pera
tio
ns
11,1
65,7
76
10,4
35,1
36
184,3
20
168,1
32
(3
5,3
51)
(3
2,8
15)
11,3
14,7
45
10,5
70,4
00
Share
of
pro
fit/(loss
) in
ass
ocia
tes
28,5
96
26,2
36
- -
- -
28,5
96
26,2
36
Op
era
tin
g r
esu
lt f
rom
co
nti
nu
ing
o
pera
tio
ns
48,3
96
2,2
29
(6
,060)
3
- -
42,3
36
2,2
85
Oth
er
co
mp
reh
en
siv
e in
co
me
Incre
ase/(
decre
ase)
in a
sset
reva
luation s
urp
lus
(1
37,4
75)
(62,1
51)
(9,8
69)
40
- -
(147,3
44)
(6
2,1
11)
To
tal
oth
er
co
mp
reh
en
siv
e in
co
me
(1
37,4
75)
(62,1
51)
(9,8
69)
40
- -
(147,3
44)
(62,1
11)
To
tal
co
mp
reh
en
siv
e i
nco
me
(89,0
79)
(59,9
22)
(15,9
29)
43
- -
(105,0
08)
(59,8
26)
The a
ccom
panyi
ng n
ote
s fo
rm p
art
of th
ese s
tate
ments
.

Se
ctio
n 1
2
|
Fin
an
cia
l st
ate
me
nts
131
Queensla
nd
Hea
lth
S
tate
men
t o
f A
ssets
an
d L
iab
ilit
ies
by M
ajo
r D
ep
art
men
tal S
erv
ices
an
d S
ha
red
Serv
ice
Part
ner
As a
t 3
0 J
un
e 2
012
P
reven
tio
n,
Pri
mary
Healt
h C
are
A
mb
ula
tory
Care
A
cu
te C
are
R
eh
ab
ilit
ati
on
an
d
Inte
gra
ted
Men
tal
Su
bto
tal
All
Majo
r
Pro
mo
tio
n,
E
xte
nd
ed
Care
H
ealt
h S
erv
ices
Dep
art
men
tal S
erv
ices
P
rote
cti
on
2012
2011
2012
2011
2012
2011
2012
2011
2012
2011
2012
2011
2012
2011
$’0
00
$’0
00
$’0
00
$’0
00
$’0
00
$’0
00
$’0
00
$’0
00
$’0
00
$’0
00
$’0
00
$’0
00
$’0
00
$’0
00
Cu
rren
t assets
C
ash a
nd c
ash e
quiv
ale
nts
(3
,911)
(1,5
30)
(5,0
04)
(1,8
98)
(17,3
30)
(6,4
92)
(43,8
10)
(16,7
55)
(7,2
03)
(2,7
09)
(7,2
83)
(2,7
45)
(84,5
41)
(32,1
29)
Loans a
nd r
eceiv
able
s 29,3
04
26,0
08
37,4
96
32,2
58
129,8
68
110,3
81
328,3
22
284,8
78
53,9
78
46,0
48
54,5
78
46,6
52
633,5
46
546,2
25
Ass
ets
held
for
sale
3
- 4
- 16
- 39
- 7
- 6
- 75
- In
vento
ries
6,0
17
5,7
99
7,6
99
7,1
93
26,6
65
24,6
14
67,4
15
63,5
26
11,0
84
10,2
69
11,2
06
10,4
02
130,0
86
121,8
03
Oth
er
5,1
62
4,4
75
6,6
06
5,5
51
22,8
80
18,9
94
57,8
45
49,0
24
9,5
10
7,9
24
9,6
15
8,0
28
111,6
18
93,9
96
To
tal
cu
rren
t assets
36,5
75
34,7
52
46,8
01
43,1
04
162,0
99
147,4
97
409,8
11
380,6
73
67,3
76
61,5
32
68,1
22
62,3
37
790,7
84
729,8
95
N
on
-cu
rren
t assets
Loans a
nd r
eceiv
able
s 967
510
1,2
37
632
4,2
87
2,1
66
10,8
37
5,5
89
1,7
82
903
1,8
01
915
20,9
11
10,7
15
Inta
ngib
le a
ssets
6,8
77
5,7
62
8,8
00
7,1
47
30,4
77
24,4
57
77,0
52
63,1
19
12,6
67
10,2
02
12,8
08
10,3
36
148,6
81
121,0
23
Pro
pert
y, p
lant and
equip
ment
386,5
66
340,0
09
494,6
24
421,7
07
1,7
13,1
15
1,4
42,9
81
4,3
30,9
59
3,7
24,1
59
712,0
40
601,9
73
719,9
38
609,8
72
8,3
57,2
42
7,1
40,7
01
Oth
er
financia
l ass
ets
925
952
1,1
83
1,1
81
4,1
00
4,0
42
10,3
65
10,4
31
1,7
05
1,6
86
1,7
22
1,7
08
20,0
00
20,0
00
Inve
stm
ent in
associa
te
3,2
00
1,9
48
4,0
95
2,4
17
14,1
83
8,2
70
35,8
58
21,3
43
5,8
96
3,4
50
5,9
60
3,4
95
69,1
92
40,9
23
Oth
er
352
145
452
181
1,5
63
619
3,9
56
1,6
01
649
258
657
262
7,6
29
3,0
66
To
tal
no
n-c
urr
en
t assets
398,8
87
349,3
26
510,3
91
433,2
65
1,7
67,7
25
1,4
82,5
35
4,4
69,0
27
3,8
26,2
42
734,7
39
618,4
72
742,8
86
626,5
88
8,6
23,6
55
7,3
36,4
28
T
ota
l assets
435,4
62
384,0
78
557,1
92
476,3
69
1,9
29,8
24
1,6
30,0
32
4,8
78,8
38
4,2
06,9
15
802,1
15
680,0
04
811,0
08
688,9
25
9,4
14,4
39
8,0
66,3
23
C
urr
en
t liab
ilit
ies
Paya
ble
s 22,8
72
19,2
43
29,2
66
23,8
67
101,3
65
81,6
70
256,2
66
210,7
79
42,1
32
34,0
70
42,5
99
34,5
18
494,5
00
404,1
47
Acc
rued e
mplo
yee b
enefit
s 18,3
16
15,5
01
23,4
36
19,2
27
81,1
70
65,7
88
205,2
16
169,7
91
33,7
38
27,4
44
34,1
12
27,8
06
395,9
88
325,5
57
Oth
er
liabili
ties p
aya
ble
22
22
28
27
96
94
240
242
40
39
40
39
466
463
To
tal
cu
rren
t liab
ilit
ies
41,2
10
34,7
66
52,7
30
43,1
21
182,6
31
147,5
52
461,7
22
380,8
12
75,9
10
61,5
53
76,7
51
62,3
63
890,9
54
730,1
67
N
on
-cu
rren
t liab
ilit
ies
Oth
er
financia
l lia
bili
ties
8,9
91
2,8
55
11,5
06
3,5
42
39,8
48
12,1
20
100,7
44
31,2
81
16,5
63
5,0
57
16,7
46
5,1
22
194,3
98
59,9
77
Oth
er
liabili
ties p
aya
ble
116
51
150
63
518
218
1,3
18
561
216
91
218
91
2,5
36
1,0
75
To
tal
no
n- c
urr
en
t liab
ilit
ies
9,1
07
2,9
06
11,6
56
3,6
05
40,3
66
12,3
38
102,0
62
31,8
42
16,7
79
5,1
48
16,9
64
5,2
13
196,9
34
61,0
52
T
ota
l li
ab
ilit
ies
50,3
17
37,6
72
64,3
86
46,7
26
222,9
97
159,8
90
563,7
84
412,6
54
92,6
89
66,7
01
93,7
15
67,5
76
1,0
87,8
88
791,2
19
N
et
assets
385,1
45
346,4
06
492,8
06
429,6
43
1,7
06,8
27
1,4
70,1
42
4,3
15,0
54
3,7
94,2
61
709,4
26
613,3
03
717,2
93
621,3
49
8,3
26,5
51
7,2
75,1
04
The a
ccom
panyi
ng n
ote
s fo
rm p
art
of th
ese s
tate
ments
.

132
Queensla
nd
Hea
lth
S
tate
men
t o
f A
ssets
an
d L
iab
ilit
ies
by M
ajo
r D
ep
art
men
tal S
erv
ices
an
d S
ha
red
Serv
ice
Part
ner
As a
t 3
0 J
un
e 2
012
Su
bto
tal
All
Majo
r D
ep
art
men
tal
Serv
ices
Qu
een
sla
nd
Healt
h S
hare
d
Serv
ice P
art
ner
Inte
r-D
ep
art
men
tal S
erv
ices
Elim
inati
on
T
ota
l
2012
2011
2012
2011
2012
2011
2012
2011
$’0
00
$’0
00
$’0
00
$’0
00
$’0
00
$’0
00
$’0
00
$’0
00
Cu
rren
t assets
C
ash a
nd c
ash e
quiv
ale
nts
(8
4,5
41)
(32,1
29)
19,8
00
1,9
41
- -
(64,7
41)
(30,1
88)
Loan a
nd r
eceiv
able
s 633,5
46
546,2
25
3,3
40
1,1
07
- -
636,8
86
547,3
32
Ass
ets
held
for
sale
75
- -
- -
- 75
- In
vento
ries
130,0
86
121,8
03
- -
- -
130,0
86
121,8
03
Oth
er
111,6
18
93,9
96
- -
- -
111,6
18
93,9
96
To
tal
cu
rren
t assets
790,7
84
729,8
95
23,1
40
3,0
48
- -
813,9
24
732,9
43
N
on
-cu
rren
t assets
Loans a
nd r
eceiv
able
s 20,9
11
10,7
15
- -
- -
20,9
11
10,7
15
Inta
ngib
le a
ssets
148,6
81
121,0
23
783
572
- -
149,4
64
121,5
95
Pro
pert
y, p
lant and e
quip
ment
8,3
57,2
42
7,1
40,7
01
27,5
52
37,8
63
- -
8,3
84,7
94
7,1
78,5
64
Oth
er
financia
l ass
ets
20,0
00
20,0
00
- -
- -
20,0
00
20,0
00
Inve
stm
ent in
associa
te
69,1
92
40,9
23
- -
- -
69,1
92
40,9
23
Oth
er
7,6
29
3,0
66
- -
- -
7,6
29
3,0
66
To
tal
no
n-c
urr
en
t assets
8,6
23,6
55
7,3
36,4
28
28,3
35
38,4
35
- -
8,6
51,9
90
7,3
74,8
63
T
ota
l assets
9,4
14,4
39
8,0
66,3
23
51,4
75
41,4
83
- -
9,4
65,9
14
8,1
07,8
06
C
urr
en
t liab
ilit
ies
Paya
ble
s 494,5
00
404,1
47
2,0
60
2,8
86
- -
496,5
60
407,0
33
Acc
rued e
mplo
yee b
enefit
s
395,9
88
325,5
57
10,5
35
4,9
73
- -
406,5
23
330,5
30
Oth
er
liabili
ties p
aya
ble
466
463
- -
- -
466
463
To
tal
cu
rren
t liab
ilit
ies
890,9
54
730,1
67
12,5
95
7,8
59
- -
903,5
49
738,0
26
N
on
-cu
r ren
t liab
ilit
ies
Oth
er
financia
l lia
bili
ties
194,3
98
59,9
77
- -
- -
194,3
98
59,9
77
Oth
er
liabili
ties p
aya
ble
2,5
36
1,0
75
- -
- -
2,5
36
1,0
75
To
tal
no
n- c
urr
en
t liab
ilit
ies
196,9
34
61,0
52
- -
- -
196,9
34
61,0
52
T
ota
l l i
ab
ilit
ies
1,0
87,8
88
791,2
19
12,5
95
7,8
59
- -
1,1
00,4
83
799,0
78
N
et
assets
8,3
26,5
51
7,2
75,1
04
38,8
80
33,6
24
- -
8,3
65,4
31
7,3
08,7
28
The a
ccom
panyi
ng n
ote
s fo
rm p
art
of th
ese s
tate
ments
.
Se
ctio
n 1
2
|
Fin
an
cia
l st
ate
me
nts
133
Queensland Health Notes to the Financial Statements For the year ended 30 June 2012
Financial Statements
Note 1 Objectives and strategic priorities of Queensland Health Note 2 Summary of significant accounting policies Note 3 Major services, activities and other events Note 4 Reconciliation of payments from Consolidated Fund to departmental services revenue recognised in Statement of
Comprehensive Income Note 5 User charges Note 6 Grants and other contributions Note 7 Other revenue Note 8 Gains Note 9 Other income Note 10 Employee expenses Note 11 Supplies and services Note 12 Grants and subsidies Note 13 Depreciation and amortisation Note 14 Impairment losses Note 15 Other expenses Note 16 Cash and cash equivalents Note 17 Loans and receivables Note 18 Inventories Note 19 Other financial assets Note 20 Investments in associates Note 21 Other assets Note 22 Intangible assets Note 23 Property, plant and equipment Note 24 Payables Note 25 Accrued employee benefits Note 26 Other liabilities Note 27 Unearned revenue Note 28 Asset revaluation surplus by class Note 29 Reconciliation of operating surplus to net cash from operating activities Note 30 Non-cash financing and investing activities Note 31 Commitments for expenditure Note 32 Contingencies Note 33 Associated entities Note 34 Restricted assets Note 35 Fiduciary trust transactions and balances Note 36 Arrangements for the provision of public infrastructure by other entities Note 37 Collocation arrangements Note 38 Financial instruments Note 39 Key executive management personnel and remuneration Note 40 Administered transactions and balances Note 41 Reconciliation of payments from Consolidated Fund to administered revenue Note 42 Events after the reporting period

134
Queensland Health Notes to the Financial Statements For the year ended 30 June 2012
1 Objectives and strategic priorities of Queensland Health
Queensland Health’s objective is to provide dependable health care and better health for all Queenslanders. To achieve this, it is essential that services are well planned and organised and that they evolve and change in line with changing practice and community needs. This is reflected in the following four strategic priorities:
• Making Queenslanders healthier with a focus on prevention, promotion and protection as effective interventions in addressing the rates of chronic disease;
• Meeting Queenslanders’ healthcare needs safely and sustainably by addressing the challenge of meeting the healthcare needs of Queenslanders across the continuum of care;
• Reducing health service inequities across Queensland which seeks to provide improved equity of access to health services for specific population groups most at risk; and
• Developing our staff and enhancing organisational performance which values the role of people and resources in our organisation while maximising our achievement of these strategic priorities.
Queensland Health is predominantly funded for the major departmental services it delivers by parliamentary appropriations and by grants from the Australian Government. It also provides health services on a fee for service basis mainly for inpatient care.
2 Summary of significant accounting policies
(a) Statement of compliance
The financial statements have been prepared in compliance with section 42 of the Financial and Performance Management Standard 2009. These financial statements are general purpose financial statements. These have been prepared on an accrual basis in accordance with Australian Accounting Standards and Interpretations applicable to not-for-profit entities as Queensland Health is a not-for-profit entity. In addition, the financial statements comply with Queensland Treasury and Trade’s Minimum Reporting Requirements for the year ended 30 June, and other authoritative pronouncements. Except where stated, the historical cost convention is used.
(b) The reporting entity
Queensland Health is managed through a corporate office which undertakes a range of state-wide services. Direct service delivery is provided by a network of seventeen Health Service Districts (Districts). Districts provide a large range of health care activities and operate hospital facilities, community, mental and residential health centres. Districts are not separate reporting entities. In the process of reporting on the department as a single economic entity, all transactions and balances internal to the economic entity including the Queensland Health Shared Service Partner (Shared Service Partner, SSP), Districts and other Divisions have been eliminated in full. The major departmental services undertaken by Queensland Health and the activities of the Shared Service Partner are disclosed in Note 3. The financial statements include the value of all assets, liabilities, equity, revenues and expenses of Queensland Health.
The Mater Misericordiae Public Hospital (Mater Hospital), although treated as a District for operational purposes, does not form part of Queensland Health. As such, its operations are not included in the financial statements except to the extent that an annual amount is paid by way of a grant to the Mater Hospital for the provision of public hospital services in accordance with a binding Service Agreement.
(c) Investments in associates
The associated entities are those entities over which Queensland Health has significant influence but no control, and are neither subsidiaries nor joint ventures. Significant influence is the power to participate in the financial and operating policy decisions of the investee but is not control or joint control over those policies. As at 30 June 2012, Queensland Health has two associates - Translational Research Institute Pty Ltd and Translational Research Institute Trust (TRI). See Notes 20 and 33.
Investments in associates are accounted for using the equity method in accordance with AASB 128 Investments in Associates. Under the equity method, investments in associates are carried in the Statement of Financial Position at cost plus post-acquisition changes in Queensland Health's share of net assets. Queensland Health's share of post-acquisition profits or losses is recognised in the Statement of Comprehensive Income. Changes in the associates’ other comprehensive income are recognised in Queensland Health’s Other Comprehensive Income. Queensland Health’s share of income, expenses and equity movements of equity accounted investees are adjusted to align the accounting policies of the investee with those of Queensland Health.

Se
ctio
n 1
2
|
Fin
an
cia
l st
ate
me
nts
135
Queensland Health Notes to the Financial Statements For the year ended 30 June 2012
Queensland Health holds a 43% shareholding in the Queensland Children's Medical Research Institute (QCMRI). As Queensland Health has no rights to the net assets of QCMRI and no economic benefit is expected to flow to Queensland Health, an investment in associate asset has not been recognised.
When Queensland Health transacts with an associate, profits and losses resulting from the transactions with the associate are recognised in the financial statements only to the extent of interests in the associate that are not related to Queensland Health. Dividends receivable from associates are recognised in the Statement of Comprehensive Income as a component of other income. Queensland Health has reinvested all distributions from TRI in accordance with the TRI Trust Deed.
When the share of losses in an associate equals or exceeds its interest in the associate, including any unsecured long-term receivables and loans, Queensland Health does not recognise further losses, unless it has incurred obligations or made payments on behalf of the associate.
(d) Administered transactions and balances
Queensland Health administers, but does not control, certain resources on behalf of the Government. In doing so, it has responsibility and is accountable for administering related transactions and items, but does not have the discretion to deploy the resources for the achievement of its objectives. These transactions and balances are not significant in comparison to Queensland Health’s overall financial performance and financial position and are disclosed in Note 40.
(e) Trust transactions and balances
Queensland Health acts in a fiduciary trust capacity in relation to patient trust accounts. Consequently, these transactions and balances are not recognised in the financial statements. Although patient funds are not controlled by Queensland Health, trust activities are included in the audit performed annually by the Auditor-General of Queensland. Note 35 provides additional information on the balances held in patient trust accounts.
(f) Major departmental services revenue and administered revenue
Appropriations provided under the Annual Appropriation Act are recognised as revenue when received or as a receivable when approved by Queensland Treasury and Trade. Amounts appropriated to Queensland Health for transfer to other entities in accordance with legislative or other requirements are reported as an administered appropriation item.
(g) User charges, fees and fines
User charges and fees are controlled by Queensland Health when they can be deployed for the achievement of departmental objectives. User charges and fees controlled by Queensland Health comprise of hospital fees, sales of goods and services and rental income. Hospital fees mainly consist of private patient hospital fees, interstate patient revenue and Department of Veterans’ Affairs revenue.
Private patient hospital fees revenue is recognised when invoices are raised. Interstate patient revenue and Department of Veterans’ Affairs revenue are recognised based on estimates. Fees and fines collected, but not controlled, by Queensland Health are recognised and reported as administered revenue in Note 40.
(h) Grants and other contributions
Grants, contributions, donations and gifts that are non-reciprocal in nature are recognised as revenue in the year in which Queensland Health obtains control over them. This includes amounts received from the Australian Government for programs that have not been fully completed at the end of the financial year. Where grants are received that are reciprocal in nature, revenue is recognised over the term of the funding arrangements.
Contributed assets are recognised at their fair value. Contributions of services are recognised only when a fair value can be determined reliably and the services would be purchased if they had not been donated.
(i) Finance and borrowing costs
Finance and borrowing costs are recognised as an expense in the period in which they are incurred. Borrowing costs include interest on short-term and long-term borrowings, and ancillary administration charges.
(j) Cash and cash equivalents
Cash includes all cash on hand and in banks, cheques receipted but not banked at the reporting date, call deposits and cash debit facility. Restricted assets are disclosed in Note 34.

136
Queensland Health Notes to the Financial Statements For the year ended 30 June 2012
(k) Loans and receivables
Trade debtors are recognised at their face value less any impairment. The recoverability of trade debtors is reviewed on an ongoing basis at an operating unit level. Trade receivables are generally settled within 60 days, while other receivables may take longer than twelve months. Any allowance for impairment is based on loss events disclosed in Note 17. All known bad debts are written off when identified.
Payroll receivables include interim cash payments made to employees and salary overpayments. Queensland Health has commenced a process to recover these balances by working with the individuals affected. Refer Notes 3, 17 and 42.
Advances include insurance claims, property purchases, long service leave reimbursements, amounts advanced to employees to align the payment of salaries and wages to a uniform pay day throughout Queensland Health and amounts advanced to entities for services to be performed. No collateral is held for advances made and no interest is charged on outstanding amounts.
Loans to other entities are financial assets with fixed or determinable payments that are not quoted in an active market. These are recognised at amortised cost, using the effective interest method. Refer Notes 17 and 38.
These loans are approved by the Treasurer under the Financial Accountability Act 2009, as Queensland Health does not have the capacity to grant loans to other entities. Approval also exists to the extent of the financial arrangements for funding the public hospital component of the redevelopment of the Mater Hospital. These balances are regarded as administered and are recorded at book value with no interest charged. Refer Note 40. Approval also exists to the extent of a Transaction Agreement between Queensland Health and Telstra for the relocation of the South Brisbane Telephone Exchange as part of the Queensland Children’s Hospital Development. Refer Note 17.
(l) Inventories
Inventories consist mainly of medical supplies held for distribution to hospitals. These inventories are provided to the hospitals for no or nominal consideration. Inventories are measured at weighted average cost, adjusted for obsolescence. Unless material, inventories do not include supplies held for ready use in the wards throughout the hospital facilities and are expensed on issue from Queensland Health’s main storage facilities.
(m) Property, plant and equipment
Queensland Health holds property, plant and equipment in order to meet its core objective of providing dependable health care and better health for all Queenslanders.
Items of property, plant and equipment with a cost or other value equal to more than the following thresholds and with a useful life of more than one year are recognised at acquisition. Items below these values are expensed on acquisition.
Class Threshold
Buildings and Land Improvements $10,000
Land $1
Plant and Equipment $5,000
Property, plant and equipment are initially recorded at consideration plus any other costs directly incurred in bringing the asset ready for use. Items or components that form an integral part of an asset are recognised as a single (functional) asset. The cost of items acquired during the financial year has been judged by management to materially represent the fair value at the end of the reporting period.
Where assets are received for no consideration from another Queensland Government department (whether as a result of a machinery-of-Government change or other involuntary transfer), the acquisition cost is recognised as the gross carrying amount in the books of the transferor immediately prior to the transfer together with any accumulated depreciation. Assets acquired at no cost or for nominal consideration, other than from an involuntary transfer from another Queensland Government entity, are initially recognised at their fair value at the date of acquisition.
Land and buildings are measured at fair value in accordance with AASB 116 Property, Plant and Equipment and Queensland Treasury’s Non-Current Asset Policies for the Queensland Public Sector. Land is measured at fair value each year using independent revaluations, desktop market revaluations or indexation by the State Valuation Service within the Department of Natural Resources and Mines. Independent revaluations are performed with sufficient regularity to ensure assets are carried at fair value.
Se
ctio
n 1
2
|
Fin
an
cia
l st
ate
me
nts
137
Queensland Health Notes to the Financial Statements For the year ended 30 June 2012
Buildings are measured at fair value utilising either independent revaluation or applying an interim revaluation methodology developed by the external registered valuer. Assets under construction are not revalued until they are ready for use. Reflecting the specialised nature of Queensland Health buildings (health service buildings and on hospital-site residential facilities), fair value is determined using depreciated replacement cost methodology. Depreciated replacement cost is determined as the replacement cost less the cost to bring to current standards.
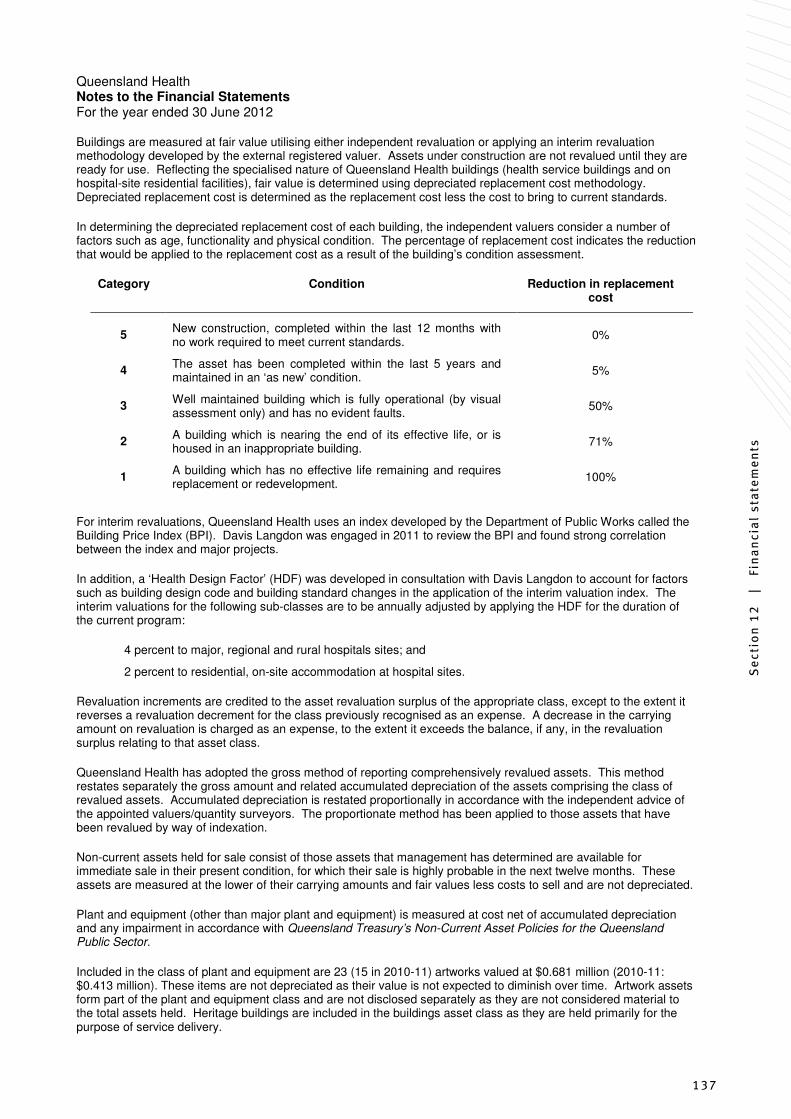
In determining the depreciated replacement cost of each building, the independent valuers consider a number of factors such as age, functionality and physical condition. The percentage of replacement cost indicates the reduction that would be applied to the replacement cost as a result of the building’s condition assessment.
Category Condition Reduction in replacement cost
5 New construction, completed within the last 12 months with no work required to meet current standards.
0%
4 The asset has been completed within the last 5 years and maintained in an ‘as new’ condition.
5%
3 Well maintained building which is fully operational (by visual assessment only) and has no evident faults.
50%
2 A building which is nearing the end of its effective life, or is housed in an inappropriate building.
71%
1 A building which has no effective life remaining and requires replacement or redevelopment.
100%
For interim revaluations, Queensland Health uses an index developed by the Department of Public Works called the Building Price Index (BPI). Davis Langdon was engaged in 2011 to review the BPI and found strong correlation between the index and major projects.
In addition, a ‘Health Design Factor’ (HDF) was developed in consultation with Davis Langdon to account for factors such as building design code and building standard changes in the application of the interim valuation index. The interim valuations for the following sub-classes are to be annually adjusted by applying the HDF for the duration of the current program:
4 percent to major, regional and rural hospitals sites; and
2 percent to residential, on-site accommodation at hospital sites.
Revaluation increments are credited to the asset revaluation surplus of the appropriate class, except to the extent it reverses a revaluation decrement for the class previously recognised as an expense. A decrease in the carrying amount on revaluation is charged as an expense, to the extent it exceeds the balance, if any, in the revaluation surplus relating to that asset class.
Queensland Health has adopted the gross method of reporting comprehensively revalued assets. This method restates separately the gross amount and related accumulated depreciation of the assets comprising the class of revalued assets. Accumulated depreciation is restated proportionally in accordance with the independent advice of the appointed valuers/quantity surveyors. The proportionate method has been applied to those assets that have been revalued by way of indexation.
Non-current assets held for sale consist of those assets that management has determined are available for immediate sale in their present condition, for which their sale is highly probable in the next twelve months. These assets are measured at the lower of their carrying amounts and fair values less costs to sell and are not depreciated.
Plant and equipment (other than major plant and equipment) is measured at cost net of accumulated depreciation and any impairment in accordance with Queensland Treasury’s Non-Current Asset Policies for the Queensland Public Sector.
Included in the class of plant and equipment are 23 (15 in 2010-11) artworks valued at $0.681 million (2010-11: $0.413 million). These items are not depreciated as their value is not expected to diminish over time. Artwork assets form part of the plant and equipment class and are not disclosed separately as they are not considered material to the total assets held. Heritage buildings are included in the buildings asset class as they are held primarily for the purpose of service delivery.
138
Queensland Health Notes to the Financial Statements For the year ended 30 June 2012
Depreciation
Property, plant and equipment are depreciated on a straight-line basis. Annual depreciation is based on fair values and Queensland Health’s assessments of the useful remaining life of individual assets. Land is not depreciated. Assets under construction (work-in-progress) are not depreciated until they are ready for use.
Any expenditure that increases the capacity or service potential of an asset is capitalised and depreciated over the remaining useful life of the asset. Major spares purchased specifically for particular assets are capitalised and depreciated on the same basis as the asset to which they relate.
The depreciable amount of improvements to or on leasehold land is allocated progressively over the shorter of the estimated useful lives of the improvements or the unexpired period of the lease. The unexpired period of leases includes any option period where exercise of the option is probable.
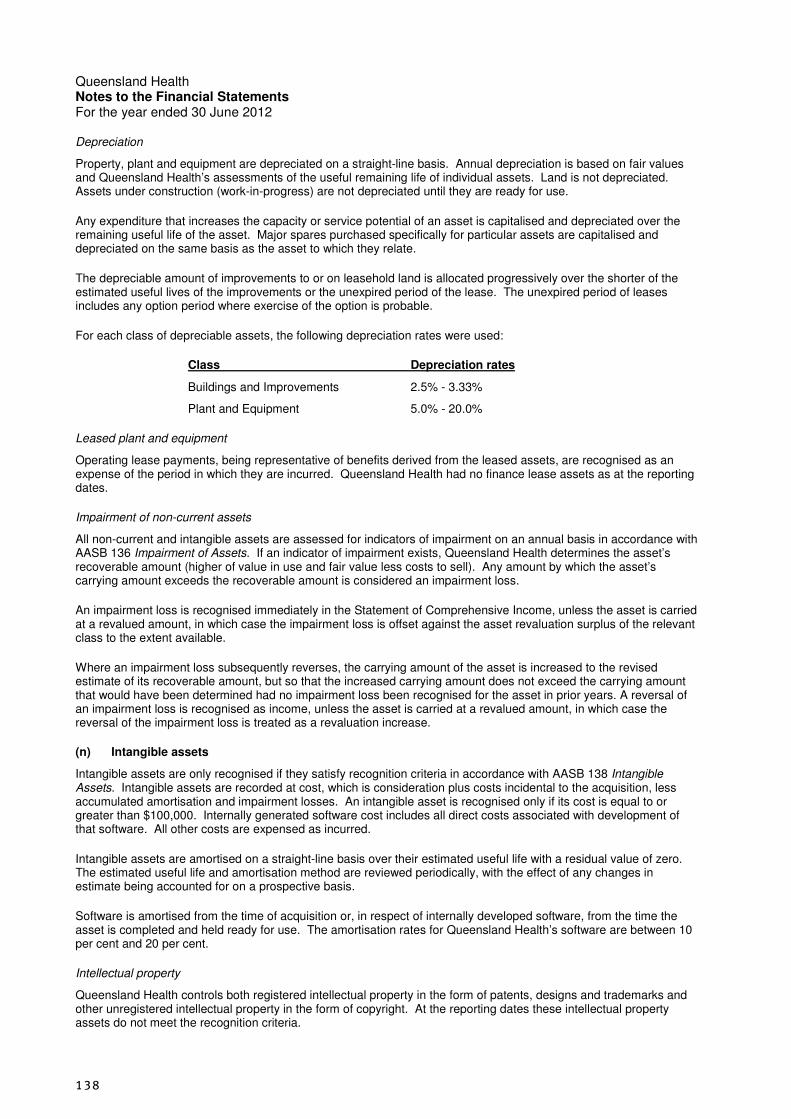
For each class of depreciable assets, the following depreciation rates were used:
Class Depreciation rates
Buildings and Improvements 2.5% - 3.33%
Plant and Equipment 5.0% - 20.0%
Leased plant and equipment
Operating lease payments, being representative of benefits derived from the leased assets, are recognised as an expense of the period in which they are incurred. Queensland Health had no finance lease assets as at the reporting dates.
Impairment of non-current assets
All non-current and intangible assets are assessed for indicators of impairment on an annual basis in accordance with AASB 136 Impairment of Assets. If an indicator of impairment exists, Queensland Health determines the asset’s recoverable amount (higher of value in use and fair value less costs to sell). Any amount by which the asset’s carrying amount exceeds the recoverable amount is considered an impairment loss.
An impairment loss is recognised immediately in the Statement of Comprehensive Income, unless the asset is carried at a revalued amount, in which case the impairment loss is offset against the asset revaluation surplus of the relevant class to the extent available.
Where an impairment loss subsequently reverses, the carrying amount of the asset is increased to the revised estimate of its recoverable amount, but so that the increased carrying amount does not exceed the carrying amount that would have been determined had no impairment loss been recognised for the asset in prior years. A reversal of an impairment loss is recognised as income, unless the asset is carried at a revalued amount, in which case the reversal of the impairment loss is treated as a revaluation increase.
(n) Intangible assets
Intangible assets are only recognised if they satisfy recognition criteria in accordance with AASB 138 Intangible Assets. Intangible assets are recorded at cost, which is consideration plus costs incidental to the acquisition, less accumulated amortisation and impairment losses. An intangible asset is recognised only if its cost is equal to or greater than $100,000. Internally generated software cost includes all direct costs associated with development of that software. All other costs are expensed as incurred.
Intangible assets are amortised on a straight-line basis over their estimated useful life with a residual value of zero. The estimated useful life and amortisation method are reviewed periodically, with the effect of any changes in estimate being accounted for on a prospective basis.
Software is amortised from the time of acquisition or, in respect of internally developed software, from the time the asset is completed and held ready for use. The amortisation rates for Queensland Health’s software are between 10 per cent and 20 per cent.
Intellectual property
Queensland Health controls both registered intellectual property in the form of patents, designs and trademarks and other unregistered intellectual property in the form of copyright. At the reporting dates these intellectual property assets do not meet the recognition criteria.

Se
ctio
n 1
2
|
Fin
an
cia
l st
ate
me
nts
139
Queensland Health Notes to the Financial Statements For the year ended 30 June 2012
(o) Arrangements for the provision of public infrastructure by other entities
Queensland Health has entered into a number of contractual arrangements with private sector entities for the construction and operation of public infrastructure facilities for a period of time on departmental land. After an agreed period of time, ownership of the facilities will pass to Queensland Health (see Note 36). Arrangements of this type are known as Public Private Partnerships (PPP).
Although the land on which the facilities have been constructed remains an asset of Queensland Health, Queensland Health does not control the facilities associated with these arrangements. Therefore these facilities are not recorded as assets. Queensland Health receives rights and incurs obligations under these arrangements, including:
• rights to receive the facility at the end of the contractual terms; and
• rights and obligations to receive and pay cash flows in accordance with the respective contractual arrangements, other than those which are received by the respective Hospital Foundations under a Deed of Assignment.
The arrangements have been structured to minimise risk exposure for Queensland Health. Queensland Health has not recognised any rights or obligations that may attach to those arrangements, other than those recognised under generally accepted accounting principles.
(p) Collocation agreements
Queensland Health has entered into a number of contractual arrangements with private sector entities for the construction and operation of private health facilities for a period of time on departmental land. After an agreed period of twenty-five years, ownership of the facilities will pass to Queensland Health.
As with PPP type agreements, Queensland Health does not recognise these facilities as assets. Consequently, Queensland Health has not recognised any rights or obligations that may attach to those agreements, other than those recognised under generally accepted accounting principles. Current collocation agreements in operation are listed in Note 37.
(q) Other financial assets
Queensland Health has fixed rate deposits with Queensland Treasury Corporation approved by the Treasurer. Each investment has known receipts and fixed maturity dates. Queensland Health has the ability and intention to continue to hold investments until maturity as the investments contribute towards the Government’s objective of promoting high quality health research under the Smart State Research Grants Program. Refer Notes 19 and 38.
(r) Payables
Payables are recognised for amounts to be paid in the future for goods and services received. Trade creditors are measured at the agreed purchase/contract price, gross of applicable trade and other discounts. The amounts are unsecured and normally settled within 60 days.
(s) Other financial liabilities
Finance lease advanced
Leases are classified as finance leases when the terms of the lease transfer substantially all the risks and rewards of ownership to the lessee. Finance lease payments received in advance are recorded as liabilities. Refer Note 26.
Administered borrowings
Queensland Health is responsible for administration of the Mater Hospital redevelopment loan. There is no financial benefit derived from the transactions by Queensland Health. The financial risk associated with the public component of the project has been covered by the State Government and is treated as an administered balance. Refer Note 40.
(t) Financial instruments
A financial instrument is any contract that gives rise to both a financial asset of one entity and a financial liability or equity instrument of another entity. Queensland Health holds financial instruments in the form of cash, call deposits, loans, receivables and payables. Queensland Health accounts for its financial instruments in accordance with AASB 139 Financial Instruments: Recognition and Measurement and reports instruments under AASB 7 Financial Instruments: Disclosures. Queensland Health does not enter into transactions for speculative purposes, or for hedging. Financial assets and financial liabilities are recognised in the Statement of Financial Position when Queensland Health becomes a party to the contractual provisions of the financial instrument.
140
Queensland Health Notes to the Financial Statements For the year ended 30 June 2012
Financial instruments are classified and measured as follows: cash and cash equivalents – held at fair value through profit or loss; receivables – held at amortised cost; loans to other entities – held at amortised cost; payables – held at amortised cost.
Loans to other entities are initially recognised at fair value plus directly attributable transaction costs. They are subsequently recorded at amortised cost, using the effective interest method, net of any allowance for impairment. The effective interest rate is the rate that exactly discounts estimated future cash payments or receipts through the expected life of a financial instrument (or, when appropriate, a shorter period) to the net carrying amount of that instrument.
Financial assets, other than those held at fair value through profit or loss, are assessed for indicators of impairment at the end of each reporting period. For certain categories of financial asset, such as trade receivables, assets that are assessed not to be impaired individually are additionally assessed for impairment on a collective basis. For financial assets carried at amortised cost, the amount of the impairment loss recognised is the difference between the asset’s carrying amount and the present value of estimated future cash flows, discounted at the financial asset’s original effective interest rate. When a trade receivable is considered uncollectible, it is written off against the allowance account. Subsequent recoveries of amounts previously written off are credited against the allowance account. Changes in the carrying amount of the allowance account are recognised in profit or loss.
Financial assets (excluding cash) and liabilities held by Queensland Health are classified as level 3 in the fair value hierarchy. Fair values are derived from data not observable in a market. Other disclosures relating to the measurement and financial risk management of other financial instruments are included in Note 38.
(u) Employee benefits
Queensland Health classifies salaries and wages, rostered days-off, sick leave, annual leave and long service leave levies and employer superannuation contributions as employee benefits in accordance with AASB 119 Employee Benefits (Note 10). Wages and salaries due but unpaid at reporting date are recognised in the Statement of Financial Position at current salary rates.
Under the Queensland Government’s Annual Leave Central Scheme (established on 30 June 2008) and Long Service Leave Central Scheme (established on 1 July 1999), levies are payable by Queensland Health to cover the cost of employees’ annual leave (including leave loading and on-costs) and long service leave. The provisions for these schemes are reported on a Whole-of-Government basis pursuant to AASB 1049 Whole of Government and General Government Sector Financial Reporting. These levies are expensed in the period in which they are paid or payable. Amounts paid to employees for annual leave and long service leave are claimed from the schemes quarterly in arrears. Refer Note 25. Non-vesting employee benefits such as sick leave are recognised as an expense when taken.
Employer superannuation contributions are paid to QSuper, the superannuation scheme for Queensland Government employees, at rates determined by the Treasurer on the advice of the State Actuary. Contributions are expensed in the period in which they are paid or payable and Queensland Health’s obligation is limited to its contribution to QSuper. The QSuper scheme has defined benefit and defined contribution categories. The liability for defined benefits is held on a Whole-of-Government basis and reported in those financial statements pursuant to AASB 1049 Whole of Government and General Government Sector Financial Reporting.
(v) Allocation of overheads to major departmental services
The revenues and expenses of Queensland Health’s corporate services are allocated to departmental services on the basis of the services they primarily support and are included in the Statement of Comprehensive Income by Major Departmental Services and Shared Service Partner. Refer Note 3.
(w) Insurance
Property and general losses above a $10,000 threshold are insured through the Queensland Government Insurance Fund (QGIF). Health litigation payments above a $20,000 threshold and associated legal fees are also insured through QGIF. Premiums are calculated by QGIF on a risk assessed basis. Queensland Health pays premiums to WorkCover Queensland in respect of its obligations for employee compensation.
(x) Services received free of charge or for a nominal value
Contributions of services are recognised only if the services would have been purchased if they had not been donated and their fair value can be measured reliably. When this is the case, an equal amount is recognised as revenue and an expense.

Se
ctio
n 1
2
|
Fin
an
cia
l st
ate
me
nts
141
Queensland Health Notes to the Financial Statements For the year ended 30 June 2012
(y) Contributed equity
Non-reciprocal transfers of assets and liabilities between wholly-owned Queensland State Public Sector entities as a result of machinery-of-Government changes are adjusted to Contributed Equity in accordance with Interpretation 1038 Contributions by Owners Made to Wholly-Owned Public Sector Entities. Appropriations for equity adjustments are similarly designated.
(z) Taxation
Queensland Health is a State body as defined under the Income Tax Assessment Act 1936 and is exempt from Commonwealth taxation with the exception of Fringe Benefits Tax (FBT) and Goods and Services Tax (GST). FBT and GST are the only Commonwealth taxes recognised by Queensland Health. Refer Note 17.
(aa) Issuance of financial statements
The financial statements are authorised for issue by the Director-General and the Deputy Director-General, System Support Services, at the date of signing the Management Certificate.
(bb) Critical accounting judgements and key sources of estimation uncertainty
The preparation of financial statements necessarily requires the determination and use of certain critical accounting estimates, assumptions and management judgements. The estimates and associated assumptions are based on historical experience and other factors that are considered to be relevant, and are reviewed on an ongoing basis. Actual results may differ from these estimates. Revisions to accounting estimates are recognised in the period in which the estimate is revised, if the revision affects only that period, or in the period of the revision and future periods if the revision affects both current and future periods.
Estimates and assumptions that have a potential significant effect are outlined in the following financial statement notes:
User charges – Note 2(g)
Loans and receivables – Note 17
Property, plant and equipment – Note 23
Contingencies – Note 32
Credit risk exposure – Note 38(c)
(cc) Rounding and comparatives
Amounts included in the financial statements are in Australian dollars and have been rounded to the nearest $1,000 or, where the amount is $500 or less, to zero unless the disclosure of the full amount is specifically required. Comparative information has been restated where necessary to be consistent with disclosures in the current reporting period.
(dd) New and revised accounting standards
Queensland Health did not voluntarily change any of its accounting policies during 2011-12 and is not permitted to early adopt accounting standard unless approved by Queensland Treasury and Trade. Accounting Standards effective for the first time in the current year have had no effect on the reported results or financial position. Those standards having a minor impact on presentation and disclosure are: AASB 2010-4 Further Amendments to Australian Accounting Standards arising from the Annual Improvements Project, AASB 1054 Australian Additional Disclosures and AASB 2011-1 Amendments to Australian Accounting Standards arising from the Trans-Tasman Convergence Project.
The following Accounting Standards in issue but not yet effective are expected to impact Queensland Health in future periods. The potential effect of the revised Standards and Interpretations on Queensland Health’s financial statements has not yet been determined.
Standards effective for annual periods beginning on or after 1 July 2012:
• AASB 101 Presentation of Financial Statements amendments require that items of other comprehensive income are grouped into: (a) items that will not be reclassified subsequently to profit or loss; and (b) items that will be reclassified subsequently to profit or loss when specific conditions are met.
142
Queensland Health Notes to the Financial Statements For the year ended 30 June 2012
Standards effective for annual periods beginning on or after 1 January 2013:
• AASB 10 Consolidated Financial Statements requires that the only basis for consolidation is control and includes a new definition of control that contains three elements: (a) power over an investee, (b) exposure, or rights, to variable returns from its involvement with the investee, and (c) the ability to use its power over the investee to affect the amount of the investor's returns.
• AASB 13 Fair Value Measurement provides a new definition of fair value, establishes a framework for measuring fair value, and requires extensive disclosures about fair value measurements. Quantitative and qualitative disclosures based on the three-level fair value hierarchy currently required for financial instruments only under AASB 7 Financial Instruments: Disclosures will be extended to cover all assets and liabilities within the scope of AASB 13.
Standards effective for annual periods beginning on or after 1 January 2015:
• AASB 9 Financial Instruments requires all financial assets to be subsequently measured at amortised cost or fair value. Financial assets can only be measured at amortised cost if: (a) the asset is held within a business model whose objective is to hold assets in order to collect contractual cash flows; and (b) the contractual terms of the asset give rise to cash flows that are solely payments of principal and interest. For financial liabilities which are designated as at fair value through profit or loss, the amount of change in fair value that is attributable to changes in the liability’s credit risk will be recognised in other comprehensive income.
3 Major services, activities and other events
Major services
Queensland Health has six major departmental services and the Shared Service Partner (SSP). These reflect Queensland Health’s planning priorities as articulated in the Queensland Statewide Health Services Plan 2007-2012 and supports investment decision-making based on the health continuum. The identity and purpose of each major departmental service undertaken by Queensland Health during the reporting period is summarised as follows:
Prevention, Promotion, Protection
Aims to prevent illness or injury, promote and protect good health and well-being of the population and reduce the health status gap between the most and least advantaged in the community.
Primary Health Care
Address health problems or established risk factors of individuals and small targeted groups providing curative, promotive, preventative and rehabilitation services. The services include early detection and intervention services and risk factor management programs.
Ambulatory Care
Aims to provide equitable access to quality emergency and outpatient services provided by Queensland’s public hospitals and incorporate activities of Queensland public hospitals outpatient department as well as emergency medical services provided in the public hospital emergency departments.
Acute Care
Aims to increase equity and access to high quality acute hospital services for patients on a Statewide basis and includes the provision of medical, surgical and obstetric service in Queensland hospitals.
Rehabilitation and Extended Care
Aims to improve the functional status of patients with an impairment or disability slow the progression of a person’s health condition and assist them to maintain and better manage their health condition. This major departmental service predominantly targets the needs of people with long-term conditions that have chronic consequences.
Integrated Mental Health Services
This major departmental service spans the health continuum through the provision of mental health promotion, community based illness prevention activities, acute mental health services, outpatient treatment and mental health support services as well as the extended treatment services provided through designated mental health units.
Shared Service Partner
Queensland Health’s Shared Service Partner provides a standard suite of corporate services to Queensland Health, linen services and some additional out of scope services.
Se
ctio
n 1
2
|
Fin
an
cia
l st
ate
me
nts
143
Queensland Health Notes to the Financial Statements For the year ended 30 June 2012
Major activities
Payroll system
Queensland Health introduced a new payroll system on 24 March 2010 which resulted in significant disruptions to payroll activities, pay issues for employees and a backlog of unprocessed payroll forms.
Following these disruptions, Queensland Health undertook a number of key steps to address these issues including:
• employing additional payroll staff on a temporary basis;
• ensuring access to emergency financial assistance for all employees, where required;
• developing and rolling out a localised payroll operating model to re-establish working relationships between employees and payroll hubs;
• resolving many of the critical system issues and implementing arrangements to address the remaining problems on a priority basis; and
• engaging Ernst and Young to independently review Queensland Health’s current payroll and rostering systems.
The Auditor-General of Queensland issued two major reports in 2010 in regards to Queensland Health’s payroll implementation as follows:
• the Auditor-General of Queensland Report to Parliament No. 7 for 2010 ‘Information systems governance and control’, including the Queensland Health Implementation of Continuity Project; and
• the Auditor-General of Queensland Report to Parliament No. 13 for 2010 ‘Results of audits at 31 October 2010. This was a general financial statements audit which highlighted a number of findings relating to Queensland Health payroll.
Queensland Health accepted all of the Auditor-General’s recommendations and developed a comprehensive plan for their implementation.
Furthermore, Queensland Health committed to deliver the recommendations from Ernst and Young’s review of the Queensland Health payroll system, including immediate initiation of the Queensland Health Payroll Foundation Program (the Program) which included:
• development of a blueprint to improve the underlying technology platforms and to establish a business requirements and processing baseline for a long term, optimised payroll solution;
• establishing a robust governance arrangement based on clear roles and responsibilities, defined key deliverables and performance indicators under the direction of a new program steering committee – as recommended by the QAO;
• using lessons learnt from the implementation of the project and incorporating these learnings into future planning activities;
• reviewing existing contractual arrangements for system development and support and more rigorous and robust arrangements where required;
• mobilising a project team to undertake the scope of work of the Program, whilst maintaining ongoing stabilisation and system improvement activities and resources;
• identifying opportunities for quick wins with the payroll system and operational processing and managing their implementation as a priority;
• undertaking, as part of the program’s priorities, an assessment of the gap between business requirements and the implemented solution.
In late 2011, all payroll activities were consolidated under a new Payroll Portfolio following a recommendation from KPMG. This has provided significant benefit and economies of scale and the Portfolio is now progressively implementing the recommendations from a Payroll Audit undertaken by KPMG in May and June 2012 which include initiation of a number of major programs of work over several years.
Queensland Health has undertaken a significant amount of work to stabilise the Queensland Health payroll and rostering systems to ensure employees receive their correct pay and entitlements. Queensland Health remains committed to resolving staff payroll issues as soon as possible and will continue working towards delivering a payroll system which meets the needs of our staff.

144
Queensland Health Notes to the Financial Statements For the year ended 30 June 2012
Overpayments recovery
On 30 May 2012 the Minister for Health announced the lifting of the moratorium on the recovery of overpayments. Queensland Health has commenced a process to recover overpayments by working with the individually affected employees. Given the large number of staff affected, this is a considerable process and is expected to take some time. As a government department, Queensland Health has a responsibility to taxpayers to recover overpaid monies to staff. As at 30 June 2012, Queensland Health is not aware of any significant level of outstanding underpayments.
Refer Note 42 for further information regarding corrective measures undertaken.
Overpayments receivables and waiver
Included in receivables is an amount of $86.368 million (2010-11: $59.449 million) relating to salary overpayments and $8.177 million (2010-11: $9.599 million) relating to interim cash payments made to staff who required immediate financial assistance. As at 30 June 2012, approximately $17.8 million of total overpayments to date has been voluntarily repaid. Refer Note 17.
Employees overpaid between 1 July 2011 and 13 May 2012 by a cumulative amount up to and including $200 will have their overpayments waived, similar to the previous financial year. This amount was selected as the cost of recovery was determined to outweigh the overpayment amount. This waiver will benefit approximately 26 thousand (23 thousand in 2010-11) employees at a cost of approximately $1.9 million ($2.2 million in 2010-11).
Other events
Voluntary Separation Payments
In 2011-12 the Queensland Government announced a program of Voluntary Separation Packages (VSPs) for non-frontline staff across the public sector to contribute savings and reprioritise spending to frontline service delivery. In 2011-12, 853 VSPs were accepted in accordance with the terms of the Queensland Public Service Commission’s Voluntary Separation Program Handbook. The VSP program ceased in May 2012 and no further offers were made to employees. Employees who have previously accepted a VSP, but are yet to cease employment, will continue to separate as planned.
Alleged fraud and Queensland Health response
During 2011-12, Queensland Health management became aware of an incident of alleged fraud involving misappropriated grants expense. This matter was referred immediately to the Queensland Police Service (QPS) and the Crime and Misconduct Commission (CMC). Queensland Health continues to assist both the QPS and CMC in their investigations.
The estimated loss to Queensland Health is approximately $16 million, of which $11.275 million relates to the 2011-12 financial year and the remainder relates to prior periods. Prior period comparatives have been adjusted to reflect this loss.
Queensland Health’s immediate response to the alleged fraud was to implement a new Internal Control Framework (ICF). The new ICF includes increased controls for certifying expenditure, vendor creation and cost centre management. Ongoing improvement strategies include a review and rationalisation of delegations across the State, development of exception reports through data analysis tools as additional detective controls, a review and analysis of District spend profiles and a review of purchasing methods.
The Ernst and Young Report on Fraud Prevention and Control, resulting from the review of Fraud Control within Queensland Health contained recommendations relating to fraud risk awareness training, fraud risk planning and fraud risk assessment. Queensland Health has established the Fraud Risk and Control Improvement Project to deliver the following key initiatives:
• development of a standard fraud risk awareness training program;
• development of a generic fraud risk management; and
• development of a fraud risk register.
Queensland Health also participated in an inter-governmental group to develop training and awareness material focusing on internal controls, delegations and accountability and cost centre management. An implementation strategy for the state-wide roll out of internal controls training has been completed.
Queensland Health will continue to improve fraud prevention and corruption control strategies to ensure the effective and efficient management of public resources.

Se
ctio
n 1
2
|
Fin
an
cia
l st
ate
me
nts
145
Queensland Health Notes to the Financial Statements For the year ended 30 June 2012
2012 2011 $’000 $’000
4 Reconciliation of payments from Consolidated Fund to departmental services revenue recognised in Statement of Comprehensive Income
Budgeted departmental services appropriation* 9,935,644 9,092,426
Transfers from other headings 59,972 200,684
Unforeseen expenditure 58,284 177,787
Total departmental services receipts 10,053,900 9,470,897
Less: Opening balance of departmental services revenue receivable - 30,213
Departmental services revenue recognised in Statement of Comprehensive Income*
10,053,900 9,440,684
* Departmental services revenue includes Australian Government contributions of $2,816 million (2010-11: $2,522 million) appropriated through Queensland Treasury and Trade.
Departmental services revenue includes $67.559 million payable to Queensland Treasury and Trade in 2011-12
Reconciliation of payments from Consolidated Fund to equity adjustment
recognised in Contributed Equity (Statement of Changes in Equity)
Budgeted equity adjustment appropriation 1,203,991 1,173,292
Transfers to other headings (59,936) (200,974)
Equity adjustment receipts 1,144,055 972,318
Plus: Opening balance of equity withdrawal payable - 18,213
Less: Closing balance of equity withdrawal payable - -
Equity adjustment recognised in Contributed Equity 1,144,055 990,531
5 User charges
Hospital fees 620,660 485,221
Sale of goods and services 272,130 285,175
Rental income 8,667 8,102
901,457 778,498
6 Grants and other contributions
Australian Government grants
Nursing home grants 64,343 57,197
Other specific purpose recurrent grants 118,647 74,690
Other specific purpose capital grants 6,500 6,419
Total Australian Government grants 189,490 138,306
Other grants 127,446 129,317
Donations other 5,738 4,726
Donations inventory* 6,035 6,042
Donations non-current physical assets 593 17,082
Other 675 930
329,977 296,403
* Inventory is donated by the Australian Government as part of the Australia wide vaccinations initiative.

146
Queensland Health Notes to the Financial Statements For the year ended 30 June 2012
2012 2011 $’000 $’000
7 Other revenue
Interest 6,065 5,189
Sale proceeds of non-capitalised assets 202 407
Licences and registration charges 2,686 2,448
Recoveries 11,524 12,955
Grants returned 10,487 1,476
Other 8,768 7,518
39,732 29,993
8 Gains
Gain on sale of property, plant and equipment 3,419 871
9 Other income
Share of profit from associates 28,596 26,236
10 Employee expenses
Employee benefits
Wages and salaries 5,643,608 5,289,028
Employer superannuation contributions 595,765 550,831
Annual leave expense 643,436 608,526
Long service leave levy 122,022 115,138
Termination payments 100,263 4,851
Employee related expenses
Workers’ compensation premium 82,167 63,293
Payroll tax 40,268 35,164
Other employee related expenses 70,405 70,355
7,297,934 6,737,186
30 June 2012 30 June 2011
Number of employees
Health Service Districts 60,114 58,350
Queensland Health State-wide Services 5,274 5,404
Queensland Health Corporate 3,476 4,194
68,864 67,948
The number of employees includes full-time employees and part-time employees measured on a full-time equivalent basis. Key executive management and personnel are reported in Note 39.
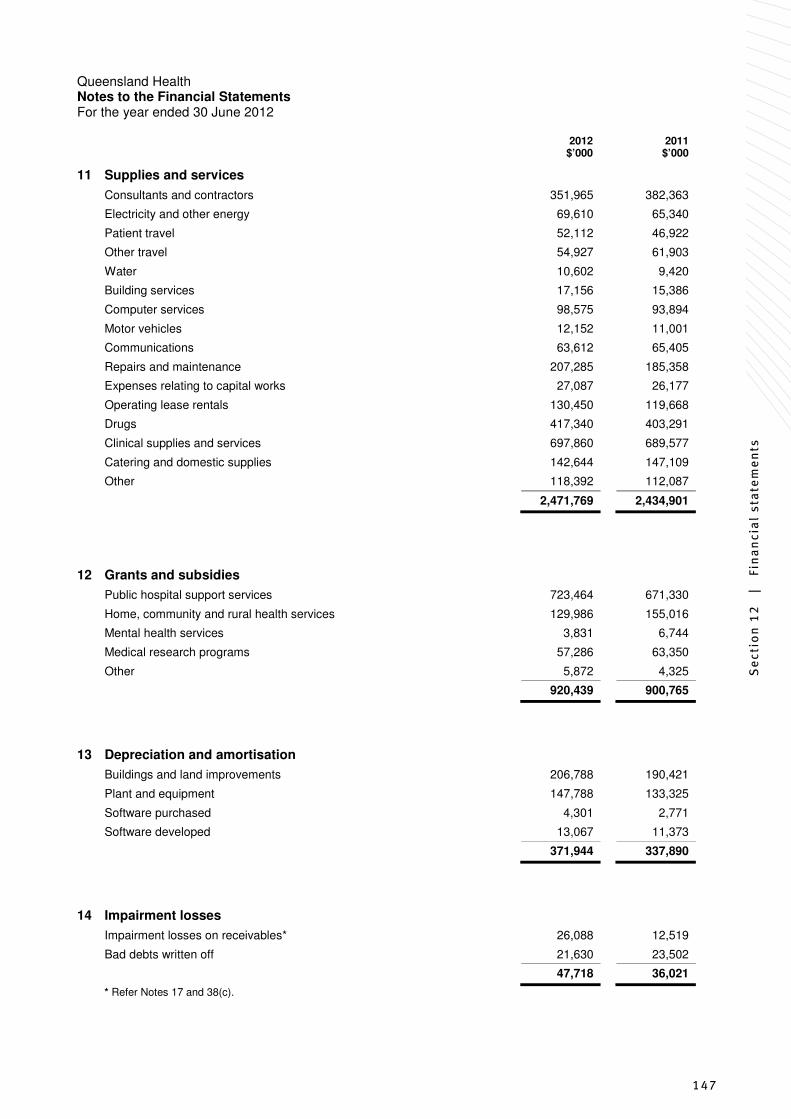
Se
ctio
n 1
2
|
Fin
an
cia
l st
ate
me
nts
147
Queensland Health Notes to the Financial Statements For the year ended 30 June 2012
2012 2011 $’000 $’000
11 Supplies and services
Consultants and contractors 351,965 382,363
Electricity and other energy 69,610 65,340
Patient travel 52,112 46,922
Other travel 54,927 61,903
Water 10,602 9,420
Building services 17,156 15,386
Computer services 98,575 93,894
Motor vehicles 12,152 11,001
Communications 63,612 65,405
Repairs and maintenance 207,285 185,358
Expenses relating to capital works 27,087 26,177
Operating lease rentals 130,450 119,668
Drugs 417,340 403,291
Clinical supplies and services 697,860 689,577
Catering and domestic supplies 142,644 147,109
Other 118,392 112,087
2,471,769 2,434,901
12 Grants and subsidies
Public hospital support services 723,464 671,330
Home, community and rural health services 129,986 155,016
Mental health services 3,831 6,744
Medical research programs 57,286 63,350
Other 5,872 4,325
920,439 900,765
13 Depreciation and amortisation
Buildings and land improvements 206,788 190,421
Plant and equipment 147,788 133,325
Software purchased 4,301 2,771
Software developed 13,067 11,373
371,944 337,890
14 Impairment losses
Impairment losses on receivables* 26,088 12,519
Bad debts written off 21,630 23,502
47,718 36,021
* Refer Notes 17 and 38(c).

148
Queensland Health Notes to the Financial Statements For the year ended 30 June 2012
2012 2011 $’000 $’000
15 Other expenses
External audit fees* 1,593 1,596
Bank fees 536 480
Insurance** 75,754 62,906
Inventory written off 5,121 2,519
Losses from the disposal of non-current assets 5,013 5,855
Losses
Public monies 11,275 5,389
Public property 4 38
Special payments
Donations/gifts 23 68
Ex-gratia payments 1,367 5,577
Other legal costs 7,359 8,121
Journals and subscriptions 7,899 8,940
Advertising 12,954 14,556
Interpreter fees 5,114 4,765
Other 3,370 2,827
137,382 123,637
*Total audit fees paid to the Queensland Audit Office relating to the 2011-12 financial year are $1,592,809 (2010-11:
$1,595,874). There are no non-audit services included in this amount.
** Certain losses of public property and health litigation costs are insured with the Queensland Government Insurance Fund. Refer Note 2(w).
16 Cash and cash equivalents
Cash at bank and on hand (146,876) (100,654)
24 hour call deposits 82,135 70,466
(64,741) (30,188)
Queensland Health’s bank accounts are grouped within the Whole-of-Government set-off arrangement with
the Queensland Treasury Corporation. As part of the above Whole-of-Government banking arrangements, Queensland Health has an approved working debit facility of $500 million. As at 30 June 2012, Queensland Health had accessed $147 million of this facilityQueensland Health does not earn interest on surplus funds and is not charged interest or fees for accessing its approved cash debit facility as it is part of the Whole-of-Government banking arrangements. Interest earned on the aggregate set-off arrangement balance accrues to the Consolidated Fund. Cash deposited at call with the Queensland Treasury Corporation earns interest at a rate of 3.95% (2010-11: 5.34%).
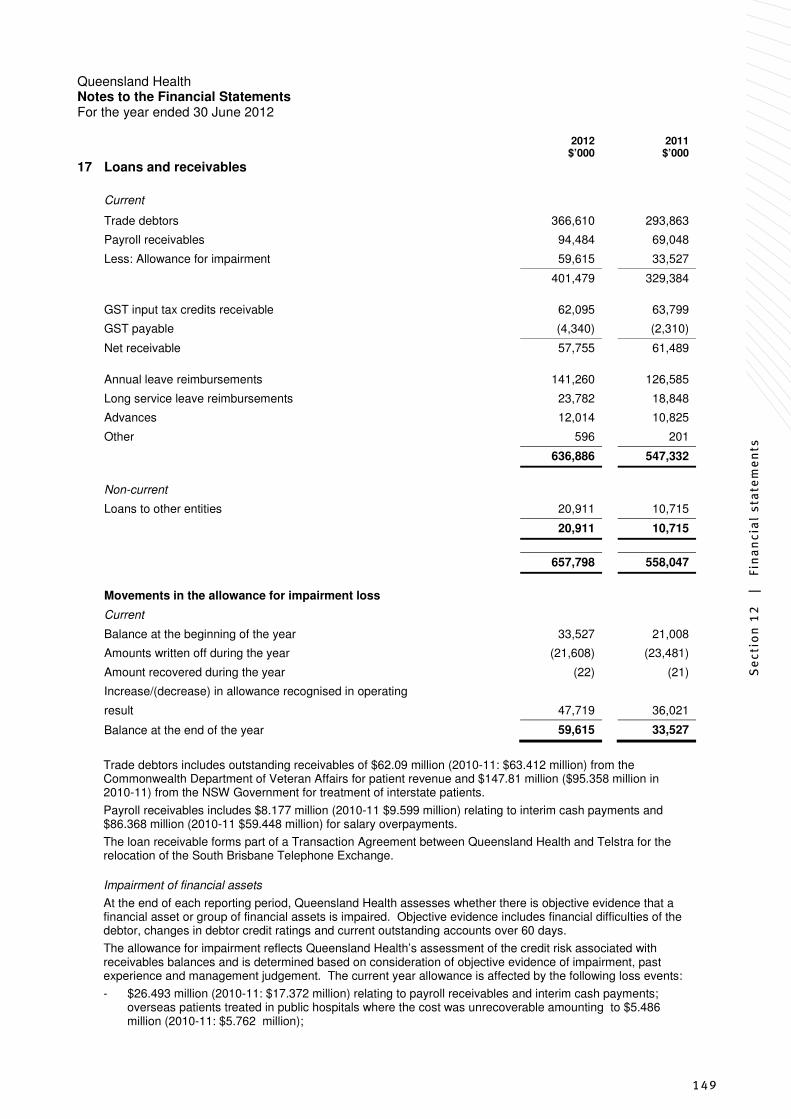
Se
ctio
n 1
2
|
Fin
an
cia
l st
ate
me
nts
149
Queensland Health Notes to the Financial Statements For the year ended 30 June 2012
2012 2011 $’000 $’000
17 Loans and receivables
Current
Trade debtors 366,610 293,863
Payroll receivables 94,484 69,048
Less: Allowance for impairment 59,615 33,527
401,479 329,384
GST input tax credits receivable 62,095 63,799
GST payable (4,340) (2,310)
Net receivable 57,755 61,489
Annual leave reimbursements 141,260 126,585
Long service leave reimbursements 23,782 18,848
Advances 12,014 10,825
Other 596 201
636,886 547,332
Non-current
Loans to other entities 20,911 10,715
20,911 10,715
657,798 558,047
Movements in the allowance for impairment loss
Current
Balance at the beginning of the year 33,527 21,008
Amounts written off during the year (21,608) (23,481)
Amount recovered during the year (22) (21)
Increase/(decrease) in allowance recognised in operating
result 47,719 36,021
Balance at the end of the year 59,615 33,527
Trade debtors includes outstanding receivables of $62.09 million (2010-11: $63.412 million) from the
Commonwealth Department of Veteran Affairs for patient revenue and $147.81 million ($95.358 million in 2010-11) from the NSW Government for treatment of interstate patients.
Payroll receivables includes $8.177 million (2010-11 $9.599 million) relating to interim cash payments and $86.368 million (2010-11 $59.448 million) for salary overpayments.
The loan receivable forms part of a Transaction Agreement between Queensland Health and Telstra for the relocation of the South Brisbane Telephone Exchange.
Impairment of financial assets
At the end of each reporting period, Queensland Health assesses whether there is objective evidence that a financial asset or group of financial assets is impaired. Objective evidence includes financial difficulties of the debtor, changes in debtor credit ratings and current outstanding accounts over 60 days.
The allowance for impairment reflects Queensland Health’s assessment of the credit risk associated with receivables balances and is determined based on consideration of objective evidence of impairment, past experience and management judgement. The current year allowance is affected by the following loss events:
- $26.493 million (2010-11: $17.372 million) relating to payroll receivables and interim cash payments; overseas patients treated in public hospitals where the cost was unrecoverable amounting to $5.486 million (2010-11: $5.762 million);

150
Queensland Health Notes to the Financial Statements For the year ended 30 June 2012
17 Loans and receivables (continued)
- debts including general private patients $9.557 million (2010-11: $8.459 million);
- unrecoverable debts from private businesses $0.517 million (2010-11: $0.057 million); and
- unrecoverable third party claim settlements from patients involved in motor vehicle accidents $2.081 million (2010-11: $0.639 million).
The allowance for impairment on payroll receivables has increased in line with the payroll receivables balance and represents management’s best estimate as at 30 June 2012, based on the current process for the recovery of overpayments. Management’s estimate reflects an assessment of a number of factors including the current status of their employees, the aging of the overpayment receivables and also takes into account the lifting of the overpayments recovery moratorium on 30 May 2012. As with all management estimates, outcomes within the next financial year could result in adjustments to the carrying amount of the receivables balance, including the progression of overpayment recovery actions, legislative changes and other policy decisions. Refer Notes 3 and 42.
2012 2011 $’000 $’000
18 Inventories
Inventories held for distribution
Medical supplies and equipment 127,482 117,560
Catering and domestic 2,741 1,638
130,223 119,198
Loss of service potential (3,347) (480)
126,876 118,718
Engineering 1,916 1,851
Other 1,294 1,234
130,086 121,803
19 Other financial assets
Fixed rate deposit 20,000 20,000
The Treasurer approved the investment of $20 million with Queensland Treasury Corporation with the interest
earned being used for the funding of the Smart State Research Grants Program. Interest earned from this investment totalled $1.109 million (2010-11: $0.990 million). As at 30 June 2012 there is one deposit with QTC worth $20 million. Refer Note 38.
20 Investments in associates
(a) Movements in the carrying amount of investments in associates
Translational Research Institute Trust
Balance at the beginning of the financial year 40,596 14,534
Share of profit in associate after income tax 28,596 26,062
Balance at the end of the year 69,192 40,596
Comparative balance for 2010-11 excludes $326,000 for Queensland Health’s share of profit for Queensland Children’s Medical Research Institute. Refer Note 2(c).

Se
ctio
n 1
2
|
Fin
an
cia
l st
ate
me
nts
151
Queensland Health Notes to the Financial Statements For the year ended 30 June 2012
2012 2011
$’000 $’000
20 Investments in associates (continued)
(b) Summarised financial information
Translational Research Institute Trust
Current assets 121,168 105,904
Non-current assets 198,302 63,110
319,470 169,014
Current liabilities 144,576 105,871
Non-current liabilities 12,500 5,000
157,076 110,871
Net assets 162,394 58,143
Net asset percentage share 25% 25%
Share of associates’ net assets 40,599 14,536
Revenue 116,738 105,142
Net profit 114,383 104,250
(c) Share of associates’ profit and net asset percentage
Translational Research Institute Pty Ltd 25% 25%
Translational Research Institute Trust 25% 25%
21 Other assets
Current
Insurance premium prepayment 90,407 75,167
Other prepayment 21,211 18,829
111,618 93,996
Non-current
Prepayments 7,629 3,066
22 Intangible assets
Software purchased
At cost 27,660 26,614
Less: Accumulated amortisation 16,399 14,041
11,261 12,573
Software internally generated
At cost 231,487 222,120
Less: Accumulated amortisation 180,547 167,454
50,940 54,666
Software work in progress
At cost 87,263 54,356
149,464 121,595
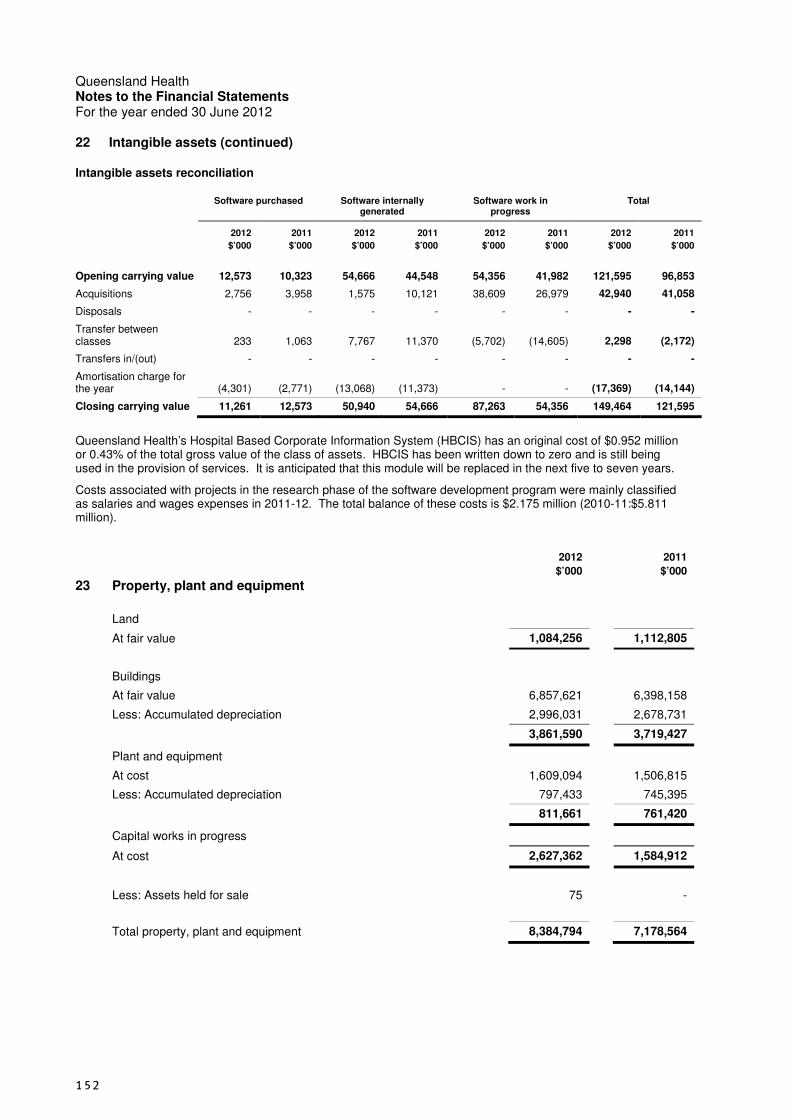
152
Queensland Health Notes to the Financial Statements For the year ended 30 June 2012
22 Intangible assets (continued)
Intangible assets reconciliation
Software purchased Software internally
generated Software work in
progress Total
2012 2011 2012 2011 2012 2011 2012 2011
$’000 $’000 $’000 $’000 $’000 $’000 $’000 $’000
Opening carrying value 12,573 10,323 54,666 44,548 54,356 41,982 121,595 96,853
Acquisitions 2,756 3,958 1,575 10,121 38,609 26,979 42,940 41,058
Disposals - - - - - - - -
Transfer between classes 233 1,063 7,767 11,370 (5,702) (14,605) 2,298 (2,172)
Transfers in/(out) - - - - - - - -
Amortisation charge for the year (4,301) (2,771) (13,068) (11,373) - - (17,369) (14,144)
Closing carrying value 11,261 12,573 50,940 54,666 87,263 54,356 149,464 121,595
Queensland Health’s Hospital Based Corporate Information System (HBCIS) has an original cost of $0.952 million or 0.43% of the total gross value of the class of assets. HBCIS has been written down to zero and is still being used in the provision of services. It is anticipated that this module will be replaced in the next five to seven years.
Costs associated with projects in the research phase of the software development program were mainly classified as salaries and wages expenses in 2011-12. The total balance of these costs is $2.175 million (2010-11:$5.811 million).
2012 2011
$’000 $’000
23 Property, plant and equipment
Land
At fair value 1,084,256 1,112,805
Buildings
At fair value 6,857,621 6,398,158
Less: Accumulated depreciation 2,996,031 2,678,731
3,861,590 3,719,427
Plant and equipment
At cost 1,609,094 1,506,815
Less: Accumulated depreciation 797,433 745,395
811,661 761,420
Capital works in progress
At cost 2,627,362 1,584,912
Less: Assets held for sale 75 -
Total property, plant and equipment 8,384,794 7,178,564

Se
ctio
n 1
2
|
Fin
an
cia
l st
ate
me
nts
153
Queensland Health Notes to the Financial Statements For the year ended 30 June 2012
23 Property, plant and equipment (continued)
Land
Land was fair valued using the following methodologies:
• In 2011-12, the majority of land was indexed using the appropriate indices sourced from the State Valuation Service. These indices are based on actual market movements for the relevant location and asset category. Desktop market valuations were performed on six land parcels which were previously not re-valued as they were below the department’s valuation threshold. Desktop market valuations take into consideration valuation indicators such as location, size, zoning and recent market sales.
• In 2010-11, an independent market revaluation was performed on all land with a value greater than $0.415 million by the State Valuation Service. For all land under $0.415 million, a desktop market valuation was performed.
The revaluation program resulted in a decrement of $26.074 million (an increment of $0.227 million in 2010-11) to the carrying amount of land.
Buildings
An independent revaluation of 22 per cent of the gross value of the building portfolio was performed during 2011-12. For buildings not subject to independent revaluations during 2010-11, the Department of Public Works Building Price Index was assessed as nil for the year and a Health Design Factor of either 2 per cent or 4 per cent was applied on all specialised buildings. Refer Note 2(m).
The buildings valuations for 2011-12 resulted in a net decrement to the Department’s building portfolio of $54.551 million (2010-11: $52.241 million decrement). This is a decrease of 3.1per cent to the building portfolio as at 30 June 2012.
Queensland Health has plant and equipment with an original cost of $14.324 million (2010-11: $15.242 million) or 0.9% (2010-11: 1.0%) of total plant and equipment gross value and a written down value of zero still being used in the provision of services.
Land Buildings Plant and
equipment Work in
progress Total
$’000 $’000 $’000 $’000 $’000
As at 30 June 2010 1,074,121 3,364,645 727,848 1,023,656 6,190,270
Acquisitions 22,728 211,635 155,539 906,129 1,296,031
Donation received 16,529 60 492 - 17,081
Disposals (707) (996) (6,163) - (7,866)
Donations made - - (177) - (177)
Transfer between classes 8 339,059 16,062 (352,957) 2,172
Transfers in 72 57,610 1,144 8,084 66,910
Revaluation Increments/(decrements) 294 (56,135) - - (55,841)
Impairment decrement (240) (6,030) - - (6,270)
Depreciation charge for the year - (190,421) (133,325) - (323,746)
As at 30 June 2011 1,112,805 3,719,427 761,420 1,584,912 7,178,564
Acquisitions 5,154 159,484 206,358 1,350,649 1,721,645
Donation received - - 644 - 644
Disposals (7,969) (472) (6,068) - (14,509)
Donations made - (55) (9) - (64)
Transfer between classes 393 310,773 (2,967) (308,199) -
Transfers in 4 437 70 - 511
Held for sale (75) - - - (75)
Revaluation Increments/(decrements) (26,074) (54,551) - - (80,625)
Impairment decrement (57) (66,662) - - (66,719)
Depreciation charge for the year - (206,791) (147,787) - (354,578)
As at 30 June 2012 1,084,181 3,861,590 811,661 2,627,362 8,384,794
Included in the valuation of buildings are 78 heritage buildings held at gross value of $108.213 million (2010-11: 72 buildings at gross value of $109.676 million).

154
Queensland Health Notes to the Financial Statements For the year ended 30 June 2012
2012 2011 $’000 $’000
24 Payables
Trade creditors 419,588 403,215
Appropriations payable 67,559 -
Other creditors 9,413 3,818
496,560 407,033
25 Accrued employee benefits
Salaries and wages accrued 218,690 135,949
Other employee entitlements payable 11,314 10,140
Annual leave levy payable 142,155 151,457
Long service leave levy payable 34,364 32,984
406,523 330,530
26 Other liabilities
Non-current
Finance lease advanced* 194,398 59,977
*This is the advanced lease payments from the Translational Research Institute Trust.
27 Unearned revenue
Current
Unearned other revenue 466 463
Non-current
Unearned other revenue 2,536 1,075
* Unearned revenue represents revenue received in advance for services yet to be delivered at year end.

Se
ctio
n 1
2
|
Fin
an
cia
l st
ate
me
nts
155
Queensland Health Notes to the Financial Statements For the year ended 30 June 2012
2012 2011
$’000 $’000
28 Asset revaluation surplus by class
Land
Balance at the beginning of the financial year 688,229 688,175
Revaluation increment/(decrement) (26,074) 227
Asset revaluation prior year - 67
Impairment losses through equity* (57) (240)
Balance at the end of the financial year 662,098 688,229
Buildings
Balance at the beginning of the financial year 403,576 465,741
Revaluation increment/(decrement) (54,551) (52,241)
Asset revaluation prior year - (3,894)
Impairment losses through equity** (66,662) (6,030)
Balance at the end of the financial year 282,363 403,576
Balance at the end of the financial year 944,461 1,091,805
The asset revaluation surplus represents the net effect of revaluation movements in assets.
* The land impairment loss of $0.06 million recognised in 2011-12 (2010-11: $0.2 million) related to unusable land leases. The impairment loss recognised in 2010-11 related to 15 land parcels previously held at market value that were identified as being held by traditional owners through a Deed of Grant in Trust.
** The building impairment loss of $66.662 million recognised in 2011-12 (2010-11: $6.030 million) predominantly related to buildings with shorter than expected useful lives located on the site of health facility redevelopments. The majority of the buildings impaired have been demolished as at reporting date.
29 Reconciliation of operating surplus to net cash flows from operating activities
Operating result from continuing operations 42,336 2,285
Non-cash items:
Depreciation expense 354,577 323,746
Amortisation expense 17,369 14,144
Assets written off/scrapped (327) 520
Contributed assets and other non-cash donations (7,303) (25,982)
Loss on sale of property, plant and equipment 6,074 5,374
Gain on sale of property, plant and equipment (3,419) (871)
Share of profits in associates (28,596) (26,236)
Other non-cash supplies 6,035 6,963
Other non-cash items 937 1,733
Changes in assets and liabilities:
Increase in departmental services revenue payable 67,559 -
Increase in departmental services revenue receivable - 30,213
(Increase)/decrease in trade and payroll receivables (72,102) (106,131)
(Increase)/decrease in GST input tax credits receivable 3,734 (2,695)
(Increase)/decrease in LSL reimbursement receivable (4,934) (2,260)
(Increase)/decrease in annual leave reimbursement receivables (14,676) (20,439)
(Increase)/decrease in inventories (8,283) (1,616)
(Increase)/decrease in recurrent prepayments (22,184) (4,296)
Increase/(decrease) in unearned revenue 1,467 (1,957)
(Increase)/decrease in accrued salaries and wages 76,363 47,585
Increase/(decrease) in annual leave payable 1,173 1,364
Increase/(decrease) in payables 21,800 43,811
Increase/(decrease) in annual leave levy payable (9,303) (33,143)
Increase/(decrease) in LSL levy payable 1,380 7,738
(Increase)/decrease in other receivables (399) -
Net cash generated by operating activities 429,278 259,850
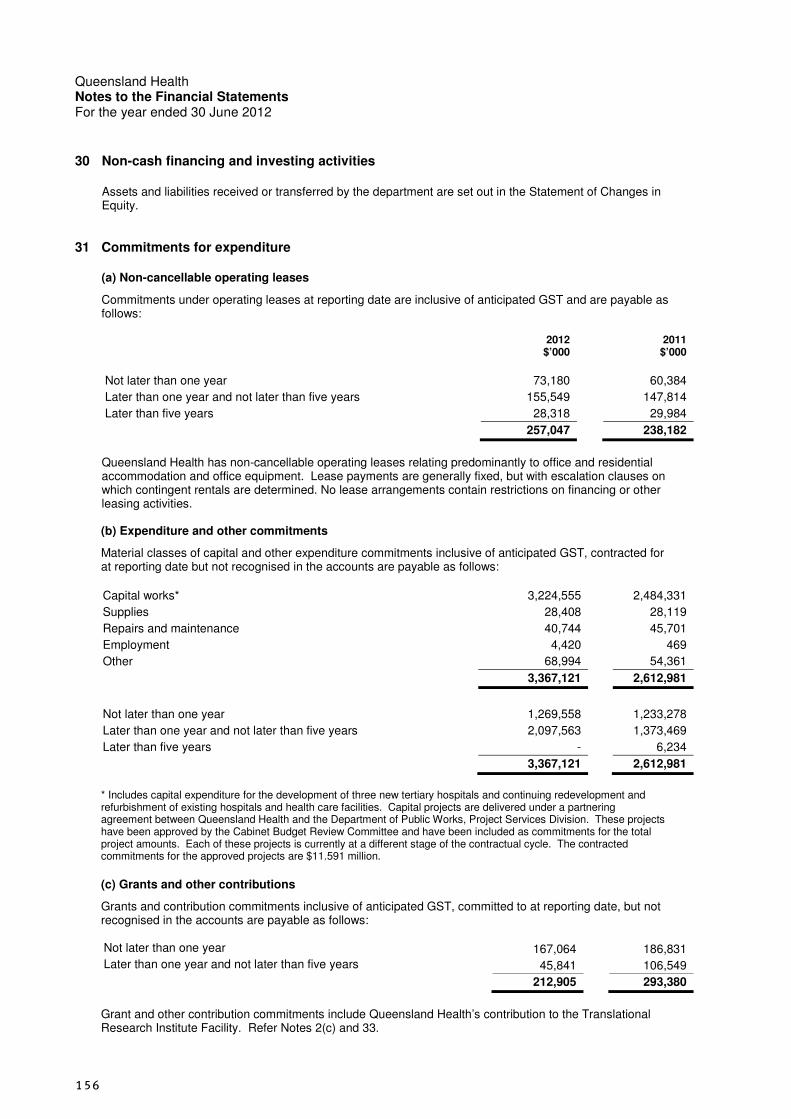
156
Queensland Health Notes to the Financial Statements For the year ended 30 June 2012
30 Non-cash financing and investing activities
Assets and liabilities received or transferred by the department are set out in the Statement of Changes in Equity.
31 Commitments for expenditure
(a) Non-cancellable operating leases
Commitments under operating leases at reporting date are inclusive of anticipated GST and are payable as follows:
2012 2011 $’000 $’000
Not later than one year 73,180 60,384
Later than one year and not later than five years 155,549 147,814
Later than five years 28,318 29,984
257,047 238,182
Queensland Health has non-cancellable operating leases relating predominantly to office and residential
accommodation and office equipment. Lease payments are generally fixed, but with escalation clauses on which contingent rentals are determined. No lease arrangements contain restrictions on financing or other leasing activities.
(b) Expenditure and other commitments
Material classes of capital and other expenditure commitments inclusive of anticipated GST, contracted for at reporting date but not recognised in the accounts are payable as follows:
Capital works* 3,224,555 2,484,331
Supplies 28,408 28,119
Repairs and maintenance 40,744 45,701
Employment 4,420 469
Other 68,994 54,361
3,367,121 2,612,981
Not later than one year 1,269,558 1,233,278
Later than one year and not later than five years 2,097,563 1,373,469
Later than five years - 6,234
3,367,121 2,612,981
* Includes capital expenditure for the development of three new tertiary hospitals and continuing redevelopment and
refurbishment of existing hospitals and health care facilities. Capital projects are delivered under a partnering agreement between Queensland Health and the Department of Public Works, Project Services Division. These projects have been approved by the Cabinet Budget Review Committee and have been included as commitments for the total project amounts. Each of these projects is currently at a different stage of the contractual cycle. The contracted commitments for the approved projects are $11.591 million.
(c) Grants and other contributions
Grants and contribution commitments inclusive of anticipated GST, committed to at reporting date, but not recognised in the accounts are payable as follows:
Not later than one year 167,064 186,831
Later than one year and not later than five years 45,841 106,549
212,905 293,380
Grant and other contribution commitments include Queensland Health’s contribution to the Translational
Research Institute Facility. Refer Notes 2(c) and 33.

Se
ctio
n 1
2
|
Fin
an
cia
l st
ate
me
nts
157
Queensland Health Notes to the Financial Statements For the year ended 30 June 2012
32 Contingencies
(a) Guarantees and undertakings
As at 30 June 2012, Queensland Health held the following guarantees and undertakings from third parties. These amounts have not been recognised as assets in the financial statements.
2012 2011
$’000 $’000
Guarantees 2,192 2,192
Undertakings 11,453 10,912
13,645 13,104
(b) Litigation in progress 2011 Increase Decrease 2012 cases cases cases cases
Cases have been filed with the courts as follows:
Supreme Court 21 - 4 17
District Court 5 6 - 11
Magistrates Court 1 1 - 2
Tribunals, commissions and boards 158 - 81 77
185 7 85 107
2010 Increase Decrease 2011 cases cases cases cases
Supreme Court 3 18 - 21
District Court 1 4 - 5
Magistrates Court 1 - - 1
Tribunals, commissions and boards 151 7 - 158
156 29 - 185
Health litigation is underwritten by the Queensland Government Insurance Fund (QGIF). Queensland Health’s liability in this area is limited to an excess per insurance event. Refer Note 2(w). Queensland Health’s legal advisers and management believe it would be misleading to estimate the final amounts payable (if any) in respect of the litigation before the courts at this time.
The introduction of the Personal Injuries Proceedings Act 2002 has resulted in fewer cases appearing before the courts. These matters are usually resolved at the pre-proceedings stage.
From 1 July 2010, the management of all Queensland Health indemnified claims have been managed by QGIF. As at 30 June 2012 there were 377 (362 as at 30 June 2011) claims managed by QGIF, some of which may never be litigated or result in payments to claims. The maximum exposure to Queensland Health under this policy is up to $20,000 for each insurable event.
The special claims management process (“the special process”) established by Government in 2005 to expeditiously resolve claims as a result of healthcare treatment provided by Dr Patel has continued. The key features of the special process are an acceptance of liability by the State, payment of the cost of medical assessment, a contribution to the claimants’ legal fees and payment of the cost of mediation (if required). These features are a significant departure from the prevailing legislative scheme. As at 30 June 2012 and 30 June 2011, 387 special process claims had been received with three of these claims remaining unresolved. Claims which remain outstanding are included in the above table.
(c) Native Title
The Queensland Government Native Title Work Procedures were designed to ensure that native title issues are considered in all of Queensland Health’s land and natural resource management activities.
All dealings pertaining to land held by or on behalf of Queensland Health must take native title into account before proceeding. These dealings include disposal, acquisition, development, redevelopment, clearing, fencing and the granting of leases, licences or permits and so on. Dealings may proceed on department owned land where native title continues to exist, provided native title holders or claimants receive the necessary procedural rights.
In accordance with State Government Land Policies, when native title over a particular holding has been cleared, Queensland Health is required to convert the tenure to freehold ownership.
158
Queensland Health Notes to the Financial Statements For the year ended 30 June 2012
32 Contingencies (continued)
Queensland Health has completed 55.01% of native title assessments of department land holdings and 83.44% have now been converted to freehold tenure.
With the assistance of Crown Law, Queensland Health is currently negotiating with a number of Indigenous Land Use Agreements (ILUA) with native title holders. These ILUAs will provide trustee leases to validate the tenure of current and future facilities.
The National Title Tribunal reported a total of 16 native title claims in 2011-12 (2010-11: 8 claims).
(d) Other contingencies
The following liabilities are contingent upon future Government and management decisions and cannot be estimated with reasonable certainty at balance date.
Costs to rectify payroll system
Measures will continue to be undertaken to resolve outstanding issues and stabilise the Queensland Health payroll system (refer Note 3).
eHealth
The objective of the eHealth program is to provide integrated and accurate clinical information to support safe, timely and high quality care with the key component an integrated electronic medical record (ieMR). The rollout of these programs is likely to require additional ICT infrastructure and necessitate implementation costs.
Property maintenance backlog
This represents the total cost of repairs, maintenance and assets due for replacement, with these activities to occur over future years. The total liability due to be incurred in the next 12 months is contingent on an assessment of maintenance requirements and priorities.
33 Associated entities
Translational Research Institute Pty Ltd
The Translational Research Institute Pty Ltd (the Company) was registered as an Australian proprietary company, limited by shares, on 12 June 2009. Queensland Health is one of four founding shareholders, each holding 25 shares at $1 per share in the Company. The Company does not trade and its sole purpose is to act as trustee of the Translational Research Institute Trust (TRI Trust). There were no transactions recorded in this entity in the period 1 July 2011 to 30 June 2012. As the Company is a non-trading entity, it has not prepared financial statements for the financial year ended 30 June 2012. Refer Notes 2(c), 20 and 31(c).
Translational Research Institute Trust
The Translational Research Institute Trust (TRI Trust) was created as a Discretionary Unit Trust on 16 June 2009. Queensland Health is one of four founding members, each holding 25 units in the TRI Trust and equal voting rights. The objectives of the TRI Trust are to:
(i) design, construct and maintain the Translational Research Institute Facility (TRI Facility); and
(ii) operate and manage the TRI Facility to promote medical study, research and education.
The Trust’s annual reporting period is on a calendar year basis. Audited financial statements were prepared for the financial year ending 31 December 2011. A set of Board endorsed Management Accounts were prepared for the period 1 January 2012 to 30 June 2012. Refer Notes 2(c), 20 and 31(c).
34 Restricted assets
Queensland Health receives cash contributions primarily from private practice clinicians and from external entities to provide for education, study and research in clinical areas. Contributions are also received from benefactors in the form of gifts, donations and bequests for stipulated purposes. At 30 June 2012, amounts of $85.993 million (2010-11: $72.640 million) in General Trust and $9.046 million (2010-11: $8.846 million) for Clinical Drug Trials are set aside for the specified purposes underlying the contribution.
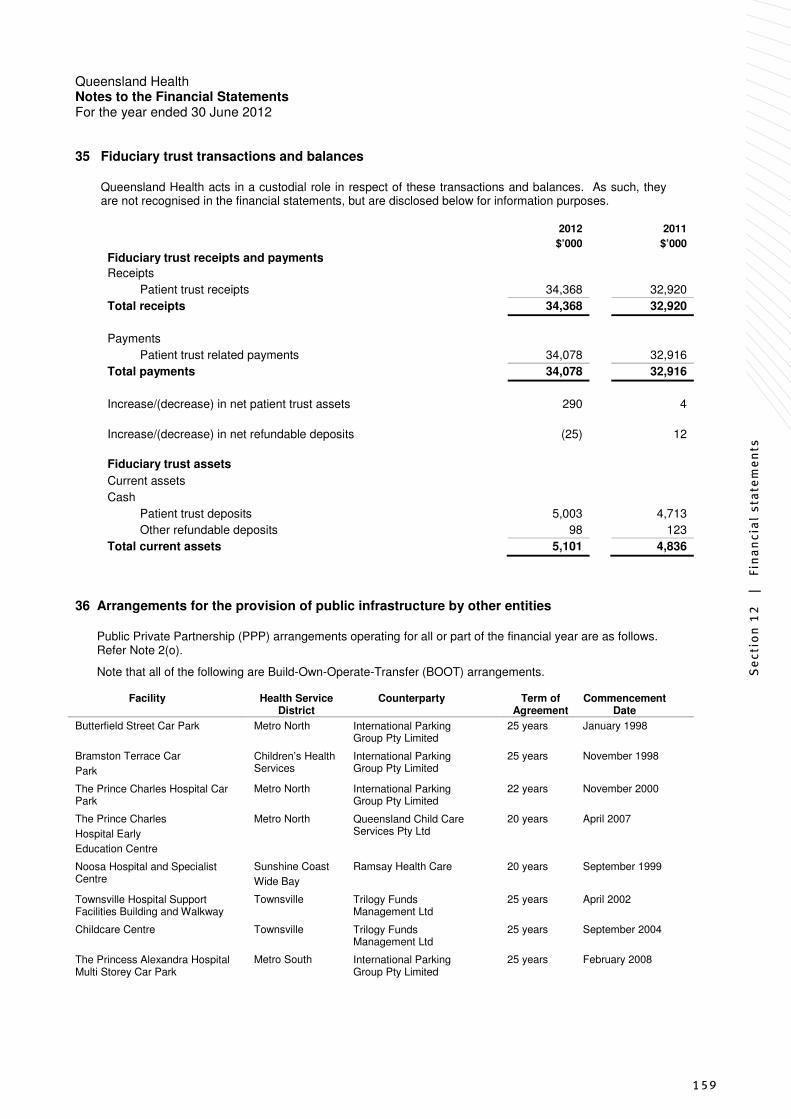
Se
ctio
n 1
2
|
Fin
an
cia
l st
ate
me
nts
159
Queensland Health Notes to the Financial Statements For the year ended 30 June 2012
35 Fiduciary trust transactions and balances
Queensland Health acts in a custodial role in respect of these transactions and balances. As such, they are not recognised in the financial statements, but are disclosed below for information purposes.
2012 2011
$’000 $’000
Fiduciary trust receipts and payments
Receipts
Patient trust receipts 34,368 32,920
Total receipts 34,368 32,920
Payments
Patient trust related payments 34,078 32,916
Total payments 34,078 32,916
Increase/(decrease) in net patient trust assets 290 4
Increase/(decrease) in net refundable deposits (25) 12
Fiduciary trust assets
Current assets
Cash
Patient trust deposits 5,003 4,713
Other refundable deposits 98 123
Total current assets 5,101 4,836
36 Arrangements for the provision of public infrastructure by other entities
Public Private Partnership (PPP) arrangements operating for all or part of the financial year are as follows. Refer Note 2(o).
Note that all of the following are Build-Own-Operate-Transfer (BOOT) arrangements.
Facility Health Service District
Counterparty Term of Agreement
Commencement Date
Butterfield Street Car Park Metro North International Parking Group Pty Limited
25 years January 1998
Bramston Terrace Car
Park
Children’s Health Services
International Parking Group Pty Limited
25 years November 1998
The Prince Charles Hospital Car Park
Metro North International Parking Group Pty Limited
22 years November 2000
The Prince Charles
Hospital Early
Education Centre
Metro North Queensland Child Care Services Pty Ltd
20 years April 2007
Noosa Hospital and Specialist Centre
Sunshine Coast
Wide Bay
Ramsay Health Care 20 years September 1999
Townsville Hospital Support Facilities Building and Walkway
Townsville Trilogy Funds Management Ltd
25 years April 2002
Childcare Centre Townsville Trilogy Funds Management Ltd
25 years September 2004
The Princess Alexandra Hospital Multi Storey Car Park
Metro South International Parking Group Pty Limited
25 years February 2008
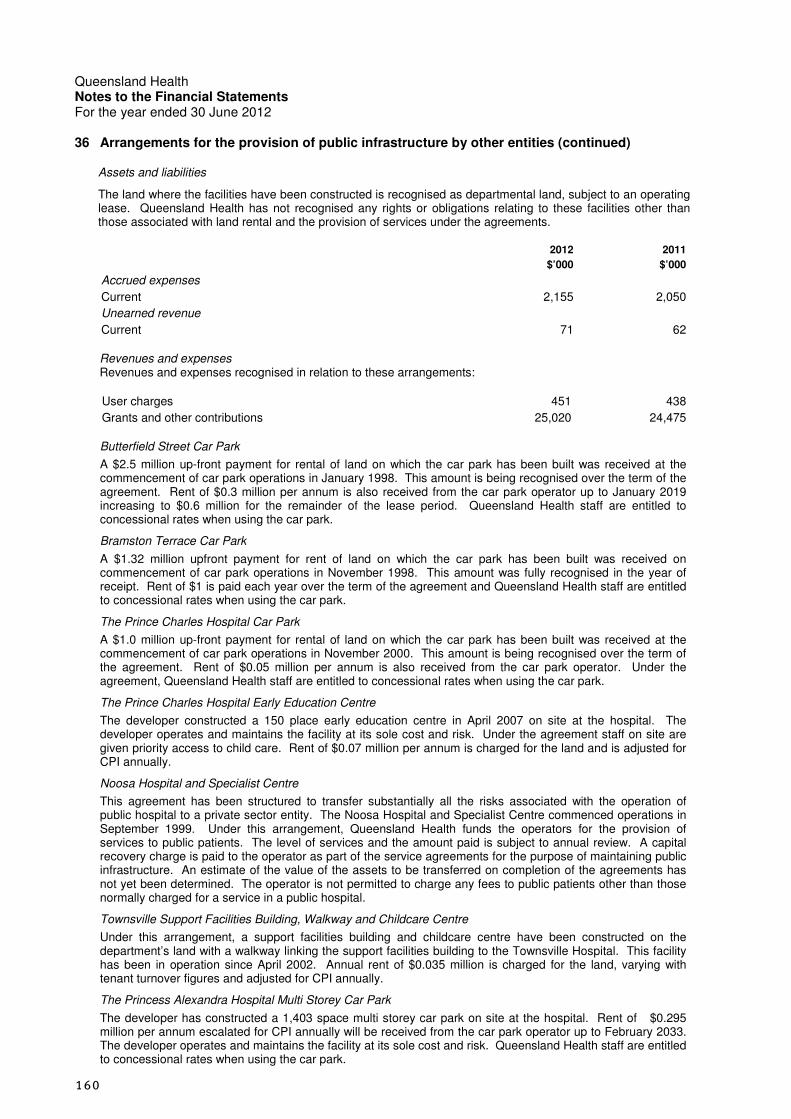
160
Queensland Health Notes to the Financial Statements For the year ended 30 June 2012
36 Arrangements for the provision of public infrastructure by other entities (continued)
Assets and liabilities
The land where the facilities have been constructed is recognised as departmental land, subject to an operating lease. Queensland Health has not recognised any rights or obligations relating to these facilities other than those associated with land rental and the provision of services under the agreements.
2012 2011
$’000 $’000
Accrued expenses
Current 2,155 2,050
Unearned revenue
Current 71 62
Revenues and expenses Revenues and expenses recognised in relation to these arrangements:
User charges 451 438
Grants and other contributions 25,020 24,475
Butterfield Street Car Park
A $2.5 million up-front payment for rental of land on which the car park has been built was received at the commencement of car park operations in January 1998. This amount is being recognised over the term of the agreement. Rent of $0.3 million per annum is also received from the car park operator up to January 2019 increasing to $0.6 million for the remainder of the lease period. Queensland Health staff are entitled to concessional rates when using the car park.
Bramston Terrace Car Park
A $1.32 million upfront payment for rent of land on which the car park has been built was received on commencement of car park operations in November 1998. This amount was fully recognised in the year of receipt. Rent of $1 is paid each year over the term of the agreement and Queensland Health staff are entitled to concessional rates when using the car park.
The Prince Charles Hospital Car Park
A $1.0 million up-front payment for rental of land on which the car park has been built was received at the commencement of car park operations in November 2000. This amount is being recognised over the term of the agreement. Rent of $0.05 million per annum is also received from the car park operator. Under the agreement, Queensland Health staff are entitled to concessional rates when using the car park.
The Prince Charles Hospital Early Education Centre
The developer constructed a 150 place early education centre in April 2007 on site at the hospital. The developer operates and maintains the facility at its sole cost and risk. Under the agreement staff on site are given priority access to child care. Rent of $0.07 million per annum is charged for the land and is adjusted for CPI annually.
Noosa Hospital and Specialist Centre
This agreement has been structured to transfer substantially all the risks associated with the operation of public hospital to a private sector entity. The Noosa Hospital and Specialist Centre commenced operations in September 1999. Under this arrangement, Queensland Health funds the operators for the provision of services to public patients. The level of services and the amount paid is subject to annual review. A capital recovery charge is paid to the operator as part of the service agreements for the purpose of maintaining public infrastructure. An estimate of the value of the assets to be transferred on completion of the agreements has not yet been determined. The operator is not permitted to charge any fees to public patients other than those normally charged for a service in a public hospital.
Townsville Support Facilities Building, Walkway and Childcare Centre
Under this arrangement, a support facilities building and childcare centre have been constructed on the department’s land with a walkway linking the support facilities building to the Townsville Hospital. This facility has been in operation since April 2002. Annual rent of $0.035 million is charged for the land, varying with tenant turnover figures and adjusted for CPI annually.
The Princess Alexandra Hospital Multi Storey Car Park
The developer has constructed a 1,403 space multi storey car park on site at the hospital. Rent of $0.295 million per annum escalated for CPI annually will be received from the car park operator up to February 2033. The developer operates and maintains the facility at its sole cost and risk. Queensland Health staff are entitled to concessional rates when using the car park.
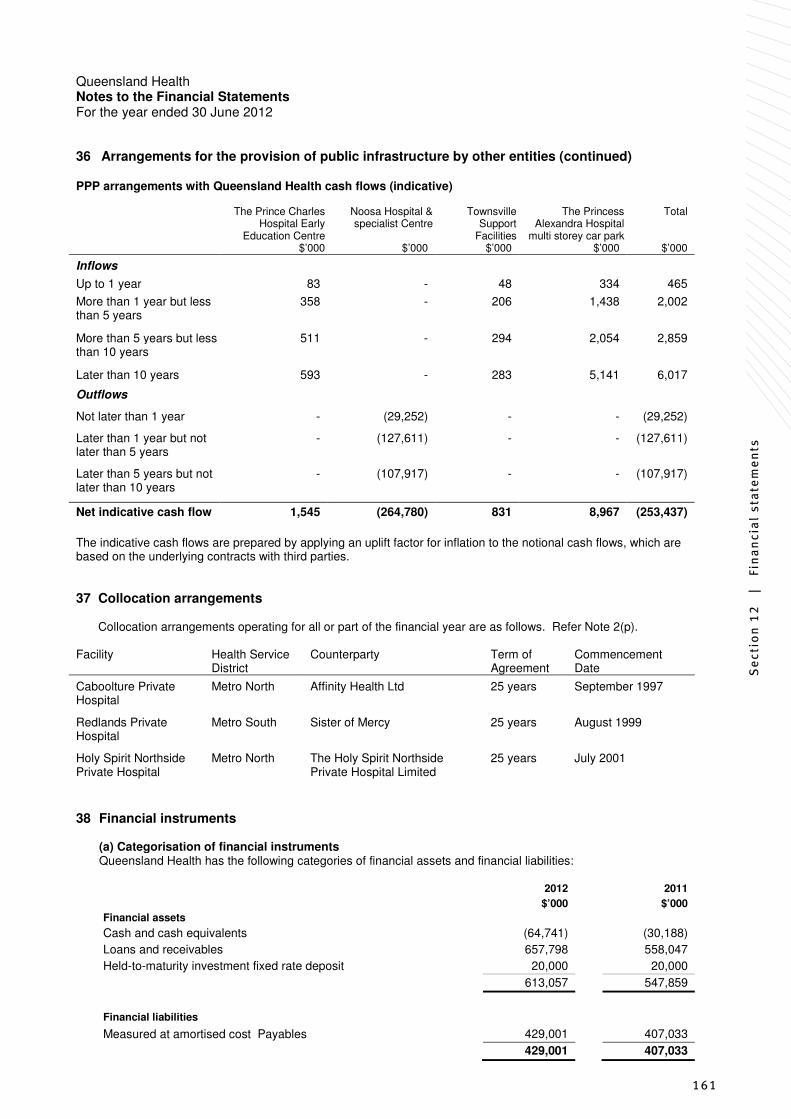
Se
ctio
n 1
2
|
Fin
an
cia
l st
ate
me
nts
161
Queensland Health Notes to the Financial Statements For the year ended 30 June 2012
36 Arrangements for the provision of public infrastructure by other entities (continued)
PPP arrangements with Queensland Health cash flows (indicative)
The Prince Charles Hospital Early
Education Centre
Noosa Hospital & specialist Centre
Townsville Support
Facilities
The Princess Alexandra Hospital
multi storey car park
Total
$’000 $’000 $’000 $’000 $’000
Inflows
Up to 1 year 83 - 48 334 465
More than 1 year but less than 5 years
358 - 206 1,438 2,002
More than 5 years but less than 10 years
511 - 294 2,054 2,859
Later than 10 years 593 - 283 5,141 6,017
Outflows
Not later than 1 year - (29,252) - - (29,252)
Later than 1 year but not later than 5 years
- (127,611) - - (127,611)
Later than 5 years but not later than 10 years
- (107,917) - - (107,917)
Net indicative cash flow 1,545 (264,780) 831 8,967 (253,437)
The indicative cash flows are prepared by applying an uplift factor for inflation to the notional cash flows, which are based on the underlying contracts with third parties.
37 Collocation arrangements Collocation arrangements operating for all or part of the financial year are as follows. Refer Note 2(p).
Facility Health Service District
Counterparty Term of Agreement
Commencement Date
Caboolture Private Hospital
Metro North Affinity Health Ltd 25 years September 1997
Redlands Private Hospital
Metro South Sister of Mercy 25 years August 1999
Holy Spirit Northside Private Hospital
Metro North The Holy Spirit Northside Private Hospital Limited
25 years July 2001
38 Financial instruments (a) Categorisation of financial instruments Queensland Health has the following categories of financial assets and financial liabilities:
2012 2011
$’000 $’000
Financial assets
Cash and cash equivalents (64,741) (30,188)
Loans and receivables 657,798 558,047
Held-to-maturity investment fixed rate deposit 20,000 20,000
613,057 547,859
Financial liabilities
Measured at amortised cost Payables 429,001 407,033
429,001 407,033

162
Queensland Health Notes to the Financial Statements For the year ended 30 June 2012
38 Financial instruments (continued)
(b) Financial risk management
Queensland Health is exposed to a variety of financial risks – credit risk, liquidity risk and market risk. Financial risk is managed in accordance with Queensland Government and departmental policies. Queensland Health’s policies provide written principles for overall risk management and aim to minimise potential adverse effects of risk events on the financial performance of the department.
Risk Exposure Measurement method
Credit risk Ageing analysis, cash inflows at risk
Liquidity risk Monitoring of cash flows by active management of accrual accounts
Market risk Interest rate sensitivity analysis
(c) Credit risk exposure
Credit risk is the potential for financial loss arising from a counterparty defaulting on its obligations. The maximum exposure to credit risk at balance date is equal to the gross carrying amount of the financial asset, inclusive of any allowance for impairment. The carrying amount of receivables represents the maximum exposure to credit risk. As such, receivables are not included in the disclosure below. Refer Note 2(t) and Note 17 for further information. Credit risk is considered minimal given all Queensland Health deposits are held by the State through Queensland Treasury Corporation.
Maximum exposure to credit risk
2012 2011
$’000 $’000
Cash (64,741) (30,188)
Fixed rate deposits 20,000 20,000
(44,741) (10,188)
No financial assets have had their terms renegotiated so as to prevent them from being past due or impaired and are stated at the carrying amounts as indicated.
Ageing of past due but not impaired as well as impaired financial assets are disclosed in the following tables:
Financial assets past due but not impaired 2011-12
Overdue $’000
Less than 30 days
30-60 days 61-90 days More than 90 days
Total
2011-12 Loans and receivables 601,449 14,165 5,854 36,329 657,797 2010-11 Loans and receivables 511,560 10,065 14,514 21,908 558,047
Individually impaired financial assets 2011-12
Overdue $’000
Less than 30 days
30-60 days 61-90 days More than 90 days
Total
2011-12 Loans and receivables 1,427 928 2,657 53,525 59,076 2010-11 Loans and receivables 18,043 767 1,427 13,290 33,527
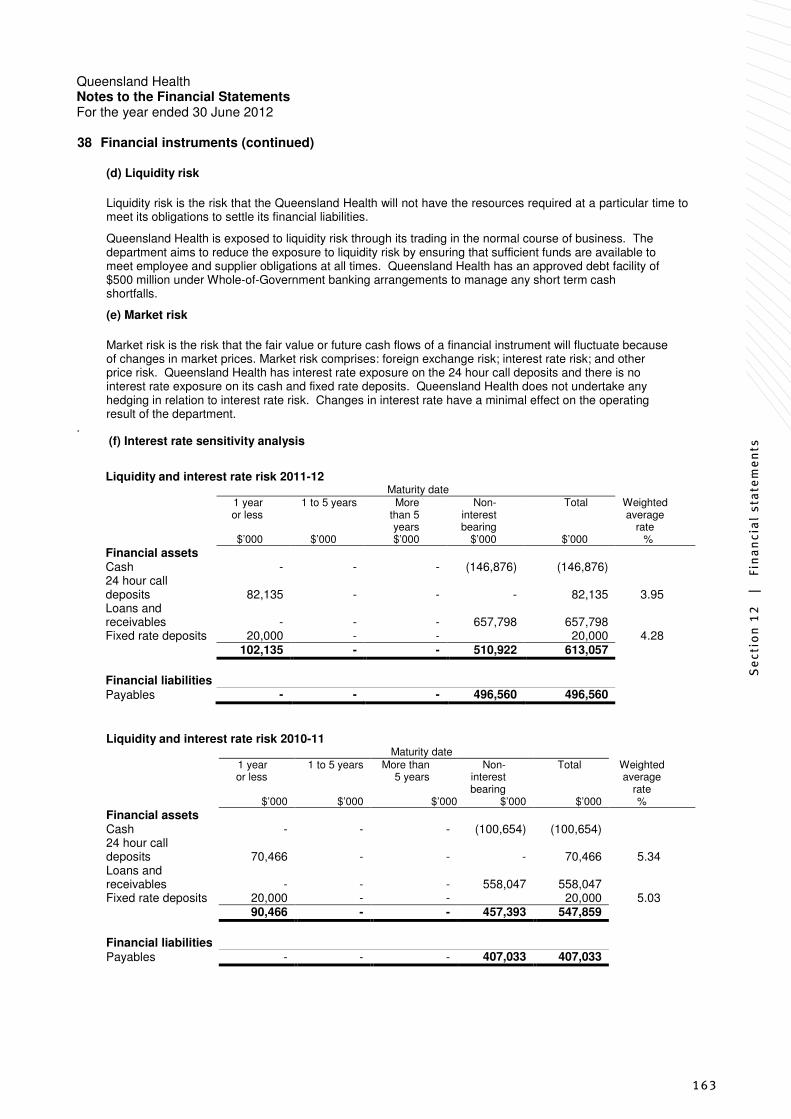
Se
ctio
n 1
2
|
Fin
an
cia
l st
ate
me
nts
163
Queensland Health Notes to the Financial Statements For the year ended 30 June 2012
38 Financial instruments (continued)
(d) Liquidity risk
Liquidity risk is the risk that the Queensland Health will not have the resources required at a particular time to meet its obligations to settle its financial liabilities.
Queensland Health is exposed to liquidity risk through its trading in the normal course of business. The department aims to reduce the exposure to liquidity risk by ensuring that sufficient funds are available to meet employee and supplier obligations at all times. Queensland Health has an approved debt facility of $500 million under Whole-of-Government banking arrangements to manage any short term cash shortfalls.
(e) Market risk
Market risk is the risk that the fair value or future cash flows of a financial instrument will fluctuate because of changes in market prices. Market risk comprises: foreign exchange risk; interest rate risk; and other price risk. Queensland Health has interest rate exposure on the 24 hour call deposits and there is no interest rate exposure on its cash and fixed rate deposits. Queensland Health does not undertake any hedging in relation to interest rate risk. Changes in interest rate have a minimal effect on the operating result of the department.
. (f) Interest rate sensitivity analysis
Liquidity and interest rate risk 2011-12
Maturity date 1 year
or less 1 to 5 years More
than 5 years
Non-interest bearing
Total Weighted average
rate $’000 $’000 $’000 $’000 $’000 %
Financial assets Cash - - - (146,876) (146,876) 24 hour call
deposits
82,135
-
-
-
82,135
3.95 Loans and
receivables
-
-
-
657,798
657,798
Fixed rate deposits 20,000 - - 20,000 4.28 102,135 - - 510,922 613,057
Financial liabilities Payables - - - 496,560 496,560
Liquidity and interest rate risk 2010-11 Maturity date 1 year
or less 1 to 5 years More than
5 years Non-
interest bearing
Total Weighted average
rate $’000 $’000 $’000 $’000 $’000 %
Financial assets Cash - - - (100,654) (100,654) 24 hour call
deposits
70,466
-
-
-
70,466
5.34 Loans and
receivables
-
-
-
558,047
558,047
Fixed rate deposits 20,000 - - 20,000 5.03 90,466 - - 457,393 547,859
Financial liabilities Payables - - - 407,033 407,033

164
Queensland Health Notes to the Financial Statements For the year ended 30 June 2012
39 Key executive management personnel and remuneration
The following details for key executive management personnel include those positions that had authority and responsibility for planning, directing and controlling the activities of Queensland Health during 2011-12. Further information on these positions can be found in the body of the Annual Report under the section relating to Executive Management. Effective 1 July 2012, Queensland Health’s Corporate Office has undergone a significant restructure as part of its transition to the role of System Manager (refer Note 42). The positions below do not reflect the revised corporate structure. Note the function of Chief Finance Officer was carried out in 2011-12 by the Deputy Director-General, Finance, Procurement and Legal Services.
(a) Key executive management personnel
Name and position of current incumbents
Responsibilities Contract classification and appointment authority
Appointment date
Director-General - Dr Anthony O'Connell
Responsible for the overall management of Queensland Health through major functional areas to ensure the delivery of key government objectives in improving the health and well being of all Queenslanders.
s92 Contract/CEO
Governor in Council/Public Service Act 2008
23/06/2011
Deputy Director-General, Human Resource Services Division - Lyn Rowland
Responsible for providing strategic leadership in relation to all human resource functions, including industrial relations, across Queensland Health.
s24 & s28E Contract/HES 3
Chief Executive/Health Services Act 1991
07/02/2012 to 30/06/2012
Deputy Director-General, Policy Strategy and Resourcing Division - Professor Michael Cleary
Lead the development of policy, strategy and clinical workforce development to meet current and future health challenges.
s24 & s28E Contract/HES 4
Chief Executive/Health Services Act 1991
10/05/2010
Deputy Director-General, Health Planning and Infrastructure Division - Glenn Rashleigh
Provide strategic leadership and advice in the management of health infrastructure and assets throughout their lifecycle.
Relieving/higher duties arrangement/CEO 5
04/04/2012
Deputy Director-General, Performance and Accountability Division - Terry Mehan
Lead and manage the functions relating to accountability and governance across Queensland Health. Responsible for developing governance, strategic planning and performance management frameworks.
s24 & s28E
Contract/HES 4
Chief Executive/Health Services Act 1991
19/11/2008
Deputy Director-General, Finance Procurement and Legal Services - Susan Middleditch
Strategic responsibility for developing, implementing, managing and monitoring the financial framework, corporate financial systems and budget administration of Queensland Health.
s24 & s28E Contract/HES 4
Chief Executive/Health Services Act 1991
14/05/2012
Chief Executive Officer, Centre for Healthcare Improvement - Jan Phillips
Lead and manage the implementation of Queensland Health's reform agenda in the areas of clinical governance, information transparency, patient access and organisational culture, ensuring optimal levels of health service delivery and patient safety.
Relieving/higher duties arrangement/CEO 5
17/10/2011
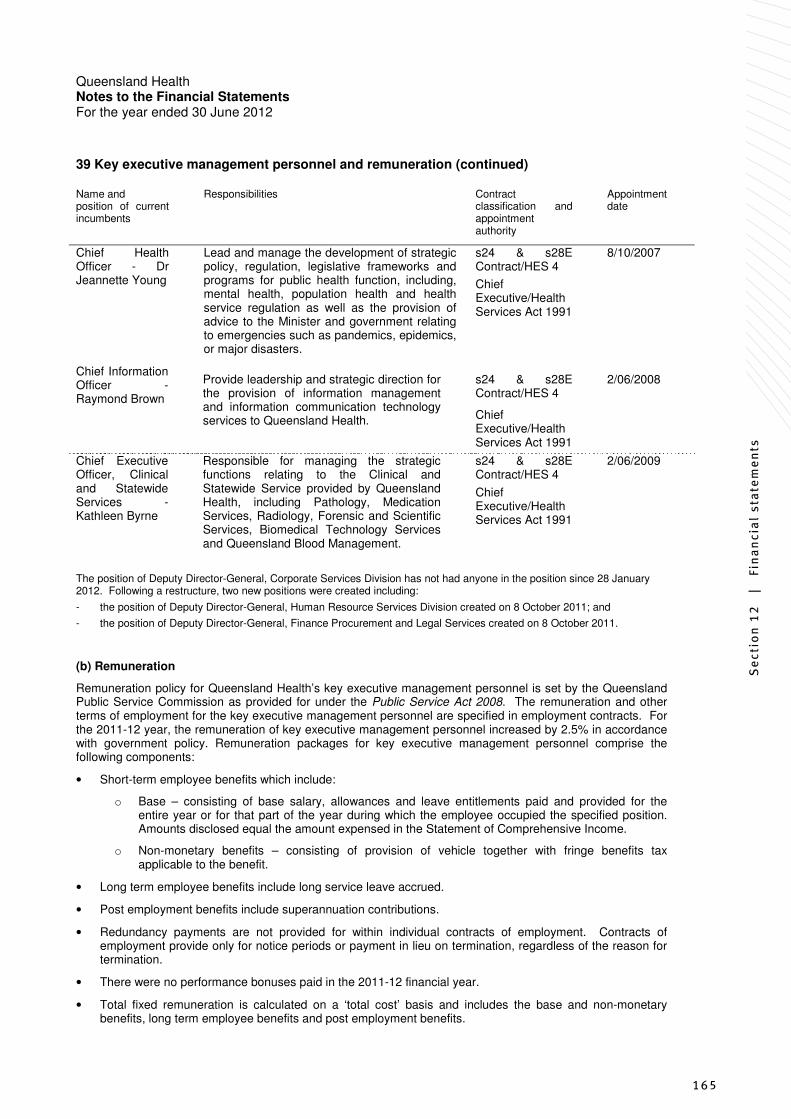
Se
ctio
n 1
2
|
Fin
an
cia
l st
ate
me
nts
165
Queensland Health Notes to the Financial Statements For the year ended 30 June 2012
39 Key executive management personnel and remuneration (continued)
Name and position of current incumbents
Responsibilities Contract classification and appointment authority
Appointment date
Chief Health Officer - Dr Jeannette Young
Lead and manage the development of strategic policy, regulation, legislative frameworks and programs for public health function, including, mental health, population health and health service regulation as well as the provision of advice to the Minister and government relating to emergencies such as pandemics, epidemics, or major disasters.
s24 & s28E Contract/HES 4
Chief Executive/Health Services Act 1991
8/10/2007
Chief Information Officer - Raymond Brown
Provide leadership and strategic direction for the provision of information management and information communication technology services to Queensland Health.
s24 & s28E Contract/HES 4
Chief Executive/Health Services Act 1991
2/06/2008
Chief Executive Officer, Clinical and Statewide Services - Kathleen Byrne
Responsible for managing the strategic functions relating to the Clinical and Statewide Service provided by Queensland Health, including Pathology, Medication Services, Radiology, Forensic and Scientific Services, Biomedical Technology Services and Queensland Blood Management.
s24 & s28E Contract/HES 4
Chief Executive/Health Services Act 1991
2/06/2009
The position of Deputy Director-General, Corporate Services Division has not had anyone in the position since 28 January 2012. Following a restructure, two new positions were created including:
- the position of Deputy Director-General, Human Resource Services Division created on 8 October 2011; and
- the position of Deputy Director-General, Finance Procurement and Legal Services created on 8 October 2011.
(b) Remuneration
Remuneration policy for Queensland Health’s key executive management personnel is set by the Queensland Public Service Commission as provided for under the Public Service Act 2008. The remuneration and other terms of employment for the key executive management personnel are specified in employment contracts. For the 2011-12 year, the remuneration of key executive management personnel increased by 2.5% in accordance with government policy. Remuneration packages for key executive management personnel comprise the following components:
• Short-term employee benefits which include:
o Base – consisting of base salary, allowances and leave entitlements paid and provided for the entire year or for that part of the year during which the employee occupied the specified position. Amounts disclosed equal the amount expensed in the Statement of Comprehensive Income.
o Non-monetary benefits – consisting of provision of vehicle together with fringe benefits tax applicable to the benefit.
• Long term employee benefits include long service leave accrued.
• Post employment benefits include superannuation contributions.
• Redundancy payments are not provided for within individual contracts of employment. Contracts of employment provide only for notice periods or payment in lieu on termination, regardless of the reason for termination.
• There were no performance bonuses paid in the 2011-12 financial year.
• Total fixed remuneration is calculated on a ‘total cost’ basis and includes the base and non-monetary benefits, long term employee benefits and post employment benefits.

166
Queensland Health Notes to the Financial Statements For the year ended 30 June 2012
39 Key executive management personnel and remuneration (continued)
Total fixed remuneration is calculated on a ‘total cost’ basis and includes the base and non-monetary benefits, long term employment benefits and post employment benefits.
1 July 2011 – 30 June 2012
Position Short terms benefits $’000 Long term
benefits
$’000
Post-employment
benefits
$’000
Termination benefits
$’000
Total remuneration
$’000 Base Non-
monetary benefits
Director-General - Dr Anthony O'Connell
(from 23 June 2011 to present) 406 26 10 41 - 483
Deputy Director-General, Human Resource Services Division - Lyn Rowland
(from 7 February 2012 to 30 June 2012) 111 - 2 12 - 125
Deputy Director-General, Human Resource Services Division - John Cairns
(from 1 July 2011 to 30 March 2012) 214 5 5 25 5 254
Deputy Director-General, Policy Strategy and Resourcing Division - Professor Michael Cleary
(from 10 May 2010 to present) 382 29 9 47 - 467
Deputy Director-General, Health Planning and Infrastructure Division - Glenn Rashleigh
(from 4 April 2012 to present) 85 1 2 9 - 97
Deputy Director-General, Health Planning and Infrastructure Division - Johnn Glaister
(from 24 January 2011 to 3 April 2012) 241 27 5 39 - 312
Deputy Director-General, Performance and Accountability Division - Terry Mehan
(from 19 November 2008 to present) 355 41 9 44 - 449
Deputy Director-General, Finance Procurement and Legal Services - Susan Middleditch
(from 14 May 2012 to present) 45 - 1 4 - 50

Se
ctio
n 1
2
|
Fin
an
cia
l st
ate
me
nts
167
Queensland Health Notes to the Financial Statements For the year ended 30 June 2012
39 Key executive management personnel and remuneration (continued)
1 July 2011 – 30 June 2012
Position Short terms benefits $’000 Long term
benefits
$’000
Post-employment
benefits
$’000
Termination benefits
$’000
Total remuneration
$’000 Base Non-
monetary benefits
Deputy Director-General, Finance Procurement and Legal Services - Tony Hendry
(from 4 April 2012 to 30 May 2012) 24 3 1 2 - 30
Deputy Director-General, Finance Procurement and Legal Services - Neil Castles
(from 24 January 2011 to 30 April 2012) 300 6 7 43 - 356
Chief Executive Officer, Centre for Healthcare Improvement - Jan Phillips
(from 17 October 2011 to present) 118 11 3 11 - 143
Chief Executive Officer, Centre for Healthcare Improvement – Dr Michael Daly
(from 25 July 2011to 16 October 2011) 69 1 1 30 - 101
Chief Executive Officer, Centre for Healthcare Improvement - Jason Currie
(from 9 to 24 July 2011 and 11 January to 25 January 2012) 16 - - 2 - 18
Chief Executive Officer, Centre for Healthcare Improvement- Wayne Howard
(from 1 July 2011 to 7 July 2011) 7 - 1 1 - 9
Chief Health Officer - Dr Jeannette Young
(from 8 October 2005 to present) 436 27 11 54 - 528
Chief Information Officer - Raymond Brown
(from 2 June 2008 to present) 274 18 6 34 - 332
Chief Executive Officer, Clinical and Statewide Services - Kathleen Byrne
(from 2 June 2009 to present) 275 16 7 33 - 331
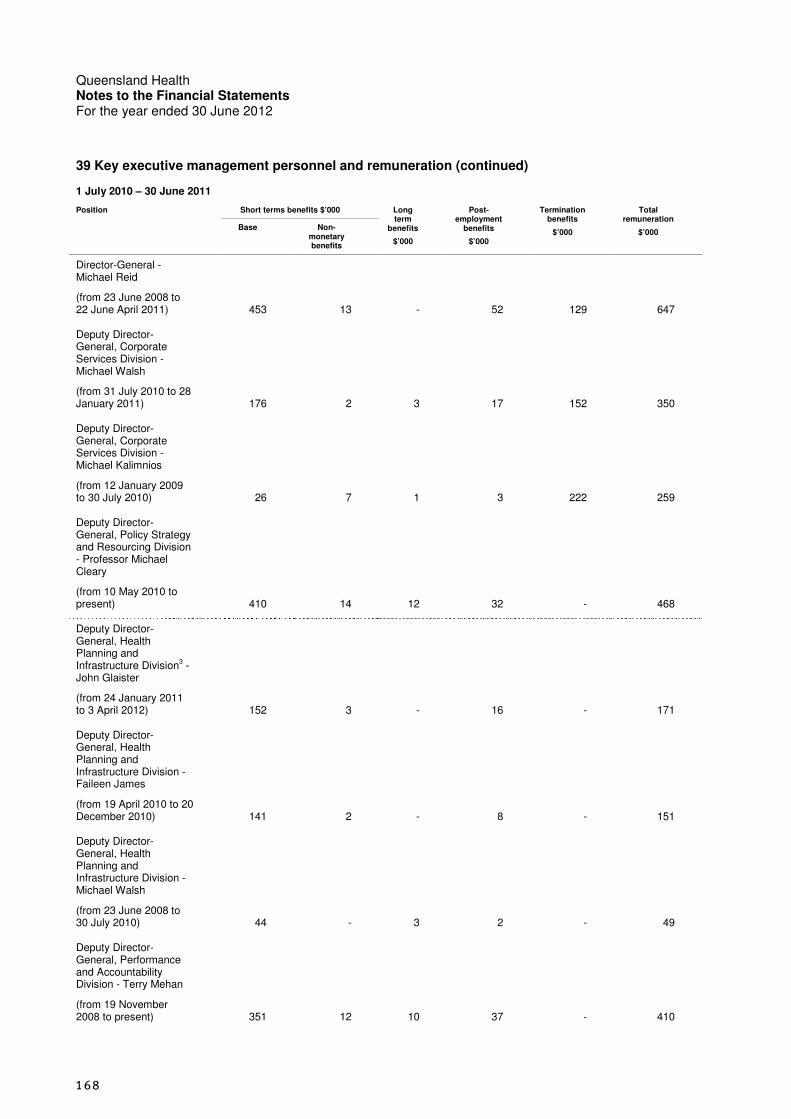
168
Queensland Health Notes to the Financial Statements For the year ended 30 June 2012
39 Key executive management personnel and remuneration (continued)
1 July 2010 – 30 June 2011
Position Short terms benefits $’000 Long term
benefits
$’000
Post-employment
benefits
$’000
Termination benefits
$’000
Total remuneration
$’000 Base Non-
monetary benefits
Director-General - Michael Reid
(from 23 June 2008 to 22 June April 2011) 453 13 - 52 129 647
Deputy Director-General, Corporate Services Division - Michael Walsh
(from 31 July 2010 to 28 January 2011) 176 2 3 17 152 350
Deputy Director-General, Corporate Services Division - Michael Kalimnios
(from 12 January 2009 to 30 July 2010) 26 7 1 3 222 259
Deputy Director-General, Policy Strategy and Resourcing Division - Professor Michael Cleary
(from 10 May 2010 to present) 410 14 12 32 - 468
Deputy Director-General, Health Planning and Infrastructure Division3 - John Glaister
(from 24 January 2011 to 3 April 2012) 152 3 - 16 - 171
Deputy Director-General, Health Planning and Infrastructure Division - Faileen James
(from 19 April 2010 to 20 December 2010) 141 2 - 8 - 151
Deputy Director-General, Health Planning and Infrastructure Division - Michael Walsh
(from 23 June 2008 to 30 July 2010) 44 - 3 2 - 49
Deputy Director-General, Performance and Accountability Division - Terry Mehan
(from 19 November 2008 to present) 351 12 10 37 - 410
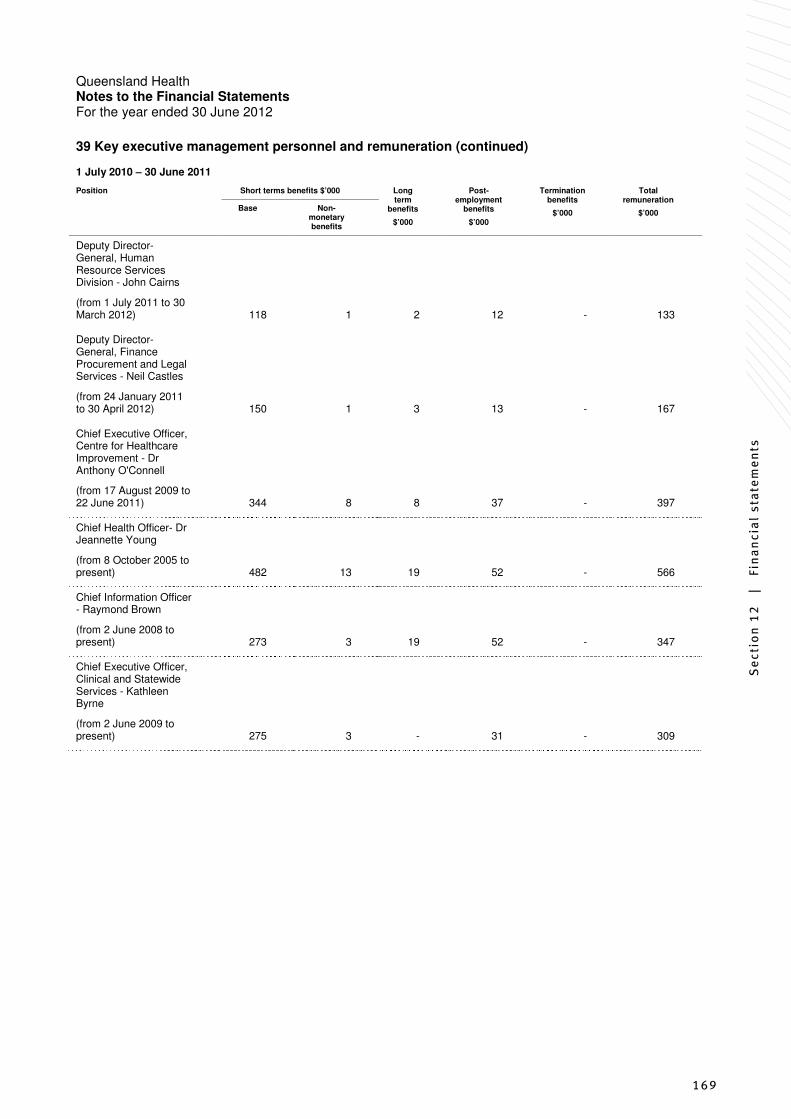
Se
ctio
n 1
2
|
Fin
an
cia
l st
ate
me
nts
169
Queensland Health Notes to the Financial Statements For the year ended 30 June 2012
39 Key executive management personnel and remuneration (continued)
1 July 2010 – 30 June 2011
Position Short terms benefits $’000 Long term
benefits
$’000
Post-employment
benefits
$’000
Termination benefits
$’000
Total remuneration
$’000 Base Non-
monetary benefits
Deputy Director-General, Human Resource Services Division - John Cairns
(from 1 July 2011 to 30 March 2012) 118 1 2 12 - 133
Deputy Director-General, Finance Procurement and Legal Services - Neil Castles
(from 24 January 2011 to 30 April 2012) 150 1 3 13 - 167
Chief Executive Officer, Centre for Healthcare Improvement - Dr Anthony O'Connell
(from 17 August 2009 to 22 June 2011) 344 8 8 37 - 397
Chief Health Officer- Dr Jeannette Young
(from 8 October 2005 to present) 482 13 19 52 - 566
Chief Information Officer - Raymond Brown
(from 2 June 2008 to present) 273 3 19 52 - 347
Chief Executive Officer, Clinical and Statewide Services - Kathleen Byrne
(from 2 June 2009 to present) 275 3 - 31 - 309

170
Queensland Health Notes to the Financial Statements For the year ended 30 June 2012
40 Administered transactions and balances
Administered transactions and balances are comprised primarily of Health Quality and Complaints Commission (HQCC) and Mater Hospital related transactions.
The HQCC provides assurance to the community that health care services providers in Queensland provide the highest possible standard in the quality of care.
The Mater Hospital redevelopment was completed in June 2008 with funding provided from Government borrowings managed as administered transactions. Further details on this arrangement are outlined below.
The Administered transactions and balances for 2011-12 are as follows.
2012 2011
$’000 $’000
Administered revenues
Administered item appropriation 25,272 25,288
Taxes, fees and fines 294 201
Total 25,566 25,489
Administered expenses
Grants 18,746 18,212
Borrowing costs 6,527 7,076
Taxes, fees and fines 293 201
Total 25,565 25,489
Administered assets
Current
Cash 21 11
Receivables 9,441 8,869
Non-current
Receivables 86,028 95,462
Total 95,490 104,342
Administered liabilities
Current
Payables 29 32
Other financial liabilities 9,433 8,848
Non-current
Other financial liabilities 86,028 95,462
Total 95,490 104,342
Receivables
Receivables reflect the passing on of funds to the Mater Hospital for the redevelopment of the public hospital component. The receivable for this will be extinguished by repayment over ten years after the completion of the redevelopment by the Government.
Payables
Borrowings are provided by Queensland Treasury Corporation. The interest rate on borrowings is fixed at 6.46%. The repayment term is ten years.
The market value of the debt as notified by Queensland Treasury Corporation at 30 June 2012 was $104.009 million (2010-11: $108.927 million). This represents the value of the debt if the department repaid the debt at 30 June 2012.
An amount of $6.527 million (2010-11: $7.076 million) comprising interest on funds and administration fees from Queensland Treasury Corporation has been recognised as an expense in the reporting period

Se
ctio
n 1
2
|
Fin
an
cia
l st
ate
me
nts
171
Queensland Health Notes to the Financial Statements For the year ended 30 June 2012
41 Reconciliation of payments from Consolidated Fund to administered revenue
2012 2011
$’000 $’000
Budgeted appropriation 25,309 24,998
Transfers from other headings (36) 290
Administered revenue recognised in Note 40 25,273 25,288
42 Events after the reporting period
(a) Health reform
On 2 August 2011, Queensland, as a member of the Council of Australian Governments signed the National Health Reform Agreement, committing to major changes in the way that health services in Australia are funded and governed. These changes are effective from 1 July 2012 and include:
• moving to a purchaser-provider model, with health service delivery to be purchased from legally independent hospital networks (statutory bodies to be known as Hospital and Health Services (HHSs) in Queensland)
• introducing national funding models and a national efficient price for services, with the majority of services to be funded on an activity unit basis into the future
• defining a refocused role for state governments in managing the health system, including:
o the use of purchasing arrangements and other levers to drive access and clinical service improvements within and across the HHSs; and
o a responsibility to intervene to remediate poor performance, either at the state’s initiative or in response to prompting by the National Health Performance Authority, which will publicly report on performance of the HHSs and healthcare facilities.
The Health and Hospitals Network Act 2011 (HHNA), enabling the establishment of the new health service entities and the System Manager role for the health department in Queensland, was passed by the Queensland Parliament in October 2011. On 17 May 2012, the Minister for Health introduced amending legislation into the Parliament to expand the functions of HHSs under the HHNA. The amended legislation is known as the Hospital and Health Boards Act 2012 (HHBA).
Information is also available on the Queensland Health website at: www.health.qld.gov.au/health-reform.
System Manager
Under the new arrangements, the role of Queensland Health’s current corporate office will change. Corporate office will transition to the System Manager role and will purchase services from the HHSs under publicly available Service Agreements negotiated between the two entities. Service Agreements for 2012-13 have been set by the Director-General of Queensland Health under the transitional provisions in the HHBA. The System Manager will not be involved in the day-to-day functioning of health services, and will devolve responsibility for frontline service delivery to the HHSs unless there is a significant economic or similar benefit to maintaining a state-wide function.
Given the devolution of functions to the HHSs, the System Manager will have responsibility for:
• developing system-wide strategy, policy and standards.
• focusing the direction of activities of the health system in Queensland by interpreting wider public health objectives, understanding the needs of Queensland’s health consumers, and setting system-wide objectives and targets in line with government policy direction.
• planning and forecasting the delivery of health services required by the Queensland population, guided by policy and strategy objectives.
• integrating workforce, infrastructure, health technology and finance needs to ensure aligned planning across the HHSs, which will deliver services under a contractual, service agreement arrangement.

172
Queensland Health Notes to the Financial Statements For the year ended 30 June 2012
42 Events after the reporting period (continued)
• acting as the purchaser and contract manager on behalf of the state managing the relationship with the National Health Funding Pool Administrator and Independent Hospital Pricing Authority.
• managing enterprise bargaining arrangements at a state-wide level, while devolving other day-to-day decisions in relation to human resource management to the HHSs, based on their performance.
The National Health Funding Body and National Health Funding Pool will have complete transparency in reporting and accounting for contributions into and out of pool accounts. The Administrator will be an independent statutory office holder, distinct from Commonwealth and State departments.
Debit Facility
HHS bank accounts will form part of the Whole-of-Government banking arrangement with the Commonwealth Bank of Australia. Under this arrangement, HHSs will have access to the Whole-of-Government debit facility. The debit facility limits assigned to the System Manager and individual HHSs are yet to be approved by Queensland Treasury and Trade. The facility limit will reflect forecast cash flow requirements and is designed to mitigate liquidity risk.
Opening Balances
Certain balances were transferred from Queensland Health to HHSs effective 1 July 2012. This was effected via a transfer notice signed by the Minister for Health, designating that the transfer be recognised as a contribution by owners through equity. The transfer notices will be approved by the Director-General of Queensland Health and the Chairman and Chief Executive Officer of each Hospital and Health Board in coming months. Balances transferred to HHSs materially reflect the closing balances of HSDs as at 30 June 2012. These balances will become the opening balances of HHSs, and will be recorded as such in the individual financial statements of the HHSs at 30 June 2013. The cash balance transferred to individual HHSs is the amount required to ensure entities commence operations with a balanced working capital position.
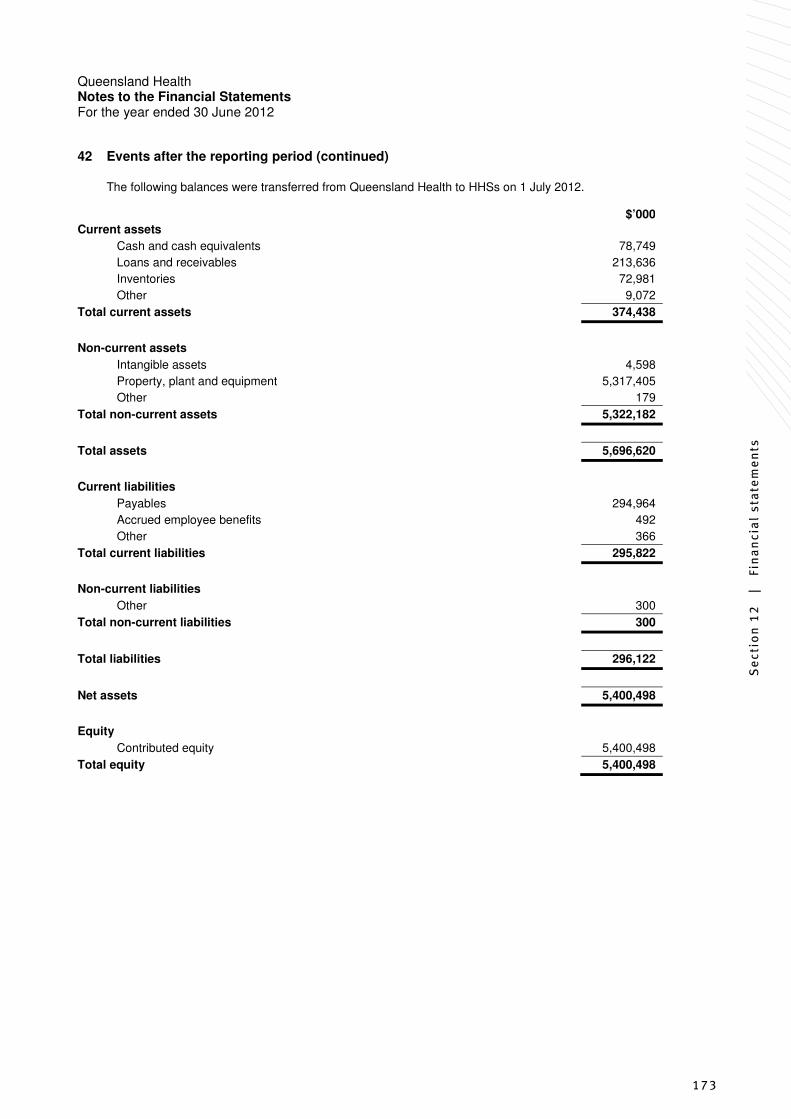
Se
ctio
n 1
2
|
Fin
an
cia
l st
ate
me
nts
173
Queensland Health Notes to the Financial Statements For the year ended 30 June 2012
42 Events after the reporting period (continued)
The following balances were transferred from Queensland Health to HHSs on 1 July 2012. $’000
Current assets
Cash and cash equivalents 78,749
Loans and receivables 213,636
Inventories 72,981
Other 9,072
Total current assets 374,438
Non-current assets
Intangible assets 4,598
Property, plant and equipment 5,317,405
Other 179
Total non-current assets 5,322,182
Total assets 5,696,620
Current liabilities
Payables 294,964
Accrued employee benefits 492
Other 366
Total current liabilities 295,822
Non-current liabilities
Other 300
Total non-current liabilities 300
Total liabilities 296,122
Net assets 5,400,498
Equity
Contributed equity 5,400,498
Total equity 5,400,498

174
Queensland Health Notes to the Financial Statements For the year ended 30 June 2012
42 Events after the reporting period (continued)
(b) Carbon pricing
The Australian government passed the Clean Energy Act 2011 with a start date of 1 July 2012. The legislation will result in the introduction of a price on carbon emissions produced by approximately 500 of Australia’s largest emitters from 1 July 2012 with the price of permits will be fixed at $23 per tonne of carbon dioxide. The flow-on effect of these measures is expected to result in increases in operational costs for future periods. (c) Payroll initiatives
Change in pay date
Most current payroll underpayments and overpayments occur because there is insufficient time to submit, approve and process many payroll forms before the pay run starts. Queensland Health will transition to a new pay period from October 2012. The change in pay date will allow payroll staff additional time to process and review pay forms, and will improve the accuracy of future staff pays. To ensure no staff member is financially disadvantaged by this change, staff will be provided with a transitional loan equal to two weeks’ net pay. Staff members may opt out of this loan or repay the balance early. Alternatively, loans will be recovered automatically when staff members leave Queensland Health. Changing the pay date was a key recommendation from the recent independent review of the payroll system undertaken by KPMG. Refer Notes 3 and 17. Auto-recovery of payroll overpayments
Queensland Health has moved to reinstate procedures to enable the auto-recovery of future overpayments. Overpayments recovery was a feature of the previous payroll system decommissioned in 2010. This reinstated function will not be used to recover any of the existing overpayments, but only those that occur after the auto-recovery system is implemented.
Other improvements
From September 2012, the former practice of accepting retrospective pay claims up to six years old will cease, replaced instead with a three month cut-off. This provision mirrors current practice elsewhere in the public and private sector and is expected to reduce the number of variations processed each pay run. Changes have also been made to pay slips to assist employees in understanding their pay data.