queensland regional profiles - mackay regional … · queensland regional profiles ... as long as...
TRANSCRIPT

Queensland Regional ProfilesResident Profile - people who live in the region
Mackay Regional Council Local Government Area (LGA)Compared with Queensland
13 April 2015

Queensland Regional Profiles: Resident Profile 2
Queensland Government Statistician’s OfficeQueensland Treasuryhttp://www.qgso.qld.gov.au
© The State of Queensland (Queensland Treasury) 2015
You are free to copy, communicate and adapt the work, as long as you attribute the authors. This document is licensed under a Creative Commons Attribution 3.0 Australia licence. To view a copy of this licence, visithttp://creativecommons.org/licenses/by/3.0/auTo attribute this work, cite Queensland Regional Profiles: Resident Profile for Mackay Regional Council Local Government Area, Queensland Government Statistician’s Office, Queensland Treasury.
All data and information in this report are believed to be accurate and have come from sources believed to be reliable. However, Queensland Treasury does not guarantee or represent that the data and the information are accurate, up to date or complete, and disclaims liability for all claims, losses, damages or costs of whatever nature and howsoever occurring, arising as a result of relying on the data and information, regardless of the form of action, whether in contract, tort (including negligence), breach of statutory duty or otherwise.
Front cover photo credits (from left to right): © Courtesy of Tourism Queensland; © The State of Queensland; © Lyle Radford; © The State of Queensland.
To run this profile again, please click here

Queensland Regional Profiles: Resident Profile 3
Region overview The resident profiles provide details on a range of topics for people who live in the region. For some topics, more detailed data are available through the Queensland Regional Database (also known as QRSIS), developed and maintained by the Queensland Government Statistician’s Office.
Mackay Regional Council Local Government Area (LGA) has a total area of 7,622.0 km2. Mackay Regional Council LGA has an average daily temperature range of 17.0 °C to 26.7 °C and on average it receives 1,705 mm of rainfall each year.
Queensland has a total area of 1,734,238.8 km2. Queensland has an average daily temperature range of 16.4 °C to 30.0 °C and on average it receives 636 mm of rainfall each year.
Data are based on Australian Bureau of Statistics (ABS), Australian Statistical Geography Standard (ASGS), July 2011. In some cases these data have been concorded from other geographical boundaries.

Queensland Regional Profiles: Resident Profile 4
Figure 1 Map of Mackay Regional Council LGA

Queensland Regional Profiles: Resident Profile 5
DemographyEstimated resident populationThe estimated resident population (ERP) figure is the officialpopulation estimate, and represents the best possible estimateof the resident population. For sub-state geographies, ERPfigures are updated annually using a model which includesadministrative data that indicate population change, such asregistered births and deaths, dwelling approvals, Medicareenrolments and electoral enrolments. Data are updatedannually with an approximate delay of 9 months after thereporting period. It is anticipated the next update will be in April2016.
As at 30 June 2014, the estimated resident population for Mackay Regional Council LGA was
123,383 persons
Mackay Regional Council LGA• ERP of 123,383 persons as at 30 June 2014• Average annual growth rate of 2.1% over five years• Average annual growth rate of 2.5% over ten years
Queensland• ERP of 4,722,447 persons as at 30 June 2014• Average annual growth rate of 1.8% over five years• Average annual growth rate of 2.1% over ten years
Table 1 Estimated resident population, Mackay Regional Council LGA and Queensland
LGA / StateAs at 30 June Average annual growth rate
2004 2009 2014p 2004–2014p 2009–2014p— number — — % —
Mackay (R) 96,285 111,455 123,383 2.5 2.1Queensland 3,829,970 4,328,771 4,722,447 2.1 1.8
Source: ABS 3218.0, Regional Population Growth, Australia, 2013-14
Figure 2 Estimated resident population growth, Mackay Regional Council LGA and Queensland
Source: ABS 3218.0, Regional Population Growth, Australia, 2013-14

Queensland Regional Profiles: Resident Profile 6
Population by age and sexThe estimated resident population (ERP) figure is the officialpopulation estimate, and represents the best possible estimateof the resident population. For sub-state geographies, ERPfigures are updated annually using a model which includesadministrative data that indicate population change, such asregistered births and deaths, dwelling approvals, Medicareenrolments and electoral enrolments. Data are updatedannually with an approximate delay of 12 months after thereporting period. It is anticipated the next update will be inSeptember 2015.
As at 30 June 2013, the proportion of the estimated resident population aged 65 years and over for Mackay Regional
Council LGA was
11.0%
Mackay Regional Council LGA• 21.0% aged 0–14 years as at 30 June 2013• 68.0% aged 15–64 years• 11.0% aged 65+ years
Queensland• 19.8% aged 0–14 years as at 30 June 2013• 66.5% aged 15–64 years• 13.6% aged 65+ years
Table 2 Estimated resident population by age, Mackay Regional Council LGA and Queensland, 30 June 2013p
LGA / StateAge group
0–14 15–24 25–44 45–64 65+number % number % number % number % number %
Mackay (R) 25,620 21.0 16,443 13.5 35,480 29.1 30,945 25.4 13,421 11.0Queensland 924,352 19.8 642,291 13.8 1,313,426 28.2 1,142,755 24.5 633,979 13.6
Source: ABS 3235.0, Population by Age and Sex, Regions of Australia, 2013
Figure 4 Estimated resident population by age and sex, Mackay Regional Council LGA and Queensland, 30 June 2013p
Source: ABS 3235.0, Population by Age and Sex, Regions of Australia, 2013

Queensland Regional Profiles: Resident Profile 7
Median ageThe median age is the age at which half the population is olderand half is younger. These median age estimates have beencalculated by the ABS and Queensland Treasury using singleyear of age estimated resident population data. Data areupdated annually with an approximate delay of 12 months afterthe reporting period. It is anticipated the next update will be inSeptember 2015.
As at 30 June 2013, the median age for Mackay Regional Council LGA was
35.5 years
Mackay Regional Council LGA• Median age of 35.5 years as at 30 June 2013• Decrease of 0.6 years from median age of 34.9 years as at
30 June 2003
Queensland• Median age of 36.6 years as at 30 June 2013• Increase of 1.1 years from median age of 35.5 years as at
30 June 2003
Table 3 Median age, Mackay Regional Council LGA and Queensland
LGA / StateAs at 30 June Change
2003 2008 2013p 2003–2013p— years — years
Mackay (R) 34.9 35.7 35.5 0.6Queensland 35.5 36.2 36.6 1.1
Refer to explanatory notes for additional information.
Source: ABS 3235.0, Population by Age and Sex, Regions of Australia unpublished data and Queensland Treasury estimates

Queensland Regional Profiles: Resident Profile 8
Population projectionsThe Queensland Government population projections aregenerated by applying assumptions regarding future trends inthe components of population change (fertility, mortality andmigration) and the latest planning and development intelligenceavailable. Data presented in this topic are based on a mediumseries. Data are updated twice every five years. It is anticipatedthe next update will be in December 2016.
From 2011 to 2036, the population for Mackay Regional Council LGA is projected to increase from
115,960 persons to 197,905 persons
Mackay Regional Council LGA• Population projected to be 197,905 persons as at 30 June
2036• Increase of 2.2% per year over 25 years
Queensland• Population projected to be 7,095,177 persons as at 30
June 2036• Increase of 1.9% per year over 25 years
Table 4 Projected population, Mackay Regional Council LGA and Queensland
LGA / StateAs at 30 June
Average annual growth
rate2011(a) 2016 2021 2026 2031 2036 2011–2036
— number — %
Mackay (R) 115,960 130,896 146,304 162,455 179,677 197,905 2.2Queensland 4,476,778 4,946,319 5,477,082 6,007,578 6,548,220 7,095,177 1.9
Refer to explanatory notes for additional information.
(a) 2011 data are estimated resident population (ERP).For more detailed data on the Queensland Government population projections, please refer to the Queensland Government Statistician’s Office website athttp://www.qgso.qld.gov.au/subjects/demography/population-projections/index.php
Source: Queensland Government Population Projections, 2013 edition (medium series)
Figure 5 Projected population change, Mackay Regional Council LGA and Queensland
Source: Queensland Government Population Projections, 2013 edition (medium series)
Queensland Regional Profiles: Resident Profile 9
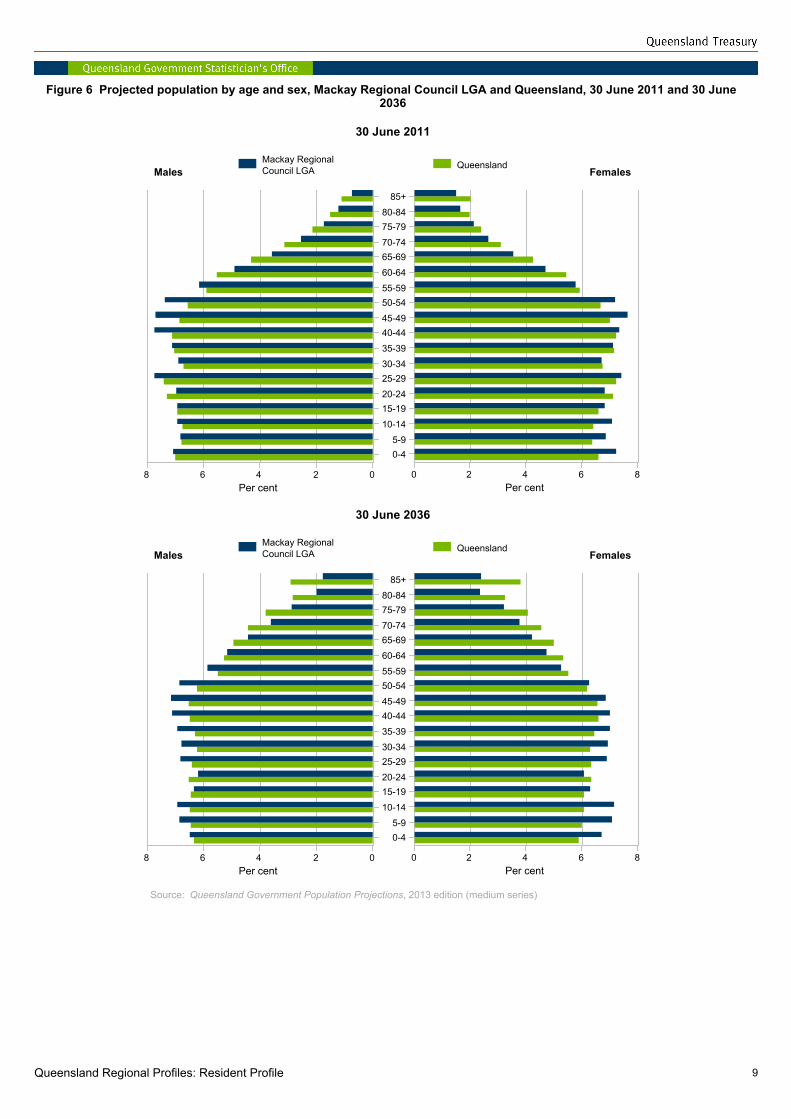
Figure 6 Projected population by age and sex, Mackay Regional Council LGA and Queensland, 30 June 2011 and 30 June 2036
30 June 2011
30 June 2036
Source: Queensland Government Population Projections, 2013 edition (medium series)

Queensland Regional Profiles: Resident Profile 10
Indigenous populationIndigenous population is based on the 2011 Census ofPopulation and Housing question about Indigenous statuswhere each person is asked to identify whether they are ofAboriginal and/or Torres Strait Islander origin. This is based onpersons by place of usual residence.
The percentage of Indigenous persons in Mackay Regional Council LGA was
4.4%
Mackay Regional Council LGA• 4,912 persons (or 4.4%) were Indigenous
Queensland• 155,824 persons (or 3.6%) were Indigenous
Table 5 Indigenous status, Mackay Regional Council LGA and Queensland, 2011
LGA / StateIndigenous persons
Non-Indigenous persons
Total persons(b)Aboriginal Torres Strait
Islander Both(a) Total
— number — number % number % number
Mackay (R) 2,907 1,303 702 4,912 4.4 101,061 89.6 112,797Queensland 122,896 20,094 12,834 155,824 3.6 3,952,707 91.2 4,332,740
(a) Applicable to persons who are of 'both Aboriginal and Torres Strait Islander origin'.(b) Includes Indigenous status not stated.
Source: ABS, Census of Population and Housing, 2011, Indigenous Profile - I02 (usual residence)
Births and deathsBirth and death statistics are an estimate of the number of birthsand deaths that have been registered in Australia’s state andterritory Registries of Births, Deaths and Marriages over acalendar year. These estimates are useful for two distinctpurposes – use as a component of population growth and foranalysis of fertility and mortality. Data are updated annually withan approximate delay of 12 months after the reporting period. Itis anticipated the next update will be in December 2015.
The number of registered births in 2013 to mothers with a usual residence in Mackay Regional Council LGA was
1,789 births
Mackay Regional Council LGA• 1,789 registered births in 2013• 620 registered deaths
Queensland• 63,354 registered births in 2013• 27,901 registered deaths
Table 6 Registered births and deaths, Mackay Regional Council LGA and Queensland, 2013
LGA / State Births Deaths Natural increasenumber rate(a) number rate(a) number
Mackay (R) 1,789 14.7 620 5.1 1,169Queensland(b) 63,354 13.6 27,901 6.0 35,453
Refer to explanatory notes for additional information.
(a) Crude rate per 1,000 persons.(b) Queensland totals include births and deaths where the usual residence was overseas, no fixed abode, Offshore and Migratory, and Queensland undefined.
Source: ABS 3301.0, Births, Australia, 2013; ABS 3302.0, Deaths, Australia, 2013

Queensland Regional Profiles: Resident Profile 11
Figure 7 Crude birth rate, Mackay Regional Council LGA and Queensland(a)
(a) Queensland totals include births where the usual residence was overseas, no fixed abode, Offshore and Migratory, and Queenslandundefined.
Source: ABS 3301.0, Births, Australia, 2013; ABS 3302.0, Deaths, Australia, 2013
Figure 8 Crude death rate, Mackay Regional Council LGA and Queensland(a)
(a) Queensland totals include deaths where the usual residence was overseas, no fixed abode, Offshore and Migratory, and Queenslandundefined.
Source: ABS 3301.0, Births, Australia, 2013; ABS 3302.0, Deaths, Australia, 2013

Queensland Regional Profiles: Resident Profile 12
Migration 1 year agoMigration one year ago compares the usual address ofhousehold members on Census Night 2011 (9 August 2011)with their usual address one year earlier (i.e. 9 August 2010).This is based on persons by place of usual residence.
The percentage of persons in Mackay Regional Council LGA with a different address one year ago was
17.6%
Mackay Regional Council LGA• 84,888 persons usually resided in the same address as one
year ago• 19,594 persons (or 17.6%) usually resided in a different
address one year ago
Queensland• 3,278,187 persons usually resided in the same address as
one year ago• 764,695 persons (or 17.9%) usually resided in a different
address one year ago
Table 7 Place of usual residence one year ago(a), Mackay Regional Council LGA and Queensland, 2011
LGA / State Sameaddress
Different address Proportionwith
differentaddress
Total persons(c)Within
QueenslandRest of
Australia Overseas Total(b)
number — number — % number
Mackay (R) 84,888 16,030 2,113 1,181 19,594 17.6 111,123Queensland 3,278,187 616,283 75,239 63,184 764,695 17.9 4,275,277
(a) Based on persons aged one year and over.(b) Includes persons who stated that they were usually resident at a different address 1 year ago but did not state that address.(c) Includes persons who did not state whether they were usually resident at a different address 1 year ago.
Source: ABS, Census of Population and Housing, 2011, Basic Community Profile - B38 (usual residence)
Migration 5 years agoMigration five years ago compares the usual address ofhousehold members on Census Night 2011 (9 August 2011)with their usual address five years earlier (i.e. 9 August 2006).This is based on persons by place of usual residence.
The percentage of persons in Mackay Regional Council LGA with a different address five years ago was
43.9%
Mackay Regional Council LGA• 51,215 persons usually resided in the same address as five
years ago• 45,940 persons (or 43.9%) usually resided in a different
address five years ago
Queensland• 1,958,914 persons usually resided in the same address as
five years ago• 1,815,132 persons (or 43.9%) usually resided in a different
address five years ago
Table 8 Place of usual residence five years ago(a), Mackay Regional Council LGA and Queensland, 2011
LGA / State Sameaddress
Different address Proportionwith
differentaddress
Total persons(c)Within
QueenslandRest of
Australia Overseas Total(b)
number — number — % number
Mackay (R) 51,215 35,402 5,582 4,242 45,940 43.9 104,667Queensland 1,958,914 1,331,610 218,734 238,588 1,815,132 45.0 4,034,846
(a) Based on persons aged five years and over.(b) Includes persons who stated that they were usually resident at a different address 5 years ago but did not state that address.(c) Includes persons who did not state whether they were usually resident at a different address 5 years ago.
Source: ABS, Census of Population and Housing, 2011, Basic Community Profile - B39 (usual residence)
Queensland Regional Profiles: Resident Profile 13
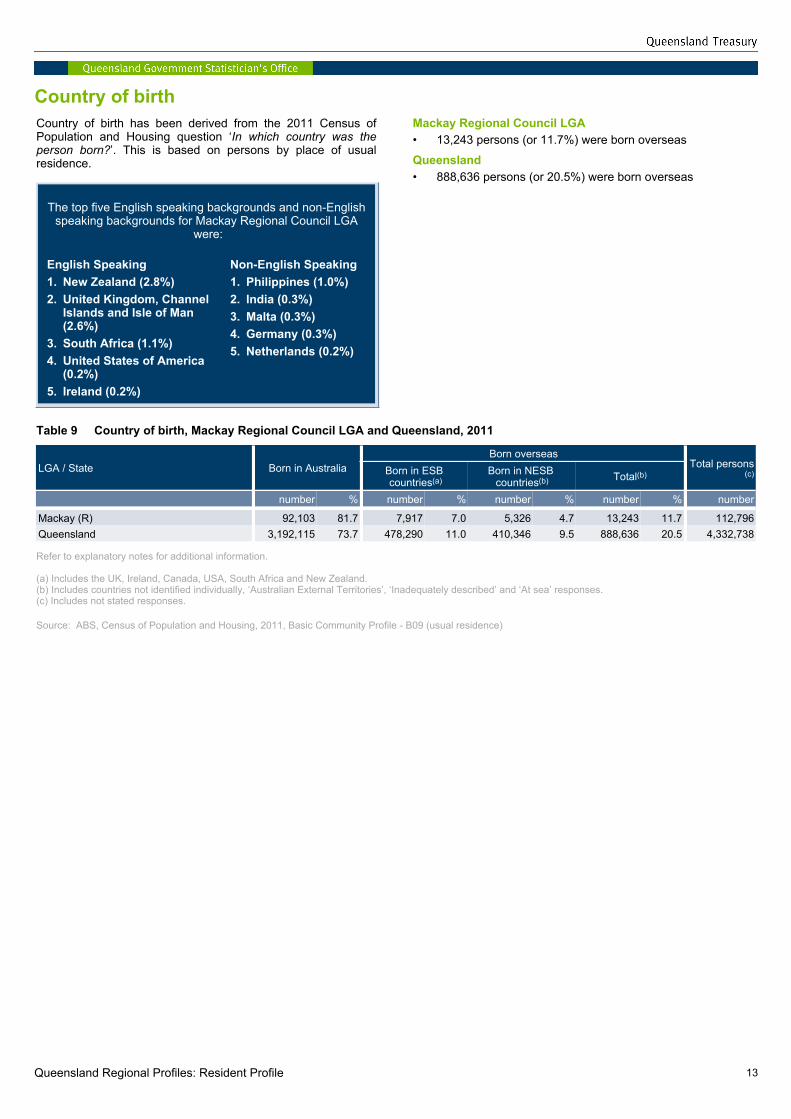
Country of birthCountry of birth has been derived from the 2011 Census ofPopulation and Housing question ‘In which country was theperson born?’. This is based on persons by place of usualresidence.
The top five English speaking backgrounds and non-English speaking backgrounds for Mackay Regional Council LGA
were:
English Speaking1. New Zealand (2.8%)2. United Kingdom, Channel
Islands and Isle of Man (2.6%)
3. South Africa (1.1%)4. United States of America
(0.2%)5. Ireland (0.2%)
Non-English Speaking1. Philippines (1.0%)2. India (0.3%)3. Malta (0.3%)4. Germany (0.3%)5. Netherlands (0.2%)
Mackay Regional Council LGA• 13,243 persons (or 11.7%) were born overseas
Queensland• 888,636 persons (or 20.5%) were born overseas
Table 9 Country of birth, Mackay Regional Council LGA and Queensland, 2011
LGA / State Born in AustraliaBorn overseas
Total persons(c)Born in ESB
countries(a)Born in NESB
countries(b) Total(b)
number % number % number % number % number
Mackay (R) 92,103 81.7 7,917 7.0 5,326 4.7 13,243 11.7 112,796Queensland 3,192,115 73.7 478,290 11.0 410,346 9.5 888,636 20.5 4,332,738
Refer to explanatory notes for additional information.
(a) Includes the UK, Ireland, Canada, USA, South Africa and New Zealand.(b) Includes countries not identified individually, ‘Australian External Territories’, ‘Inadequately described’ and ‘At sea’ responses.(c) Includes not stated responses.
Source: ABS, Census of Population and Housing, 2011, Basic Community Profile - B09 (usual residence)

Queensland Regional Profiles: Resident Profile 14
Proficiency in spoken EnglishProficiency in spoken English has been derived from the 2011Census of Population and Housing question ‘How well does theperson speak English?’, if the person speaks a language otherthan English at home. This topic relates to persons who statedthey were born overseas as at Census Night 2011. This isbased on overseas-born persons by place of usual residence.
The top five non-English languages spoken at home for Mackay Regional Council LGA were:
Language spoken1. Southeast Asian Austronesian (0.9%)2. Indo Aryan (0.4%)3. German (0.3%)4. Italian (0.3%)5. Chinese (0.3%)
Mackay Regional Council LGA• 4,109 persons (or 31.0%) stated they spoke a language
other than English at home
Queensland• 319,949 persons (or 36.0%) stated they spoke a language
other than English at home
Table 10 Proficiency in spoken English of overseas-born persons, Mackay Regional Council LGA and Queensland, 2011
LGA / State Speaks English onlySpeaks other language at home and speaks English Persons
born overseas(b)Very well or well Not well or not at all Total(a)
number % number % number % number % number
Mackay (R) 9,096 68.7 3,753 28.3 324 2.4 4,109 31.0 13,247Queensland 565,544 63.6 269,847 30.4 45,927 5.2 319,949 36.0 888,635
Refer to explanatory notes for additional information.
(a) Includes proficiency in English not stated.(b) Excludes persons who did not state their country of birth.
Source: ABS, Census of Population and Housing, 2011, Basic Community Profile - B11 and B13 (usual residence)

Queensland Regional Profiles: Resident Profile 15
Family compositionIn the context of the 2011 Census of Population and Housing,families are classified in terms of the relationships that existbetween a single family reference person and each othermember of that family. The family composition variabledistinguishes between different types of families based on thepresence or absence of couple relationships, parent-childrelationships, child dependency relationships or other familialrelationships, in that order of preference. This is based onfamilies by place of usual residence.
The percentage of total families in Mackay Regional Council LGA which were couple families with children was
46.4%
Mackay Regional Council LGA• 30,169 families• 46.4% of total families were couple families with children
Queensland• 1,148,179 families• 42.8% of total families were couple families with children
Table 11 Family composition(a), Mackay Regional Council LGA and Queensland, 2011
LGA / State Couple family with no children
Couple family with children One-parent family Total(b)
number % number % number % number
Mackay (R) 11,783 39.1 13,986 46.4 3,990 13.2 30,169Queensland 453,102 39.5 491,200 42.8 184,547 16.1 1,148,179
(a) Includes same-sex couple families.(b) Includes other families.
Source: ABS, Census of Population and Housing, 2011, Basic Community Profile - B25 (families and persons)
Household compositionIn the context of the 2011 Census of Population and Housing, ahousehold is defined as one or more persons, at least one ofwhom is at least 15 years of age, usually resident in the sameprivate dwelling. Household composition describes the type ofhousehold within a dwelling, whether a family is present or notand whether or not other unrelated household members arepresent. This is based on occupied private dwellings.
The percentage of one family households in Mackay Regional Council LGA was
74.5%
Mackay Regional Council LGA• 38,561 households• 74.5% of total households were one family households
Queensland• 1,547,304 households• 70.7% of total households were one family households
Table 12 Household composition, Mackay Regional Council LGA and Queensland, 2011
LGA / State One family households
Multiple family households
Grouphouseholds
Lone person households
Totalhouseholds
number % number % number % number % number
Mackay (R) 28,714 74.5 715 1.9 1,377 3.6 7,755 20.1 38,561Queensland 1,094,467 70.7 26,361 1.7 72,966 4.7 353,510 22.8 1,547,304
Source: ABS, Census of Population and Housing, 2011, unpublished data (occupied private dwellings)

Queensland Regional Profiles: Resident Profile 16
Dwellings by dwelling structureIn general terms, a dwelling is a structure which is intended tohave people live in it, and which is habitable on Census Night.The dwelling structure variable classifies the structure of privatedwellings enumerated in the 2011 Census of Population andHousing. This information is determined by the Census collectorand is based on occupied private dwellings.
The percentage of total occupied private dwellings in Mackay Regional Council LGA which were separate houses was
85.2%
Mackay Regional Council LGA• 32,841 occupied private dwellings (or 85.2%) were
separate houses
Queensland• 1,215,303 occupied private dwellings (or 78.5%) were
separate houses
Table 13 Occupied private dwellings(a) by dwelling structure, Mackay Regional Council LGA and Queensland, 2011
LGA / State Separate house Semi-detached(b) Apartment(c) Caravan(d) Other(e) Total(f) number % number % number % number % number % number
Mackay (R) 32,841 85.2 1,913 5.0 2,968 7.7 637 1.7 156 0.4 38,561Queensland 1,215,303 78.5 129,430 8.4 181,716 11.7 16,191 1.0 3,384 0.2 1,547,303
(a) Excludes visitors only and other not classifiable households.(b) Includes row or terrace house, townhouse etc.(c) Includes flat or units.(d) Includes cabin and houseboat.(e) Includes improvised home, tent, sleepers out; house or flat attached to a shop, office, etc.(f) Includes dwelling structures not stated.
Source: ABS, Census of Population and Housing, 2011, Basic Community Profile - B31 (dwellings and persons)
Dwellings by tenure typeIn general terms, a dwelling is a structure which is intended tohave people live in it, and which is habitable on Census Night.The tenure type variable describes whether a household rentsor owns the dwelling in which they were enumerated on CensusNight 2011, or whether the household occupies it under anotherarrangement. This is based on occupied private dwellings.
The percentage of total occupied private dwellings in Mackay Regional Council LGA which were fully owned was
29.7%
Mackay Regional Council LGA• 11,471 occupied private dwellings (or 29.7%) were fully
owned
Queensland• 448,617 occupied private dwellings (or 29.0%) were fully
owned
Table 14 Occupied private dwellings(a) by tenure type, Mackay Regional Council LGA and Queensland, 2011
LGA / State Fully owned Being purchased(b) Rented(c) Other(d) Total(e) number % number % number % number % number
Mackay (R) 11,471 29.7 14,374 37.3 11,362 29.5 371 1.0 38,560Queensland 448,617 29.0 533,868 34.5 513,415 33.2 14,304 0.9 1,547,303
(a) Excludes visitors only and other not classifiable households.(b) Includes dwellings being purchased under a rent/buy scheme.(c) Includes renting from a real estate agent, state housing authority, person not in the same household, housing co-op/community/church, other and not stated.(d) Includes dwellings being occupied under a life tenure scheme.(e) Includes tenure type not stated.
Source: ABS, Census of Population and Housing, 2011, Basic Community Profile - B32 (occupied private dwellings)

Queensland Regional Profiles: Resident Profile 17
Number of motor vehicles per dwellingThe number of motor vehicles variable records the number ofregistered motor vehicles, which are owned or used bymembers of a household, and which are garaged or parkednear the occupied private dwelling on Census Night 2011. Thisis based on occupied private dwellings by place of enumeration.
The percentage of dwellings in Mackay Regional Council LGA with 3 or more motor vehicles was
22.7%
Mackay Regional Council LGA• 4.9% of dwellings had no motor vehicles• 22.7% of dwellings had 3 or more motor vehicles
Queensland• 7.2% of dwellings had no motor vehicles• 17.3% of dwellings had 3 or more motor vehicles
Table 15 Number of motor vehicles per occupied private dwelling (a)(b), Mackay Regional Council LGA and Queensland, 2011
LGA / State No motor vehicles 1 motor vehicle 2 motor vehicles 3 or more motor vehicles
Total dwellings
number % number % number % number % number
Mackay (R) 1,889 4.9 11,132 28.9 15,502 40.2 8,768 22.7 38,562Queensland 110,842 7.2 547,575 35.4 575,736 37.2 267,083 17.3 1,547,306
(a) Excludes visitors only and other not classifiable households.(b) Excludes motorbikes/scooters.
Source: ABS, Census of Population and Housing, 2011, Basic Community Profile - B29 (occupied private dwellings)
Internet connectionThe type of Internet connection has been derived from the 2011Census of Population and Housing question ‘Can the Internetbe accessed at this dwelling?’. This is based on occupiedprivate dwellings by place of enumeration.
The percentage of total occupied private dwellings in Mackay Regional Council LGA with an internet connection was
76.5%
Mackay Regional Council LGA• 29,482 occupied private dwellings (or 76.5%) had Internet
connections
Queensland• 1,211,884 occupied private dwellings (or 78.3%) had
Internet connections
Table 16 Internet connections in occupied private dwellings(a)(b), Mackay Regional Council LGA and Queensland, 2011
LGA / State No Internet connection
With Internet connection Total dwellings(d) Broadband Dial-up Total(c)
number % — number — number % number
Mackay (R) 7,593 19.7 26,767 1,193 29,482 76.5 38,562Queensland 281,467 18.2 1,103,036 45,088 1,211,884 78.3 1,547,301
(a) Excludes visitors only and other not classifiable households.(b) Where a dwelling has more than one type of Internet connection only one is recorded.(c) Includes other Internet connection.(d) Includes Internet connection not stated.
Source: ABS, Census of Population and Housing, 2011, Basic Community Profile - B35 (occupied private dwellings)

Queensland Regional Profiles: Resident Profile 18
SocietyEarly childhood education and care servicesThe early childhood education and care services data are basedon administrative data supplied by the Department of Educationand Training. Data are updated twice yearly with anapproximate delay of 1 month after the reporting period. It isanticipated the next update will be in September 2015.
The number of early childhood education and care services in Mackay Regional Council LGA as at 28 February 2015 was
72 services
Mackay Regional Council LGA• 72 early childhood education and care services as at 28
February 2015• 27 long day care services
Queensland• 2,971 early childhood education and care services as at 28
February 2015• 1,437 long day care services
Table 17 Early childhood education and care services, Mackay Regional Council LGA and Queensland, 28 February 2015
LGA / StateFamily
daycare
KindergartensLong
daycare
Schoolagedcare
Limitedhours
careTotal(a)
— number —
Mackay (R) 2 21 27 18 1 72Queensland 124 520 1,437 717 35 2,971
(a) Total includes Other service types (for example Child and Family Support Hubs and Community Services).
Source: Office for Early Childhood Education and Care, Department of Education and Training
Highest level of schoolingHighest year of school completed has been derived from the2011 Census of Population and Housing question 'What is thehighest year of primary or secondary school the person hascompleted?'. This information is based on persons aged 15years and over who are no longer attending primary orsecondary school, by place of usual residence.
The percentage of total persons in Mackay Regional Council LGA with highest level of schooling as year 11 or 12 was
46.6%
Mackay Regional Council LGA• 39,777 persons (or 46.6%) with highest level of schooling
of year 11 or 12 (or equivalent)
Queensland• 1,836,995 persons (or 55.3%) with highest level of
schooling of year 11 or 12 (or equivalent)
Table 18 Highest level of schooling completed, Mackay Regional Council LGA and Queensland, 2011
LGA / State Did not go to school, or Year 8 or below
Year 9 or 10 or equivalent
Year 11 or 12 or equivalent Total(a)
number % number % number % number
Mackay (R) 6,468 7.6 30,674 35.9 39,777 46.6 85,354Queensland 219,102 6.6 977,116 29.4 1,836,995 55.3 3,320,761
(a) Includes highest year of schooling not stated.
Source: ABS, Census of Population and Housing, 2011, Basic Community Profile - B16 (usual residence)

Queensland Regional Profiles: Resident Profile 19
Non-school qualificationNon-school qualification information describes the highest non-school qualification (e.g. bachelor degree, diploma) completedas stated in the 2011 Census of Population and Housing. Thisinformation is based on persons aged 15 years and over byplace of usual residence.
The percentage of persons in Mackay Regional Council LGA with a non-school qualification was
51.5%
Mackay Regional Council LGA• 45,751 persons (or 51.5%) with a non-school qualification
Queensland• 1,875,323 persons (or 54.2%) with a non-school
qualification
Table 19 Non-school qualifications by level of education, Mackay Regional Council LGA and Queensland, 2011
LGA / StateLevel of education
Persons with a qualification(c) Total personsBachelor degree or
higher(a)Advanced diploma or
diploma Certificate(b)
number % number % number % number % number
Mackay (R) 8,277 9.3 4,859 5.5 22,138 24.9 45,751 51.5 88,839Queensland 548,894 15.9 260,778 7.5 686,993 19.9 1,875,323 54.2 3,456,875
(a) Includes bachelor degree, graduate diploma, graduate certificate and postgraduate degree.(b) Includes Certificate, I, II, III and IV and Certificates not further defined responses.(c) Includes inadequately described and not stated level of education responses.
Source: ABS, Census of Population and Housing, 2011, Basic Community Profile - B37 and B40 (usual residence)

Queensland Regional Profiles: Resident Profile 20
Non-school qualification by sex and ageNon-school qualification information describes the highest non-school qualification (e.g. bachelor degree, diploma) completedas stated in the 2011 Census of Population and Housing. Thisinformation is based on persons aged 15 years and over byplace of usual residence.
The percentage of persons in Mackay Regional Council LGA with a non-school qualification was
51.5%
Mackay Regional Council LGA• 45,751 persons (or 51.5%) with a non-school qualification• 68.7% males aged 25-44 years with a non-school
qualification• 55.3% females aged 25-44 years with a non-school
qualification
Queensland• 1,875,323 persons (or 54.2%) with a non-school
qualification• 67.4% males aged 25-44 years with a non-school
qualification• 64.5% females aged 25-44 years with a non-school
qualification
Table 20 Non-school qualifications by sex and age, Mackay Regional Council LGA and Queensland, 2011
Sex / ageMackay Regional Council LGA Queensland
With NSQ(a) Without NSQ With NSQ(a) Without NSQnumber % number % number % number %
Males15-24 years 2,868 36.5 4,982 63.5 99,829 33.5 198,166 66.525-44 years 11,554 68.7 5,271 31.3 400,938 67.4 193,726 32.645-64 years 9,628 62.3 5,825 37.7 339,647 63.0 199,872 37.065 years and over 2,870 49.7 2,910 50.3 147,232 55.3 119,067 44.7Total 26,920 58.6 18,988 41.4 987,646 58.1 710,831 41.9
Females15-24 years 2,362 32.9 4,812 67.1 103,162 35.6 186,606 64.425-44 years 8,579 55.3 6,927 44.7 395,579 64.5 217,916 35.545-64 years 5,896 42.4 8,020 57.6 277,134 50.2 275,318 49.865 years and over 1,994 31.5 4,338 68.5 111,802 36.9 190,885 63.1Total 18,831 43.9 24,097 56.1 887,677 50.5 870,725 49.5
Persons15-24 years 5,230 34.8 9,794 65.2 202,991 34.5 384,772 65.525-44 years 20,133 62.3 12,198 37.7 796,517 65.9 411,642 34.145-64 years 15,524 52.9 13,845 47.1 616,781 56.5 475,190 43.565 years and over 4,864 40.2 7,248 59.8 259,034 45.5 309,952 54.5Total 45,751 51.5 43,085 48.5 1,875,323 54.2 1,581,556 45.8
Refer to explanatory notes for additional information.
(a) Includes inadequately described and not stated level of education responses.
Source: ABS, Census of Population and Housing, 2011, Basic Community Profile - B01 and B40 (usual residence)

Queensland Regional Profiles: Resident Profile 21
Non-school qualification by field of studyNon-school qualification information describes the highest non-school qualification (e.g. bachelor degree, diploma) completedas stated in the 2011 Census of Population and Housing. Thisinformation is based on persons aged 15 years and over byplace of usual residence.
The largest non-school qualification field of study in Mackay Regional Council LGA was
Engineering and Related
Technologies (27.4%)
Mackay Regional Council LGA• 12,524 persons (or 27.4%) with a non-school qualification
studied in the field of Engineering and Related Technologies• 5,653 persons (or 12.4%) with a non-school qualification
studied in the field of Management and Commerce
Queensland• 314,629 persons (or 16.8%) with a non-school qualification
studied in the field of Engineering and Related Technologies• 310,801 persons (or 16.6%) with a non-school qualification
studied in the field of Management and Commerce
Table 21 Non-school qualifications by field of study, Mackay Regional Council LGA and Queensland, 2011
Field of study Mackay Regional Council LGA Queensland Specialisation
rationumber % number % number
Natural and Physical Sciences 607 1.3 42,973 2.3 0.58Information Technology 439 1.0 41,051 2.2 0.44Engineering and Related Technologies 12,524 27.4 314,629 16.8 1.63Architecture and Building 3,231 7.1 123,878 6.6 1.07Agriculture, Environmental and Related Studies 813 1.8 38,166 2.0 0.87Health 3,454 7.5 173,991 9.3 0.81Education 3,194 7.0 139,977 7.5 0.94Management and Commerce 5,653 12.4 310,801 16.6 0.75Society and Culture 2,698 5.9 180,557 9.6 0.61Creative Arts 649 1.4 53,377 2.8 0.50Food, Hospitality and Personal Services 2,597 5.7 105,082 5.6 1.01Mixed Field Programmes 48 0.1 2,830 0.2 0.70
Total(a) 45,753 100.0 1,875,323 100.0 1.00
Refer to explanatory notes for additional information.
(a) Includes inadequately described and not stated responses.
Source: ABS, Census of Population and Housing, 2011, Basic Community Profile - B41 (usual residence)

Queensland Regional Profiles: Resident Profile 22
Persons with a profound or severe disabilityPersons with a profound or severe disability has been derivedfrom the 2011 Census of Population and Housing variable 'Coreactivity need for assistance'. Persons with a profound or severedisability are defined as needing help or assistance in one ormore of the three core activity areas of self-care, mobility andcommunication because of a long term health condition (sixmonths or more), a disability (lasting six months or more), or oldage. This is based on persons by place of usual residence.
The percentage of persons in Mackay Regional Council LGA in need of assistance with a profound or severe disability was
3.7%
Mackay Regional Council LGA• 4,120 persons (or 3.7%) in need of assistance with a
profound or severe disability
Queensland• 192,019 persons (or 4.4%) in need of assistance with a
profound or severe disability
Table 22 Need for assistance with a profound or severe disability, Mackay Regional Council LGA and Queensland, 2011
LGA / State Need for assistance No need for assistance Total(a)
number % number % number
Mackay (R) 4,120 3.7 101,402 89.9 112,797Queensland 192,019 4.4 3,880,396 89.6 4,332,738
(a) Includes need of assistance not stated.
Source: ABS, Census of Population and Housing, 2011, Basic Community Profile - B18 (usual residence)
Voluntary workVoluntary work undertaken for an organisation or group hasbeen derived from the 2011 Census of Population and Housingquestion ‘In the last twelve months did the person spend anytime doing voluntary work through an organisation or group?’The variable is based on persons aged 15 years and over byplace of usual residence.
The percentage of persons in Mackay Regional Council LGA who undertook voluntary work was
15.9%
Mackay Regional Council LGA• 14,081 persons (or 15.9%) undertook voluntary work
Queensland• 645,543 persons (or 18.7%) undertook voluntary work
Table 23 Voluntary work, Mackay Regional Council LGA and Queensland, 2011
LGA / State Volunteer Not a volunteer Total(a)
number % number % number
Mackay (R) 14,081 15.9 66,491 74.8 88,839Queensland 645,543 18.7 2,521,658 72.9 3,456,877
(a) Includes voluntary work not stated.
Source: ABS, Census of Population and Housing, 2011, Basic Community Profile - B19 (usual residence)

Queensland Regional Profiles: Resident Profile 23
Aged care servicesInformation on aged care services are provided by theCommonwealth Department of Health and Ageing. Informationare based on the location of the service, rather than the regionin which the service is delivered. In some instances, aged careservices may have provided the address information of theirapproved provider in place of the address information of theindividual aged care service. Users should be aware of thislimitation when using these data. Aged care services aresubsidised by the Australian Government under the Aged CareAct 1997. Data are updated annually with an approximate delayof 12 months after the reporting period. It is anticipated the nextupdate will be in March 2015.
The number of aged care service operational places in Mackay Regional Council LGA as at 30 June 2013 was
977 places
Mackay Regional Council LGA• 20 aged care services as at 30 June 2013• 977 aged care service operational places
Queensland• 995 aged care services as at 30 June 2013• 45,865 aged care service operational places
Table 24 Aged care services, Mackay Regional Council LGA and Queensland, 30 June 2013
LGA / StateAgedcare
services
Number of operational places by care typeAustralian funding(a)Community
careResidential aged care
Transition care
Total places
number — number — $m
Mackay (R) 20 269 708 0 977 37.8Queensland 995 11,390 33,742 733 45,865 1,912.3
Refer to explanatory notes for additional information.
(a) Australian government recurrent funding for aged care services in 30 June 2013.
Source: Australian Government Department of Health and Ageing

Queensland Regional Profiles: Resident Profile 24
Emergency services, schools and hospitalsInformation on emergency services, schools and hospitals areprovided by administrative custodian agencies. Data areupdated every two years. It is anticipated the next update will bein July 2015.
As at 30 June 2013, the number of schools in Mackay Regional Council LGA was
57 schools
Mackay Regional Council LGA• 57 schools as at 30 June 2013• 5 hospitals
Queensland• 1,782 schools as at 30 June 2013• 273 hospitals
Table 25 Emergency services, schools and hospitals, Mackay Regional Council LGA and Queensland, 30 June 2013
LGA / State Police stations(a)
Ambulance stations
Fire stations(b) Schools(c) Hospitals(d)
— number —
Mackay (R) 10 6 4 57 5Queensland 336 260 242 1,782 273
(a) Does not include Police Beats.(b) Does not include Rural Fire Brigade.(c) Includes both private and public schools and counts the main campus only.(d) Includes both private and public hospitals. Excludes public dental and psychiatric facilities.
Source: Queensland Police Service; Department of Community Safety; Department of Education, Training and Employment; Queensland Health

Queensland Regional Profiles: Resident Profile 25
The Index of Relative Socio-Economic DisadvantageSocio-Economic Indexes for Areas (SEIFA) is a summarymeasure of the social and economic conditions of geographicareas across Australia. SEIFA comprises a number of indexes,which is generated by ABS from the Census of Population andHousing. In 2011 an Index of Relative Socio-EconomicDisadvantage was produced, ranking geographical areas interms of their relative socio-economic disadvantage. The indexfocuses on low-income earners, relatively lower educationattainment, high unemployment and dwellings without motorvehicles. Low index values represent areas of mostdisadvantage and high values represent areas of leastdisadvantage. This is based on persons by place of usualresidence.
The percentage of persons in Mackay Regional Council LGA in the least disadvantaged quintile was
16.8%
Mackay Regional Council LGA• 16.8% in least disadvantaged quintile• 11.3% in most disadvantaged quintile
Queensland• 20.0% in least disadvantaged quintile• 20.0% in most disadvantaged quintile
Table 26 Population by Index of Relative Socio-Economic Disadvantage quintiles, Mackay Regional Council LGA and Queensland, 2011
LGA / StateQuintile 1
(mostdisadvantaged)
Quintile 2 Quintile 3 Quintile 4Quintile 5
(leastdisadvantaged)
— % —
Mackay (R) 11.3 20.9 28.7 22.3 16.8Queensland 20.0 20.0 20.0 20.0 20.0
Source: ABS 2033.0.55.001, Census of Population and Housing: Socio-Economic Indexes for Areas (SEIFA), Australia - Data only, 2011, (Queensland Treasury derived)
Queensland Regional Profiles: Resident Profile 26
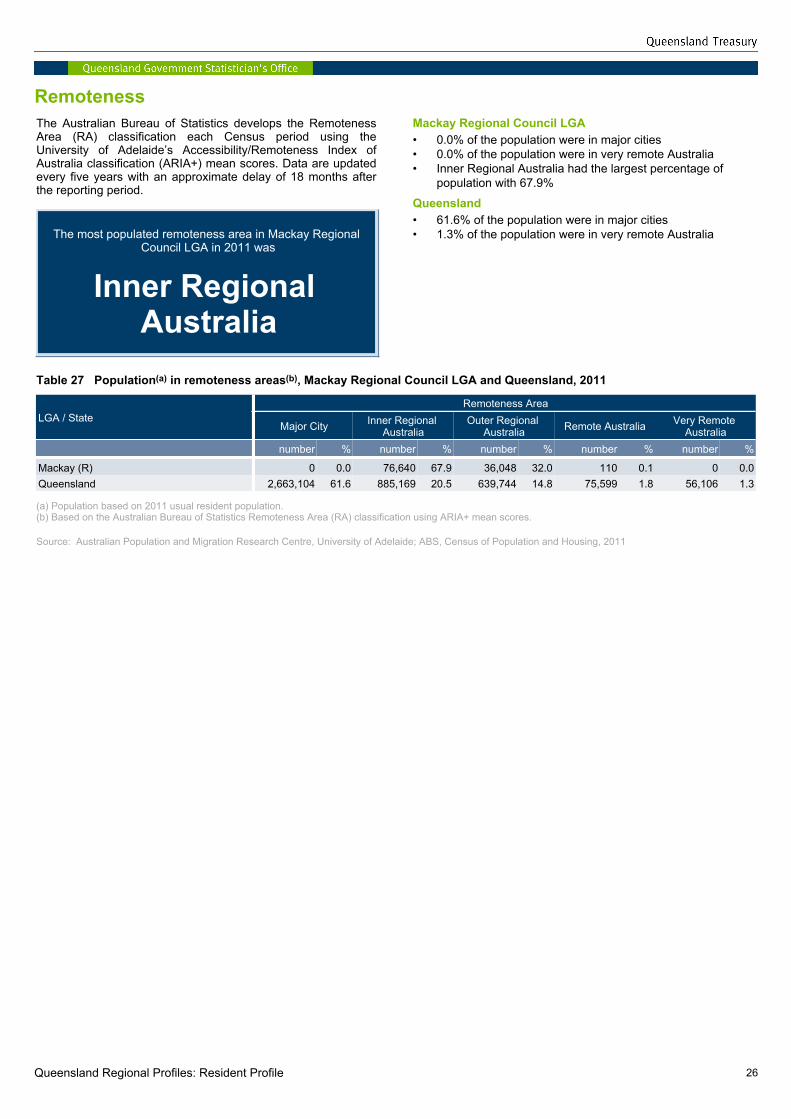
RemotenessThe Australian Bureau of Statistics develops the RemotenessArea (RA) classification each Census period using theUniversity of Adelaide’s Accessibility/Remoteness Index ofAustralia classification (ARIA+) mean scores. Data are updatedevery five years with an approximate delay of 18 months afterthe reporting period.
The most populated remoteness area in Mackay Regional Council LGA in 2011 was
Inner Regional Australia
Mackay Regional Council LGA• 0.0% of the population were in major cities• 0.0% of the population were in very remote Australia• Inner Regional Australia had the largest percentage of
population with 67.9%
Queensland• 61.6% of the population were in major cities• 1.3% of the population were in very remote Australia
Table 27 Population(a) in remoteness areas(b), Mackay Regional Council LGA and Queensland, 2011
LGA / StateRemoteness Area
Major City Inner Regional Australia
Outer Regional Australia Remote Australia Very Remote
Australianumber % number % number % number % number %
Mackay (R) 0 0.0 76,640 67.9 36,048 32.0 110 0.1 0 0.0Queensland 2,663,104 61.6 885,169 20.5 639,744 14.8 75,599 1.8 56,106 1.3
(a) Population based on 2011 usual resident population.(b) Based on the Australian Bureau of Statistics Remoteness Area (RA) classification using ARIA+ mean scores.
Source: Australian Population and Migration Research Centre, University of Adelaide; ABS, Census of Population and Housing, 2011

Queensland Regional Profiles: Resident Profile 27
EconomySelected medians and averagesThese selected medians and averages have been derived byusing data based on the 2011 Census of Population andHousing and may not reflect medians that have been derived byadministrative data and published in other profile topics. Whereapplicable, these estimates are based on place of usualresidence.
The median total personal income for Mackay Regional Council LGA was
$705 per week
Mackay Regional Council LGA• Median mortgage repayment of $2,167 per month• Average household size of 2.7 persons per dwelling
Queensland• Median mortgage repayment of $1,850 per month• Average household size of 2.6 persons per dwelling
Table 28 Selected medians and averages, Mackay Regional Council LGA and Queensland, 2011
LGA / State
Median / Average
Median mortgage repayment
Median totalfamily
income
Median total household
income
Median total personal
income
Average household
size
Average number of
persons per bedroom
$/month $/week $/week $/week persons number
Mackay (R) 2,167 1,821 1,578 705 2.7 1.1Queensland 1,850 1,453 1,235 587 2.6 1.1
Refer to explanatory notes for additional information.
Source: ABS, Census of Population and Housing, 2011, Basic Community Profile - B02
Queensland Regional Profiles: Resident Profile 28
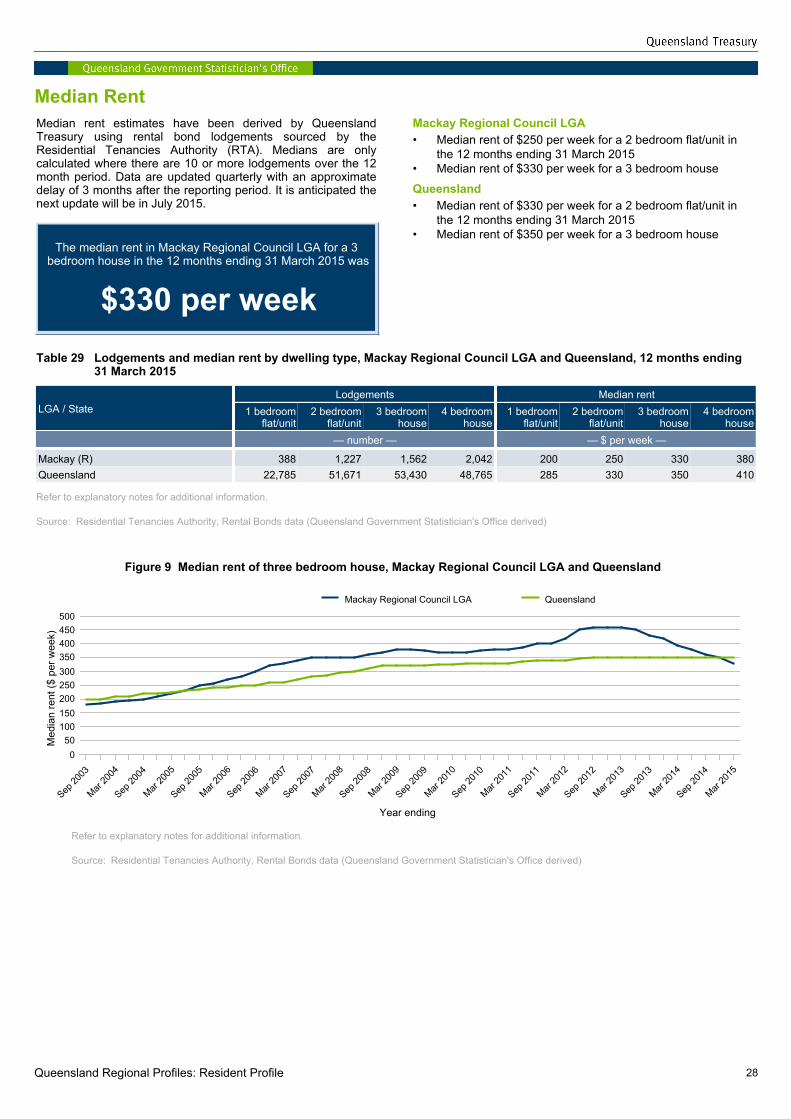
Median RentMedian rent estimates have been derived by QueenslandTreasury using rental bond lodgements sourced by theResidential Tenancies Authority (RTA). Medians are onlycalculated where there are 10 or more lodgements over the 12month period. Data are updated quarterly with an approximatedelay of 3 months after the reporting period. It is anticipated thenext update will be in July 2015.
The median rent in Mackay Regional Council LGA for a 3 bedroom house in the 12 months ending 31 March 2015 was
$330 per week
Mackay Regional Council LGA• Median rent of $250 per week for a 2 bedroom flat/unit in
the 12 months ending 31 March 2015• Median rent of $330 per week for a 3 bedroom house
Queensland• Median rent of $330 per week for a 2 bedroom flat/unit in
the 12 months ending 31 March 2015• Median rent of $350 per week for a 3 bedroom house
Table 29 Lodgements and median rent by dwelling type, Mackay Regional Council LGA and Queensland, 12 months ending 31 March 2015
LGA / StateLodgements Median rent
1 bedroom flat/unit
2 bedroom flat/unit
3 bedroom house
4 bedroom house
1 bedroom flat/unit
2 bedroom flat/unit
3 bedroom house
4 bedroom house
— number — — $ per week —
Mackay (R) 388 1,227 1,562 2,042 200 250 330 380Queensland 22,785 51,671 53,430 48,765 285 330 350 410
Refer to explanatory notes for additional information.
Source: Residential Tenancies Authority, Rental Bonds data (Queensland Government Statistician's Office derived)
Figure 9 Median rent of three bedroom house, Mackay Regional Council LGA and Queensland
Refer to explanatory notes for additional information.
Source: Residential Tenancies Authority, Rental Bonds data (Queensland Government Statistician's Office derived)

Queensland Regional Profiles: Resident Profile 29
Total personal incomeTotal personal income has been derived from the 2011 Censusof Population and Housing question ‘What is the total of allwages/salaries, government benefits, pensions, allowances andother income a person usually receives?’. Median total personalincome estimates have been calculated by the ABS. Thevariable is based on persons aged 15 years and over by placeof usual residence.
The median total personal income in Mackay Regional Council LGA was
$36,660 per year
Mackay Regional Council LGA• Median total personal income of $36,660 per year
Queensland• Median total personal income of $30,524 per year
Table 30 Total personal income, Mackay Regional Council LGA and Queensland, 2011
LGA / State Less than $20,800 per year
$20,800 to $51,999 per year
$52,000 to $103,999 per year
$104,000 or more per year Total(a) Median
($/year)number % number % number % number % number $
Mackay (R) 26,023 29.3 25,387 28.6 20,112 22.6 8,553 9.6 88,840 36,660Queensland 1,195,059 34.6 1,095,509 31.7 689,495 19.9 191,236 5.5 3,456,877 30,524
Refer to explanatory notes for additional information.
(a) Includes personal income not stated.
Source: ABS, Census of Population and Housing, 2011, Basic Community Profile - B02 and B17
Total family incomeTotal family income is the sum of the total personal incomes ofeach family member present in the household on 2011 CensusNight. Family income only applies to classifiable families inoccupied private dwellings. Low-income families have beendefined as families in occupied private dwellings whose familyincome was less than $600 per week or less than $31,200 peryear. Median total family income estimates have beencalculated by the ABS.
The median total family income in Mackay Regional Council LGA was
$94,692 per year
Mackay Regional Council LGA• 2,896 low-income families (9.6%)• Median total family income of $94,692 per year
Queensland• 149,707 low-income families (13.0%)• Median total family income of $75,556 per year
Table 31 Total family income, Mackay Regional Council LGA and Queensland, 2011
LGA / State Less than $31,200 per year
$31,200 to $77,999 per year
$78,000 to $155,999 per year
$156,000 or more per year Total(a) Median
($/year)number % number % number % number % number $
Mackay (R) 2,896 9.6 7,159 23.7 10,304 34.2 4,550 15.1 30,168 94,692Queensland 149,707 13.0 373,050 32.5 363,201 31.6 125,205 10.9 1,148,178 75,556
Refer to explanatory notes for additional information.
(a) Includes partially stated and not stated income responses.
Source: ABS, Census of Population and Housing, 2011, Basic Community Profile - B02 and B26

Queensland Regional Profiles: Resident Profile 30
Unemployment and labour forceEstimates of unemployment and labour force are produced bythe Australian Government Department of Employment. Theestimates are calculated by utilising administrative data such asCentrelink Newstart and Youth Allowance (Other) recipients aswell as ABS labour force estimates.
The unemployment rate in Mackay Regional Council LGA at December quarter 2014 was
5.3%
Mackay Regional Council LGA• 3,784 unemployed persons in December quarter 2014• Unemployment rate of 5.3%
Queensland• 160,271 unemployed persons in December quarter 2014• Unemployment rate of 6.4%
Table 32 Unemployment and labour force(a), Mackay Regional Council LGA and Queensland, December quarter 2014
LGA / State Unemployed Labour force Unemployment rate— number — %
Mackay (R) 3,784 71,895 5.3Queensland 160,271 2,501,392 6.4
Refer to explanatory notes for additional information.
(a) Based on a 4-quarter smoothed series.
Source: Australian Government Department of Employment, Small Area Labour Markets Australia, various editions

Queensland Regional Profiles: Resident Profile 31
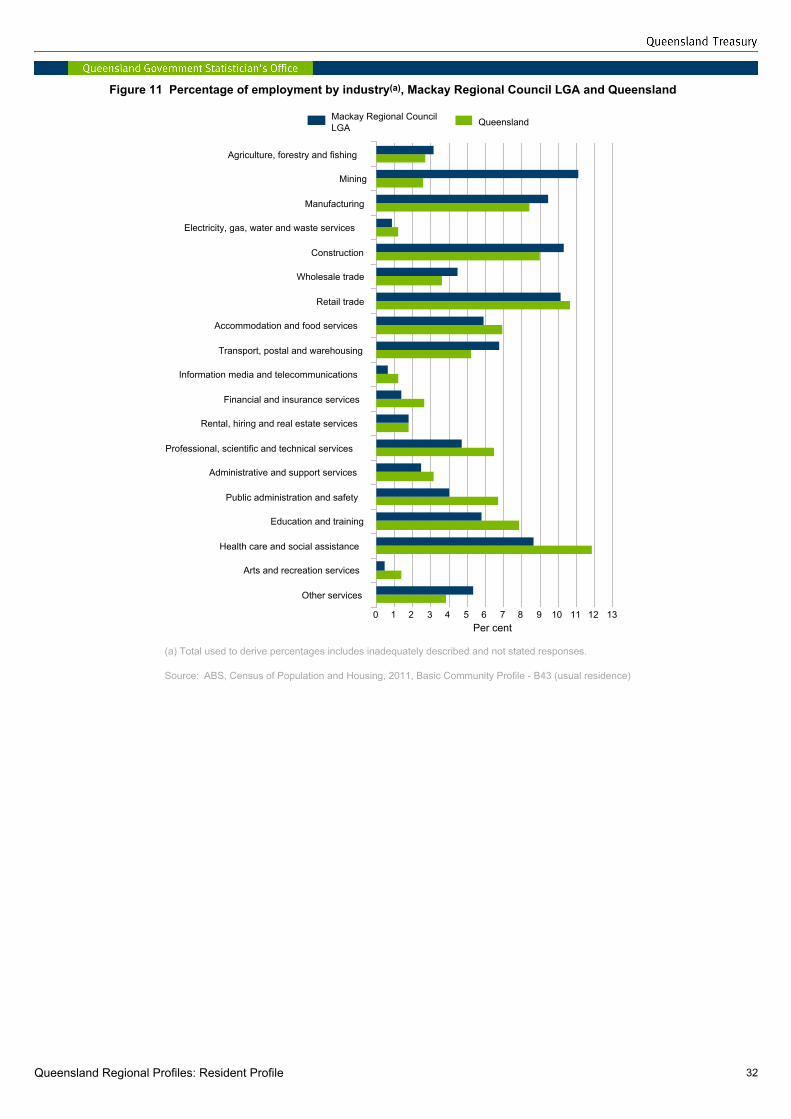
Employment by industryEmployment by industry has been derived from the 2011Census of Population and Housing data. A person's industry ofemployment was classified based on responses to a range ofquestions from the Census and is applicable to persons aged15 years and over who work. This is based on place of usualresidence.
The top five industry subdivisions of employment for Mackay Regional Council LGA were:
1. Coal Mining (8.0%)2. Construction Services (5.7%)3. Other Store-Based Retailing (5.2%)4. Preschool and School Education (4.6%)5. Professional, Scientific and Technical Services
(except Computer System Design and Related Services) (4.5%)
Mackay Regional Council LGA• 11.1% of employed persons worked in Mining industry• 10.3% of employed persons worked in Construction industry• Highest specialisation ratio of 4.28 in Mining industry
Queensland• 11.9% of employed persons worked in Health care and
social assistance industry• 10.7% of employed persons worked in Retail trade industry
Table 33 Employment by industry, Mackay Regional Council LGA and Queensland, 2011
Industry Mackay Regional Council LGA Queensland Specialisation
rationumber % number % number
Agriculture, forestry and fishing 1,832 3.2 55,416 2.7 1.18Mining 6,373 11.1 52,955 2.6 4.28Manufacturing 5,425 9.5 171,669 8.4 1.12Electricity, gas, water and waste services 501 0.9 24,828 1.2 0.72Construction 5,909 10.3 183,780 9.0 1.14Wholesale trade 2,559 4.5 74,288 3.6 1.23Retail trade 5,810 10.1 217,610 10.7 0.95Accommodation and food services 3,388 5.9 141,855 7.0 0.85Transport, postal and warehousing 3,880 6.8 107,072 5.3 1.29Information media and telecommunications 364 0.6 25,358 1.2 0.51Financial and insurance services 790 1.4 54,153 2.7 0.52Rental, hiring and real estate services 1,036 1.8 37,007 1.8 1.00Professional, scientific and technical services 2,691 4.7 132,754 6.5 0.72Administrative and support services 1,422 2.5 65,015 3.2 0.78Public administration and safety 2,309 4.0 136,818 6.7 0.60Education and training 3,315 5.8 160,921 7.9 0.73Health care and social assistance 4,979 8.7 242,559 11.9 0.73Arts and recreation services 283 0.5 28,444 1.4 0.35Other services 3,059 5.3 78,713 3.9 1.38
Total(a) 57,342 100.0 2,039,275 100.0 1.00
Refer to explanatory notes for additional information.
(a) Includes inadequately described and not stated responses.
Source: ABS, Census of Population and Housing, 2011, Basic Community Profile - B43 (usual residence)
Queensland Regional Profiles: Resident Profile 32
Figure 11 Percentage of employment by industry(a), Mackay Regional Council LGA and Queensland
(a) Total used to derive percentages includes inadequately described and not stated responses.
Source: ABS, Census of Population and Housing, 2011, Basic Community Profile - B43 (usual residence)
Queensland Regional Profiles: Resident Profile 33
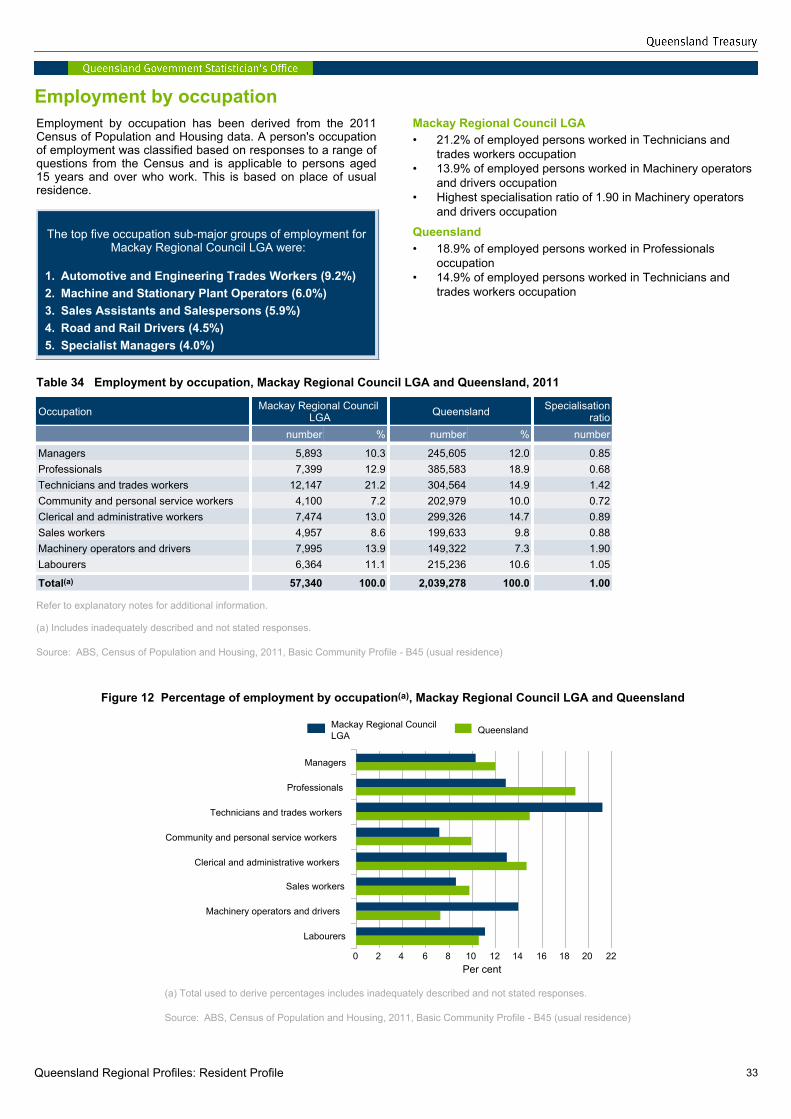
Employment by occupationEmployment by occupation has been derived from the 2011Census of Population and Housing data. A person's occupationof employment was classified based on responses to a range ofquestions from the Census and is applicable to persons aged15 years and over who work. This is based on place of usualresidence.
The top five occupation sub-major groups of employment for Mackay Regional Council LGA were:
1. Automotive and Engineering Trades Workers (9.2%)2. Machine and Stationary Plant Operators (6.0%)3. Sales Assistants and Salespersons (5.9%)4. Road and Rail Drivers (4.5%)5. Specialist Managers (4.0%)
Mackay Regional Council LGA• 21.2% of employed persons worked in Technicians and
trades workers occupation• 13.9% of employed persons worked in Machinery operators
and drivers occupation• Highest specialisation ratio of 1.90 in Machinery operators
and drivers occupation
Queensland• 18.9% of employed persons worked in Professionals
occupation• 14.9% of employed persons worked in Technicians and
trades workers occupation
Table 34 Employment by occupation, Mackay Regional Council LGA and Queensland, 2011
Occupation Mackay Regional Council LGA Queensland Specialisation
rationumber % number % number
Managers 5,893 10.3 245,605 12.0 0.85Professionals 7,399 12.9 385,583 18.9 0.68Technicians and trades workers 12,147 21.2 304,564 14.9 1.42Community and personal service workers 4,100 7.2 202,979 10.0 0.72Clerical and administrative workers 7,474 13.0 299,326 14.7 0.89Sales workers 4,957 8.6 199,633 9.8 0.88Machinery operators and drivers 7,995 13.9 149,322 7.3 1.90Labourers 6,364 11.1 215,236 10.6 1.05
Total(a) 57,340 100.0 2,039,278 100.0 1.00
Refer to explanatory notes for additional information.
(a) Includes inadequately described and not stated responses.
Source: ABS, Census of Population and Housing, 2011, Basic Community Profile - B45 (usual residence)
Figure 12 Percentage of employment by occupation(a), Mackay Regional Council LGA and Queensland
(a) Total used to derive percentages includes inadequately described and not stated responses.
Source: ABS, Census of Population and Housing, 2011, Basic Community Profile - B45 (usual residence)
Queensland Regional Profiles: Resident Profile 34
Families with children with no parent employedFamilies with children with no parent employed have beenderived from the 2011 Census of Population and Housing dataand defined as either one parent families where the parent waseither unemployed or not in the labour force or couple familieswhere both parents were either unemployed or not in the labourforce. This is based on families with children under 15 years ofage.
The percentage of families with children under 15 years of age and no parent employed in Mackay Regional Council
LGA was
8.5%
Mackay Regional Council LGA• 1,069 families with children under 15 years of age and no
parent employed (8.5%)
Queensland• 62,171 families with children under 15 years of age and no
parent employed (13.5%)
Table 35 Families with children with no parent employed, Mackay Regional Council LGA, 2011
LGA / State
One-parent family with parent not employed
Couple family with both
parents not employed
Total families with no parent employed Total families
— number — number % number
Mackay (R) 872 197 1,069 8.5 12,544Queensland 44,970 17,201 62,171 13.5 459,205
Source: ABS, Census of Population and Housing, 2011, unpublished data (families)

Queensland Regional Profiles: Resident Profile 35
Industry and developmentBuilding approvalsInformation on building approvals are compiled by the ABS, andare collected from sources such as local government authoritiesand other principal certifying authorities. The estimates for anymonth may be revised or corrected in later months. This canoccur as a result of corrections made by a provider of data, thelate provision of approval records and, occasionally, byapprovals being identified after construction work hascommenced. Data are updated monthly with an approximatedelay of 3 months after the reporting period. It is anticipated thenext update will be in May 2015.
The number of new houses approved in Mackay Regional Council LGA in the 12 months ending 31 December 2014 was
542 approvals
Mackay Regional Council LGA• 542 approved new houses in the 12 months ending 31
December 2014• $268.0 million of building value in residential building
approvals in the 12 months ending 31 December 2014
Queensland• 21,384 approved new houses in the 12 months ending 31
December 2014• $10,768.6 million of building value in residential building
approvals in the 12 months ending 31 December 2014
Table 36 Residential and non-residential building approvals, Mackay Regional Council LGA and Queensland, 12 months ending 31 December 2014
LGA / State
Residential Building Approvals Building Value
New Houses
New Other
Alterations,additions and
conversionsTotal Residential Non-residential Total
— number — $'000 % $'000 % $'000
Mackay (R) 542 327 1 870 267,996 62.2 162,962 37.8 430,958Queensland 21,384 16,259 166 37,809 10,768,639 64.7 5,873,069 35.3 16,641,709
Source: ABS 8731.0, Building Approvals, Australia, various editions
Figure 13 Number of residential building approvals, Mackay Regional Council LGA and Queensland
Source: ABS 8731.0, Building Approvals, Australia, various editions

Queensland Regional Profiles: Resident Profile 36
Figure 14 Value of residential building approvals, Mackay Regional Council LGA and Queensland
Source: ABS 8731.0, Building Approvals, Australia, various editions
Figure 15 Value of non-residential building approvals, Mackay Regional Council LGA and Queensland
Source: ABS 8731.0, Building Approvals, Australia, various editions

Queensland Regional Profiles: Resident Profile 37
Residential dwelling salesResidential dwelling sales data is sourced from the QueenslandValuation and Sales (QVAS) database as collected andmaintained by the Queensland Department of NaturalResources and Mines. Medians are only calculated where thereare ten or more sales over the time period. All figures arepreliminary and are subject to further revision. Data are updatedquarterly with an approximate delay of 6 months after thereporting period. It is anticipated the next update will be in May2015.
The median sale price in Mackay Regional Council LGA in the 12 months ending 30 September 2014 was
$400,000
Mackay Regional Council LGA• 1,544 residential dwelling sales in the 12 months ending 30
September 2014• Median sale price of $400,000
Queensland• 110,416 residential dwelling sales in the 12 months ending
30 September 2014• Median sale price of $410,000
Table 37 Residential dwelling sales, Mackay Regional Council LGA and Queensland, 12 months ending 30 September 2014
LGA / StateNumber of sales Median sale price
Detached dwellings
Attached dwellings
Totaldwellings
Detached dwellings
Attached dwellings
Totaldwellings
— number — — $ —
Mackay (R) 1,303 241 1,544 410,000 313,063 400,000Queensland 74,811 35,605 110,416 430,000 365,000 410,000
Refer to explanatory notes for additional information.
Source: Department of Natural Resources and Mines, Office of the Valuer-General, Property Sales
Figure 16 Median value of residential dwelling sales, Mackay Regional Council LGA and Queensland
Refer to explanatory notes for additional information.
Source: Department of Natural Resources and Mines, Office of the Valuer-General, Property Sales

Queensland Regional Profiles: Resident Profile 38
New house and vacant land salesNew house and vacant land sales data is sourced from theQueensland Valuation and Sales (QVAS) database as collectedand maintained by the Queensland Department of NaturalResources and Mines. Medians are only calculated where thereare ten or more sales over the time period. All figures arepreliminary and are subject to further revision. Data are updatedquarterly with an approximate delay of 6 months after thereporting period. It is anticipated the next update will be in May2015.
The median new house sale price in Mackay Regional Council LGA in the 12 months ending 30 September 2014
was
$470,000
Mackay Regional Council LGA• 42 new house sales in the 12 months ending 30 September
2014• Median new house sale price of $470,000• 342 vacant land sales• Median vacant land sale price of $209,000
Queensland• 3,125 new house sales in the 12 months ending 30
September 2014• 14,742 vacant land sales• Median new house sale price of $437,500• Median vacant land sale price of $205,000
Table 38 New house and vacant land sales, Mackay Regional Council LGA and Queensland, 12 months ending 30 September 2014
LGA / StateNumber of sales Median sale price
New houses Vacant land New houses Vacant land— number — — $ —
Mackay (R) 42 342 470,000 209,000Queensland 3,125 14,742 437,500 205,000
Refer to explanatory notes for additional information.
Source: Department of Natural Resources and Mines, Office of the Valuer-General, Property Sales

Queensland Regional Profiles: Resident Profile 39
EnvironmentProtected areas – parks and forest estateProtected areas are derived from a spatial dataset sourced fromthe Queensland Department of National Parks, Recreation,Sport and Racing. Whilst a relatively small area of national parkis below mean sea level, data presented in this table are basedon areas located above mean sea level. Areas are based on aGIS calculated spherical area and not the official gazetted area.GIS calculations reference the latitude/longitude projection andare based on the Geocentric Datum of Australia 1994 (GDA 94).Data are updated every two years. It is anticipated the nextupdate will be in June 2015.
The total protected area within Mackay Regional Council LGA as at 2012 was
1,634.1 km2
Mackay Regional Council LGA• Protected area of 1,634.1 km2 as at 2012• Largest protected area estate type of National Parks with
844.9 km2
Queensland• Protected area of 119,835.8 km2 as at 2012• Largest protected area estate type of National Parks with
87,402.6 km2
Table 39 Protected areas - park and forest estate, Mackay Regional Council LGA and Queensland, 2012(a)
LGA / State National Park(b) State Forest Timber
ReserveForest
Reserve Total
— area (km2) —
Mackay (R) 844.9 517.1 0.0 272.1 1,634.1Queensland 87,402.6 29,837.0 662.9 1,933.3 119,835.8
(a) Source data current to 5 December 2012.(b) Includes Conservation Parks and Resource Reserves.
Source: Queensland Department of National Parks, Recreation, Sport and Racing

Queensland Regional Profiles: Resident Profile 40
Abbreviations. .ABSASGSESBLGALHSn.a.NESBprRRHS
not applicableAustralian Bureau of StatisticsAustralian Statistical Geography StandardEnglish-speaking backgroundLocal Government Arealeft-hand sidenot availablenon-English speaking backgroundpreliminaryrevisedRegional Councilright-hand side
Explanatory notesProfile explanatory notes
Australian Statistical Geography Standard (ASGS)A geographical framework covering all spatial areas of Australia and its external territories. The ASGS was developed by the ABS to allow statistics from different collections to be spatially comparable. The ASGS came into effect in July 2011, replacing the Australian Standard Geographical Classification (ASGC). The 2011 edition of the ASGS has been used for the data in this report.
Average annual growth rateIt is calculated as a percentage using the formula below, where Po is the population at the start of the period, Pn is the population at the end of the period and n is the length of the period between Pn and Po in years.
For example, to calculate the average annual rate of population change from 2002 to 2012, n is ten, Po is the population in 2002 and Pn is the population in 2012.
Cell confidentialisationThis profile utilises two types of data confidentialisation. 1. Source data confidentialisation - This refers to datasets that have been confidentialised by the data custodians. For example
census data supplied by the ABS have small cell counts of 1 or 2 confidentialised to 0 or 3 and a small random adjustment made to all data to avoid any risk of releasing identifiable information. Caution should therefore be used when interpreting data where the cell count is small.
2. Concordance confidentialisation - This refers to datasets that have been concorded to a new geography and the resulting cell count is small. No reliance should be placed on these cell counts and as such have been confidentialised. Tables utilising this type of confidentialisation will report the cell as less than a specific value (for example <5).
Census 2011 dataCensus data have 'introduced random error' to ensure no data are released which could risk identifying individuals. As such, cells containing very small counts should be treated with extreme caution.
Census undercountDue to the size and complexity of the Census of Population and Housing, whenever a Census is conducted it is inevitable that some people will be missed and some will be counted more than once. After each Census, the Australian Bureau of Statistics conduct a Post Enumeration Survey to estimate the number of people who should have been counted in the Census and the actual Census counts. It is important to note, that all Census data reported in this profile do not have any adjustments made for Census undercount and readers should keep this in mind when making inferences from the data.

Queensland Regional Profiles: Resident Profile 41
Concordances and concorded dataA concordance, in statistical terms, is a product that allows a user to convert data from one geographical region (under which data have been collected) to a new geographical region. In order to convert data from one geographical boundary to another, each region in the new boundary is assigned percentages of data from the old regions. These percentages in the concordance can be constructed using any number of variables. This profile utilises a population based concordance (estimated resident population) at a specific point in time (2011). This type of concordance is useful when concording demographic based datasets such as labour force and family composition on a usual resident basis with time periods at or around 2011. It does not work as well when concording data on different counting methods (such as counts by place of work), non-population based datasets (such as business counts) or datasets collected at different time periods (such as data collected in 2001). Caution should therefore be used when interpreting non-resident based datasets that have been concorded.
One major assumption that is necessary to make when concording data is that the data (for example unemployed persons) are proportionately distributed across the region the same as total resident population (as total resident population is the variable used to derive the percentage splits). In some cases this assumption will not be entirely correct. In the example of unemployed persons, within the region there may be more concentrated areas with a larger proportion of unemployed persons. This assumption should therefore be considered when interpreting datasets that have been concorded.
Local Government AreaLocal Government Area(s) (LGAs) (2014) are administration boundaries for local service provision. There are 78 LGA regions that cover the state.
QueenslandQueensland figures include the 'Migratory - Offshore - Shipping' and 'No Usual Address' counts.
Region overviewStatistics in the region overview have been derived from administrative geographical boundaries and the Bureau of Meteorology.
RoundingFigures are rounded to nearest whole number. Calculations (such as percentages and rates) are based on pre-rounded figures.
Specialisation ratioThe ratio of the percentage for the Mackay Regional Council LGA to the percentage for Queensland. A specialisation ratio above 1.00 indicates Mackay Regional Council LGA has a larger share for that category than in Queensland. Similarly a specialisation ratio below 1.00 indicates Mackay Regional Council LGA has a smaller share for that category than in Queensland.
Topic explanatory notes
Aged care services
Community care servicesCommunity care services provide home-based care for older people wanting to remain living independently in their own home improving their quality of life and helping them to remain active and connected to their own communities. The figures here includeMainstream Packaged Care places provided by Community Aged Care Package (CACP), Extended Aged Care at Home (EACH), and Extended Aged Care at Home Dementia (EACHD) services, and Flexible Care places provided in a community setting by Multi-Purpose Services (MPS), Innovative Care, Consumer Directed Care (CDC), and National Aboriginal and Torres Strait Islander Aged Care (NATSI) Services.
Residential aged care Residential Aged Care provides a range of supported accommodation services for older people who are unable to continue living independently in their own homes. The figures here include Mainstream Residential Aged Care places provided by Residential Aged Care Services (RACS), and Flexible Care places provided in a Residential setting by Multi-Purpose Services (MPS), and National Aboriginal and Torres Strait Islander Aged Care (NATSI) Services.
Transition care Transition care program provides a package of services to enable older people after a hospital stay to return home rather than prematurely enter residential care. The program also gives older people and their families and carers time to consider long-term care arrangements.

Queensland Regional Profiles: Resident Profile 42
Births and deaths
BirthsBirths data are based on the number of births registered during a calendar year by place of usual residence of the mother. This is different to the number of births which occurred during a calendar year. For further information on the differences between estimates of registered births and births occurring in a time period, refer to ABS website (cat. no. 3301.0).
As a result of changes in the timeliness of registration of births in Queensland, care should be taken when interpreting changes in Queensland births between 2006 and 2010. This lag has reduced in recent years, indicating potential improvements in the timeliness of registration of births in Queensland. The December quarter 2009 also saw the Queensland Registry of Births, Deaths and Marriages devoting significant time and resources to follow-up and finalise birth registrations where there was previously incomplete information. As part of the Retrospective Births Project, 1,780 births were registered, with approximately 40% registered as Aboriginal and Torres Strait Islander births (see paragraph 40 of cat. no. 3301.0 explanatory notes for more information). This project is now complete.
DeathsDeaths data are based on the number of deaths registered during a calendar year by place of usual residence of the deceased. This is different to the number of deaths which occurred during a calendar year. For further information on the differences between estimates of registered deaths and deaths occurring in a time period, refer to ABS website (cat. no. 3302.0).
Country of birthBased on the most common Country of Birth responses (excluding Australia) reported in the 2006 Census.
Employment by industry
Employment by industryBased on Australian and New Zealand Standard Industrial Classification (ANZSIC), 2006 edition.
Industry subdivisionThe industry subdivision refers to the 2-digit industry classification from the Australian and New Zealand Standard Industrial Classification (ANZSIC), 2006 edition.
Employment by occupation
Employment by occupationBased on Australian and New Zealand Standard Classification of Occupations (ANZSCO), 2006 edition (Revision 1).
Occupation sub-major groupThe occupation sub-major group refers to the 2-digit occupation classification from the Australian and New Zealand Standard Classification of Occupations (ANZSCO), 2006 edition (Revision 1).
Median ageMedian estimates have been calculated by the ABS and Queensland Treasury.
Median rentMedians for regions with less than 10 lodgements in the 12 month period have not been reported.Median rents do not include lodgements listed with $0 rent.

Queensland Regional Profiles: Resident Profile 43
Medians and averages
Average household sizeApplicable to number of persons usually resident in occupied private dwellings. It includes partners, children, and co-tenants (in group households) who were temporarily absent on Census Night. A maximum of three temporary absentees can be counted in each household. It excludes 'Visitors only' and 'Other non-classifiable' households.
Average number of persons per bedroomApplicable to occupied private dwellings. It excludes 'Visitors only' and 'Other non-classifiable' households.
Median mortgage repaymentApplicable to occupied private dwellings being purchased and includes dwellings being purchased under a rent/buy scheme. It excludes 'Visitors only' and 'Other non-classifiable' households.
Median total family incomeApplicable to families in family households. It excludes families where at least one member aged 15 years and over did not state an income and families where at least one member aged 15 years and over was temporarily absent on Census Night.
Median total household incomeApplicable to occupied private dwellings. It excludes households where at least one member aged 15 years and over did not state an income and households where at least one member aged 15 years and over was temporarily absent on Census Night. It excludes 'Visitors only' and 'Other non-classifiable' households.
Median total personal incomeApplicable to persons aged 15 years and over.
New house and vacant land salesVacant residential land have been defined as vacant - large housesites, vacant urban land and vacant rural land between 140 sq m and 2,500 sq m within planning zones.New house and land have been defined as a single unit dwelling or dwelling large housesite on a newly registered block. All reporting periods are based on the contract date and not the settlement date.
Non-school qualification by field of studyExcludes persons with a qualification out of the scope of the Australian Standard Classification of Education (ASCED).
Non-school qualification by sex and ageExcludes persons with a qualification out of the scope of the Australian Standard Classification of Education (ASCED).
Population projectionsPopulation projections are based on a medium series.
Proficiency in spoken EnglishBased on the most common Language Spoken at Home responses reported in the 2006 Census for Australia.
Residential dwelling salesMedians are only calculated where there are ten or more sales over the time period.
Attached dwellingsAttached dwellings include multi-unit dwellings (flats), building units or group titles within planning zones.
Detached dwellingsDetached dwellings include single unit dwellings or large house sites.
Residential dwelling salesResidential dwelling sales include both new and established dwellings and all reporting periods are based on the contract date and not the settlement date.
Total family incomeMedian total family income estimates have been calculated by the ABS. Medians are only calculated where there were five or more total families. Median calculation excludes families where at least one member aged 15 years and over did not state an income and families where at least one member aged 15 years and over was temporarily absent on Census Night.
Total personal incomeMedian total personal income estimates have been calculated by the ABS.

Queensland Regional Profiles: Resident Profile 44
Unemployment and labour forceSmall Area Labour Force data have been generated from a Structure Preserving Estimation (SPREE) methodology using ABS and Centrelink data. As such these estimates can exhibit considerable variability and care should be taken when interpreting these values. For further information on these data, refer to the Australian Government Department of Employment website.