queensland water service provider...the third series of key performance indicators provides data on...
TRANSCRIPT

Queensland Water Service ProviderPERFORMANCE REPORT 2017/2018 (FINANCIAL YEAR)


DRINKING WATER QUALITY MANAGEMENT PLAN ANNUAL REPORT | 1
Contents
Summary . . . . . . . . . . . . . . . . . . . . . . . . . . . . . . . . . . . . . . . . . . . . . . . . . . . . . . . . . . 3Purpose of this Performance Report
Overview of Townsville Water’s Operations and Services . . . . . . . . . . . . . 4Water SupplySewerage Services
Explanation of Key Performance Indicator Groups . . . . . . . . . . . . . . . . . . . 5‘1’ series – general‘2’ series – water security‘3’ series – finance‘4’ series – customer
General Series . . . . . . . . . . . . . . . . . . . . . . . . . . . . . . . . . . . . . . . . . . . . . . . . . . . . . 6Potable Water SupplySewage Collection And TreatmentResults For General SeriesResults For Water Security Series
Finance Series . . . . . . . . . . . . . . . . . . . . . . . . . . . . . . . . . . . . . . . . . . . . . . . . . . . . 11Results For Finance Series
Customer Series . . . . . . . . . . . . . . . . . . . . . . . . . . . . . . . . . . . . . . . . . . . . . . . . . . . 13PricingService InterruptionResponse TimesComplaints
Conclusion . . . . . . . . . . . . . . . . . . . . . . . . . . . . . . . . . . . . . . . . . . . . . . . . . . . . . . . . 16

DRINKING WATER QUALITY MANAGEMENT PLAN ANNUAL REPORT | 2

DRINKING WATER QUALITY MANAGEMENT PLAN ANNUAL REPORT | 3
Summary
Townsville Water is committed to consistently providing drinking water and sewerage services that meet customer, legislative and regulatory requirements. Townsville Water monitors its performance and reports annually to the Queensland Department of Natural Resources, Mines and Energy on a number of key performance indicators nominated by the Department.
This Performance Report outlines Townsville Water’s performance during the 2017/2018 financial year in four Key Performance Indicator Groups: General, Water Security, Customers, and Finance.
During the financial year, Townsville Water faced a number of challenges to the provision of its drinking water and sewerage services. Firstly, at the beginning of the 2017/2018 financial year, drought conditions continued in the region with Townsville’s main water source, the Ross River Dam, dropping to below 15% during the year. Drought-breaking rain reached the Ross River Dam in February/March 2018, resulting in the Ross River Dam increasing to approximately 95%.
In order to preserve the water supply, water restrictions remained in place but were eased to Level 2 in March 2018. Restrictions will continue to be in place with until the completion of the Haughton Pipeline Duplication. The imposition of these restrictions led to increased management requirements for the Townsville Drinking Water Scheme to ensure that the quality and supply of water remained in line with health and customer service standards. This included increased monitoring of water age, targeted flushing, managing reservoir levels and managing chlorine residuals. This is the second consecutive year to have restrictions in place all financial year.
Due to the Ross River Dam level falling below 15%, it was also required that Townsville Water utilise the Haughton Pipeline to pump water from the Burdekin Dam during the financial year from 13 November to 28 February to supplement supply.
Townsville Water also experienced ongoing water quality issues for its Paluma township Drinking Water Scheme. The Paluma Water Treatment Plant was completed in April 2018 and the Paluma township boil water advisory was lifted.
PURPOSE OF THIS PERFORMANCE REPORT
As a drinking water and sewerage service provider under the Water Supply (Safety and Reliability) Act 2008, Townsville Water are required to prepare this annual report on its performance against a number of key performance indicators nominated by the Queensland Department of Natural Resources, Mines and Energy.
Townsville Water is committed to transparency and accountability of its performance, and it will publish this Performance Report on Council’s website, to promote free and easy access by Townsville Water’s customers and the community, and to meet legislative requirements.
The Queensland Department of Natural Resources, Mines and Energy will use the information supplied within this Performance Report to compare the performance of water service providers across the State of Queensland.
Douglas Water Treatment Plant

DRINKING WATER QUALITY MANAGEMENT PLAN ANNUAL REPORT | 4
Overview of Townsville Water’s Operations and Services
Townsville Water is a significant business activity of the Townsville City Council, providing water and wastewater services to the Townsville community. It supplies potable water, collects and treats wastewater, and supplies recycled water for irrigation purposes only.
WATER SUPPLY
Townsville Water services a population of approximately 188,000 residents by way of three drinking water schemes - Townsville Drinking Water Scheme, Paluma township Drinking Water Scheme and Giru/ Cungulla Drinking Water Scheme. To deliver its water services, Townsville Water operates and maintains 2 dams, 2 weirs, 4 water treatment plants, 27 water pumping stations, 41 reservoirs (water storage facilities) and over 2,609 km of water distribution mains.
The Townsville Drinking Water Scheme is the predominant scheme, supplying approximately 98% of all water connections in the Townsville region. The major water source for the Townsville Drinking Water Scheme is the Ross River Dam which delivers water to the Douglas Water Treatment Plant. With a maximum capacity of approximately 233,000 megalitres, the Ross River Dam supplies about 85% of Townsville’s water. A smaller dam with a capacity of 11,000 megalitres; Paluma Dam, also services the Townsville Drinking Water Scheme by providing water to Northern Water Treatment Plant for distribution to the northern areas of the Townsville City municipality. During extended drought periods, if the water level in the Ross River Dam is low, supplementary water supply is sourced from the Burdekin Dam via the Haughton Irrigation Channel, Haughton Pipeline and pumping station under an agreement with SunWater.
To supply the Giru/Cungulla Drinking Water Scheme, water is taken from the Haughton River and delivered to a small treatment plant at Giru before distribution to Cungulla residents and sale to the Burdekin Shire Council for Giru residents.
To supply the Paluma township Drinking Water Scheme, water is taken from an unnamed rainforest creek to supply the small Paluma township population. In April the Paluma Water Treatment Plant was completed and the Paluma township boil water advisory was lifted.
Incidentally, Townsville Water supplies a small amount of nonpotable water each year. Other than the Paluma township Drinking Water Scheme, the nonpotable scheme only services a small population. This is either supplied nonpotable water from bulk pipelines before the water reaches a treatment plant, or this receives water that has been through a treatment process where the supply has been classified as a supply of nonpotable water on the basis of chlorine decay in the pipeline. In this case, the water no longer meets the quality requirements to be considered as potable water and is only supplied for purposes other than drinking water.
Townsville Water is committed to providing safe, high quality drinking water and manages its supply of drinking water in accordance with the Australian Drinking Water Guidelines and its approved Drinking Water Quality Management Plan.
SEWERAGE SERVICES
Townsville Water collects and treats wastewater from across the Townsville Region, servicing a population of approximately 175,000. Sewage is collected and transported via approximately 1,349 kilometres of sewer main and over 180 sewage pumping stations to 6 wastewater treatment plants on the mainland and Magnetic Island for treatment.
At most wastewater treatment plants, Townsville Water undertakes additional treatment processes to produce recycled water, which is used for irrigation purposes either onsite at wastewater treatment plants or for use as irrigation for open space areas or sporting fields.
Townsville Water has Quality and Environmental Management Systems in place to ensure public health and safety, environmental sustainability, and compliance with legislative and regulatory requirements. Townsville Water holds Environmental Licences for each of its sewage treatment plants and other aspects of its sewage collection system.

DRINKING WATER QUALITY MANAGEMENT PLAN ANNUAL REPORT | 5
Explanation of Key Performance Indicator Groups
‘1’ SERIES – GENERAL
The first series of Key Performance Indicators collect data on general service delivery in Queensland, including information on infrastructure for providing water or sewerage services, volumes of water sourced per reporting period by service providers, numbers of properties serviced, and volumes of water supplied to properties.
‘2’ SERIES – WATER SECURITY
The second series of Key Performance Indicators collects data on water security and how service providers ensure short and long term water supply to customers. Given the climatic variability in Queensland, service providers must commit to long-term planning to ensure the ongoing continuity of their supplies to customers. These Key Performance Indicators provide valuable information regarding water demand, water restrictions and water security, both now and into the future.
‘3’ SERIES – FINANCE
The third series of Key Performance Indicators provides data on service provider financial sustainability for water and sewerage services.
‘4’ SERIES – CUSTOMER
The fourth series of Key Performance Indicators provides data on water and sewerage charging and customer standards, including indicators relating to billing, mains breaks, incident response times, interruptions and customer complaints.
Ross River Dam
DRINKING WATER QUALITY MANAGEMENT PLAN ANNUAL REPORT | 6
General Series
KEY FINDINGS
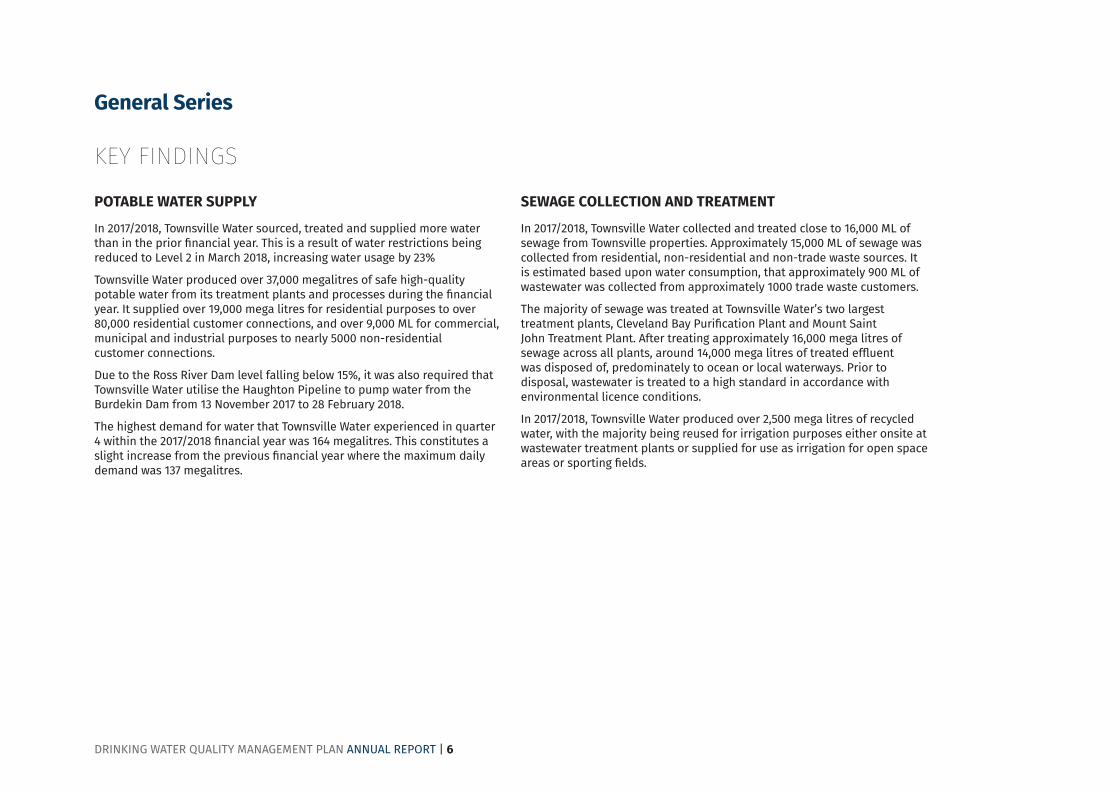
POTABLE WATER SUPPLY
In 2017/2018, Townsville Water sourced, treated and supplied more water than in the prior financial year. This is a result of water restrictions being reduced to Level 2 in March 2018, increasing water usage by 23%
Townsville Water produced over 37,000 megalitres of safe high-quality potable water from its treatment plants and processes during the financial year. It supplied over 19,000 mega litres for residential purposes to over 80,000 residential customer connections, and over 9,000 ML for commercial, municipal and industrial purposes to nearly 5000 non-residential customer connections.
Due to the Ross River Dam level falling below 15%, it was also required that Townsville Water utilise the Haughton Pipeline to pump water from the Burdekin Dam from 13 November 2017 to 28 February 2018.
The highest demand for water that Townsville Water experienced in quarter 4 within the 2017/2018 financial year was 164 megalitres. This constitutes a slight increase from the previous financial year where the maximum daily demand was 137 megalitres.
SEWAGE COLLECTION AND TREATMENT
In 2017/2018, Townsville Water collected and treated close to 16,000 ML of sewage from Townsville properties. Approximately 15,000 ML of sewage was collected from residential, non-residential and non-trade waste sources. It is estimated based upon water consumption, that approximately 900 ML of wastewater was collected from approximately 1000 trade waste customers.
The majority of sewage was treated at Townsville Water’s two largest treatment plants, Cleveland Bay Purification Plant and Mount Saint John Treatment Plant. After treating approximately 16,000 mega litres of sewage across all plants, around 14,000 mega litres of treated effluent was disposed of, predominately to ocean or local waterways. Prior to disposal, wastewater is treated to a high standard in accordance with environmental licence conditions.
In 2017/2018, Townsville Water produced over 2,500 mega litres of recycled water, with the majority being reused for irrigation purposes either onsite at wastewater treatment plants or supplied for use as irrigation for open space areas or sporting fields.

DRINKING WATER QUALITY MANAGEMENT PLAN ANNUAL REPORT | 7
RESULTS FOR GENERAL SERIES
SWIM CODE KPI CODE INDICATOR TITLE TOWNSVILLE
POTABLETOWNSVILLE NON POTABLE
CLEVELAND BAY REUSE
CONDON REUSE
HORSESHOE BAY REUSE
MAGNETIC ISLAND REUSE
MOUNT ST JOHN REUSE
TOWNSVILLE SEWERAGE
TOWNSVILLE WSP-WIDE COMMENTS
AS2 QG 1 .1 Length water mains 2,609 km 4 km 4 km 3 km 3 km 1 km 5 km 2,629 km
AS5 QG 1 .2 Length sewerage mains and channels
1,349 km 1,349 km
AS4 QG 1 .3 Number sewage treatment plants
6 sewage treatment plants
6 sewage treatment plants
AS1 QG 1 .4a Number water treatment plants: providing full treatment
4 water treatment plants
4 water treatment plants
The Paluma township Water Treatment Plant was completed in April 2018.
AS47 QG 1 .4b Capacity of water treatment plants
275 ML per day
275 ML per day
WA201 QG 1 .5 Maximum daily demand 164 ML 164 ML
WA74 QG 1 .6 Volume potable water produced/supplied into water supply system
37,536 ML 37,536 ML An anomaly has been identified with the amount of treated water that is recorded by meter as having left the Douglas Water Treatment Plant (such volume is captured in this indicator), as it is higher than the amount of water taken from surface water. A project to install additional meters at Douglas began in 17/18 financial year and will be completed during the 18/19 year in order to rectify the issue.
AS48 QG 1 .7 Total drinking water storage volume
263 ML 263 ML The result for total drinking water storage volume includes all bulk water storage tanks, including those at the Douglas, Northern and Giru Water Treatment Plants.
WA1 QG 1 .8 Volume water sourced: surface water
45,860 ML 111 ML 45,971 ML In total for all schemes, 33,058 ML was extracted from the Ross River Dam intake. 12,913 ML was extracted from the Burdekin Dam and pumped into the back of the Ross River Dam. Townsville Water purchases raw water from the Burdekin Dam under an agreement with SunWater and pumps the water via the Haughton Pipeline where it is received into the back of the Ross River Dam.
WA2 QG 1 .9a Volume water sourced: groundwater
No groundwater sourced
No groundwater sourced
No groundwater sourced
There are no current or future plans for Townsville Water to source water for supply purposes from groundwater.
WA45 QG 1 .9b Volume water sourced: imported
12,913 ML 12,913 ML The water is taken from the Ross River Dam to feed into our potable water scheme. It is unknown what percentage of this imported water is actually used in ‘supply’ to urban customers.

DRINKING WATER QUALITY MANAGEMENT PLAN ANNUAL REPORT | 8
SWIM CODE KPI CODE INDICATOR TITLE TOWNSVILLE
POTABLETOWNSVILLE NON POTABLE
CLEVELAND BAY REUSE
CONDON REUSE
HORSESHOE BAY REUSE
MAGNETIC ISLAND REUSE
MOUNT ST JOHN REUSE
TOWNSVILLE SEWERAGE
TOWNSVILLE WSP-WIDE COMMENTS
WA61 QG 1.10 Volume water sourced: desalination marine water
No marine water sourced
No marine water sourced
No marine water sourced
There are no current or future plans for Townsville Water to source water for supply purposes from desalination of marine water.
WA26 QG 1.11 Volume recycled sewage supplied: all
0.0 510.0 35.0 112.0 626.0 1,283 ML
WA7 QG 1.12 Volume water sourced 45,971 ML 111 ML 510 ML 35 ML 112 ML 626 ML 47,365 ML
CS2 QG 1.13 Connected residential properties: water
80,642 connections
92 connections 80,734 connections
Townsville Water does not supply any recycled water to residential customers.
CS3 QG 1.14 Connected non-residential properties: water
4,903 connections
0 1 1 2 0 4,907 connections
CS6 QG 1.15 Connected residential properties: sewerage
70,548 connections
70,548 connections
CS7 QG 1 .16 Connected non-residential properties: sewerage
3,554 connections
3,554 connections
WA32 QG 1 .17a
Volume of potable water supplied - residential
19,494 ML 19,494 ML
WA91 QG 1 .17b
Volume of non-potable water supplied - residential
15 ML None supplied None supplied
None supplied
None supplied
None supplied
None supplied
15 ML
WA34 QG 1 .18a
Volume of potable water supplied - commercial, municipal and industrial
9,052 ML 9,052 ML
WA92 QG 1 .18b
Volume of non-potable water supplied - commercial, municipal and industrial
0 ML 0 ML Townsville Water does not supply non-potable water to non-residential customers.
WA36 QG 1 .19 Volume of non-revenue water
8,990 ML 8,990 ML
WF1 QG 1 .20 Total Full-Time Equivalent water and sewerage services employees
283 full time equivalent employees

DRINKING WATER QUALITY MANAGEMENT PLAN ANNUAL REPORT | 9
Water Security Series
KEY FINDINGSProviding water security to Townsville is a priority of Townsville City Council. The level of Townsville’s main water source, the Ross River Dam, started drastically low during at the beginning of the year as a result of ongoing drought conditions, which was eased by significant rainfall in February/March. Townsville Water utilises water restrictions in times of drought to reduce the daily consumption within the community, this ensures that the Townsville community can be sustained by the supply of water from the Burdekin Dam.
Since July 2015, the Townsville service area has been on water restrictions, in order to reduce water consumption and preserve the water supply. These restrictions increased to level 3 in August 2016, following the Ross Dam level falling below 20%. When significant rainfall fell during February/March 2018 water restrictions were eased back to level 2, allowing residents more freedom in using water. Restrictions remained in place ensuring sustainable supply in the Ross River Dam until the Haughton Pipeline Duplication project is completed.
Due to the Ross River Dam level falling below 15%, Townsville Water utilised the Haughton Pipeline to pump water from the Burdekin Dam from 13 November 2017 to 28 February 2018.
Townsville Water is committed to managing its water supply infrastructure on a long term basis, to ensure a secure water supply for the community into the future. Townsville Water is currently in the process of building the recommended additional 1,800mm diameter steel pipeline with additional pumps from the Haughton Pump Station to the Ross River Dam, and to increase the capacity of the existing SunWater pump station and gravity channel from Clare to the Haughton Pump Station by 234ML/day. Construction work on the Haughton Pipeline Duplication project is estimated to be completed in March 2020.
Mount St John Sewage Treatment Plant

DRINKING WATER QUALITY MANAGEMENT PLAN ANNUAL REPORT | 10
RESULTS FOR WATER SECURITY SERIES
SWIM CODE KPI CODE INDICATOR TITLE TOWNSVILLE
POTABLETOWNSVILLE NON POTABLE
TOWNSVILLE WSP-WIDE COMMENTS
WS1 QG 2 .1 Months of supply remaining at end of reporting period (30 June)
18 months’ supply remaining
Data not available
18 months’ supply remaining
The main metropolitan scheme sources its water from the Ross Dam and the Paluma Dam. Based upon the level of the Ross and Paluma Dams at 30 June 2017, 18 months water supply remains. This does not take into account rainfall (expected or otherwise) or Townsville Water’s allocation of High Priority and Medium Priority water from the Burdekin/Haughton under agreement with SunWater. The supply for the Cungulla township is taken from the Haughton River which is expected to provide sufficient supply indefinitely. The supply for Paluma township is taken from the Paluma Weir which is a wet tropics area, and rainfall is expected to replenish supplies
WS2 QG 2 .2 Anticipated water availability to meet demand for next year
Townsville Water can meet anticipated demand for 2018-2019
Data not available
Townsville Water can meet anticipated demand for 2018-2019
If there is inadequate rainfall, Townsville Water will pump water from the Burdekin/Haughton under their allocation agreement with Sunwater, with access to High Priority and Medium Priority water. The supply for the Cungulla township is taken from the Haughton River which is expected to provide sufficient supply indefinitely. The supply for Paluma township should be replenished from rainfall as this is a wet tropics area. There are plans for water to be trucked in to supply the Paluma township, in the event of insufficient supply from the Paluma Weir.
WS3 QG 2 .3 Available contingency supplies
Yes, contingency supplies are available
Data not available
Yes, contingency supplies are available
Contingency plan is outlined in WS2.
WS4 QG 2 .4 Total anticipated water demand for next reporting year
49,275 ML Data not available
49,275 ML
WS5 QG 2 .5 Total anticipated annual water demand in five years’ time
65,161 ML Data not available
65,161 ML
WS6 QG 2 .6 Anticipated capacity to meet demand in 5 years’ time
Townsville Water can meet anticipated demand in 5 years
Townsville Water can meet anticipated demand in 5 years
Townsville Water can meet anticipated demand in 5 years
WS7 QG 2 .7 Planned supply system response
Response not required
Response not required
Response not required
Response not required as Townsville Water can meet anticipated demand in 5 years.
WS9 QG 2 .9 Water restrictions (severity)
17% reduction in water consumption as a result of restrictions
Data not available
17% reduction in water consumption as a result of restrictions
The most severe restriction implemented in 17/18 was level 3 restrictions which were implemented in August 2016 for the Townsville Metropolitan Scheme. Restrictions were eased back to level 2 in March 2018 and these continued through the remainder of the 17/18 financial year. The Paluma and Cungulla schemes have remained on level 1 water restrictions. On average, Townsville Water produced 17% less water under level 3 water restrictions when compared with a comparable time 2 years earlier when Townsville Supply Scheme was under level 1 water restrictions.
DRINKING WATER QUALITY MANAGEMENT PLAN ANNUAL REPORT | 11
Finance Series
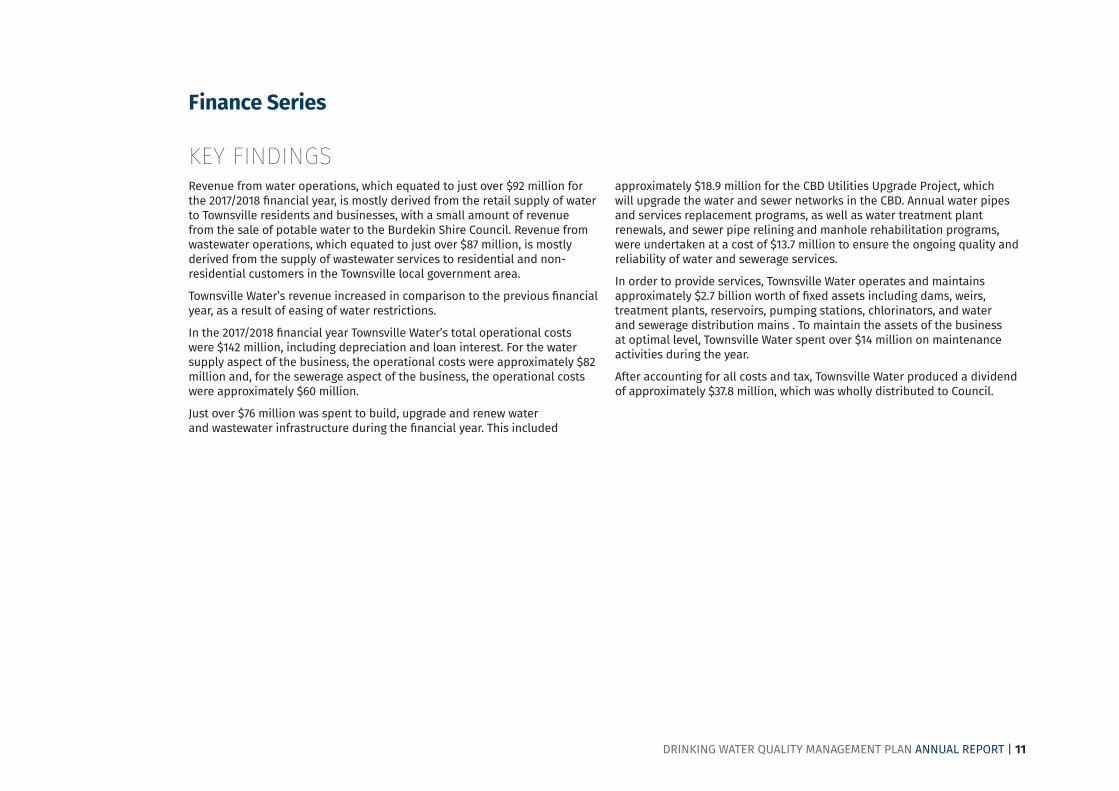
KEY FINDINGSRevenue from water operations, which equated to just over $92 million for the 2017/2018 financial year, is mostly derived from the retail supply of water to Townsville residents and businesses, with a small amount of revenue from the sale of potable water to the Burdekin Shire Council. Revenue from wastewater operations, which equated to just over $87 million, is mostly derived from the supply of wastewater services to residential and non-residential customers in the Townsville local government area.
Townsville Water’s revenue increased in comparison to the previous financial year, as a result of easing of water restrictions.
In the 2017/2018 financial year Townsville Water’s total operational costs were $142 million, including depreciation and loan interest. For the water supply aspect of the business, the operational costs were approximately $82 million and, for the sewerage aspect of the business, the operational costs were approximately $60 million.
Just over $76 million was spent to build, upgrade and renew water and wastewater infrastructure during the financial year. This included
approximately $18.9 million for the CBD Utilities Upgrade Project, which will upgrade the water and sewer networks in the CBD. Annual water pipes and services replacement programs, as well as water treatment plant renewals, and sewer pipe relining and manhole rehabilitation programs, were undertaken at a cost of $13.7 million to ensure the ongoing quality and reliability of water and sewerage services.
In order to provide services, Townsville Water operates and maintains approximately $2.7 billion worth of fixed assets including dams, weirs, treatment plants, reservoirs, pumping stations, chlorinators, and water and sewerage distribution mains . To maintain the assets of the business at optimal level, Townsville Water spent over $14 million on maintenance activities during the year.
After accounting for all costs and tax, Townsville Water produced a dividend of approximately $37.8 million, which was wholly distributed to Council.

DRINKING WATER QUALITY MANAGEMENT PLAN ANNUAL REPORT | 12
RESULTS FOR FINANCE SERIES
SWIM CODE KPI CODE INDICATOR TITLE TOWNSVILLE WSP-WIDE
FN14 QG 3 .1 Total water supply capital expenditure $33,477,000
FN15 QG 3 .2 Total sewerage capital expenditure $45,116,000
FN26 QG 3 .3 Capital works grants - water $0
FN27 QG 3 .4 Capital works grants - sewerage $0
FN9 QG 3 .5 Nominal written-down replacement cost of fixed water supply assets $909,034,000
FN10 QG 3 .6 Nominal written-down replacement costs of fixed sewerage assets $594,584,000
FN74 QG 3 .7 Current replacement costs of fixed water supply assets $1,696,619,000
FN75 QG 3 .8 Current replacement costs of fixed sewerage assets $1,025,054,000
FN1 QG 3 .9 Total revenue - water $92,368,000
FN2 QG 3 .10 Total revenue - sewerage $87,516,000
FN11 QG 3 .11 Operating cost - water $554 per connection
FN12 QG 3 .12 Operating cost - sewerage $448 per connection
FN76 QG 3 .13 Annual maintenance costs water $7,444,000
FN77 QG 3 .14 Annual maintenance costs sewerage $7,333,000
FN78 QG 3 .15 Current cost depreciation - water $23,544,000
FN79 QG 3 .16 Current cost depreciation - sewerage $15,513,000
FN80 QG 3 .17 Previous 5 year average annual renewals expenditure - water $15,538,000
FN81 QG 3 .18 Previous 5 year average annual renewals expenditure - sewerage $9,409,000
FN82 QG 3 .19 Forecast 5 year average annual renewals expenditure - water $17,885,000
FN83 QG 3 .20 Forecast 5 year average annual renewals expenditure - sewerage $9,974,000

DRINKING WATER QUALITY MANAGEMENT PLAN ANNUAL REPORT | 13
Customer Series
KEY FINDINGS
PRICING
The price of utility and other charges of Townsville Water are set annually by Council. Townsville Water utilises a Full Cost Pricing Model which provides guidance on the prices that Townsville Water should charge for its products and services in order to cover its capital and operational costs as well as a return on its investments which is delivered back to the Council.
For its residential water services, Townsville Water offers a choice between two options for water billing: the Standard Plan water billing option, and the Water Watchers water billing option. The Standard Plan billing option allows for the use of an allocation of water for a fixed charge, with an excess water charge applied for every kilolitre of water that is used over and above the allocation amount. With the Water Watchers option, a fixed service connection fee applies and, in addition to the service connection fee, customers pay for their actual water usage per kilolitre of water used.
In 2017/2018, the majority of customers in Townsville chose the Standard Plan water billing option. The residential bill for water under the Standard Plan is $755 per year, which includes a water allocation of 772kL.
For its residential sewerage services, Townsville Water charges a fixed charge per year for each dwelling, home unit, flat or vacant lot. During the 2017/2018 financial year, the fixed charge was $775 per year.
SERVICE INTERRUPTION
Townsville Water owns and maintains over 2600kms of water distribution mains in order to supply water to the Townsville community. Mains breaks can be experienced due to aging infrastructure, expanding and shrinking of soils, water pressure, or damage. During the 2017/2018 financial year, Townsville Water experienced a decrease in water mains breaks per 100km of mains, at 18 breaks per 100km of mains. This decrease can largely be attributed to the continuation of upgrading our assets, easing of water restrictions and rain that has occurred.
Townsville Water must interrupt water services at short notice at times in order to carry out work on its mains. This means that customers may experience a loss of water supply on occasion. In 2017/2018, there were approximately 1,986 properties affected by unplanned interruptions to the water supply during the year. This equates to around 23 properties experiencing interruptions to supply for every 1,000 properties.
Townsville owns and maintains over 1300kms of sewer mains in order to collect and transport sewage to treatment plants for treatment. During the 2017/2018 financial year, there were 2.8 breaks and chokes per 100 km of sewer main, with only 38 breaks and chokes in total.
RESPONSE TIMES
Townsville Water has committed to responding to water and sewerage incidents, including water leaks, breaks and chokes, within four hours of advice of the incident being reported. This represents the time that it takes staff of Townsville Water to attend on site to assess, or begin working on the issue, but may not include the time that it takes to actually restore the service or fix the issue. For water incidents, 89% of incidents during 2017/2018 were responded to within the targeted four hour time frame. For sewerage incidents, 86% of incidents during 2016/2018 were responded to within the targeted four hour time frame.
COMPLAINTS
Townsville Water did not receive any formal complaints about water quality during the financial year.
There were 42 formal complaints made in relation to water service and reliability, sewerage service and reliability, water restrictions, pricing, billing and accounts, and behaviour of staff. This equates to less than 0.5 complaints per 1,000 properties receiving water services.
DRINKING WATER QUALITY MANAGEMENT PLAN ANNUAL REPORT | 14
SWIM CODE KPI CODE INDICATOR TITLE TOWNSVILLE
POTABLETOWNSVILLE NON POTABLE
CLEVELAND BAY REUSE
CONDON REUSE
HORSESHOE BAY REUSE
MAGNETIC ISLAND REUSE
MOUNT ST JOHN REUSE
TOWNSVILLE SEWERAGE
TOWNSVILLE WSP-WIDE COMMENTS
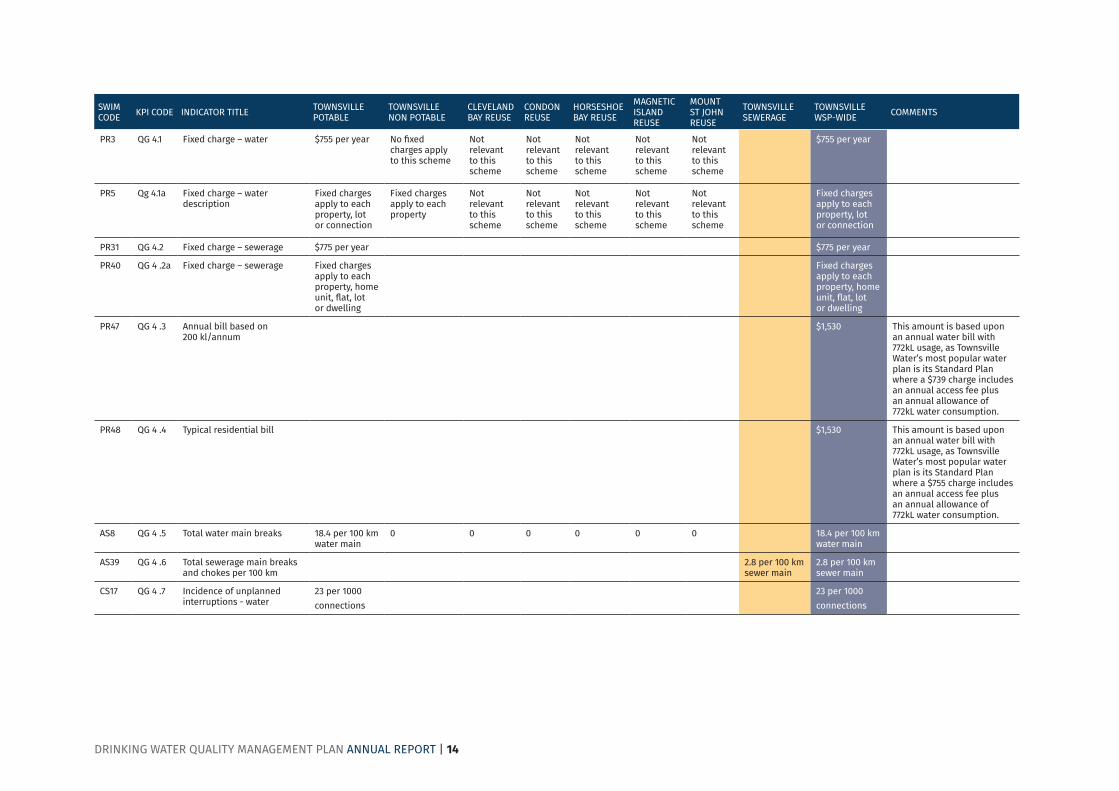
PR3 QG 4.1 Fixed charge – water $755 per year No fixed charges apply to this scheme
Not relevant to this scheme
Not relevant to this scheme
Not relevant to this scheme
Not relevant to this scheme
Not relevant to this scheme
$755 per year
PR5 Qg 4.1a Fixed charge – water description
Fixed charges apply to each property, lot or connection
Fixed charges apply to each property
Not relevant to this scheme
Not relevant to this scheme
Not relevant to this scheme
Not relevant to this scheme
Not relevant to this scheme
Fixed charges apply to each property, lot or connection
PR31 QG 4.2 Fixed charge – sewerage $775 per year $775 per year
PR40 QG 4 .2a Fixed charge – sewerage Fixed charges apply to each property, home unit, flat, lot or dwelling
Fixed charges apply to each property, home unit, flat, lot or dwelling
PR47 QG 4 .3 Annual bill based on 200 kl/annum
$1,530 This amount is based upon an annual water bill with 772kL usage, as Townsville Water’s most popular water plan is its Standard Plan where a $739 charge includes an annual access fee plus an annual allowance of 772kL water consumption.
PR48 QG 4 .4 Typical residential bill $1,530 This amount is based upon an annual water bill with 772kL usage, as Townsville Water’s most popular water plan is its Standard Plan where a $755 charge includes an annual access fee plus an annual allowance of 772kL water consumption.
AS8 QG 4 .5 Total water main breaks 18.4 per 100 km water main
0 0 0 0 0 0 18.4 per 100 km water main
AS39 QG 4 .6 Total sewerage main breaks and chokes per 100 km
2.8 per 100 km sewer main
2.8 per 100 km sewer main
CS17 QG 4 .7 Incidence of unplanned interruptions - water
23 per 1000connections
23 per 1000connections
DRINKING WATER QUALITY MANAGEMENT PLAN ANNUAL REPORT | 15
SWIM CODE KPI CODE INDICATOR TITLE TOWNSVILLE
POTABLETOWNSVILLE NON POTABLE
CLEVELAND BAY REUSE
CONDON REUSE
HORSESHOE BAY REUSE
MAGNETIC ISLAND REUSE
MOUNT ST JOHN REUSE
TOWNSVILLE SEWERAGE
TOWNSVILLE WSP-WIDE COMMENTS
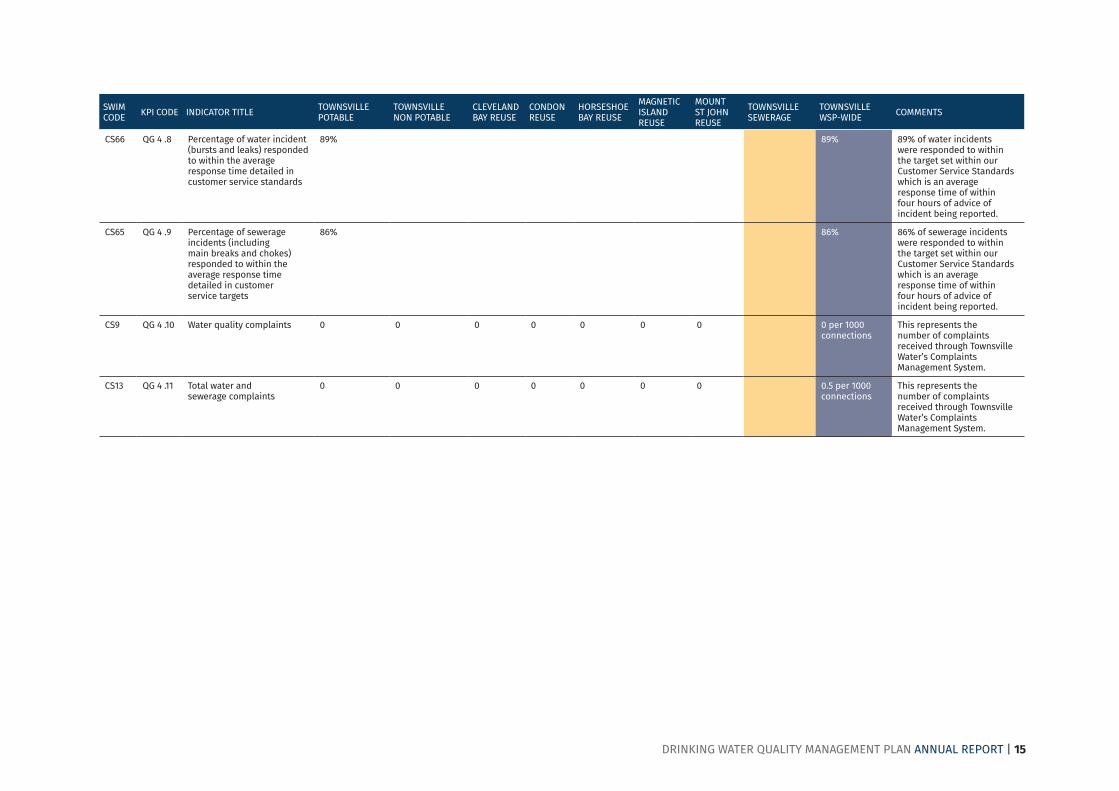
CS66 QG 4 .8 Percentage of water incident (bursts and leaks) responded to within the average response time detailed in customer service standards
89% 89% 89% of water incidents were responded to within the target set within our Customer Service Standards which is an average response time of within four hours of advice of incident being reported.
CS65 QG 4 .9 Percentage of sewerage incidents (including main breaks and chokes) responded to within the average response time detailed in customer service targets
86% 86% 86% of sewerage incidents were responded to within the target set within our Customer Service Standards which is an average response time of within four hours of advice of incident being reported.
CS9 QG 4 .10 Water quality complaints 0 0 0 0 0 0 0 0 per 1000 connections
This represents the number of complaints received through Townsville Water’s Complaints Management System.
CS13 QG 4 .11 Total water and sewerage complaints
0 0 0 0 0 0 0 0.5 per 1000 connections
This represents the number of complaints received through Townsville Water’s Complaints Management System.

DRINKING WATER QUALITY MANAGEMENT PLAN ANNUAL REPORT | 16
Conclusion
Townsville Water’s main challenge to performance during the 2017/2018 financial year continued to centre on water security and the completion of the Haughton Pipeline Duplication.
Restrictions were in place for the entirety of the year in order to preserve the water supply. Pumping was required from 13 November 2017 to 28 February 2018 and restrictions were eased from level 3 to level 2 following the Ross River Dam filling up to approximately 95% in March 2018. The restrictions reduced water consumption within the city, impacting on the revenue of the business. Water restrictions will continue in place during 2018/2019, until such time as the Haughton pipeline is constructed, which should occur in 2019.
It is likely that Townsville Water will continue to require contingency supplies of water from the Burdekin Dam during the 2018/2019 financial year, with the likelihood of level 3 water restrictions being put back in place if no more rain continues to fall.

DRINKING WATER QUALITY MANAGEMENT PLAN ANNUAL REPORT | 17
DRINKING WATER QUALITY MANAGEMENT PLAN ANNUAL REPORT | 18