queenstown: socio-economic profile and … · profile, the levels of ... the essence of the...
TRANSCRIPT

QUEENSTOWN: SOCIO-ECONOMIC
PROFILE AND LED STRATEGY
DRAFT REPORT SUBMITTED TO ECSECC
FEBRUARY 1999
1. INTRODUCTION
1
The broad aim of this study is to gather strategic data on Queenstown which can be
used to feed into development planning processes and inform strategic LED
interventions such as demo projects.
The study was informed by five specific objectives:
to provide a historical overview of development planning in Queenstown, with
particular reference to the effects of apartheid planning;
to provide a demographic profile of the Queenstown population focusing
particularly on population size, racial profile, the gender composition, the age
profile, the levels of education as well as household income;
to provide an overview of the salient features of the Queenstown economy, in
terms of employment patterns and labour market features, its human and natural
resource endowment, and its economic infrastructure;
to look at Queenstown’s physical infrastructure, including water and sewerage,
electrification, roads etc, and social infrastructure such as housing, schools, health
care facilities, and other community facilities;
to assess the network of development stakeholders, especially the TLC,
government and others;
to design an appropriate institutional framework for LED in Queenstown, and
propose concrete strategies and recommendations on the way forward.
Research methods used consisted of documentary research and interviews.
Documentary research was the primary means of attaining demographic data on
Queenstown, with use being made of the 1997 Draft structure Plan, the Palmer
Development Group’s/DBSA’s Municipal Infrastructure Investment Guidelines for
Queenstown (1998); the 1995 CSS’s October Household Survey, and the DBSA’s
1995 Statistical Macroeconomic Overview. Use was also made of a number of
government and NGO planning and strategic documents, which addressed either the
theme of LED generally or Queenstown more specifically.
In-depth interviews and focus group discussions were also held with various role-
players and stakeholders in Queenstown, including the TLC, political parties, the
SBDF, entrepreneurs from numerous SMMEs, hawkers and informal traders, formal
businesses, consultants, and government representatives (especially from the Northern
Region Department of Economic Affairs, Environment and Tourism).
2. QUEENSTOWN IN HISTORICAL PERSPECTIVE
2
2.1 Before 1910 - the colonial era
Most historical references to Queenstown suggest that the town was first established
in the early 1850s when white settlers constructed dwellings on the banks of the
Komani River due to the availability of fresh water and the suitability of the area for
livestock farming (see DBSA, 1988). Queenstown was proclaimed as a colonial
settlement area in 1853, and continued to grow steadily as a trade centre servicing the
rural hinterland. In 1879 Queenstown was declared a municipality and in 1880 a
railway link with East London was connected which confirmed Queenstown’s status
as a high order regional service centre. This was given further impetus with the
building of the Bongola Dam in the early 1900s, which now gave Queenstown a
formalised domestic water supply.
By 1910 Queenstown has developed into ‘the regional centre of industry, commerce
and education’. Industry included quarrying, brickmaking, building, wagon-making,
milling, a butter factory, the bottling of aerated water, and a brewery (which marketed
throughout South Africa) (DBSA, 1988). The town had good road and rail links with
major centres and its agricultural hinterland, and had in place a municipality with
strong institutional links to the Cape colonial administration. At the same time though,
there had been absolutely no attempts to extend services and develop infrastructure for
black communities which had settled around the town, in areas such as Esikidini and
Mlungisi. These areas resembled ‘slums’ with overcrowding and no facilities or
services such as reticulated water.
2.2 1910-1948 - the union of South Africa
The key policy in the newly established Union of South Africa was the ‘Native
Reserve Policy’ realised through the Natives Land Act of 1913, which basically
reserved some 13% of South Africa’s land area for the occupation by Africans, and
the 1936 Native Trust and Land Act which effectively tightened the terms by which
Africans were allowed to reside in white rural areas. The aim of these laws was to free
up land for white occupation as well as to create reserves of cheap, unskilled labour
for superexploitation by white farmers, miners and industrialists. The effect was the
devastation of the agricultural economic base of African rural communities. Faced
with overcrowding and declining yields, a constant stream of landless people migrated
to nearby urban centres, in search of a livelihood.
Within Queenstown, most of these migrants and displaced rural dwellers settled in
Mlungisi. But while significant infrastructural facilities and services were being
provided for the white Queenstown population (including reticulated water,
electricity, housing, sanitation, etc), little to no infrastructure and services were
provided for the black townships such as Mlungisi.
2.3 1948-1994 - Apartheid

3
The National Party after it came to power in 1948 set about formalising and
institutionalising the policy of separate development. In particular its focus was on
keeping Africans in the ‘native reserves’ (soon to be called ‘bantustans’) and out of
the ‘white’ urban areas. This was achieved through influx control measures such as
the Group Areas Act of 1950, the Prevention of Illegal Squatting Act of 1951, and the
Urban Areas Amendment Act of 1952 (which made it a legal requirement for
Africans living in urban areas to carry passes).
This had the effect of limiting opportunities for migrancy outside of the sub-region,
resulting in even higher levels of influx into Mlungisi which continued to
accommodate displaced people from the overcrowded and impoverished ‘bantustans’.
The forced resettlement of communities (mostly from white farming areas) on
‘dumping sites’ in the sub-region such as Zweledinga and Ntabatemba (in the former
Ciskei) resulted in even further growth of Mlungisi. Compared to the ‘dumping sites’,
Queenstown’s township provided opportunities for survival, despite the lack of
services and infrastructure. Indeed the logic of apartheid planning (wholeheartedly
embraced by the Queenstown municipality) was such that housing, infrastructure and
services were consciously not provided so as not to encourage African settlement in
Mlungisi (and Queenstown). It was only in 1985 that the further development of
Mlungisi was unfrozen and further residential dwellings developed.
Instead the apartheid government implemented a strategy of promoting residential
growth within the ‘bantustans’. The key focus of this urban resettlement policy within
the sub-region was Whittlesea, with Sada being developed in 1963 for this very
purpose. A decade later (in 1972) the Department of Co-operation and Development
unveiled a plan to develop a township near Queenstown, but situated in the
‘bantustan’ of the Transkei. Construction of Ezibeleni began soon after, and over the
next few years thousands of people were relocated there from Mlungisi. The complete
relocation Mlungisi residents to Ezibeleni was halted with the proclamation in 1976 of
the Transkei as an ‘independent state’, and Ezibeleni’s incorporation into the
Transkei.
Also important in the development of Queenstown was its declaration as a growth
point in 1978. The essence of the industrial decentralisation strategy as it became
known was to develop basic infrastructure at selected growth points (situated within
52km of a homeland) and offer incentives to interested investors. The particular
incentives offered in a particular growth point were differentiated according to how
attractive or otherwise and area was (see Dewar et al, 1984). Region D (of which
Queenstown was a part) was accorded the highest development priority, and provided
with some of the most ‘attractive’ incentives available. Among these were tax
incentives, transport subsidies, rent subsidies, as well as the understanding that
homeland governments would facilitate workplace relations conducive to the super-
exploitation of employees. The rationale behind the industrial decentralisation strategy
was threefold: (1) to provide opportunities for South African and foreign
manufacturers to set up shop in a labour surplus environment where industrial peace
was guaranteed; (2) to promote the sustainability of homeland populations in order to
lessen the movement to urban metropolitan areas; and (3) to garner support for the
homeland governments who were increasingly being targeted as part of the broader
anti-apartheid resistance.
4
Within Queenstown, Ezibeleni (situated on the border of the former Transkei) was the
was the key beneficiary of the industrial decentralisation strategy. At the height of the
investment in Ezibileni (around 1989), some 18 companies with an investment
profile of just under R20 million, and employing some 1000 people (Transkei
Industrial Survey, 1990). Most of these industries were in the wood and furniture
sector, clothing and textiles, and in non-ferrous metals. Since 1989, however, there
has been a steady closure of firms in Ezibileni (approximately 3 to 4 each year up to
1995). Reasons for this include increasing trade union penetration after 1990 (placing
limits on the extent to which employers could exploit workers) and the dismantling of
the incentives (which had attracted the firms in the first place).
2.4 The legacies
One hundred an fifty years of colonialism, separate development and apartheid have
left their mark on Queenstown and surrounding areas. In a sense, Queenstown and
surrounding hinterland are like a microcosm of South Africa. Let us briefly consider
the key features of this micro-political economy.
2.4.1 A developed core and an impoverished rural periphery
Queenstown has developed as the core service, administrative, educational, industrial,
and commercial centre in the sub-region. Resources and infrastructural facilities and
services which have flowed into the sub-region have been concentrated in
Queenstown (albeit for the benefit of the white population only). Growth and
development in Queenstown has been steady over the past century, although recent
(post 1990) developments has seen a decline in industrial activity.
At the same time though, the rural areas in the surrounding ‘bantustans’ have got
significantly poorer. Poverty is most extreme in the nearby ‘dumping sites’ of
Zweledinga and Ntabetemba (among others), although most rural villages in the
broader sub-region are characterised by high levels of unemployment, landlessness,
lack of water, and the absence of basic services and facilities.
2.4.2 Social inequality (on the basis of race)
Within Queenstown itself, there are in fact two Queenstowns, one black and one white
(or perhaps even three if we include the so-called ‘coloured’ areas whose quality of
facilities and services lies somewhere between the two extremes). Historically the
physical infrastructure (water, sewerage, roads etc) and social infrastructure (housing,
schools, health facilities, sports facilities etc) for white residents in Queenstown has
been very good, comparable with standards anywhere else in South Africa. Facilities
and services for Mlungisi (where the majority of the black Queenstown population
live) were hopelessly inadequate. Historical accounts of Mlungisi describe it as ‘an
overcrowded slum’. Indeed as suggested above (sub-section 2.3), in line with
apartheid development planning, this was conscious so as not to encourage the influx
of Africans from the impoverished rural hinterland.
2.4.3 Involuntary urban settlement patterns
5
Urban settlement patterns for Africans in the sub-region have been shaped by the logic
of apartheid development planning which artificially created towns and townships so
as to encourage urbanisation and resettlement ‘within the bantustans’ (eg. Whittlesea
and Ezibileni). Industrial development was then artificially kick-started (through
incentives, trade union suppression etc) to provide jobs to encourage settlement. But
the question in the post apartheid scenario is what do you do with these towns?
Ezibileni is less of a problem because of its proximity to Queenstown (and inclusion
in the Queenstown municipality). Whittlesea is more of a problem. Questions need to
be raised as to whether it should continue to be an urbanisation focus and developed
as a sub-regional service centre (with its own TLC etc), or whether it should be
integrated into Queenstown.
2.4.4 Underdeveloped institutional capacities
Another significant consequence of apartheid development planning has been the
extremely fragmented institutional framework which has governed development in the
area. For a start, what is ostensibly one spatial economy - the subregion (the broader
Queenstown-Whittlesea area) - has historically been governed by three separate
administrations, South Africa, the Transkei and Ciskei. That this has impeded
coherence and integration with respect to development planning, service delivery, and
the institutional framework thereof is obvious.
In many cases (for example around LED and poverty alleviation), developing
institutional capacity will by necessity first involve putting into place the appropriate
institutional arrangements (organisations, structures, committees etc). It is only once
these arrangements are in place that minimum capacity thresholds can be calculated,
training needs identifies, and capacity developed to threshold levels. Furthermore,
institutional change may often be contested, especially when it involves transforming
relations of power and patronage which have been in place for decades.
3. DEMOGRAPHIC CHARACTERISTICS
Unfortunately, at the time of writing this report, the detailed findings of the 1996
national census had not yet been released. Unfortunately, the 1991 national census
does not give a complete picture of Queenstown as Ezibileni (a township which
comprises between 30 000 - 40 000 people) is excluded. What follows then are figures
which are based on the Queenstown municipality’s population figures for Queenstown
(as contained in the 1997 Draft Structure Plan), as well as Vista University’s figures
(which are projections based on the 1991 Census). Use will also be made of the CSS’s
1995 October Household Survey, Unisa’s 1995 Socio-Economic Profile of South
Africa’s Nine Provinces, and the DBSA’s 1995 Statistical Macroeconomic Review
(which primarily uses CSS data such as the 1991 national census, the 1995 October
Household Survey, together with its own secondary data).
3.1 Queenstown sub-regional population size
Given Queenstown’s importance as an administrative, educational, industrial,
commercial and service centre to a large sub-region consisting of a number of smaller
rural towns, and numerous rural villages, it is important to quantify the size of this

6
sub-regional population. As is evident below, the size of this population is given as
427 500 (based on Vista University Data D 1995 and CSS 1995 figures, 1997 Draft
Structure Plan), although today the population is likely to be in excess of half a
million people.
Role and Function Settlement Population (estimate)
primary urban service centre Queenstown TLC 75 000
secondary urban service centre Sada/Whittlesea 53000
minor urban service centres Sterkstroom,
Cathcart,
Lady Frere
5500
6000
3000
residential area peri-urban Illinge 12 000
rural villages 150 villages 250 000
minor communities commercial farms 23 000
Total population 427 500
3.2 Queenstown population size
What follows are estimates for the population size of the three residential areas that
make up Queenstown. A number of contrasting figures are provided so as to illustrate
just how contested (and unreliable) the population data for Queenstown really are.
Residential
area
Population (Vista
University - 1995)
Population
(TLCs figures
-1997)
Population
(Draft
Structure
Plan - 1997)
Populati
on
(Adjuste
d
estimates
-1998)
Queenstown
(town area)
17 765 19 528 18 332 14 999
Mlungisi 16 752 29 427 52 112 33 195
Ezibileni 39 073 56 363 46 064 32 530
Total 73 590 105 318 116 508 80 724
It is difficult to say which of the above figures are more correct. What is perhaps most
disturbing about the above figures is not so much the contrasts given for total
populations in Queenstown (although this in itself is worrying), but rather the
differences in population sizes given for the different residential areas which comprise
Queenstown. For example, the Vista University and TLC figures (which were
provided for the 1997 Infrastructure Assessment for Towns in the Eastern Cape
Province), both suggest that Ezibileni is considerably larger in population size
compared to Mlungisi. This is indeed problematic when one considers that Mlungisi
has more developed residential sites than Ezibileni (according to the latest Draft
Structure Plan).
Accordingly the 1997 Draft Structure Plan calculates its population size for each of
the residential areas from the number of developed residential sites and estimated

7
shacks in each area. Population size is then calculated on the basis of an estimated
occupancy rate of 8 persons for developed residences in Mlungisi and Ezibileni, 5.5
persons for Queenstown town area, and 5 persons for the shack settlements. This
method has merit, although clearly the household sizes for Mlungisi and Ezibileni are
over-exaggerated. A more realistic projection based on a household size for Mlungisi
and Ezibileni of 5 persons, and for Queenstown town area of 4.5 persons, would put
the population size of Queenstown at 80 724.
3.2 Population growth rates
Any projections of future population size of Queenstown must take into account the
fact that the town is growing at an alarming rate. This is due both to natural
population increase (of about 1% -1.5% per annum) and the influx of people from the
rural areas surrounding Queenstown (of about 1.5% - 2% per annum). This means an
annual population growth rate of between 2.5% - 3.5% per annum. This means that
the Queenstown population will increase by nearly 30 000 over the next ten years.
What is significant about this population growth rate is that, over time, it is changing
the demographic characteristics of Queenstown. The fact that natural population
growth is higher among low-income groups, and that most of the residents who come
to Queenstown from surrounding rural areas are poor, means that population growth
will be significantly higher amongst the poor. This will have important consequences
for development planning.
3.3 Population breakdown by race
Due to the high influx of African residents from the impoverished areas surrounding
Queenstown (as well as from higher levels of natural population growth) population
growth levels are higher among African residents than for other so-called ’race
groups’. Population figures for 1979 suggest that the white population made up 28%
of Queenstown’s population, and the African population only 64% (1997 Draft
Structure Plan). The DBSA (1996: Eastern Cape Human Development Profile) gives
the breakdown as 63% African, 0.4% Asian, 14.6% Coloured and 22% White. But
these breakdowns are based on a population size of 49 140.
Clearly if we accept the number of developed residential sites as suggested by the
TLC and Town and Regional Planners Setplan, then a very different picture emerges.
Estimates based on these population projections suggest that the African population
comprises some 80% of Queenstown’s population, whites make up about 13%, the so-
called ‘coloured’ population about 6%, and the ‘Indian’ population about 0.5%.
The point needs to be made though that the relevance of such labels lies in accounting
for (historically determined) racial imbalances and inequalities which are prevalent in
the community.
3.4 Population by gender
8
The Vista University Data D Report suggests that Queenstown is made up of
significantly higher numbers of females than males. The report estimates that
approximately 45% of the population is male and 55% female.
The DBSA’s Statistical Macroeconomic Overview confirms the fact that Queenstown
is overrepresented by females. The DBSA figures show that while there are more
males than females in the under 14 year age category, the opposite is true for both the
15-64 year category and the 65 years plus category (in which 64% are female).
Reasons have to do with labour migrancy (absent men are simply not counted in
surveys), and with the fact that women tend to live longer than men (men are far more
likely to suffer trauma related deaths as well as deaths from occupational diseases and
migrant-related illnesses like TB).
But despite men being fewer in the 15-64 year category, the DBSA’s (1995) statistics
suggests that the gender composition of the labour force in Queenstown was 53%
male and 47% female. This reflects women’s peripheral status in the formal sector
labour market.
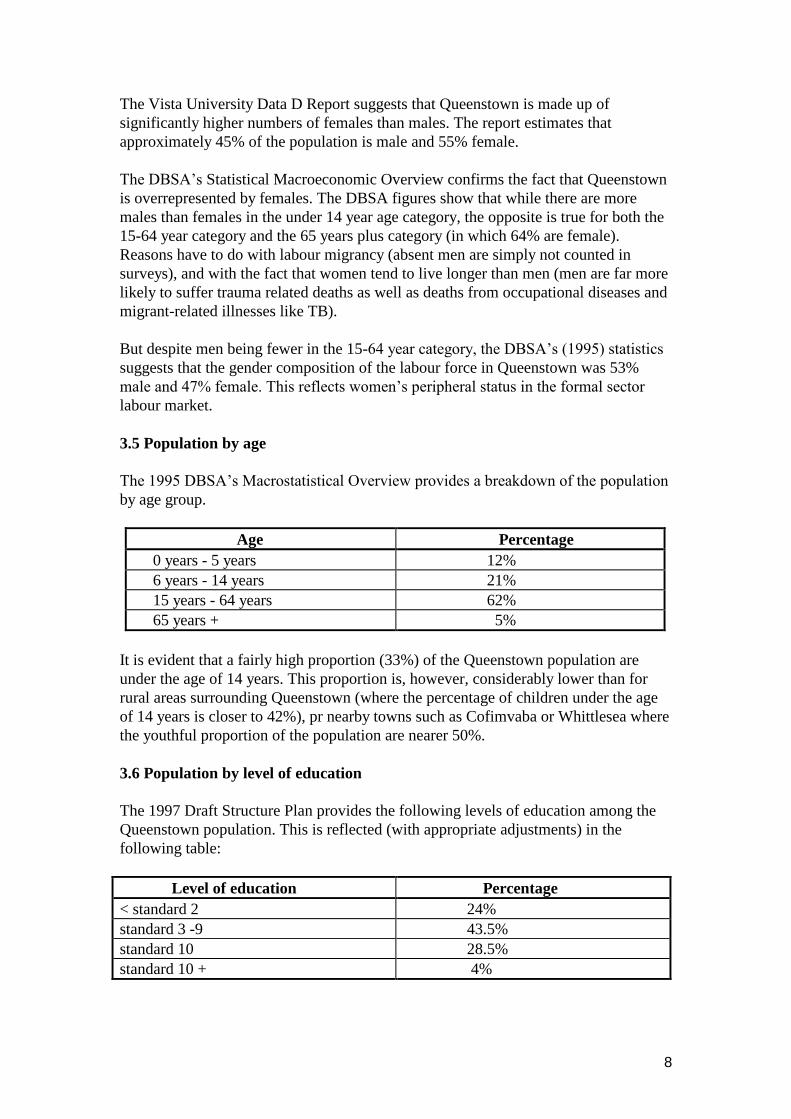
3.5 Population by age
The 1995 DBSA’s Macrostatistical Overview provides a breakdown of the population
by age group.
Age Percentage
0 years - 5 years 12%
6 years - 14 years 21%
15 years - 64 years 62%
65 years + 5%
It is evident that a fairly high proportion (33%) of the Queenstown population are
under the age of 14 years. This proportion is, however, considerably lower than for
rural areas surrounding Queenstown (where the percentage of children under the age
of 14 years is closer to 42%), pr nearby towns such as Cofimvaba or Whittlesea where
the youthful proportion of the population are nearer 50%.
3.6 Population by level of education
The 1997 Draft Structure Plan provides the following levels of education among the
Queenstown population. This is reflected (with appropriate adjustments) in the
following table:
Level of education Percentage
< standard 2 24%
standard 3 -9 43.5%
standard 10 28.5%
standard 10 + 4%
9
It can be seen that some 24% of Queenstown’s population have only attained standard
2 qualification or less. This means a literacy level of between 70%-75% (using the
commonly used literacy threshold qualification of standard 4), although such
standardised literacy indicators are extremely problematic. On the other end of the
scale, less than one third of adults have matric. Although unacceptably low, these
reflect educational levels which are pretty much on par with the rest of the province,
and considerably higher than in surrounding towns and rural villages (particularly
those in the former homelands).
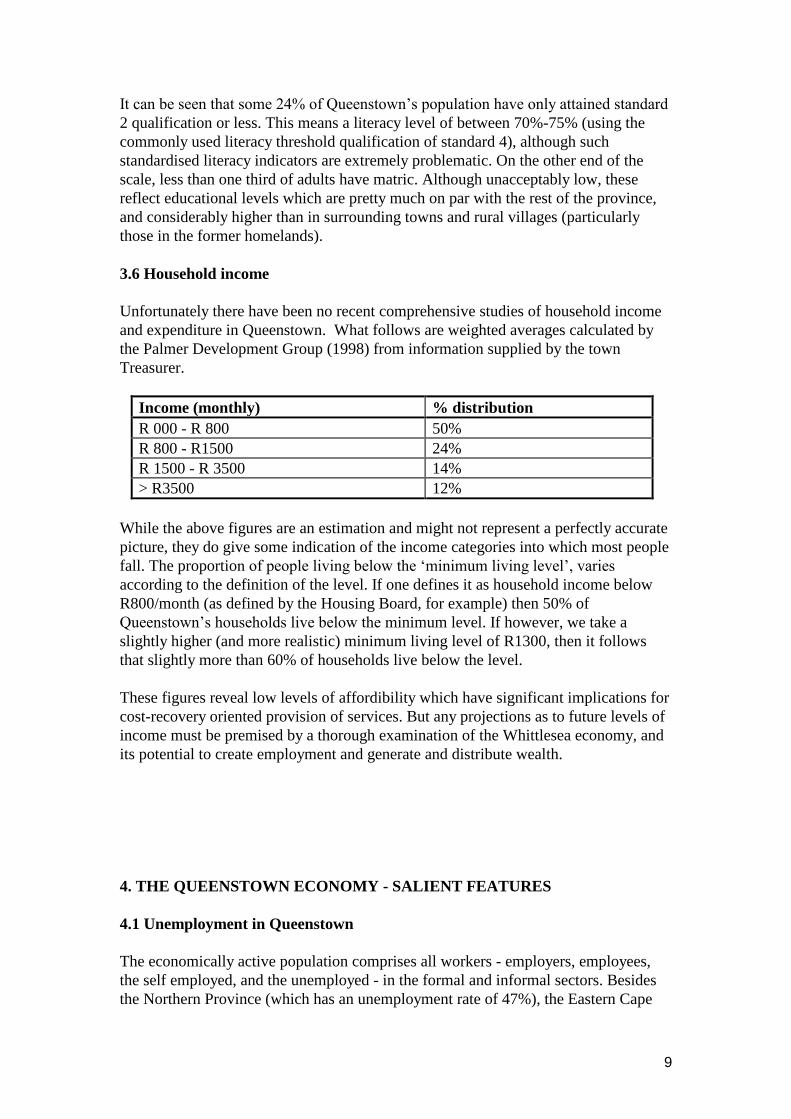
3.6 Household income
Unfortunately there have been no recent comprehensive studies of household income
and expenditure in Queenstown. What follows are weighted averages calculated by
the Palmer Development Group (1998) from information supplied by the town
Treasurer.
Income (monthly) % distribution
R 000 - R 800 50%
R 800 - R1500 24%
R 1500 - R 3500 14%
> R3500 12%
While the above figures are an estimation and might not represent a perfectly accurate
picture, they do give some indication of the income categories into which most people
fall. The proportion of people living below the ‘minimum living level’, varies
according to the definition of the level. If one defines it as household income below
R800/month (as defined by the Housing Board, for example) then 50% of
Queenstown’s households live below the minimum level. If however, we take a
slightly higher (and more realistic) minimum living level of R1300, then it follows
that slightly more than 60% of households live below the level.
These figures reveal low levels of affordibility which have significant implications for
cost-recovery oriented provision of services. But any projections as to future levels of
income must be premised by a thorough examination of the Whittlesea economy, and
its potential to create employment and generate and distribute wealth.
4. THE QUEENSTOWN ECONOMY - SALIENT FEATURES
4.1 Unemployment in Queenstown
The economically active population comprises all workers - employers, employees,
the self employed, and the unemployed - in the formal and informal sectors. Besides
the Northern Province (which has an unemployment rate of 47%), the Eastern Cape

10
has the next highest rate of 45.3% (Unisa, 1995). The national unemployment rate is
calculated to be 32.6%, indicating the relatively high levels of unemployment (and by
consequence poverty) in the province. Unemployment here refers to the expanded
definition which includes people 15 years and older who, though unemployed, are
available for work irrespective of whether they are taking active steps to find work.
Definitions are important when it comes to counting people. The DBSA, for example,
in its 1995 Eastern Cape Macroeconomic Survey, uses the narrow definition of
unemployment. This definition includes people over the age of 15 years who are not
in any type of employment, but who are actively looking for a job (have applied for
jobs within a month of the survey). Such narrow definitions excludes those who have
become disillusioned and given up looking for a job, or do so less often due to costs
associated with finding a job (transport etc).
The Unisa statistics (1995)suggest that unemployment in the Eastern Cape is
considerably higher in the rural areas (56.3% for rural and 32.4% for urban). It is also
considerably higher amongst women, with the provincial unemployment rate being
50.4% for females and 40.2% for men. These figures are fairly close to those of the
CSS’s 1995 October Household Survey which put the unemployment rate at 53% for
African females, and 42% for African men. The CSS data makes for interesting
comparative analysis across racial groups in the province. For example, the
unemployment rate for white males is only 5%, and that of white females 12%.
Nobody knows the precise unemployment rate in Queenstown. Once again it depends
on whether one is using the expanded or narrow definition, and how accurate and
rigorous the methods used to arrive at the figure. The DBSA (Eastern Cape: A Human
Development Profile, 1995) gives the 1991 unemployment rate for Queenstown as
20%, with an additional 19% of the economically active population employed in the
‘informal sector’. These figures are based on an economically active population of
17 252. Clearly this figure under-represents the true nature of unemployment in
Queenstown. Where it is most accurate is in the number of formally employed people
- presented as 10 362. Where it is most inaccurate is in the size of the potentially
economically active population. Then, in 1991, it was probably around 35 000 which
means that less than 30% of the potentially economically active population were
formally employed. Secondly, the DBSA figures must be challenged in their (implicit)
assumption that people involved in informal sector activities wouldn’t rather be
formally employed. Informal sector activities are often (although not always) a
survival strategy rather than a preferred choice. The same problem exists with so-
called ‘homemakers’ and ‘unpaid family workers’, who are not counted as
unemployed but may well rather choose to work if such employment opportunities
existed.
On an expanded definition, the size of the potentially economically active population
today is more likely about 48 000. Realistically we can exclude about 35% as those
being unable to work (eg. disabled persons) and those choosing not to work in formal
employment (so called home-makers, students and the self-employed). This means a
population of about 31 200 people willing and able to work in the formal sector. If we
take an optimistic figure of 14 000 people formally employed in Queenstown, this
means an unemployment rate of 56%.
11
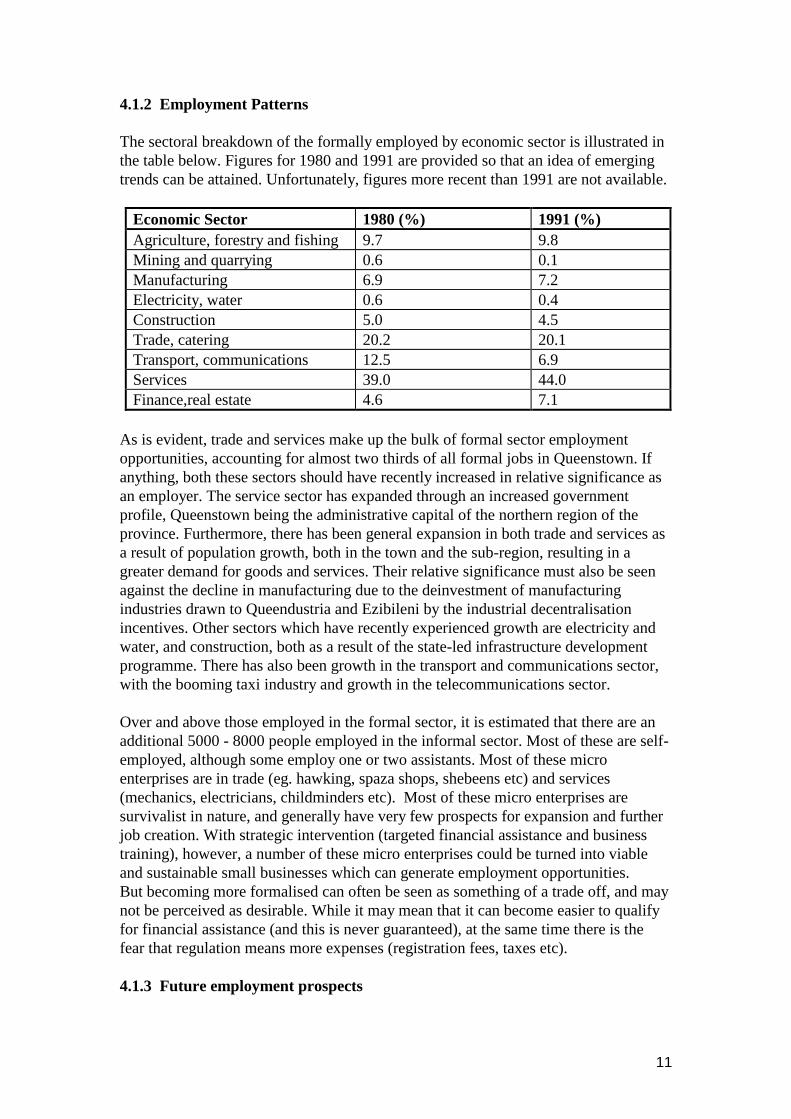
4.1.2 Employment Patterns
The sectoral breakdown of the formally employed by economic sector is illustrated in
the table below. Figures for 1980 and 1991 are provided so that an idea of emerging
trends can be attained. Unfortunately, figures more recent than 1991 are not available.
Economic Sector 1980 (%) 1991 (%)
Agriculture, forestry and fishing 9.7 9.8
Mining and quarrying 0.6 0.1
Manufacturing 6.9 7.2
Electricity, water 0.6 0.4
Construction 5.0 4.5
Trade, catering 20.2 20.1
Transport, communications 12.5 6.9
Services 39.0 44.0
Finance,real estate 4.6 7.1
As is evident, trade and services make up the bulk of formal sector employment
opportunities, accounting for almost two thirds of all formal jobs in Queenstown. If
anything, both these sectors should have recently increased in relative significance as
an employer. The service sector has expanded through an increased government
profile, Queenstown being the administrative capital of the northern region of the
province. Furthermore, there has been general expansion in both trade and services as
a result of population growth, both in the town and the sub-region, resulting in a
greater demand for goods and services. Their relative significance must also be seen
against the decline in manufacturing due to the deinvestment of manufacturing
industries drawn to Queendustria and Ezibileni by the industrial decentralisation
incentives. Other sectors which have recently experienced growth are electricity and
water, and construction, both as a result of the state-led infrastructure development
programme. There has also been growth in the transport and communications sector,
with the booming taxi industry and growth in the telecommunications sector.
Over and above those employed in the formal sector, it is estimated that there are an
additional 5000 - 8000 people employed in the informal sector. Most of these are self-
employed, although some employ one or two assistants. Most of these micro
enterprises are in trade (eg. hawking, spaza shops, shebeens etc) and services
(mechanics, electricians, childminders etc). Most of these micro enterprises are
survivalist in nature, and generally have very few prospects for expansion and further
job creation. With strategic intervention (targeted financial assistance and business
training), however, a number of these micro enterprises could be turned into viable
and sustainable small businesses which can generate employment opportunities.
But becoming more formalised can often be seen as something of a trade off, and may
not be perceived as desirable. While it may mean that it can become easier to qualify
for financial assistance (and this is never guaranteed), at the same time there is the
fear that regulation means more expenses (registration fees, taxes etc).
4.1.3 Future employment prospects

12
One of the key challenges facing Queenstown is its rapid population growth,
calculated (in sub-section 3.2) to be at least 3% per annum. This is due both to natural
population growth and the influx of people from Queenstown’s impoverished rural
hinterland. While the rapidly increasing population will no doubt create opportunities
(notably in services and trade), it will at the same time put tremendous pressure on the
local economy to create jobs. This is illustrated in the following table:
Projection Population (at 3%
growth, includes
both natural growth
and influx from
rural sub-region)
Potentially
economically active
population less
those unavailable
for work
Existing
number of
jobs
Job
shortfall
1998 (present) 80 000 32 000 14 000 18 000
2003 (5 year) 92 700 37 080 14 000 23 080
2008 (10 year) 107 380 42 950 14 000 28 950
2018 (20 year) 144 200 57 680 14 000 43 680
The above table illustrates that there is currently a job shortfall of 18 000 jobs in
Queenstown. In order to achieve full employment by the year 2003, some 23 000 jobs
have to be created. In other words, just to maintain current levels of employment (so
as not to further increase the already unacceptably high levels of unemployment), an
additional 5000 jobs need to be created over the following 5 years.
By the year 2008, the economically active population will have grown to about
43 000. This means a jobs shortfall of some 29 000 jobs, and means at least 10 000
employment opportunities need to be created just to maintain current levels of
employment.
If no new jobs are created by the year 2018, Queenstown will have an unemployment
rate of around 75% and a shortfall of some 43 500 jobs. In order to maintain current
employment levels (with an unemployment rate of around 55%), there will need to be
almost 16 000 new jobs created over the next 20 years.
4.2 Gross Geographical Product at factor cost by economic sector
Economic sector 1980 (%) 1991 (%)
Agriculture, forestry and fishing 5.5 3.8
Mining and quarrying 0.1 0.2
Manufacturing 8 13
Electricity, water 2.2 3.2
Construction 4.6 3.6
Trade, catering 21.7 31

13
Transport, communications 20 14.4
Services 23.5 17
Finance, real estate 14.2 13
The above table shows the importance of trade and services as the two key economic
sectors in Queenstown, and the relatively insignificant role of manufacturing. The
table further shows what kinds of trends have emerged, with trade increasing its
importance as an income generator for Queenstown. While manufacturing can be seen
to have increased in significance from 1980-1991, its relative contribution to the
town’s GGP will have decreased over the past few years with the closure of a number
of industries in Ezibeleni and Queendustria. Likewise, sectors which have to do with
infrastructure development such as water, electricity and construction will have
increased in significance. Unfortunately, more up-to-date data is currently not
available.
4.3 The Economic infrastructure
Economic infrastructure is taken here to mean the natural, physical and human
resource endowment which currently exists in Queenstown.
4.3.1 Natural resources
Queenstown is situated south of the foothills of the Stormberg Mountain range.
The Draft 1997 Structure Plan describes Queenstown’s physiographical and
topographical features as ‘average to below average’. The land around Queenstown is
mountainous, semi-arid (with annual rainfall of 560 mm) with extreme climatic
conditions regarding temperature fluctuation. The veld type in rural areas surrounding
Queenstown is semi-arid Karoo-type vegetation which has low carrying capacity and
deteriorates under heavy grazing.
Bulk water supply comes from the Bogola Dam (built almost 100 years ago by the
Queenstown Municipality), and the Waterdown dam (near Whittlesea). It has recently
become evident, however, that this water supply would by no means be able to serve
the needs of the growing Queenstown population into the new millennium. Plans are
now afoot to implement a scheme to supply Queenstown with water from the Xonxa
Dam.
It is evident then, that Queenstown has no particular natural resources around which
future economic development can be built. What it does have, however, is an ever-
increasing sub-regional population which it will continue to service. While it is close
enough to other major service centres such as East London and Umtata to benefit from
commercial and marketing linkages, it is far enough away to enable it to service its
own sub-regional population.
4.3.2 Physical resources
established transport infrastructure
14
Queenstown’s accessibility by road and rail transport is one of its key strengths. The
town lies on the main road (the N6) between East London and Gauteng, which passes
through Bloemfontein on the way. There is also an established road network linking
Queenstown with other large towns in the region including Aliwal North (by the N6),
Cradock (by the R61), Umtata (by the R61), Whittlesea (by the R67) and Elliot (by the
R56). Queenstown also lies on the main rail linkage between East London and
Bloemfontein, Johannesburg and Pretoria.
a flourishing central business district
The central business district, which lies on the N6 which passes through Queenstown,
offers a wide variety of between retail, commercial and professional services. These
include retail shops (clothing stores, furniture stores, supermarkets, pharmacies, fresh
produce stores, hardware stores, bottle stores etc); commercial services (hotels,
restaurants, banks, filling stations); industrial services (automotive repairs, exhaust
and tyre repairs); professional services (medical, legal, financial, engineering
services); government services (provincial government regional offices, TLC and
Stormberg District Council), transport services (bus and taxi facilities); and informal
traders (kiosks and pedestrian walkways).
under-utilised industrial sites
One of the legacies of the apartheid government’s industrial decentralisation scheme
are the vacant factories standing in Ezibileni and to a lesser extent in Queendustria. As
a result, most of the industrial sites are being utilised for purposes other than for
which they were built. Most, especially in Queendustria operate as storage or
warehousing facilities rather than as productive enterprises. The downside of this is
that employment levels are considerably lower (an average of between 15-20 people
per site) than those where production is taking place. Educational institutions are also
utilising vacant industrial buildings in Queendustria.
While the ECDA (into which the Transkei Development Corporation has been
integrated) owns and rents most of the industrial sites, some companies have bought
sites in Queendustria. Many have moved from Ezibileni to Queendustria complaining
that the Ezibileni site is not well maintained and unsafe.
Together with the Southbourne industrial area to the south-east of the Queenstown’s
CBD, these industrial sites have enormous development potential. All three are served
by railway sidings, and have direct (road and rail) transport linkages to a port in East
London and markets in Gauteng, Bloemfontein and East London.
4.3.3 Human resources
Almost one quarter of Queenstown’s adult population has an educational level of
standard two or below, while more than two thirds have not attained matric. This does
not, however, mean that their are no skills in Queenstown. In fact due to its position as
the Northern Region’s administrative centre and the commercial service centre of a
broad sub-region, Queenstown has a range and depth of skills which belie it size and
demographic profile.

15
These include a range of professional skills (medical and nursing, legal, engineering,
project management, planning, accounting, teaching etc), management skills
(leadership, financial management, business management, organisational
management, administrative, labour relations etc), and practical skills including those
which are more skilled and semi-skilled in nature (white collar - clerical, bookkeeping
and administrative skills, as well as those which are more blue collar in nature -
machine operators, and artisan skills such as woodwork and carpentry, electrical,
plumbing, bricklaying, welding etc). There are also a wide range of informal ‘survival
skills’ which people have learned without the benefit of formal training, including
those in trade (eg. hawking), business management (eg. running a spaza shop),
services (gardening, radio repair, backyard mechanic etc).
5. THE PHYSICAL AND SOCIAL INFRASTRUCTURE
5.1 Physical infrastructure
5.1.1 Service provision
The following table illustrates the current level of service provision to formal
developed erven in the three broad residential areas that comprise Queenstown.
Services Queenstown -town
area
Ezibeleni Mlungisi
water full reticulation with
individually metered
about half of
developed erven have
individual water
connections, about
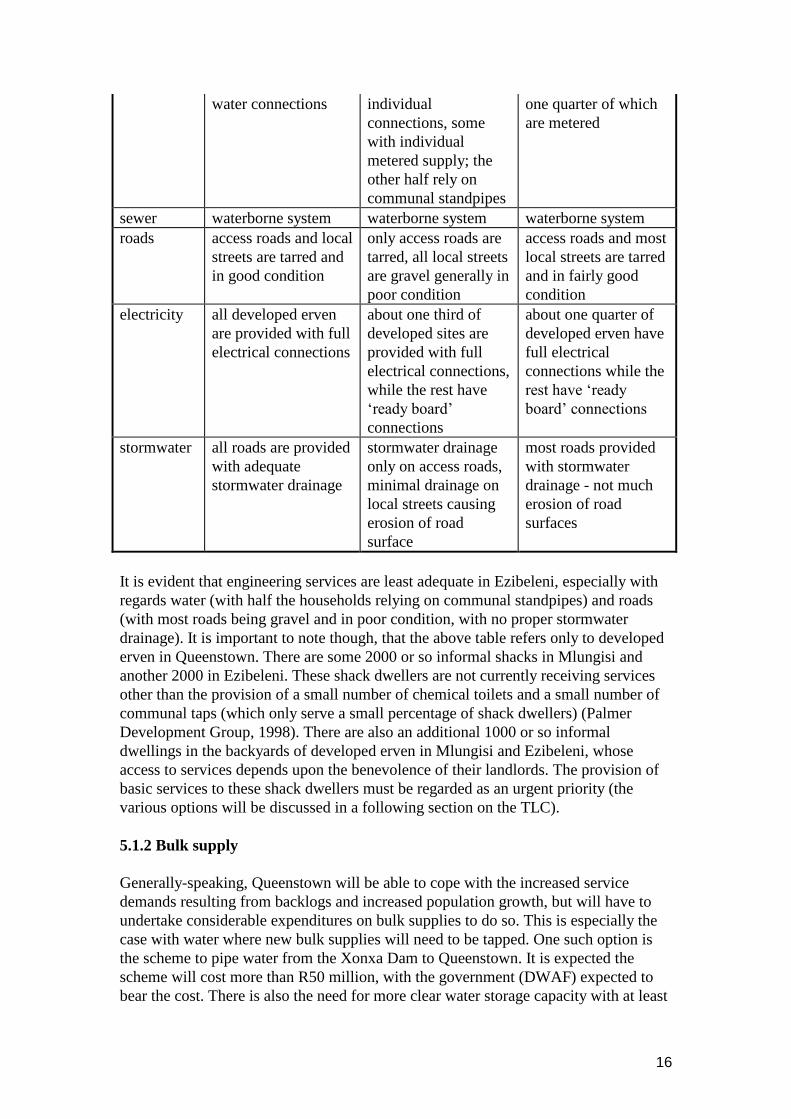
16
water connections individual
connections, some
with individual
metered supply; the
other half rely on
communal standpipes
one quarter of which
are metered
sewer waterborne system waterborne system waterborne system
roads access roads and local
streets are tarred and
in good condition
only access roads are
tarred, all local streets
are gravel generally in
poor condition
access roads and most
local streets are tarred
and in fairly good
condition
electricity all developed erven
are provided with full
electrical connections
about one third of
developed sites are
provided with full
electrical connections,
while the rest have
‘ready board’
connections
about one quarter of
developed erven have
full electrical
connections while the
rest have ‘ready
board’ connections
stormwater all roads are provided
with adequate
stormwater drainage
stormwater drainage
only on access roads,
minimal drainage on
local streets causing
erosion of road
surface
most roads provided
with stormwater
drainage - not much
erosion of road
surfaces
It is evident that engineering services are least adequate in Ezibeleni, especially with
regards water (with half the households relying on communal standpipes) and roads
(with most roads being gravel and in poor condition, with no proper stormwater
drainage). It is important to note though, that the above table refers only to developed
erven in Queenstown. There are some 2000 or so informal shacks in Mlungisi and
another 2000 in Ezibeleni. These shack dwellers are not currently receiving services
other than the provision of a small number of chemical toilets and a small number of
communal taps (which only serve a small percentage of shack dwellers) (Palmer
Development Group, 1998). There are also an additional 1000 or so informal
dwellings in the backyards of developed erven in Mlungisi and Ezibeleni, whose
access to services depends upon the benevolence of their landlords. The provision of
basic services to these shack dwellers must be regarded as an urgent priority (the
various options will be discussed in a following section on the TLC).
5.1.2 Bulk supply
Generally-speaking, Queenstown will be able to cope with the increased service
demands resulting from backlogs and increased population growth, but will have to
undertake considerable expenditures on bulk supplies to do so. This is especially the
case with water where new bulk supplies will need to be tapped. One such option is
the scheme to pipe water from the Xonxa Dam to Queenstown. It is expected the
scheme will cost more than R50 million, with the government (DWAF) expected to
bear the cost. There is also the need for more clear water storage capacity with at least
17
three new reservoirs needing to be built to service Mlungisi, Ezibeleni and
Queenstown town area, although it is unclear whether it should be the TLC who
should bear these costs (see 1997 Draft Structure Plan).
Besides these major investments in water supply, there will also need to be some
upgrading in bulk electrical supply (the bulk supply to Mlungisi), and the outfall
sewer that serves Mlungisi.
5.2 Social infrastructure
Housing
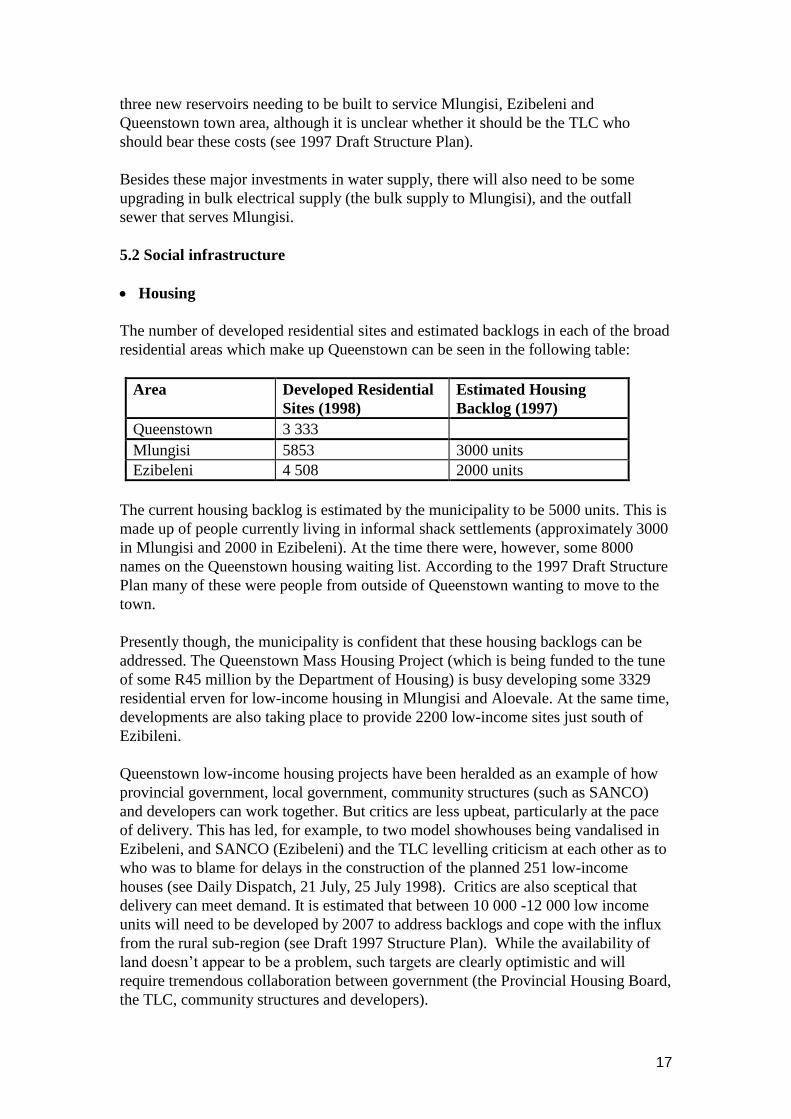
The number of developed residential sites and estimated backlogs in each of the broad
residential areas which make up Queenstown can be seen in the following table:
Area Developed Residential
Sites (1998)
Estimated Housing
Backlog (1997)
Queenstown 3 333
Mlungisi 5853 3000 units
Ezibeleni 4 508 2000 units
The current housing backlog is estimated by the municipality to be 5000 units. This is
made up of people currently living in informal shack settlements (approximately 3000
in Mlungisi and 2000 in Ezibeleni). At the time there were, however, some 8000
names on the Queenstown housing waiting list. According to the 1997 Draft Structure
Plan many of these were people from outside of Queenstown wanting to move to the
town.
Presently though, the municipality is confident that these housing backlogs can be
addressed. The Queenstown Mass Housing Project (which is being funded to the tune
of some R45 million by the Department of Housing) is busy developing some 3329
residential erven for low-income housing in Mlungisi and Aloevale. At the same time,
developments are also taking place to provide 2200 low-income sites just south of
Ezibileni.
Queenstown low-income housing projects have been heralded as an example of how
provincial government, local government, community structures (such as SANCO)
and developers can work together. But critics are less upbeat, particularly at the pace
of delivery. This has led, for example, to two model showhouses being vandalised in
Ezibeleni, and SANCO (Ezibeleni) and the TLC levelling criticism at each other as to
who was to blame for delays in the construction of the planned 251 low-income
houses (see Daily Dispatch, 21 July, 25 July 1998). Critics are also sceptical that
delivery can meet demand. It is estimated that between 10 000 -12 000 low income
units will need to be developed by 2007 to address backlogs and cope with the influx
from the rural sub-region (see Draft 1997 Structure Plan). While the availability of
land doesn’t appear to be a problem, such targets are clearly optimistic and will
require tremendous collaboration between government (the Provincial Housing Board,
the TLC, community structures and developers).
18
The Draft Structure Plan (1997) suggests that there are sufficient medium-to-high
income residential erven available to meet projected demands for the next 10 or so
years. There are some 1400 erven available in the areas of Madiera Park, Westbourne,
Laurie Dashwood Park, and Queensview Park.
Health
Being the regional health service centre for the northern region of the province,
Queenstown has a fairly well developed health infrastructure. These include a large
regional referral hospital (the Frontier Hospital), a regional mental hospital (in
Ezibileni), and a private hospital. There are in addition seven clinics (three in central
Queenstown, two in Mlungisi and two in Ezibeleni) and a mobile clinic.
Queenstown’s main clinic, the Gardens Clinic, also houses the Aids Training,
Information and Counselling Centre (which forms part of the Gardens Clinic).
This health infrastructure has no doubt greatly improved the health of the Queenstown
population. Health personnel state that the improvement in people’s health is
noticeable, but at the same time point out that there are still many obstacles to
overcome. One of the key impediments to improved health services in Queenstown is
institutional fragmentation. The clinics and mental hospital in Ezibeleni (which fell in
the former Transkei), for example, are still managed by the province, while the
remainder (former CPA) are managed at the district level. Health practitioners are still
awaiting a new Health Act which will promulgate the long overdue district health
model.
Nursing sisters staffing the clinics in Queenstown complain of too many patients
(focus group discussion, 25/11/98). Sisters complain of monthly patient/nursing sister
ratios of more than 1000:1. Many of the patients, they argue, are from areas serviced
by the former Transkei clinics, most of which are not functioning effectively with high
levels of staff absenteeism, lack of equipment and medicine etc. As a result,
Queenstown clinics have to soak up the overflow from the surrounding rural areas
serviced by clinics managed at provincial level. Other constraints to improved health
are the high levels of unemployment and poverty in Queenstown and surrounding
villages. The incidence of poverty diseases such as TB have not been reduced despite
the generally improved health infrastructure in the area (interview; district health
information system manager). As mentioned in the Whittlesea study report, there is
also a growing number of cases of nutritional diseases such as kwashiorkor and
marasmus in rural villages in the sub-region.
Education
For decades Queenstown has been the educational service centre of the northern
region, and as a result has developed a fairly sophisticated educational infrastructure.
There are, however, vast disparities with regards educational facilities in the
Queenstown town area and those in Mlungisi and Ezibeleni.
19
Queenstown town area has five primary schools, five secondary schools, two private
colleges and a technicon. Most (although by no means all) of the schools have good
facilities, with libraries, sport facilities, computers, photocopy machines etc.
Ezibeleni has eight primary schools and five high schools, and one private college.
Mlungisi has seven primary schools and five high schools. Generally-speaking the
schools in these former townships do not have sufficient facilities, especially libraries,
sports facilities and computers. Pupil:teacher ratios are also considerably higher than
in Queenstown town area. But despite these disparities (which do need to be
addressed), facilities are considerably better than the rural villages outside
Queenstown.
community facilities
Further disparities between the Queenstown town area and Mlungisi and Ezibeleni is
evident with regards community facilities such as libraries, community halls, and
sports and recreational facilities.
Queenstown town area has three libraries, four community halls, a post office, well
kept parks and gardens, and a sports stadium. While Ezibileni has a community hall
and a post office, it has no library facilities and its sports stadium is in a state of
disrepair. The situation in Mlungisi is slightly better having a library, a community
hall, a post office and a sports field.
Of note is the recent decision by the Sport and Recreation Minister Steve Tshwete, in
collaboration with the Eastern Cape’s Department of Sport and Culture, to locate the
Eastern Cape’s indoor multi-purpose sports centre in Queenstown. The centre, which
will cost some R4 million to develop, is part of a national project to build nine indoor
sports arena, one in each province.
government facilities
Queenstown town area hosts the regional offices of the provincial government, as well
as the offices of the Stormsberg District Council and the Queenstown TLC and TRC.
The area also has one magistrates court and a police station. Ezibeleni has a
magistrates court, a police station, some municipal offices, and government
workshop; while Mlungisi has a police station.
6. THE DEVELOPMENT NETWORK
This section will look critically at the institutional infrastructure in Queenstown, and
examine the role of the various stakeholdes in local economic development and
poverty alleviation.
20
6.1 The TLC - The need to address backlogs versus the need to generate revenue
Under the leadership of mayor George Xoseni, who is currently serving his third
successive term as mayor, the ANC-led Queenstown Transitional Local Council is
widely regarded as competent and effective. Financial and administrative systems are
in place, and the council has been heralded for its service delivery (even being
honoured by provincial government for its housing delivery).
Perhaps worrying has been the debt which the TLC has steadily accrued (which is
now in excess of R25 million). According to the Palmer Development Group, who
recently undertook a Queenstown Municipal Infrastructure Investment study for the
DBSA, reasons for the TLC’s ‘unhealthy financial situation’ have to do with a high
non-payment rate (calculated to be 28% of total accrued income) as a result of ‘a
culture of non-payment, and people having low affordability levels’ (1998:8). Non-
payment levels were calculated by the DBSA in 1997 to be between 50%-55% for
refuse, water and sanitation, 36% for rates, and 20% for electricity.
Following this the TLC (in collaboration with the DBSA) have devised a twofold
strategy:
(1) ‘encourage’ people to pay for their services - this strategy has been realised
through the ‘Drastic Action Plan’ which was initiated at the beginning of 1998, and
has seen ‘thousands’ of electricity and water cut-offs for non-payment and debt
settlement.
(2) the planned downscaling of service levels - the recent DBSA study suggests that
there is currently a ‘service level mismatch’ in Queenstown with ‘many households
being supplied with a level of service that they cannot afford the monthly costs of’
(1998:20). This approach seeks to tie service levels more closely with affordability
levels and proposes a downgrading of services to low-income households.
Questions need to be asked concerning the extent to which the Queenstown TLC can
be cost-recovery oriented in a context where socio-economic backlogs (estimated at
R55 million) and poverty are widespread. How does it generate revenue and is this
income sufficient to redress backlogs and cover recurrent costs? Clearly government
capital subsidies (housing of R17500, bulk and connector infrastructure of R3000, and
the National Electricity Regulator subsidy of R1 931 for low-income households) are
absolutely crucial for basic needs infrastructure development. Recurrent subsidies
such as agency fees and inter-governmental grants amount to some 10% of the TLC’s
accrued income, and provide 7 200 households (who earn less than R1300/month)
with a 45% rebate on service charges (interview: town clerk, 12/11/98). The phasing
in of equitable share subsidies to replace inter-governmental grants, may actually
increase the subsidy to poor households for R25 to R86 per month. However this will
not translate into improved levels of services for the poor (as is soon to be reflected in
the downscaling of service levels), but will be used to steadily reduce the TLC’s
accrued debt.
But even with these subsidies, the high proportion of low-income households (50%
earning less than R800/month) imposes serious constraints on the ability of the TLC
to finance recurrent costs. In order to cross-subsidise recurrent service costs of low-

21
income households, a higher proportion of costs will need to be borne by the high-
income households and non-residential sector (commercial and industrial consumers).
This will require some careful political manoeuvring by the TLC, given that both the
non-residential sector and number of high-income households are fairly small and
may well object to higher service charges. With regards the non-residential sector, the
TLC will have to balance the need to retain (and entice) business interests in
Queenstown (particularly in the context of stagnating real economic growth), against
the need to generate revenue. Higher service charges levied against high-income
households may prove a better option, but is sure to aggravate the increasingly
strained relationship between the TLC and the (conservative) ratepayers association.
As far as capital costs go, the following table reflects Queenstown’s 10 year
infrastructure and investment framework proposed by the DBSA.
Item Costs (R million)
Internal services (new)
Internal services (backlog)
Land (new households)
Land (backlog)
Bulk and connector (new)
Bulk and connector (backlog)
94
43
3
2
18
9
TOTAL 170
Government subsidies 123
Payments by high-income households 36
Borrowing 10
Source: DBSA/Palmer Development Group (1998:41)
The above table reflects both the dependence on government subsidies for the
Queenstown capital investment programme, as well as the need to borrow
(presumably from the DBSA or private bank). The programme is based on what the
Palmer Development Group/DBSA call ‘the compromise approach’ - in effect a
compromise between a ‘minimalist approach’ where everyone earning less than
R3500 per month gets provided with an ‘RDP level of service’, and the current
approach (of the TLC) in which high levels of service are provided to all households
earning less than R3500,00 per month. The ‘compromise approach’ guarantees a
minimum level of service, while offering higher levels of service to those who can
afford them. Such an approach will do away with ‘service level mismatch’, provide
low-income households with services which they can ‘afford’, and at the same time
reduce levels of non-payment as well as service charges levied against high-income
households to subsidise current levels of service to the poorer households.
In effect the change from the current approach to the ‘compromise approach’ will
mean downgrading services from for example, house connections to metered yard
taps, full water borne sanitation to simple waterborne (eg.small bore), 60 amp
electricity to 5/8 amp, gravel and paved roads to graded roads, open channel lined
stormwater to earth lined open channel, and kerbside waste removal to communal
waste removal. Low-income households can be grateful for the ‘the geological and
socio-political conditions in Queenstown’ , the reasons given for not downscaling to
22
VIP latrines and communal standpipes (DBSA, 1998:14). In the words of town clerk
AJ de Klerck, .....‘it’s like going back to the old days...... but that is the reality of the
situation which we must accept’.
The DBSA/Palmer Development Group are convinced that given the Queenstown
TLC’s financial predicament, it has no other option. Importantly though, such
proposals still need to be subject to the appropriate consultative process (the IDP).
Questions need to be asked, firstly, whether downgraded service levels (even with
reduced charges) will result in higher levels of payment? Secondly, have alternative
scenarios been adequately considered? Bond and Mncwabeni (1998:11), in their
critical analysis of service provision in Stutterheim, suggest that more attention needs
to be given to ‘demand side management’ - so that attention is not only focused only
on ‘building supply-side capital projects (water works and other bulk
infrastructure)...but attempts to better distribute those resources so that basic
consumption norms are met and other socio-economic and ecological goals, especially
conservation, are met’. The logic of such demand side management is that finances
(which for example are being spent on bulk water supply) can be saved through
conservation on the demand side, and can instead be used to provide improved
(subsidised) levels of retail services (housing, water supply, electricity, roads etc) to
the poor.
More thought also needs to be given to the wealth creation and job creation spin-offs
of developmental interventions. While emerging contractors are being trained and
used in the construction of RDP housing, more thought needs to be given to the socio-
economic spin-offs of infrastructure development in Queenstown. Currently
infrastructure development programmes are too ‘consultant -driven’ and consequently
too ‘rands and cents’ - driven. More thought needs to be given to socio-economic
spin-offs, especially for marginalised social groups such as women, the disabled, and
the poor. Here we are not talking about temporary construction jobs (the current
approach) but sustainable wealth creation strategies which use public sector
infrastructure programmes as a nursery for a range of SMME development strategies
(accompanied by the necessary financing, skills development, and business training).
Such interventions will require the participation of a range of government departments
and parastatals/public entities (TLC, Department of Housing and Local Government,
Department of Economic Affairs, Environment and Tourism, Department of Public
Works, Department of Water Affairs, the Stormberg District Council, a number of
Development Finance Institutions (especially Khula and the ECDA), and a range of
LED/SMME support and training agents (Tender Advice Centres, LBSCs etc).
6.2 Stormberg District Council - still to clarify its role in LED
The Stormberg District Council (SDC) region comprises the 10 districts of Cacadu,
Cathcart, Cradock, Cofimvaba, Hewu, Hofmeyer, Middleburg, Queenstown,
Sterkstroom, and Tarkastad. The 1996 preliminary census figures give the population
size of the SDC region as 745 600. While Queenstown is the largest centre and is the
administrative headquarters of the District Council offices, it comprises just 9% of the
total population of the Stormberg region.
23
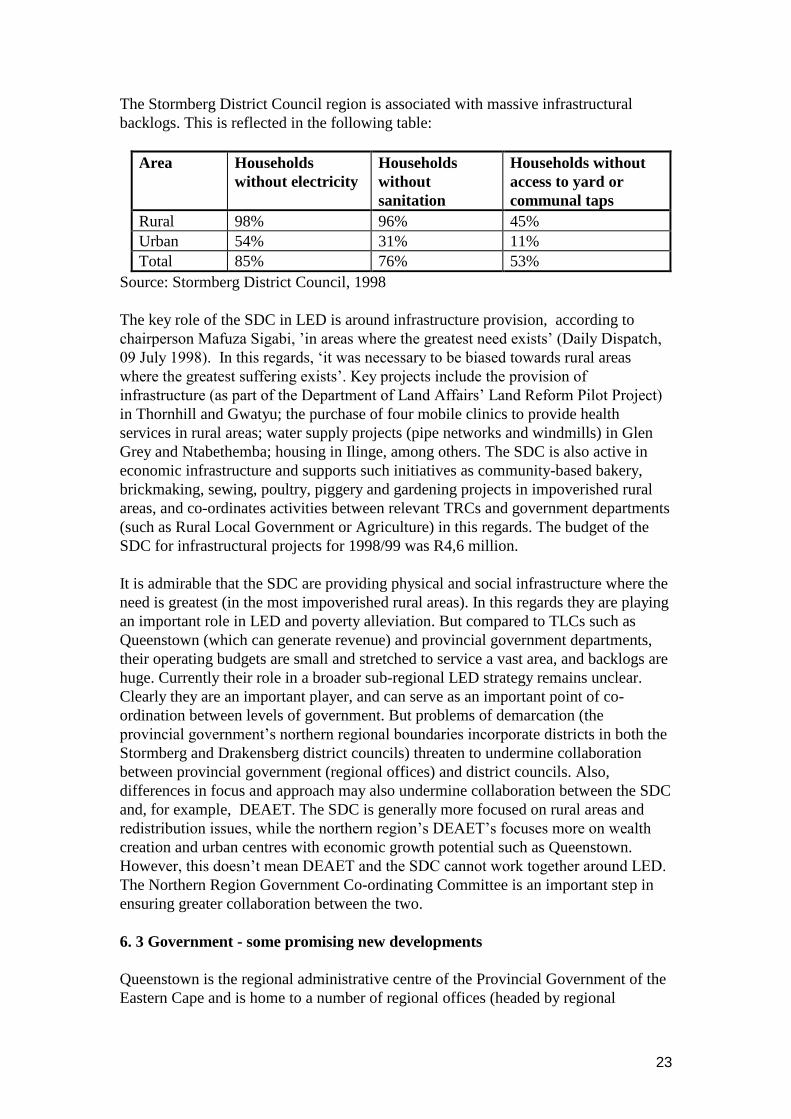
The Stormberg District Council region is associated with massive infrastructural
backlogs. This is reflected in the following table:
Area Households
without electricity
Households
without
sanitation
Households without
access to yard or
communal taps
Rural 98% 96% 45%
Urban 54% 31% 11%
Total 85% 76% 53%
Source: Stormberg District Council, 1998
The key role of the SDC in LED is around infrastructure provision, according to
chairperson Mafuza Sigabi, ’in areas where the greatest need exists’ (Daily Dispatch,
09 July 1998). In this regards, ‘it was necessary to be biased towards rural areas
where the greatest suffering exists’. Key projects include the provision of
infrastructure (as part of the Department of Land Affairs’ Land Reform Pilot Project)
in Thornhill and Gwatyu; the purchase of four mobile clinics to provide health
services in rural areas; water supply projects (pipe networks and windmills) in Glen
Grey and Ntabethemba; housing in Ilinge, among others. The SDC is also active in
economic infrastructure and supports such initiatives as community-based bakery,
brickmaking, sewing, poultry, piggery and gardening projects in impoverished rural
areas, and co-ordinates activities between relevant TRCs and government departments
(such as Rural Local Government or Agriculture) in this regards. The budget of the
SDC for infrastructural projects for 1998/99 was R4,6 million.
It is admirable that the SDC are providing physical and social infrastructure where the
need is greatest (in the most impoverished rural areas). In this regards they are playing
an important role in LED and poverty alleviation. But compared to TLCs such as
Queenstown (which can generate revenue) and provincial government departments,
their operating budgets are small and stretched to service a vast area, and backlogs are
huge. Currently their role in a broader sub-regional LED strategy remains unclear.
Clearly they are an important player, and can serve as an important point of co-
ordination between levels of government. But problems of demarcation (the
provincial government’s northern regional boundaries incorporate districts in both the
Stormberg and Drakensberg district councils) threaten to undermine collaboration
between provincial government (regional offices) and district councils. Also,
differences in focus and approach may also undermine collaboration between the SDC
and, for example, DEAET. The SDC is generally more focused on rural areas and
redistribution issues, while the northern region’s DEAET’s focuses more on wealth
creation and urban centres with economic growth potential such as Queenstown.
However, this doesn’t mean DEAET and the SDC cannot work together around LED.
The Northern Region Government Co-ordinating Committee is an important step in
ensuring greater collaboration between the two.
6. 3 Government - some promising new developments
Queenstown is the regional administrative centre of the Provincial Government of the
Eastern Cape and is home to a number of regional offices (headed by regional
24
directors). Included are the departments of Agriculture, Land Affairs, Public Works,
Health, Local Government and Housing, and Economic Affairs, Environment and
Tourism. All are involved in LED and poverty alleviation (in one way or another).
At the same time though, there is no informed and integrated strategy which co-
ordinates the activities of the different departments.
Three recent developments promise to alleviate the problem of co-ordination around
LED. The first is the Northern Region Government Co-ordinating Committee, an
initiative of the northern region DEAET and chaired by the head of the region’s
SMME Desk, which draws representatives from all government departments
represented in the region, as well as the Stormberg District Council. The idea behind
the structure is to keep each other informed about one another’s activities,
particularly with regards LED activities.
The second is the Regional Directors Forum, at which all regional directors meet
monthly to discuss issues of mutual concern, and facilitate co-ordination and avoid
duplication in each others work. This structure is not working as well as it could, since
directors are themselves often overstretched and do not have the time to report on the
discussions of meetings to their line directorates.
The third development which will hopefully better co-ordinate the activities of
government around LED is the Greater Queenstown Local Economic Development
Initiative. Unfortunately there has been too much talk about this initiative for some
time with nothing coming out of it, causing a number of parties to become
disillusioned with the process. Problems causing its delay were the disintegration of
the Queenstown LBSC, as well as disagreements over who should drive the process -
DEAET or the Queenstown TLC (and by association the DBSA). If the Queenstown
TLC were to drive the process, this might have very real implications around the issue
of demarcation and the inclusion (or non-inclusion) of towns such as Burgersdorp,
Cofimvaba, Cala, Molteno, and of course Whittlesea. This said, the regional office of
DEAET appear to be serious about resuscitating the initiative, and are in the process
of identifying relevant stakeholders who could contribute to developing strategies and
accessing resources for LED. More thought, however, needs to be given to the role of
the Stormsberg District Council in the LED strategy, particularly with regards co-
ordination between provincial and local government (TLCs and TRCs).
6.4 Civil society organisations - reflecting the need for organisational
development
As a major urban centre, Queenstown has a number of civil society organisations
involved broadly in LED and poverty alleviation. The largest and most significant of
these is the South African National Civic Organisation (SANCO), which organises in
both Mlungisi and Ezibeleni. Unlike in Whittlesea for example, the political climate
in Queenstown is harmonious with good relations between SANCO, the majority
political party (the ANC), and the TLC. There have been instances where tensions
have flared, notably over a housing project in Ezibeleni when SANCO and the TLC
traded criticisms over who was to blame for the housing delay. Tensions have also
escalated over the ‘drastic action campaign’ (to get residents to pay for services), but
SANCO have come out in support of the TLC and promoted restraint among their
25
members. Critics point to local level ‘elite-pacting’ between the ANC, SANCO, and
TLC (manifest for example in the recent appointment of the Mlungisi SANCO chair
to Director of Finance in the Stormberg District Council). The proposed downgrading
of services to meet levels of ‘affordability’ (see section 6.1) will no doubt be the
litmus test for the TLC, ANC and SANCO alliance.
With regards matters more directly economic, there are a number of business
organisations and associations in Queenstown, each representing discrete interests.
These include the (white-dominated) Queenstown Chamber of Business (branch of
SACOB), the (afrikaner) Afrikaanse Handelaars Instituut, the Queenstown Business
Forum, and the Small Business Development Foundation (focusing on SMMEs), a
hawker’s association, and until recently a black chamber of commerce (NAFCOC).
As is evident, the Queenstown business community remain divided (on the grounds of
race and ethnicity, size of enterprise etc). While such divisions in the business
community are understandable, clearly they run counter to the successful articulation
and implementation of an effective LED strategy for Queenstown. But at the same
time, it may not be desirable to try to develop one consensus approach to business
development. The needs of different business enterprises are somewhat divergent.
What might be useful is for organisational development intervention to build three
associations - one for informal traders/hawkers (which is already established), one for
SMMEs (the Small Business Development Foundation), and one for larger enterprises
(a chamber of business). In all instances, organisations must be oriented (or
reoriented) to reflect the needs and interests of historically disadvantaged
entrepreneurs.
Somewhat disconcerting is the fact that women are underepresented in business
organisations and political organisations in Queenstown. The role of women in
entrepreneurial activities in Queenstown and surrounding rural villages tends to be
confined to the informal sector, and to government-aided community development
projects such as the Primary School Nutrition Programme, and Department of Health
and Dept of Rural Local Government projects such as piggeries, bakeries, sewing
projects etc. While such projects are important in that they provide sustenance in a
context where few other economic opportunities exist, on their own they are not
enough. The empowerment of women can only happen through an affirmative support
programme that seeks to develop women’s organisational capacity (eg. through
building capacity in organisations such as the Sandisele Women’s Organisation), and
through targeted financial and business training support to ensure women attain
control over a greater proportion of productive assets. The economic empowerment of
women in Queenstown is something which can be taken up, for example, by the
proposed Greater Queenstown LED Initiative.