query-based metrics for evaluating and comparing document
TRANSCRIPT

Query-Based Metrics for Evaluatingand Comparing Document Schemas
Evandro Miguel Kuszera1,2(B), Letıcia M. Peres2(B),and Marcos Didonet Del Fabro2(B)
1 Federal University of Technology - Parana, Dois Vizinhos, PR, [email protected]
2 Federal University of Parana, Curitiba, PR, Brazil{lmperes,marcos.ddf}@inf.ufpr.br
Abstract. Document stores are frequently used as representation for-mat in many applications. It is often necessary to transform a set of datastored in a relational database (RDB) into a document store. There areseveral approaches that execute such translation. However, it is difficultto evaluate which target document structure is the most appropriate. Inthis article, we present a set of query-based metrics for evaluating andcomparing documents schemas against a set of existing queries, that rep-resent the application access pattern. We represent the target documentschema and the queries as DAGs (Directed Acyclic Graphs), which areused to calculate the metrics. The metrics allow to evaluate if a given tar-get document schema is adequate to answer the queries. We performeda set of experiments to calculate the metrics over a set of documentsproduced by existing transformation solutions. The metric results arerelated with smaller coding effort, showing that the metrics are effectiveto guide the choice of a target NoSQL document structure.
Keywords: RDBs · Document stores · Metrics · Evaluation
1 Introduction
Relational databases (RDB) are widely used to store data of several types ofapplications. However, they do not meet all requirements imposed by mod-ern applications [18]. These applications handle structured, semi-structured andunstructured data, and RDBs are not flexible enough, since they have a prede-fined schema. In these scenarios, NoSQL databases [16] emerged as an option.They differ from RDB in terms of architecture, data model and query language[16]. They are generally classified according to the data model used: document,column family, key-value or graph-based. These databases are called schema-free,since there is no need to define a schema before storing data. This flexibility facil-itates rapid application development and makes it possible to structure the datain different ways. One of the most used NoSQL format are document stores.
RDB and document stores will be used together for a long period of time,being necessary to investigate strategies to convert and migrate schema andc© Springer Nature Switzerland AG 2020S. Dustdar et al. (Eds.): CAiSE 2020, LNCS 12127, pp. 530–545, 2020.https://doi.org/10.1007/978-3-030-49435-3_33

QBM for Evaluating and Comparing Document Schemas 531
data between them. Different approaches have been presented to convert RDBto NoSQL document stores [4,8,9,17,20]. Some of them consider just the struc-ture of the RDB in the conversion process [17,20]. While others also considerthe access pattern of the application [4,8,9]. However, none of the approachesis concerned with the evaluation and the comparison of the output documentstructure against the existing queries that need to be adapted and then executed.Often, expert user knowledge is the only guarantee that the produced documentis appropriate.
The work from [5] presents eleven metrics to evaluate the structure of doc-ument oriented databases. These metrics were based on those proposed in [14]and [10] to evaluate XML schemas. Such evaluation is important to guide thechoice of an adequate document structure. However, the approach has no spe-cific metrics for assessing the queries access pattern against document structure.Despite not having a formal schema, a document has a structure used by thequeries to retrieve data. We consider that the document structure can be usedas an abstraction to represent a schema.
In this paper, we present a set of query-based metrics to evaluate a NoSQLdocument schema in relation to a set of queries that represent the applicationaccess patterns. We use DAGs (Directed Acyclic Graphs) to represent the queriesand the document schemas. DAGs as schema have already been used in a pre-vious approach to converting RDB to NoSQL nested models [11]. Since it ispossible to produce different data schemas in an RDB to NoSQL conversionscenario, it is important to have a procedure to choose the most appropriateone. To help with this, we show how to use the query-based metrics alone or incombination to evaluate and compare candidate NoSQL schemas.
We performed a set of experiments to validate the metrics, using as inputa set of NoSQL schemas generated from an existing RDB, and a set of queriespreviously defined on the same RDB. All NoSQL schemas were generated usingRDB to NoSQL conversion rules already proposed in the literature. After com-puting the metrics, we migrate the RDB data to a MongoDB instance, accordingto the schemas previously generated. Then, we measure the necessary query cod-ing effort/maintenance. The conversion showed that the metrics are effective toguide on the choice of an appropriate document structure.
The contributions of this paper are summarized as follows:
– A set of metrics to evaluate and compare document schema against a set ofqueries that represent the application access patterns, prior to the execu-tion of an RDB to document transformation.
– A query score QScore and a schema score SScore, enabling to combine relatedmetrics.
– A comparison of 4 different RDB to NoSQL document conversion approachesfrom the literature, through the query-based metrics and a set of previouslydefined queries.
The remainder of this paper is organized as follows: Sect. 2 presents back-ground about RDB to NoSQL conversion approaches and how we represent

532 E. M. Kuszera et al.
NoSQL document schemas as DAGs. In Sect. 3 we present our query-basedmetrics. Section 4 shows how to combine the query-based metrics to evaluateand compare NoSQL document schemas. Section 5 deals with experiments andresults. Related work is given in Sect. 6. Finally, conclusions and future work areprovided in Sect. 7.
2 Background
Different works present approaches for converting RDB to NoSQL document[4,8,9,17,20]. The works [17,20] are automatic solutions that receive as inputthe RDB metadata and E-R diagrams, respectively. [17] presents an algorithmthat considers the dependencies between tables and the number of PKs andFKs during the conversion process. [20] presents an algorithm that uses thedependencies between tables, however, the data nesting is performed only in theFK to PK direction.
The approaches [4,8,9] are semi-automatic. The user needs to provide addi-tional information about the RDB to guide the translation. In these approaches,in addition to the E-R diagram, the user provides a kind of table classifica-tion. This table classification is used to decide which tables should be embeddedtogether. The work from [4] develops an algorithm and four kinds of tables: main,subclass, relationship and common. The conversion algorithm uses this classifi-cation to nest the subclass and common tables in the main table. Relationshiptables are converted using references. The approach from [9] has a different clas-sification composed of four classes: codifier, simple entity, complex entity andN:N-link. Besides the classification, the user must provide the “table in focus”,that represents the target NoSQL entity. The algorithm builds a tree with therelated tables. Finally, in [8], they are based on the creation of tags to guidethe process. The user annotates the E-R diagram with tags (frequent join, mod-ify, insert and big size) that represent the data and query characteristics. Fromthese tags the algorithm decides to use embedded documents or references inthe conversion.
In a previous work, we created an approach to convert RDB to NoSQL nestedmodels [11]. We use a set of DAGs (Directed Acyclic Graphs) to capture thesource RDB and the target NoSQL document structure, which is an abstractionused to represent a NoSQL schema. Each DAG lists a set of RDB tables whichare transformed into one NoSQL entity (document structure). Through our app-roach we use the DAGs to represent the process of converting RDB to NoSQLdocument from the works cited at the beginning of this section.
A DAG is defined as G = (V,E), where the set of vertices V is related withthe tables of the RDB and the set of edges E with the relationships betweentables. The direction of the edges defines the transformation flow. Each DAGmay be seen as a tree, where the root vertex is the target entity. The path fromone leaf vertex to the root vertex defines one transformation flow. Each vertexcontains the metadata of its respective RDB table, including the table name,fields and primary key. The edge between two vertices encapsulates relationship

QBM for Evaluating and Comparing Document Schemas 533
data between two tables, including primary and foreign keys and which entityis on the one or many side of the relationship. Through the DAG, we specifythe de-normalization process from a set of related tables to produce a NoSQLentity. There are works with similar idea, but with different strategies [8,20].
Similarly, a NoSQL entity (document structure) is also represented by aDAG. The root vertex is the first level of the collection and the remaining ver-tices are the nested entities. The direction of the edges defines the directionof nesting between entities. Besides that, the edge encapsulates nesting typeinformation, including embedded objects or array of embedded objects types.Through a set of DAGs it is possible to represent a NoSQL schema, where eachDAG represents the structure of a collection. We define a NoSQL schema asS = {DAG1, ...,DAGn|DAGi ∈ C}, where C is the set of collections of S.
3 Query-Based Metrics
This section presents our query-based metrics. We define six metrics to measurethe coverage that a particular NoSQL document schema has in relation to aset of queries representing the application access pattern. The metrics are usedto identify which schema has the appropriate access pattern required by theapplication. First, we present the key definitions and terminologies required tointroduce the query-based metrics. Then, we present the set of metrics.
3.1 Queries and Paths
The following are the key definitions and terminologies used in this paper.
Query as DAG. A query is defined as q = (Vq, Eq), where Vq is a set ofvertices, representing the query tables, and Eq is a set of edges, representing thejoin conditions between query tables. The query q ∈ Q, where Q is the set ofqueries.
We define two rules to convert an SQL SELECT statement into a DAG. SQLstatements including sub-queries and full outer join clauses are not supported.
– Rule 1: if the statement has only one table, then a DAG with one vertexrepresenting the table is created.
– Rule 2: if the statement has two or more tables, then it is necessary to definewhich table is the root vertex of the DAG. After that, the other tables areadded to the DAG according to the join conditions of the statement.
To identify the join condition in Rule 2, we parse the SQL statement. Then,we apply one of the following subrules to determine which table is the rootvertex:
– Rule 2.1: if it is a left join, returns the leftmost table in the FROM clause.– Rule 2.2: if it is a right join, returns the rightmost table in FROM clause.– Rule 2.3: if it is an inner join, returns the first table in the FROM clause.

534 E. M. Kuszera et al.
Path, Sub Path and Indirect Path. We define the types of paths consideredin the metrics to evaluate the schemas and queries DAGs:
– Path: a path p is a sequence of vertices v1, v2, ..., vj , such that (vi, vi+1) ∈ Vq,1 ≤ i ≤ j−1, v1 is the root vertex and vj is the leaf vertex of the DAG. Thissequence of vertices may be called the path from the root vertex to the leafvertex.
– Sub Path: considering a path p = (v1, v2, ..., vk) and, for any i and j, suchthat 1 ≤ i ≤ j ≤ k, a subpath of p is defined as pij = (vi, vi+1, ..., vj), fromvertex i to vertex j.
– Indirect Path: Considering a path p = (v1, v2, ..., vk) and, for any i, y andj, such that 1 ≤ i ≤ y ≤ j ≤ k, an indirect path relative to p is definedas pind = (vi, vi+1, ..., vj), where ∃vy ∈ p : vy /∈ pind. That is, an indirectpath pind is the one where all its vertices and edges are contained in path p,but there are additional intermediate vertices in p that separate one or morevertices of pind.
In addition, to make the query-based metric definitions more clear, we usethe following terms: Vq, Vs and Vc are the vertex set of a given query, schemaand collection (or DAG), respectively. Pq, Ps and Pc are the path set (all pathsfrom root to leaves) of a given query, schema and collection, respectively.
3.2 Direct Edge Coverage
Direct Edge (1) measures query edge coverage against the edges of a given schemacollection, considering the direction of edges (e.g. a → b). Edq and Edc denote theset of query and collection edges considering the direction of the edges. Schemacoverage (2) is the maximum value found when applying DirectEdge metric foreach schema collection c ∈ C.
DirectEdge(c, q) = |(Edq ∩ Edc)|/|Edq| (1)
DirectEdge(q) = Max(C, q,DirectEdge) (2)
The function Max is a higher-order function that receives a set of elements(e.g., collection set C), the query q and the metric function (e.g., DirectEdge). Itapplies the metric for all elements of the collection and the query q and it returnsthe higher value. It is used in other metrics in the remaining of the paper.
3.3 All Edge Coverage
All Edge (3) measures edge coverage between the query and schema collection,regardless of edge direction (e.g. a → b or a ← b). Eq and Ec denote the queryand collection edges, respectively. Schema coverage (4) is the maximum valuefound when applying AllEdge metric for each schema collection (ci).
AllEdge(c, q) = |(Eq ∩ Ec)|/|Eq| (3)
AllEdge(q) = Max(C, q,AllEdge) (4)

QBM for Evaluating and Comparing Document Schemas 535
3.4 Path Coverage
The Path Coverage metric measures the coverage of query paths in relation tothe collection paths. A query may have one or more paths (e.g. q6 in the Fig. 3has two paths). Through the Path Coverage it is possible to measure the coverageof the query paths relative to the collection paths (5). The Path Coverage for allthe schema (6) is the maximum value found when applying the metric for eachcollection.
Path(c, q) = |(Pq ∩ Pc)|/|Pq| (5)
Path(q) = Max(C, q, Path) (6)
3.5 Sub Path Coverage
Through the Sub Path Coverage metric, it is checked if the query paths arepresent in the collection as subpaths (7). We define the existSubPath functionthat receives as parameters a query path (qp ∈ Pq) and a set of paths, wherethe set of paths is the paths of a given collection (Pc). The function returns 1if the query path was found or 0 if it was not found as a subpath. It is possibleto measure the sub path coverage of all the schema by applying the metric foreach collection (8). The result is the higher value returned.
existSubPath(qp, Pc) =
{1 found qp as subpath inPc
0 not found qp as subpath inPc
SubPath(c, q) =∑|Pq|
i=1 existSubPath(qpi, Pc)|Pq| (7)
SubPath(q) = Max(C, q, SubPath) (8)
3.6 Indirect Path Coverage
Through the Indirect Path metric, it is checked if the query paths are presentin the schema as indirect paths (as defined in Sect. 3.1). To find indirect pathsin the schema we define the function existIndPath, that receives as parametersthe query path (qp) and a set of collections’ paths (Pc). If there is an indirectpath in the collection that matches the query path, the function returns 1, oth-erwise it returns 0. In (9) we measure the indirect path coverage relative to thecollection level, and in (10) relative to the schema, by applying the metric foreach collection, where the largest value returned represents the schema coverage.
existIndPath(qp, Pc) =
{1 found qp as an indirect path inPc
0 not found qp as an indirect path inPc
536 E. M. Kuszera et al.
IndPath(c, q) =∑|Pq|
i=1 existIndPath(qpi, Pc)|Pq| (9)
IndPath(q) = Max(C, q, IndPath) (10)
3.7 Required Collections Coverage
The Required Collections (11) metric returns the smallest number of collectionsrequired to answer a given query. The function createCollectionPaths(q) returnsa set of paths that consists of collections that have the entities required to answerthe query.
ReqColls(q) = min(createCollectionPaths(q)) (11)
The metrics presented above enable to independently evaluate the queries.In the next section we describe how to combined them to provide a broaderevaluation.
4 Combining the Metrics
In this section we present how to combine the metrics for measuring the overallcoverage of a schema with respect to a set of input queries. First, it is necessaryto calculate a QScore, which denotes a score per metric, or per combination ofrelated metrics, per query. This score enables to set up weights to prioritize theimportance of specific metrics. Second, we calculate a SScore, which is a scorefor a set of queries over a given schema. The results are used to rank the inputschema. These scores are explained in the following sections.
4.1 Query Score (QScore)
The QScore yields a single value per metric, or a value that combines relatedmetrics. The score is calculated for a given metric and a given query qi. TheQScore for metrics DirEdge, AllEdge and ReqColls is the same value returnedby the metric:
QScore(DirEdge, q) = DirEdge(q) (12)
QScore(AllEdge, q) = AllEdge(q) (13)
QScore(ReqColls, q) = ReqColls(q) (14)
However, the QScore for metrics Path, Sub Path and Indirect Path is a uniquevalue and is namely as Paths. It returns the highest value among the three

QBM for Evaluating and Comparing Document Schemas 537
metrics, taking into account the depth of each path and an additional weight,as defined below:
pathv = Path(qi) ∗ wp (15)
subpathv = (SubPath(qi) ∗ wsp)/depthSP (qi) (16)
indpathv = (IndPath(qi) ∗ wip)/depthIP (qi) (17)
QScore(Paths, qi) = max(pathv, subpathv, indpathv) (18)
First, the metric value is weighted according to its path type, divided bythe smallest depth in which the root vertex of path is located in the schema.The depth is obtained by a specific function for each metric. The weights wp,wsp and wip are used to set up a priority between Path, Sub Path and IndirectPath metrics. The method for calculating QScore is inspired by the results of[6], where the authors state that the depth of the required data in the collectionand the need to access data stored at different levels of the collection producenegative impact. As the Path metric denotes the exact match between querypath and collection path (with depth = 1), one possibility is to set the wp withthe highest value, followed by smaller values for wsp and wip. In this way, schemaswith exact match are prioritized. Another aspect is related to data redundancythat NoSQL schemas may present: a query path can be found as a Path, SubPath, and Indirect Path in the schema. Then, by defining distinct weights andusing path depth, we can prioritize a particular type of path coverage. For betterreadability, we assign each calculation to a specific variable (15–17), which is thenused to calculate the QScore (18).
4.2 Schema Score (SScore)
SScore denotes the schema score for a given metric (except ReqColls) as thesum of the QScore values for all the queries, where each query qi has a specificweight wi, and the sum of all wi is equal to 1. Following the same idea of theQScore, it has a single value for Path, SubPath, and IndPath, which is the sumof its corresponding QScore. It is defined below:
SScore(metric,Q) =|Q|∑i=1
QScore(metric, qi) ∗ wi (19)
The SScore for ReqColls metric is a ratio between the number of queriesand the number of collections required to answer them. A schema that answerseach input query through only one collection has SScore equal to 1. It decreaseswhen the number of collections increases. It is defined as follows:
NC =|Q|∑i=1
QScore(ReqColls, qi)

538 E. M. Kuszera et al.
SScore(ReqColls,Q) =|Q|NC
(20)
NC is the number of collections required to answer all input queries, whichis the sum of all QScore. The expression for calculating SScore above is basedon the schema minimality metric presented in [3].
These scores show the coverage provided by the schema for each query, wherewe can identify which queries require the most attention or are not covered bythe schema. The SScore field provides an overview of how well the schema fitsthe query set. Since the metrics are not independent, we do not define a singleexpression to calculate the overall score of the schema. The goal here is to providethe user with a methodology for evaluating NoSQL schema using the proposedmetrics. Still, the user can use the metrics independently, according to theirneeds and application requirements.
5 Experimental Evaluation
In this section we present the experiments to evaluate our query-based metricsin an RDB to NoSQL documents conversion scenario, where different NoSQLschemas are generated from the input RDB. In order to generate the candidateNoSQL schemas we select four RDB to NoSQL conversion approaches from theliterature. The input queries represent the application’s access pattern over theRDB, and are then known a priori. The goal is to show how to use the query-based metrics to assist the user in the process of evaluation, comparison andselection of the appropriate NoSQL schema before executing the data migration.In the following sections we detail the execution of each of these steps.
5.1 Creating NoSQL Schemas from Conversion Approaches
We select four RDB to NoSQL document approaches from the literature, thatdefine different ways to convert relational data to nested data [8,9,17,20]. Theseapproaches were chosen because they contain the most diverse set of translationrules. We apply the translation rules on the RDB of Fig. 1 to generate a set ofNoSQL schemas using our DAG approach to represent them. So, we create oneschema for each approach and set a label from A to D to identify them.
Figure 2 shows the graphical representation of the generated NoSQL schemas.The vertices with gray background color represent the collections of the schemas(root vertex). We can see that schemas differ in number of collections andarrangement of entities. As a result, we have all approaches represented by thesame format, which allows us to evaluate and compare them objectively.
5.2 Defining the Evaluation Scenario
The schemas are evaluated considering the best matching between the queriesaccess patterns and the schema structure. We use Path, SubPath, IndPath,

QBM for Evaluating and Comparing Document Schemas 539
Fig. 1. Input RDB
Fig. 2. Generated NoSQL schemas by approach
DirEdge, AllEdge and ReqColls metrics to check if the entities are (or not) nestedaccording to the access pattern. To calculate SScore and QScore, we assigned thesame weight for all queries and for all paths metrics (wp = 1;wsp = 1;wip = 1).This means that all queries and types of path coverage have the same priority.The depth where query path starts is also considered in the calculation, priori-tizing schemas where the entities are closest to the root of the DAG. However,the user can define different weights and turn off the depth of path, accordingto their needs.
The seven queries used to evaluate the schemas are presented in Fig. 3. Thesequeries have been chosen because they contain different access patterns. We showthe queries in SQL and also as DAG paths, which are produced according to thetranslation rules from Sect. 3.1. Each query DAG contains the data path of eachSQL statement, but alternative DAGs could be built to represent different accesspatterns.

540 E. M. Kuszera et al.
Fig. 3. Input queries used to evaluate the NoSQL schemas
5.3 Experimental Results
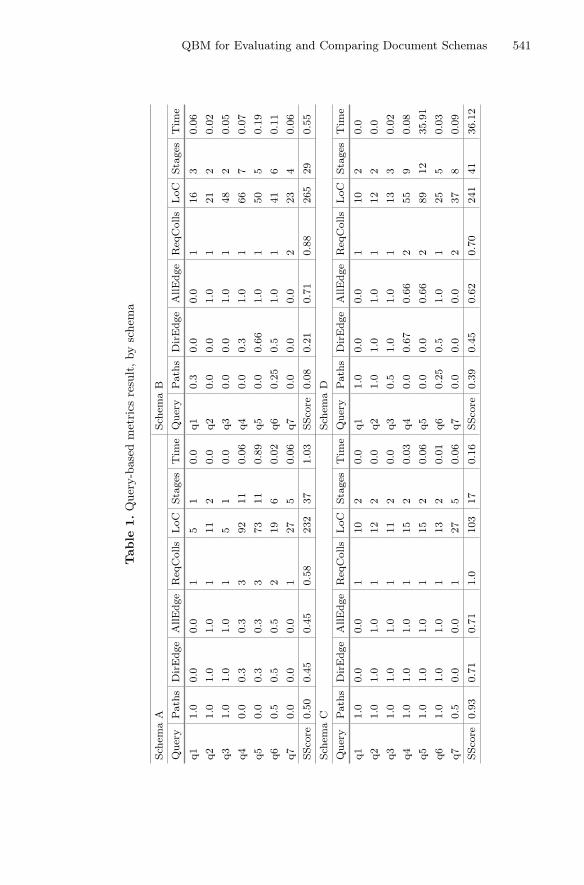
In this section we present the metrics result and the impact on query codingeffort for each schema1. Finally, preliminary results on query execution time arepresented. Table 1 summarizes all results and is used by the sections below.
Metrics Result. Table 1 shows the QScore for the Paths, DirEdge, AllEdgeand ReqColls metrics, by query. Paths is calculating taking into account thePath, SubPath, and IndPath metrics (see Sect. 4.1). The SScore is also shown.Considering the paths coverage, schema C has the highest score 0.93. This meansC best matches the access pattern of the query set. Following are the schemasA, D and B, with schema B having the worst SScore = 0.08.
We use path metrics to identify which schema best covers the queries. Forinstance, in schema C, the queries q1 − q6 are 100% covered by the schemathrough the Path, SubPath or IndPath metrics. Only q7 is penalized for startingat level 2 of the Orders collection, resulting in lower QScore (0.5). In contrast,in the schema B we identify only the queries q1 and q6 that match paths metrics,but both queries are penalized by the level where they are located in the schema.For example, to answer q1 is necessary traverse the Orderlines collection tofind Customers entity, at level 3. If we look at schema B, we notice that theOrderlines, Inventory, and Reorder collections are inverted in relation to thequery access pattern. As a result, there is no coverage for the path metrics forqueries q2 − q5 and q7.
Using the metrics DirEdge and AllEdge, we verify the degree to whichthe entities in the schema are related to each other, as required by the accesspattern of the queries. For example, schema C has the highest DirEdge score1 The tool implemented and all the results are available for download at: https://
github.com/evandrokuszera/nosql-query-based-metrics.
QBM for Evaluating and Comparing Document Schemas 541
Table
1.Q
uer
y-b
ase
dm
etri
csre
sult
,by
schem
a
Sch
emaA
Sch
emaB
Query
Path
sDirEdge
AllEdge
Req
Colls
LoC
Stages
Tim
eQuery
Path
sDirEdge
AllEdge
Req
Colls
LoC
Stages
Tim
e
q1
1.0
0.0
0.0
15
10.0
q1
0.3
0.0
0.0
116
30.06
q2
1.0
1.0
1.0
111
20.0
q2
0.0
0.0
1.0
121
20.02
q3
1.0
1.0
1.0
15
10.0
q3
0.0
0.0
1.0
148
20.05
q4
0.0
0.3
0.3
392
11
0.06
q4
0.0
0.3
1.0
166
70.07
q5
0.0
0.3
0.3
373
11
0.89
q5
0.0
0.66
1.0
150
50.19
q6
0.5
0.5
0.5
219
60.02
q6
0.25
0.5
1.0
141
60.11
q7
0.0
0.0
0.0
127
50.06
q7
0.0
0.0
0.0
223
40.06
SSco
re0.50
0.45
0.45
0.58
232
37
1.03
SSco
re0.08
0.21
0.71
0.88
265
29
0.55
Sch
emaC
Sch
emaD
Query
Path
sDirEdge
AllEdge
Req
Colls
LoC
Stages
Tim
eQuery
Path
sDirEdge
AllEdge
Req
Colls
LoC
Stages
Tim
e
q1
1.0
0.0
0.0
110
20.0
q1
1.0
0.0
0.0
110
20.0
q2
1.0
1.0
1.0
112
20.0
q2
1.0
1.0
1.0
112
20.0
q3
1.0
1.0
1.0
111
20.0
q3
0.5
1.0
1.0
113
30.02
q4
1.0
1.0
1.0
115
20.03
q4
0.0
0.67
0.66
255
90.08
q5
1.0
1.0
1.0
115
20.06
q5
0.0
0.0
0.66
289
12
35.91
q6
1.0
1.0
1.0
113
20.01
q6
0.25
0.5
1.0
125
50.03
q7
0.5
0.0
0.0
127
50.06
q7
0.0
0.0
0.0
237
80.09
SSco
re0.93
0.71
0.71
1.0
103
17
0.16
SSco
re0.39
0.45
0.62
0.70
241
41
36.12

542 E. M. Kuszera et al.
and AllEdge score, which means that it has the closest access pattern to thequery set. In contrast, schema B has the highest AllEdge score (same valueas schema C) and the smallest DirEdge score, which means that entities arerelated to each other in the schema B according to the query structure, butthe relationship direction is inverted, so it does not correspond properly to theaccess pattern of queries. For example, the collection Orderlines has part ofthe relationships between entities corresponding to the q4 − q6 query structure(DirEdge > 0), but for the remaining queries, schema B is inverted.
For ReqColls metric, the schema C has the best result, with SScore = 1.0.This means that all queries are answered accessing a single collection. Then, theschemas are ranked as: C, B, D and A. This result is due to schema C beingthe most redundant schema, in which the three collections encapsulate all RDBentities, but using a different nesting order.
Query Coding Effort. We measured the impact on query coding effort foreach schema, to asses if it is related with metrics results. To measure the codingeffort, we use the number of lines of code (LoC) required to manually implementthe query. While they could be automatically generated, they would need to bemaintained during the application life cycle. The goal here is to check whetherhigh SScore schemas have less query implementation complexity.
We created four target database instances in MongoDB2 according toschemas A, B, C and D. MongoDB was selected because it is a widely useddocument store. We use our Metamorfose framework to migrate data from RDBto MongoDB. After that, we implement all queries of Fig. 3 using the Mon-goDB aggregation pipeline framework, that uses the concept of data processingpipelines. Each pipeline consists of stages, where each stage transforms the doc-uments what goes through it.
The LoC for each query was obtained by the MongoDB explain command,with a standardized query format, facilitating line count. In addition to LoC, wecounted the number of stages used in the pipeline to fetch and project documentsaccording to the query DAG structure. Table 1 shows the LoC of each query byschema. Considering the total LoC per schema, schema C has the smallest value(103), followed by schemas A, D, and B. When considering the number of querypipelines, schema C has the lowest value, followed by schemas B, A, and D. Inthis case, B takes second place because its structure has no nested arrays, so noextra stages are required to unwind arrays of documents.
Analyzing SScore results for Paths, DirEdge, and AllEdge metrics togetherwith the aggregate LoC and Stages, we can verify that schemas with higherPaths and DirEdge scores require less lines of code when implementing queries.For metric AllEdge this is not always true. This metric shows whether theentities in the schema are related as the query access pattern. However, therelationship may exist, but the direction may not match the pattern specified inthe query (case of schema B). In this case, more effort is required to project thedata according to the query pattern.2 https://www.mongodb.com.

QBM for Evaluating and Comparing Document Schemas 543
To summarize, the expert user can evaluate and compare schema optionsbefore executing the translation from an RDB to a NoSQL document stores, byapplying the set of defined metrics and scores. Through these metrics we checkif the entities are (or not) nested according to the query access pattern. We alsocheck which queries need to fetch data from different collections, so the user candecide which schemas to prioritize. We generated a set of queries and the LoCmetrics reflect the results of our metrics.
Query Execution Time. We measured query execution time to verify if it isrelated with the metrics results. The last column of Table 1 shows the averageexecution time in seconds (each query was executed 30x). It is worth notingthat query time for q1 − q3 returned zero for some schemas because the searchfield is the index of collection. The results show that schema C is the mostadapted, followed by schemas B, A, and D. Schema B is the second one, eventhough it did not match the queries access pattern. The reason is due to theexecution time of q5 for schemas A and D. For both schemas, it is necessary toperform the MongoDB lookup operation (similar to SQL left join). In A, thereis a lookup operation between Orders, Products and Customers, and in Dbetween Products and Customers. In both cases, the fields used in the lookupare located in nested arrays, which has significant impact, especially for schemaD, where the lookup field is located inside two nested object arrays. However,these results are preliminary and need further investigation, where we plan toextend our metrics set to consider the impact on data nesting, document size,collection size, and the use of indexes have on query performance.
6 Related Work
Different works present formal definitions for NoSQL document data models[1,2,19]. In [2], they present NoAM, the NoSQL Abstract Model that use as themain modelling unit the concept of aggregates (set of entities) and is driven byapplication use cases (functional requirements). [1] and [19] present approachesthat transform a conceptual model (UML) into NoSQL physical model. Theseapproaches consist in methodologies for defining NoSQL schemas according touser-supplied parameters. However, they do not provide means to evaluate theschema produced. Our approach aims to evaluate the NoSQL schema in relationto a set of queries that represent the access pattern of the application.
There are works defining optimized schemas for column-family [7,13] anddocument [8,12,15] oriented NoSQL databases. In [7] they present Graph basedPartition Algorithm (GPA) approach, that groups high affinity schema attributesin the same column family to avoid loading unnecessary data to answer queries.In a similar way, [13] describes a cost-based approach to schema design thatrecommends a column-family NoSQL schema suitable for the application queries.The authors of [12] and [8] present a conversion approach for generating NoSQLdocument logical schema considering a previously provided conceptual modeland the expected workload of the application. Our query-based metrics approachcan be used to evaluate and compare the output schemas of these works.

544 E. M. Kuszera et al.
Considering the utilization of metrics, the work from [5] presents a metricset to evaluate schemas of NoSQL document databases. It was based on theworks [14] and [10], that present structural metrics to evaluate XML documents.Eleven structural metrics are defined to evaluate NoSQL Document schemas andto assist the user in the process of selecting the most appropriate schema. Ourwork is partially inspired by [5]. The way the authors represent the NoSQLschema is similar to our approach based on DAGs. However, our approach hasa different purpose, which is to evaluate and compare NoSQL schemas basedon queries that represent the application access pattern instead of evaluatingonly the schema structure. To the best of our knowledge, our work is the firstthat presents a set of query-base metrics used to evaluate and compare NoSQLdocument schemas using a set of queries.
7 Conclusions
We presented a solution to evaluate how adequate a NoSQL document schema iswith respect to a set of queries representing the application access patterns. Ourapproach is used as a guide on the choice of the most adequate target documentschema in a scenario of RDB to NoSQL document transformation. The queriesand the set of target schemas are represented as DAGs.
We define a set of query-based metrics, which are calculated based on theinput DAGs (queries and schemas). The metrics enable to identify how the targetdocument schema covers the input original queries. The metrics can be analyzedindividually, or collectively, using a score per metric (QScore), or a score perschema (SScore), enabling specialized analysis.
We applied the metrics on a set of schemas produced by existing RDB toNoSQL transformations solutions. The evaluation of these different transforma-tion approaches was only possible because we adopted the DAGs as a commonunified format. This also means that the approach is technology independent.We executed all transformation scenarios, to confirm that the metrics can berelated to the coding effort of the queries, with respect to the LoC measure. Inaddition, if the choice of a given output schema is not possible, the metrics mayguide the re-factoring of the existing queries. As future work, we aim to extendthe evaluation to integrate with cost-based approaches.
References
1. Abdelhedi, F., Ait Brahim, A., Atigui, F., Zurfluh, G.: MDA-based approach forNoSQL databases modelling. In: Bellatreche, L., Chakravarthy, S. (eds.) DaWaK2017. LNCS, vol. 10440, pp. 88–102. Springer, Cham (2017). https://doi.org/10.1007/978-3-319-64283-3 7
2. Bugiotti, F., Cabibbo, L., Atzeni, P., Torlone, R.: Database design for NoSQLsystems. In: Yu, E., Dobbie, G., Jarke, M., Purao, S. (eds.) ER 2014. LNCS,vol. 8824, pp. 223–231. Springer, Cham (2014). https://doi.org/10.1007/978-3-319-12206-9 18

QBM for Evaluating and Comparing Document Schemas 545
3. Cherfi, S.S.-S., Akoka, J., Comyn-Wattiau, I.: Conceptual modeling quality - fromEER to UML schemas evaluation. In: Spaccapietra, S., March, S.T., Kambayashi,Y. (eds.) ER 2002. LNCS, vol. 2503, pp. 414–428. Springer, Heidelberg (2002).https://doi.org/10.1007/3-540-45816-6 38
4. Freitas, M.C.d., Souza, D.Y., Salgado, A.C.: Conceptual mappings to convert rela-tional into NoSQL databases. In: Proceedings of the 18th ICEIS (2016)
5. Gomez, P., Roncancio, C., Casallas, R.: Towards quality analysis for documentoriented bases. In: Trujillo, J.C., et al. (eds.) ER 2018. LNCS, vol. 11157, pp.200–216. Springer, Cham (2018). https://doi.org/10.1007/978-3-030-00847-5 16
6. Gomez, P., Casallas, R., Roncancio, C.: Data schema does matter, even in NoSQLsystems! In: 2016 IEEE Tenth RCIS, pp. 1–6, June 2016
7. Ho, L., Hsieh, M., Wu, J., Liu, P.: Data partition optimization for column-familyNoSQL databases. In: 2015 IEEE International Conferene on SmartCity, pp. 668–675 (2015)
8. Jia, T., Zhao, X., Wang, Z., Gong, D., Ding, G.: Model transformation and datamigration from relational database to MongoDB. In: IEEE BigData, pp. 60–67(2016)
9. Karnitis, G., Arnicans, G.: Migration of relational database to document-orienteddatabase: structure denormalization and data transformation. In: 2015 7th ICCI-CSN, pp. 113–118 (2015)
10. Klettke, M., Schneider, L., Heuer, A.: Metrics for XML document collections. In:Chaudhri, A.B., Unland, R., Djeraba, C., Lindner, W. (eds.) EDBT 2002. LNCS,vol. 2490, pp. 15–28. Springer, Heidelberg (2002). https://doi.org/10.1007/3-540-36128-6 2
11. Kuszera, E.M., Peres, L.M., Fabro, M.D.D.: Toward RDB to NoSQL: transformingdata with metamorfose framework. In: Proceedings of the 34th ACM/SIGAPPSymposium on Applied Computing, SAC 2019, pp. 456–463 (2019)
12. de Lima, C., dos Santos Mello, R.: A workload-driven logical design approach forNoSQL document databases. In: Proceedings of the 17th iiWAS (2015)
13. Mior, M.J., Salem, K., Aboulnaga, A., Liu, R.: NoSE: schema design for NoSQLapplications. In: 2016 IEEE 32nd ICDE, pp. 181–192 (2016)
14. Pusnik, M., Hericko, M., Budimac, Z., Sumak, B.: Xml schema metrics for qualityevaluation. Comput. Sci. Inf. Syst. 11, 1271–1289 (2014)
15. Reniers, V., Van Landuyt, D., Rafique, A., Joosen, W.: Schema design supportfor semi-structured data: finding the sweet spot between NF and De-NF. In: 2017IEEE International Conference on Big Data (Big Data), pp. 2921–2930 (2017)
16. Sadalage, P.J., Fowler, M.: NoSQL Distilled: A Brief Guide to the Emerging Worldof Polyglot Persistence, 1st edn. Addison-Wesley Professional, Boston (2012)
17. Stanescu, L., Brezovan, M., Burdescu, D.D.: Automatic mapping of MySQLdatabases to NoSQL MongoDB. In: 2016 FedCSIS, pp. 837–840, September 2016
18. Stonebraker, M., Madden, S., Abadi, D.J., Harizopoulos, S., Hachem, N., Helland,P.: The end of an architectural era (it’s time for a complete rewrite). In: Proceedingsof 33rd VLDB, University of Vienna, Austria, 23–27 September 2007, pp. 1150–1160 (2007)
19. Li, X., Ma, Z., Chen, H.: QODM: a query-oriented data modeling approach fornosql databases. In: 2014 IEEE WARTIA, pp. 338–345 (2014)
20. Zhao, G., Lin, Q., Li, L., Li, Z.: Schema conversion model of SQL database toNoSQL. In: 2014 Ninth 3PGCIC, pp. 355–362 (2014)