quick facts: the pork industry at a glance
TRANSCRIPT

For the latest updates visit pork.org or call the Pork Checkoff Service Center (800) 456-PORK.
Th e Pork Industry at a Glance
For the latest updates, visit pork.org or call the Pork Checkoff Service Center (800) 456-7675.
The Pork Industry at a Glance
Quick Facts
3
Chris Novak National Pork Board CEO
Welcome...
Thank you for your interest in learning more about the dynamic U.S. Pork Industry through Quick Facts, a Pork Checkoff publication. As you’ll see in the following pages, the story of pork production in America offers a unique and fascinating look at how modern livestock production has evolved. While the economies of scale are unlike those of past decades, the commitment of today’s pork producers remains unchanged – to provide their communities and the world with safe, wholesome and sustainable sources of high-quality pork.
For 25 years, the Pork Checkoff has worked successfully to advance the pork industry through promotion, research and consumer information programs. Through these efforts, U.S. pork producers continue to lead agriculture in the adoption of new technologies and have achieved record-high productivity. For example, output per breeding animal has more than doubled in the past 30 years, while the U.S. breeding herd has been reduced by more than 50 percent. This tremendous improvement in productivity has translated into a continued good value to consumers who purchase pork.
Despite the ongoing pursuit of efficiency by today’s pork producers, the industry continues to face substantial challenges in the complex, global food system. Regardless of these pressures, however, producers of all sizes and types of operations continue their dedication to creating a high-quality ideal protein source that’s produced in an environmentally friendly and humane manner. The industry’s We Care initiative underscores this enduring commitment.
For more information, visit the Pork Checkoff’s website at pork.org or call the Pork Checkoff Service Center at (800) 456-7675.
Cordially,

4
Quick Facts
5Table of Contents
Table of Contents
Quick Facts
Pork Checkoff . . . . . . . . . . . . . . . . . . . . . . . . . . . . . 7 - 8
Frequently Asked Questions . . . . . . . . . . . . 9 - 12
Did You Know? . . . . . . . . . . . . . . . . . . . . . . . . . . 13 - 16 Pork Facts . . . . . . . . . . . . . . . . . . . . . . . . . . . . . . . 17 - 38 Pork is the world’s most widely eaten meat . . . . . . 17 How many meals come from one pig . . . . . . . . . . . . 18 In-home pork consumption by type . . . . . . . . . . . . 19 Fresh vs. processed in-home pork consumption . . 20 In-home total pork consumption . . . . . . . . . . . . . . . 21 Pork No. 1 in in-home protein eatings. . . . . . . . . . . 22 Annual in-home pork eatings per capita . . . . . . . . . 23 Fresh vs. processed in-home pork consumption . . 23 Pork consumption by age and gender . . . . . . . . . . . 24 Growth in number of menued pork items. . . . . . . . 25 Pork items on restaurant menus . . . . . . . . . . . . . . . . 26 Pork use by meal occasion . . . . . . . . . . . . . . . . . . . . . 27 Ham lunchmeat, sausage, bacon and hot dogs are each consumed regularly by roughly one-third of the population . . . . . . . . . . . . . . . . . . 27 Percentage of processed pork eatings . . . . . . . . . . . . 28 The lowdown on lean cuts . . . . . . . . . . . . . . . . . . . . . 29 The power of pork for healthy eating . . . . . . . . . . . . 30 Ham still No. 1 in-home lunch sandwich . . . . . . . . 31 How to carve a ham . . . . . . . . . . . . . . . . . . . . . . . . . . . 31 Making sense of the meatcase . . . . . . . . . . . . . . . . . . 32 Cues for the conscientious cook . . . . . . . . . . . . . . . . 33 Pork cooking times and temperatures . . . . . . . . . . . 34 Convenience drives the dinner menu . . . . . . . . . . . . 35 Everything but the oink . . . . . . . . . . . . . . . . . . . 36 - 37 Know your pork cuts . . . . . . . . . . . . . . . . . . . . . . . . . . 38 The History of Pork . . . . . . . . . . . . . . . . . . . . . 39 - 40
Timeline . . . . . . . . . . . . . . . . . . . . . . . . . . . . . . . . . . 41 - 46
Pork Production Today . . . . . . . . . . . . . . . . . 47 - 60 Types of operations . . . . . . . . . . . . . . . . . . . . . . . 47 - 49 Symbol III . . . . . . . . . . . . . . . . . . . . . . . . . . . . . . . . . . . 48 Genetics for leaner pork . . . . . . . . . . . . . . . . . . . . . . . 49 Swine production systems . . . . . . . . . . . . . . . . . 50 - 54 Animal care . . . . . . . . . . . . . . . . . . . . . . . . . . . . . . 54 - 56 We Care initiative . . . . . . . . . . . . . . . . . . . . . . . . . . . . 56
Education programs for swine care . . . . . . . . . 57 - 59 Marketing . . . . . . . . . . . . . . . . . . . . . . . . . . . . . . . 59 - 60
Environment . . . . . . . . . . . . . . . . . . . . . . . . . . . . . 61 - 70 Manure and nutrient management . . . . . . . . . . 61 - 64 Water quality . . . . . . . . . . . . . . . . . . . . . . . . . . . . . . . . 64 Odor management . . . . . . . . . . . . . . . . . . . . . . . . . . . . 65 Air quality emissions . . . . . . . . . . . . . . . . . . . . . . . . . . 66 Pork industry’s carbon footprint . . . . . . . . . . . . 67 - 69 Community and neighbors . . . . . . . . . . . . . . . . 69 - 70 Environmental Stewards . . . . . . . . . . . . . . . . . . . . . . . 70 Public Health . . . . . . . . . . . . . . . . . . . . . . . . . . . . 71 - 77 Antibiotic resistance . . . . . . . . . . . . . . . . . . . . . . 71 - 73 Zoonotic diseases . . . . . . . . . . . . . . . . . . . . . . . . . 73 - 74 MRSA . . . . . . . . . . . . . . . . . . . . . . . . . . . . . . . . . . . 74 - 76 Community respiratory health . . . . . . . . . . . . . 76 - 77
Pork Safety . . . . . . . . . . . . . . . . . . . . . . . . . . . . . . 79 - 80 Stats . . . . . . . . . . . . . . . . . . . . . . . . . . . . . . . . . . . . . 81 - 114 Structure and Productivity Profits/losses, Iowa farrow-to-finish hog operations . . . . . . . . . . . . . . . . . . . . . . . . . . . 81 Farrow-to-finish production cost & nearby corn futures . . . . . . . . . . . . . . . . . . . . . . . . . . . . . 81 U.S. pig production density . . . . . . . . . . . . . . 82 - 83 America’s top 100 pig counties . . . . . . . . . . . . . . . 84 State rankings by inventory . . . . . . . . . . . . . . . . . . 85 U.S. hogs and pigs inventory, 2007 . . . . . . . . . . . . 86 Change in inventory, 2002 to 2007 . . . . . . . . . . . . 87 Number of hog operations by inventory size . . . 88 Number of U.S. hog operations . . . . . . . . . . . . . . 89 U.S. hog operations by size groups and percent of inventory . . . . . . . . . . . . . . . . . . 90 Number of operations by size group, selected states and United States . . . . . . . . . . . 90 Market share by operation size . . . . . . . . . . . . . . . 91 Number, percent and market share of U.S. operations by size . . . . . . . . . . . . . . . . . . . . . . . . 91 Quarterly U.S. commercial hog slaughter . . . . . . 92 Quarterly U.S. commercial pork production . . . 92 U.S. breeding herd and production . . . . . . . . . . . 93 U.S. breeding herd, quarterly. . . . . . . . . . . . . . . . . 93 U.S. pigs saved per litter . . . . . . . . . . . . . . . . . . . . . 93

5Table of Contents
Table of Contents
Quick Facts
Pork Checkoff . . . . . . . . . . . . . . . . . . . . . . . . . . . . . 7 - 8
Frequently Asked Questions . . . . . . . . . . . . 9 - 12
Did You Know? . . . . . . . . . . . . . . . . . . . . . . . . . . 13 - 16 Pork Facts . . . . . . . . . . . . . . . . . . . . . . . . . . . . . . . 17 - 40 Pork is the world’s most widely eaten meat . . . . . . 17 How many meals come from one pig . . . . . . . . . . . . 18 In-home pork consumption by type . . . . . . . . . . . . 19 Fresh vs. processed in-home pork consumption . . 20 In-home total pork consumption . . . . . . . . . . . . . . . 21 Pork No. 1 in in-home protein eatings. . . . . . . . . . . 22 Annual in-home pork eatings per capita . . . . . . . . . 23 Fresh vs. processed in-home pork consumption . . 23 Pork consumption by age and gender . . . . . . . . . . . 24 Growth in number of menued pork items. . . . . . . . 25 Pork items on restaurant menus . . . . . . . . . . . . . . . . 26 Pork use by meal occasion . . . . . . . . . . . . . . . . . . . . . 27 Ham lunchmeat, sausage, bacon and hot dogs are each consumed regularly by roughly one-third of the population . . . . . . . . . . . . . . . . . . 27 Percentage of processed pork eatings . . . . . . . . . . . . 28 The lowdown on lean cuts . . . . . . . . . . . . . . . . . . . . . 29 The power of pork for healthy eating . . . . . . . . . . . . 30 Ham still No. 1 in-home lunch sandwich . . . . . . . . 31 How to carve a ham . . . . . . . . . . . . . . . . . . . . . . . . . . . 31 Making sense of the meatcase . . . . . . . . . . . . . . . . . . 32 Cues for the conscientious cook . . . . . . . . . . . . . . . . 33 Pork cooking times and temperatures . . . . . . . . . . . 34 Convenience drives the dinner menu . . . . . . . . . . . . 35 Everything but the oink . . . . . . . . . . . . . . . . . . . . 36 -37 Know your pork cuts . . . . . . . . . . . . . . . . . . . . . . . . . . 38 The History of Pork . . . . . . . . . . . . . . . . . . . . . 39 - 40
Timeline . . . . . . . . . . . . . . . . . . . . . . . . . . . . . . . . . . 41 - 46
Pork Production Today . . . . . . . . . . . . . . . . . 47 - 60 Types of operations . . . . . . . . . . . . . . . . . . . . . . . 47 - 49 Symbol III . . . . . . . . . . . . . . . . . . . . . . . . . . . . . . . . . . . 48 Genetics for leaner pork . . . . . . . . . . . . . . . . . . . . . . . 49 Swine production systems . . . . . . . . . . . . . . . . . 50 - 54 Animal care . . . . . . . . . . . . . . . . . . . . . . . . . . . . . . 54 - 56 We Care initiative . . . . . . . . . . . . . . . . . . . . . . . . . . . . 56
Education programs for swine care . . . . . . . . . 57 - 59 Marketing . . . . . . . . . . . . . . . . . . . . . . . . . . . . . . . 59 - 60
Environment . . . . . . . . . . . . . . . . . . . . . . . . . . . . . 61 - 70 Manure and nutrient management . . . . . . . . . . 61 - 64 Water quality . . . . . . . . . . . . . . . . . . . . . . . . . . . . . . . . 64 Odor management . . . . . . . . . . . . . . . . . . . . . . . . . . . . 65 Air quality emissions . . . . . . . . . . . . . . . . . . . . . . . . . . 66 Pork industry’s carbon footprint . . . . . . . . . . . . 67 - 69 Community and neighbors . . . . . . . . . . . . . . . . 69 - 70 Environmental Stewards . . . . . . . . . . . . . . . . . . . . . . . 70 Public Health . . . . . . . . . . . . . . . . . . . . . . . . . . . . 71 - 77 Antibiotic resistance . . . . . . . . . . . . . . . . . . . . . . 71 - 73 Zoonotic diseases . . . . . . . . . . . . . . . . . . . . . . . . . 73 - 74 MRSA . . . . . . . . . . . . . . . . . . . . . . . . . . . . . . . . . . . 74 - 76 Community respiratory health . . . . . . . . . . . . . 76 - 77
Pork Safety . . . . . . . . . . . . . . . . . . . . . . . . . . . . . . 79 - 80 Stats . . . . . . . . . . . . . . . . . . . . . . . . . . . . . . . . . . . . . 81 - 114 Structure and Productivity Profits/losses, Iowa farrow-to-finish hog operations . . . . . . . . . . . . . . . . . . . . . . . . . . . 81 Farrow-to-finish production cost & nearby corn futures . . . . . . . . . . . . . . . . . . . . . . . . . . . . . 81 U.S. pig production density . . . . . . . . . . . . . . 82 - 83 America’s top 100 pig counties . . . . . . . . . . . . . . . 84 State rankings by inventory . . . . . . . . . . . . . . . . . . 85 U.S. hogs and pigs inventory, 2007 . . . . . . . . . . . . 86 Change in inventory, 2002 to 2007 . . . . . . . . . . . . 87 Number of hog operations by inventory size . . . 88 Number of U.S. hog operations . . . . . . . . . . . . . . 89 U.S. hog operations by size groups and percent of inventory . . . . . . . . . . . . . . . . . . 90 Number of operations by size group, selected states and United States . . . . . . . . . . . 90 Market share by operation size . . . . . . . . . . . . . . . 91 Number, percent and market share of U.S. operations by size . . . . . . . . . . . . . . . . . . . . . . . . 91 Quarterly U.S. commercial hog slaughter . . . . . . 92 Quarterly U.S. commercial pork production . . . 92 U.S. breeding herd and production . . . . . . . . . . . 93 U.S. breeding herd, quarterly. . . . . . . . . . . . . . . . . 93 U.S. pigs saved per litter . . . . . . . . . . . . . . . . . . . . . 93
6
Quick Facts
Table of Contents
U.S. swine breeding herd and farrowings . . . . . . 93 U.S. commercial livestock slaughter and meat production . . . . . . . . . . . . . . . . . . . . . 94 Productivity measures of U.S. pig herds . . . . . . . 95 U.S. Packing Sector Estimated U.S. daily slaughter capacity . . . . . . . . 96 U.S. packing plant closings . . . . . . . . . . . . . . . . . . 97 Estimated daily U.S. slaughter capacity, sows and boars . . . . . . . . . . . . . . . . . . . . . . . . . . . 97 Costs and Prices Cost to produce a market hog . . . . . . . . . . . . . . . . 98 Feeder pig and market hog prices . . . . . . . . . . . . . 98 Hog-corn price ratio . . . . . . . . . . . . . . . . . . . . . . . . 99 Hog-corn price ratio and pork production . . . . . 99 What determines the price of hogs . . . . . . . . . . . 100 Trade Iowa-Minnesota market hog prices . . . . . . . . . . 100 U.S. seasonal pork price indexes . . . . . . . . . . . . . 101 Seasonal hog supply and price indexes . . . . . . . 101Consumption and Expenditures U.S. per capita meat consumption . . . . . . . . . . . 102 Nominal U.S. per capita meat expenditures . . . 103U.S. Pork Exports U.S. Pork export . . . . . . . . . . . . . . . . . . . . . . . . . . 104 U.S. total and net pork exports . . . . . . . . . . . . . . 104 U.S. Pork export markets by volume . . . . . . . . . 104 U.S. Pork export markets by value . . . . . . . . . . . 104 U.S. Pork exports and net exports . . . . . . . . . . . 105 World per capita pork consumption . . . . . . . . . 106 World meat consumption shares . . . . . . . . . . . . 106 Top 20 markets for U.S. Pork exports . . . . . . . . 107 Top 10 pork-producing countries . . . . . . . . . . . 107 World pork export shares . . . . . . . . . . . . . . . . . . 107Canadian Statistics Canadian hog/pork exports . . . . . . . . . . . . . . . . . 108 Canadian pork exports . . . . . . . . . . . . . . . . . . . . . 109 Canadian live hog exports . . . . . . . . . . . . . . . . . . 109 Canadian hog inventory . . . . . . . . . . . . . . . . . . . . 110 Canadian hog/pork production . . . . . . . . . . . . . 111Miscellaneous Stats Grain usage for pork production . . . . . . . . . . . . 112 Typical market pig today . . . . . . . . . . . . . . . . . . . 113 Wholesale USDA prices for pork sub-primals . 114
Glossary . . . . . . . . . . . . . . . . . . . . . . . . . . . . . . . . 115 - 118
Name and Numbers . . . . . . . . . . . . . . . . . . . 119 - 120

7 Pork Checkoff
Pork Checkoff
Quick Facts
History The National Pork Board, which provides the
producer leadership for the Pork Checkoff, is the descendent of a long line of U.S. pork associations. The associations were formed by pork producers who faced profitability challenges and knew that they could best address these common issues by working together and jointly finding sources of funding.
The organization traces its roots to the mid-1950s when a group of producers, concerned about the future growth and profitability of the pork industry, organized the National Swine Growers Council (NSGC). In 1965, this group evolved into the National Pork Producers Council (NPPC), as it took the first steps toward creating the meat-type pig needed to produce pork products consumers desired.
“Moline 90” In May 1966, about 90 pork producers from
Illinois, Indiana, Iowa, Kansas, Minnesota, Missouri, Nebraska, North Carolina, South Dakota, Tennessee and Wisconsin met in Moline, Ill. This group, which came to be known as the “Moline 90”, gathered to establish a voluntary checkoff.
The group agreed to hire the first full-time executive secretary for the council and to raise, through contributions, a “Get Ready Fund” of $40,000. A bank note was passed around and eight pork producers signed it, obligating each of them to pay if the “Get Ready Fund” was not raised. The note was never needed.
With some funds and staff, NPPC began moving toward development of the meat-type hog that more health-conscious consumers were beginning to demand. Realizing that promotion would create more pork sales, producer leaders sought U.S. Congressional action that would permit a market deduction to fund product promotion. They succeeded in getting amendments to the Packers and
Stockyards Act that opened the way for a voluntary checkoff system. Reflecting the forward-thinking of producers back then, as well as today, this represented the first voluntary checkoff program.
“Nickels for Profits” In 1967, after months of organizing at the county
and state levels, NPPC started the voluntary “Nickels for Profit” checkoff in six counties in Iowa and Illinois. The first check received was for $4.90. By 1968, producer enthusiasm had spread, with 16 states organized and the nickel checkoff program launched nationwide.
By 1970, NPPC membership rose to 40,000 producers with a $1 million operating budget. In response to members’ increasing needs for promotion and research, the checkoff increased over the years from a nickel, to a dime, to 20 cents, then to 0.3 percent of each hog’s market value.
8 Pork Checkoff
Quick Facts
Pork Promotion, Research and Consumer Information Act of 1985
The need for additional funds to keep pork competitive with other meat and poultry helped producers make the decision to move from a voluntary to a legislative checkoff. A “100 percent Producer Task Force” organized an effort that led to the successful passage of federal legislation – The Pork Promotion, Research and Consumer Information Act of 1985, more commonly referred to as the Pork Act, as part of the 1985 Farm Bill.
After being overwhelmingly approved by a producer referendum, the national legislative Pork Checkoff was set in motion under the supervision of the U.S. Department of Agriculture (USDA) Agriculture Marketing Service. The Checkoff is designed to provide funds for pork promotion, research and consumer information to enhance pork producers’ opportunity for success.
Under the terms of the Pork Act, all pork producers and importers of pigs and pork products contribute a portion of all sales. The current checkoff rate is 0.4 percent of value (i.e., 40 cents for every $100 market value). The Pork Act created the National Pork Board, which is responsible for collecting the Checkoff and administering Checkoff-funded programs that benefit producers with all sizes of operations.
The National Pork Board is made up of 15 members who are nominated by the Pork Act Delegate Body and appointed by the secretary of agriculture. The board is headquartered in Des Moines, Iowa.
Since 2001, the National Pork Board has assumed responsibility for promotion, consumer education and research programs. NPPC, supported by producer membership, has responsibility for public policy affecting pork producers.
Promotion, Consumer Information and Research
The Pork Act stipulates that Checkoff funds must be used for promotion, research and consumer information programs. These programs are designed
to strengthen the position of the pork industry in the marketplace, and to maintain, develop and expand markets for pork and pork products. Checkoff funds cannot be used for influencing government or for lobbying efforts.
The Pork Checkoff funds programs in the following areas:
• Promotion – Centered on Pork. The Other White Meat®, one of the best-known advertising lines in history, the Pork Checkoff’s primary function is to promote pork in the United States and abroad.
• Consumer information – Teaching consumers about the characteristics, versatility, and uses of today’s pork products and making them aware of the role that pork plays in a balanced healthy diet is an important part of the board’s promotion activities.
• Research – Unique among commodity programs, the Pork Act enables the Pork Checkoff to conduct research on a wide variety of topics, ranging from production methods to product development to environmental solutions. Pork Checkoff education programs complete this activity by making research results available to producers.
Frequently Asked
Questions
Quick Facts
9Frequently Asked Questions
Do you collect Checkoff on the Canadian hogs that come
into the United States?
Just as all U.S. pork producers pay the Pork Checkoff , so do importers. Th e same assessment of $0.40 per $100 of value is paid when pigs are sold and when pigs or pork products are brought into the United States.
What is the National Pork Board and
how are its members appointed ?
Through a legislative national Pork Checkoff, pork producers invest $0.40 for each $100 value of hogs sold. The 15-member National Pork Board collects Checkoff funds and implements research, promotion and consumer information programs, such as advertising, retail marketing, export promotion, production improvement, and environmental management.
At Pork Forum, the industry’s annual business meeting, delegates from all the state associations nominate new members of the National Pork Board. The list is then given to the U.S. Secretary of Agriculture, who selects the final board members. The board members are featured on the Checkoff’s Web site at pork.org.
How do I convert a carcass price to a
live price?
Multiply the carcass price by 0.74 to convert the carcass price to the live price. To convert the live price to the carcass price, divide by 0.74.
Where can I purchase pig parts
(ears, feet, intestines, tails or
other non-meat)?
Contact one of the following associations for assistance: American Association of Meat Processors, www.aamp.com; North American Meat Processors Association, www.namp.com; or the American Meat Institute at www.meatami.com.
Do you have
a Web site?
Yes, two. At pork.org you’ll fi nd information about pork production, along with updates on Pork Checkoff research and education. For pork recipes, consumer information and more, visit Th eOtherWhiteMeat.com.
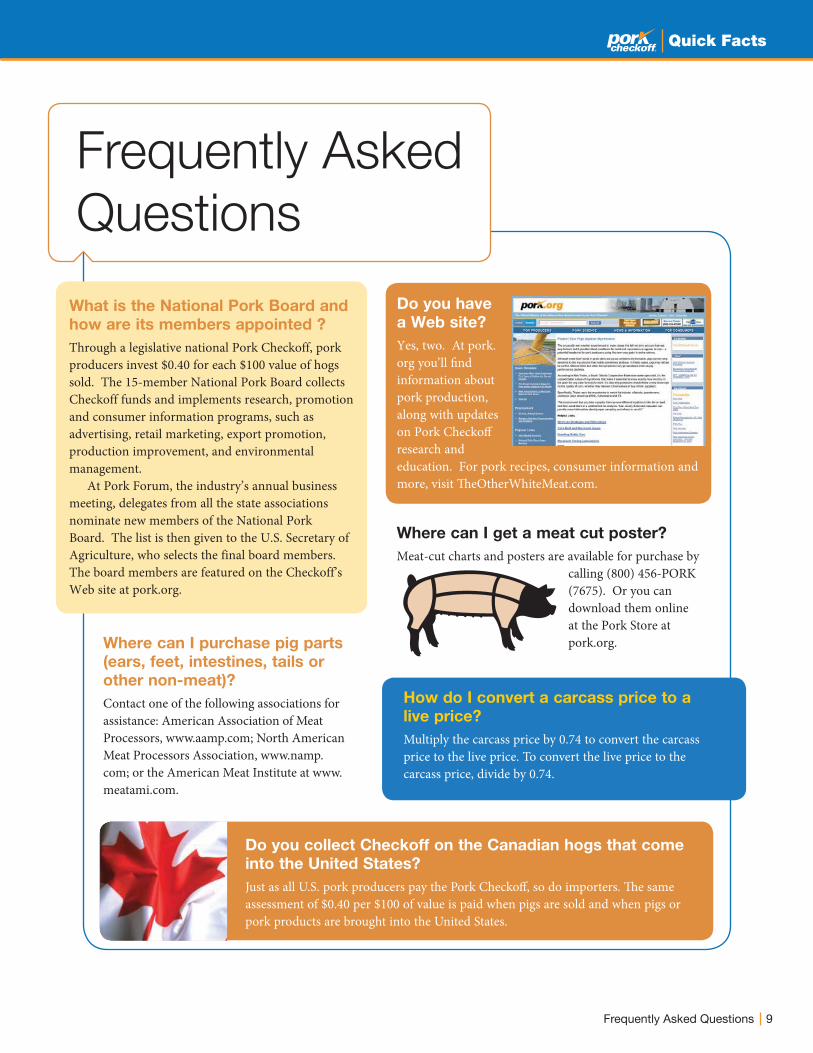
Where can I get a meat cut poster?
Meat-cut charts and posters are available for purchase by calling (800) 456-PORK (7675). Or you can download them online at the Pork Store at pork.org.
10 Frequently Asked Questions
Quick Facts
What about pork’s carbon footprint?
A recent greenhouse gas (GHG) emission report from the U.S. Environmental Protection Agency shows that the livestock industry only generates 2.4 percent of the total GHG emissions in the United States. Th e pork industry’s contribution is about one third of 1 percent of the total, thanks in part to improved management of swine diets and proper manure management.
Does the Pork Checkoff offer
educational materials for producers?
Factsheets, brochures, DVDs and research data on a wide range of topics are available at pork.org or by calling (800)-456-PORK (7675).
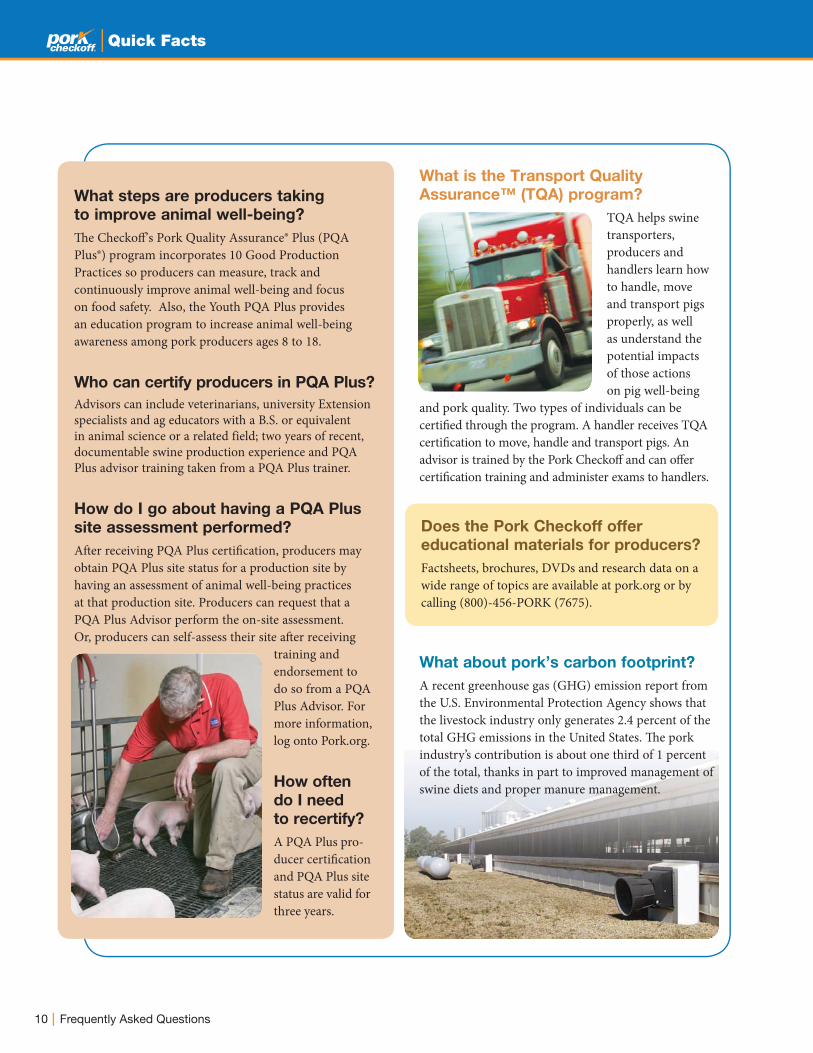
What is the Transport Quality
Assurance™ (TQA) program?
TQA helps swine transporters, producers and handlers learn how to handle, move and transport pigs properly, as well as understand the potential impacts of those actions on pig well-being
and pork quality. Two types of individuals can be certifi ed through the program. A handler receives TQA certifi cation to move, handle and transport pigs. An advisor is trained by the Pork Checkoff and can off er certifi cation training and administer exams to handlers.
What steps are producers taking
to improve animal well-being?
Th e Checkoff ’s Pork Quality Assurance Plus (PQA Plus®) program incorporates 10 Good Production Practices so producers can measure, track and continuously improve animal well-being and focus on food safety. Also, the Youth PQA Plus provides an education program to increase animal well-being awareness among pork producers ages 8 to 18.
Who can certify producers in PQA Plus?
Advisors can include veterinarians, university Extension specialists and ag educators with a B.S. or equivalent in animal science or a related field; two years of recent, documentable swine production experience and PQA Plus advisor training taken from a PQA Plus trainer.
How do I go about having a PQA Plus
site assessment performed?
Aft er receiving PQA Plus certifi cation, producers may obtain PQA Plus site status for a production site by having an assessment of animal well-being practices at that production site. Producers can request that a PQA Plus Advisor perform the on-site assessment. Or, producers can self-assess their site aft er receiving
training and endorsement to do so from a PQA Plus Advisor. For more information, log onto Pork.org.
How often
do I need
to recertify?
A PQA Plus pro-ducer certifi cation and PQA Plus site status are valid for three years.

11Frequently Asked Questions
Quick Facts
What’s the role of the National
Pork Board and the National Pork
Producers Council?
The National Pork Board, which represents all producers by law, collects Pork Checkoff funds and uses those funds for education, promotion, research and communication. The National Pork Producers Council collects voluntary funds and uses them to manage industry and legislative issues affecting the pork industry and its members.
How have pork and hog prices
changed over time?
Pork prices are cyclical and depend on many supply and demand factors, both at home and abroad. Looking back 40 years, hog prices rose in the 1970s, as did the prices of many other agricultural products. Hog prices stabilized in the 1980s and trended downward into the 1990s, due to new technologies and production efficiencies.
By 2004, both pork and hog prices rose again, with pork prices reaching record levels and hog prices nearly matching record levels. By the fourth quarter of 2007, however, producers began to experience economic losses, and a downturn in the global economy in 2008, combined with the outbreak of the H1N1 flu virus in 2009, created a perfect storm for the pork industry.
As prices declined, producers began taking steps to reduce the supply, which is one of the few steps producers of commodities can take to raise prices.
Does today’s pork fit into a
healthy diet?
As a good source of protein and nutrients, lean pork plays a key role in eating right. You can find the latest nutritional information, plenty of pork recipes, cooking tips and more at TheOtherWhiteMeat.com.
Where can I find the delicious pork
burgers/ pork chops. etc., that I
had at my local state fair?
Contact your state pork association (see the Names and Numbers section on pork.org) or the group that had the fair booth.
Quick Facts
12 Frequently Asked Questions
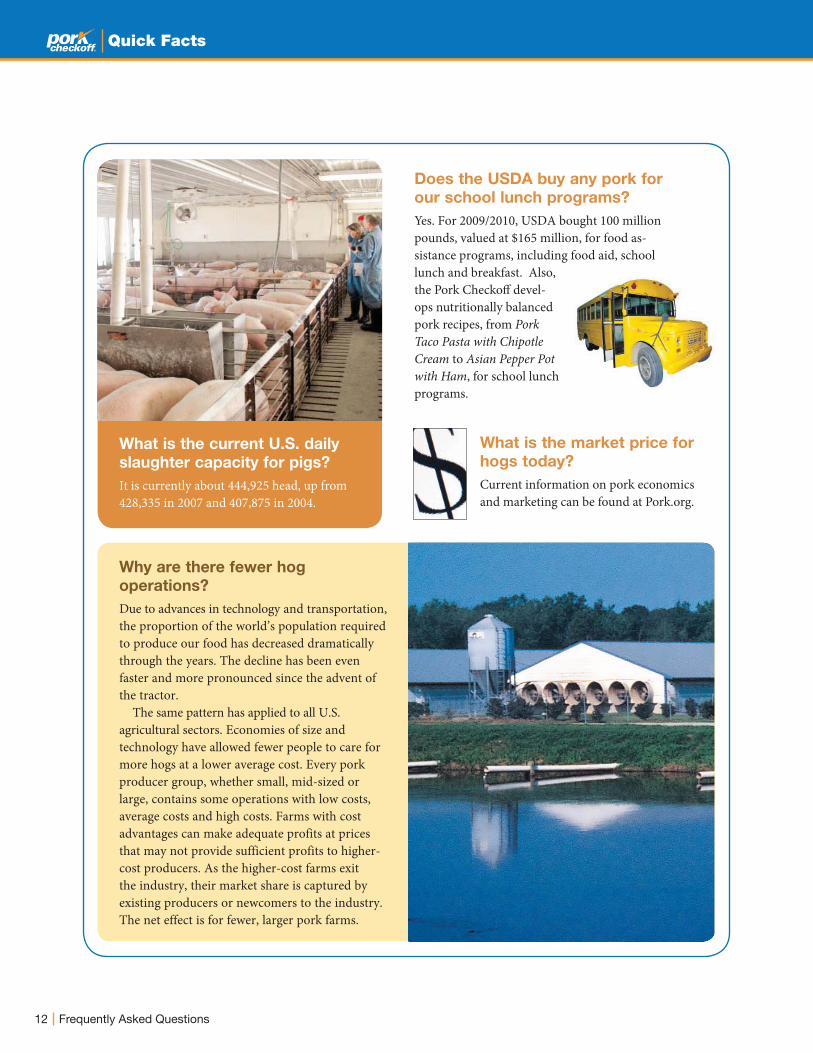
Does the USDA buy any pork for
our school lunch programs?
Yes. For 2009/2010, USDA bought 100 million pounds, valued at $165 million, for food as-sistance programs, including food aid, school lunch and breakfast. Also, the Pork Checkoff devel-ops nutritionally balanced pork recipes, from Pork Taco Pasta with Chipotle Cream to Asian Pepper Pot with Ham, for school lunch programs.
Why are there fewer hog
operations?
Due to advances in technology and transportation, the proportion of the world’s population required to produce our food has decreased dramatically through the years. The decline has been even faster and more pronounced since the advent of the tractor. The same pattern has applied to all U.S. agricultural sectors. Economies of size and technology have allowed fewer people to care for more hogs at a lower average cost. Every pork producer group, whether small, mid-sized or large, contains some operations with low costs, average costs and high costs. Farms with cost advantages can make adequate profits at prices that may not provide sufficient profits to higher-cost producers. As the higher-cost farms exit the industry, their market share is captured by existing producers or newcomers to the industry. The net effect is for fewer, larger pork farms.
What is the current U.S. daily
slaughter capacity for pigs?
It is currently about 444,925 head, up from 428,335 in 2007 and 407,875 in 2004.
What is the market price for
hogs today?
Current information on pork economics and marketing can be found at Pork.org.
13Did You Know?
Did You Know?
Quick Facts
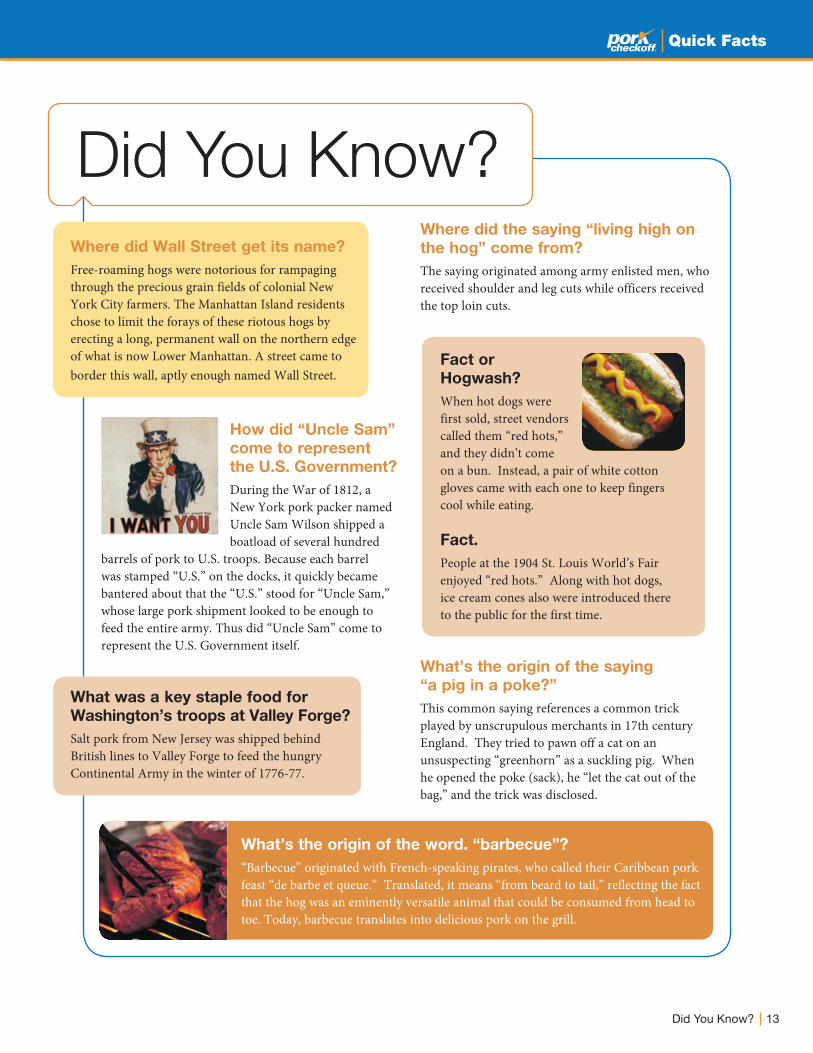
How did “Uncle Sam”
come to represent
the U.S. Government?
During the War of 1812, a New York pork packer named Uncle Sam Wilson shipped a boatload of several hundred
barrels of pork to U.S. troops. Because each barrel was stamped “U.S.” on the docks, it quickly became bantered about that the “U.S.” stood for “Uncle Sam,” whose large pork shipment looked to be enough to feed the entire army. Thus did “Uncle Sam” come to represent the U.S. Government itself.
What’s the origin of the saying
“a pig in a poke?”
This common saying references a common trick played by unscrupulous merchants in 17th century England. They tried to pawn off a cat on an unsuspecting “greenhorn” as a suckling pig. When he opened the poke (sack), he “let the cat out of the bag,” and the trick was disclosed.
Fact or
Hogwash?
When hot dogs were first sold, street vendors called them “red hots,” and they didn’t come on a bun. Instead, a pair of white cotton gloves came with each one to keep fingers cool while eating.
Fact.
People at the 1904 St. Louis World’s Fair enjoyed “red hots.” Along with hot dogs, ice cream cones also were introduced there to the public for the first time.
What was a key staple food for
Washington’s troops at Valley Forge?
Salt pork from New Jersey was shipped behind British lines to Valley Forge to feed the hungry Continental Army in the winter of 1776-77.
Where did the saying “living high on
the hog” come from?
The saying originated among army enlisted men, who received shoulder and leg cuts while officers received the top loin cuts.
What’s the origin of the word. “barbecue”?
“Barbecue” originated with French-speaking pirates, who called their Caribbean pork feast “de barbe et queue.” Translated, it means “from beard to tail,” reflecting the fact that the hog was an eminently versatile animal that could be consumed from head to toe. Today, barbecue translates into delicious pork on the grill.
Where did Wall Street get its name?
Free-roaming hogs were notorious for rampaging through the precious grain fields of colonial New York City farmers. The Manhattan Island residents chose to limit the forays of these riotous hogs by erecting a long, permanent wall on the northern edge of what is now Lower Manhattan. A street came to border this wall, aptly enough named Wall Street.
14 Did You Know?
Quick Facts
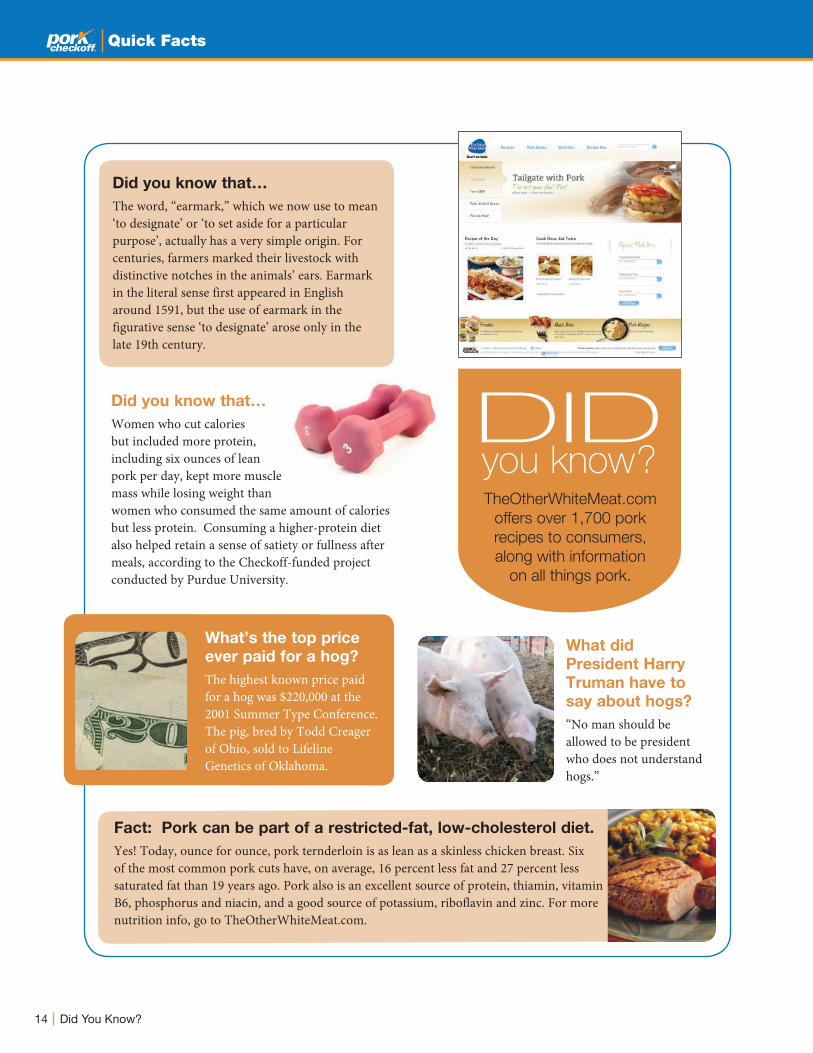
Did you know that…
The word, “earmark,” which we now use to mean ‘to designate’ or ‘to set aside for a particular purpose’, actually has a very simple origin. For centuries, farmers marked their livestock with distinctive notches in the animals’ ears. Earmark in the literal sense first appeared in English around 1591, but the use of earmark in the figurative sense ‘to designate’ arose only in the late 19th century.
Did you know that…
Women who cut calories but included more protein, including six ounces of lean pork per day, kept more muscle mass while losing weight than women who consumed the same amount of calories but less protein. Consuming a higher-protein diet also helped retain a sense of satiety or fullness after meals, according to the Checkoff-funded project conducted by Purdue University.
What did
President Harry
Truman have to
say about hogs?
“No man should be allowed to be president who does not understand hogs.”
TheOtherWhiteMeat.com
offers over 1,700 pork
recipes to consumers,
along with information
on all things pork.
DIDyou know?
Fact: Pork can be part of a restricted-fat, low-cholesterol diet.
Yes! Today, ounce for ounce, pork ternderloin is as lean as a skinless chicken breast. Six of the most common pork cuts have, on average, 16 percent less fat and 27 percent less saturated fat than 19 years ago. Pork also is an excellent source of protein, thiamin, vitamin B6, phosphorus and niacin, and a good source of potassium, riboflavin and zinc. For more nutrition info, go to TheOtherWhiteMeat.com.
What’s the top price
ever paid for a hog?
The highest known price paid for a hog was $220,000 at the 2001 Summer Type Conference. The pig, bred by Todd Creager of Ohio, sold to Lifeline Genetics of Oklahoma.

15Did You Know?
Quick Facts
Fact or hogwash?
Pork tenderloin is just as lean as a skinless chicken breast.
Fact.
Research shows that ounce for ounce, pork tenderloin is lean as a skinless chicken breast. A 3-ounce serving of pork tenderloin has only 2.98 grams of total fat and 1.02 grams of saturated fat.
What’s the origin of the saying
“pork barrel politics”?
The phrase is derived from the pre-Civil War practice of distributing salt pork to the slaves from huge barrels. By the 1870s, congressmen were referred to as regularly dipping into the “pork barrel” to obtain funds for popular projects in their home districts.
Did you know that...
As popular as pork is in America, it is not the United States, but China, that is the world’s No. 1 producer and consumer of fresh pork.
Did you know that...
In ancient China, fresh pork enjoyed royal status. Around 4000 B.C., the Chinese people were ordered to raise and breed hogs by a royal decree from the emperor of China.
Did you know that...
The ancient Chinese so hated to be separated from fresh pork that the departed sometimes were accompanied to the grave with their hogs.
What’s the heaviest hog ever?
A Poland China hog named “Big Bill” weighed 2,552 pounds and measured 9 feet long. The owner of this hefty hog was Burford Butler of Jackson, Tennessee, in 1933. In contrast, the average market weight of today’s lean hogs is around 265 pounds.
What’s the origin of the saying to
“go whole hog”?
The expression came from the 18th century, when the English shilling was at one time called a “hog.” Thus, a spendthrift, one willing to spend an entire shilling on the entertainment of a friend in a pub, was willing to “go whole hog.”
Fact or Hogwash?
The longest single sausage was over a mile long.
Fact.
A single sausage measuring 5,917 feet in length was cooked in Barcelona, Spain, on September 22, 1986.
Did you know that...
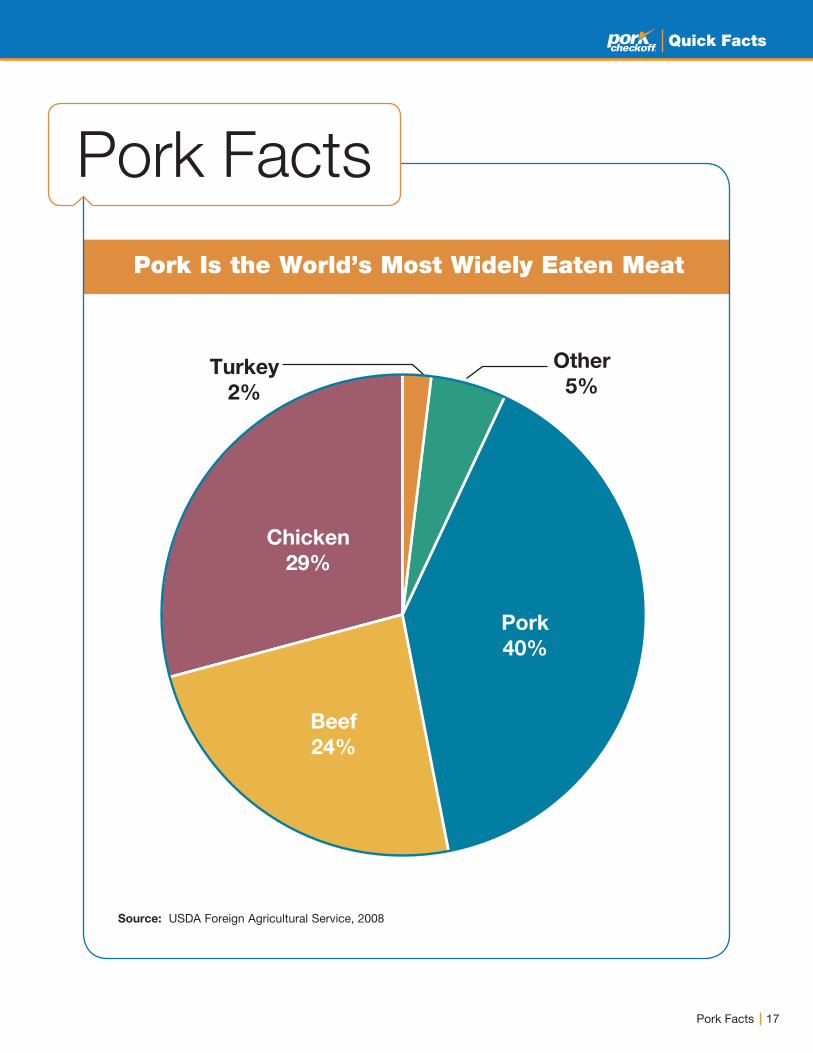
Pork is the world’s most widely eaten meat.

Quick Facts
16
Quick Facts
17Pork Facts
Source: USDA Foreign Agricultural Service, 2008
Pork
40%
Other
5%Turkey
2%
Beef
24%
Chicken
29%
Pork Facts
Pork Is the World’s Most Widely Eaten Meat
Quick Facts
18 Pork Facts
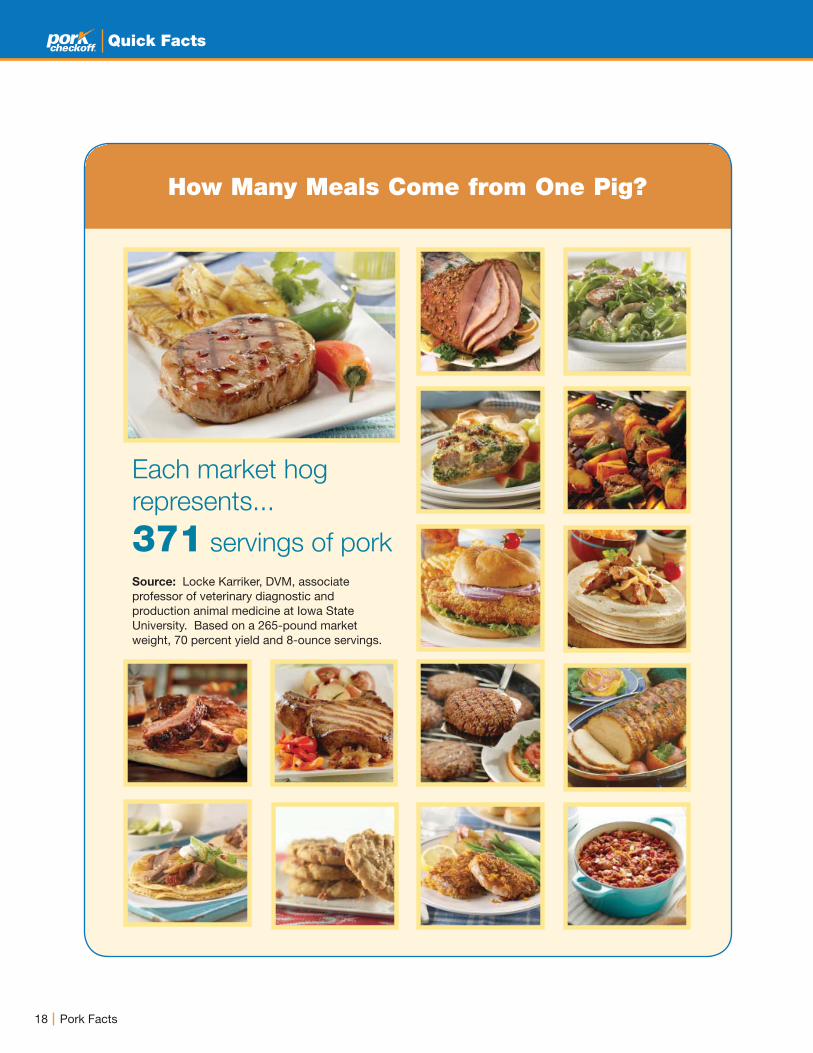
How Many Meals Come from One Pig?
Source: Locke Karriker, DVM, associate professor of veterinary diagnostic and production animal medicine at Iowa State University. Based on a 265-pound market weight, 70 percent yield and 8-ounce servings.
Each market hog
represents...
371 servings of pork
Quick Facts
19Pork Facts
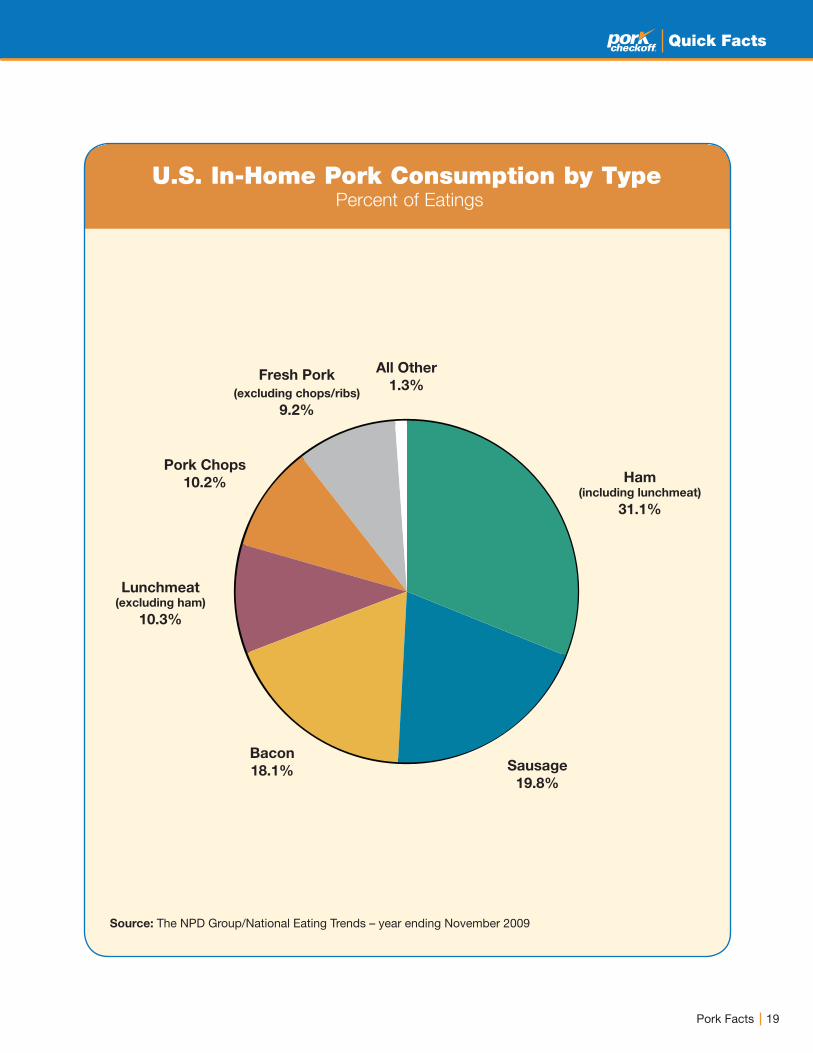
U.S. In-Home Pork Consumption by Type Percent of Eatings
Source: The NPD Group/National Eating Trends – year ending November 2009
All Other
1.3%
Ham(including lunchmeat)
31.1%
Sausage
19.8%
Bacon
18.1%
Lunchmeat(excluding ham)
10.3%
Pork Chops
10.2%
Fresh Pork
(excluding chops/ribs)
9.2%
20 Pork Facts
Quick Facts
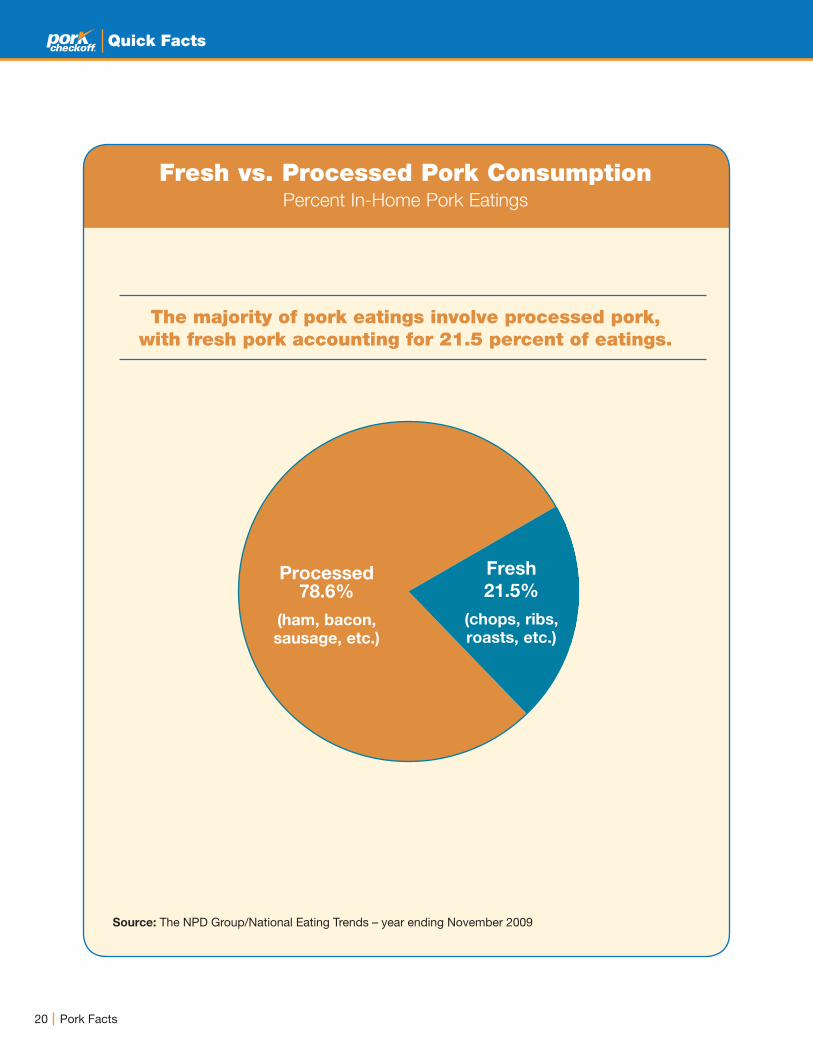
Fresh vs. Processed Pork ConsumptionPercent In-Home Pork Eatings
The majority of pork eatings involve processed pork, with fresh pork accounting for 21.5 percent of eatings.
Fresh
21.5%
(chops, ribs,
roasts, etc.)
Processed78.6%
(ham, bacon,
sausage, etc.)
Source: The NPD Group/National Eating Trends – year ending November 2009
21Pork Facts
Quick Facts
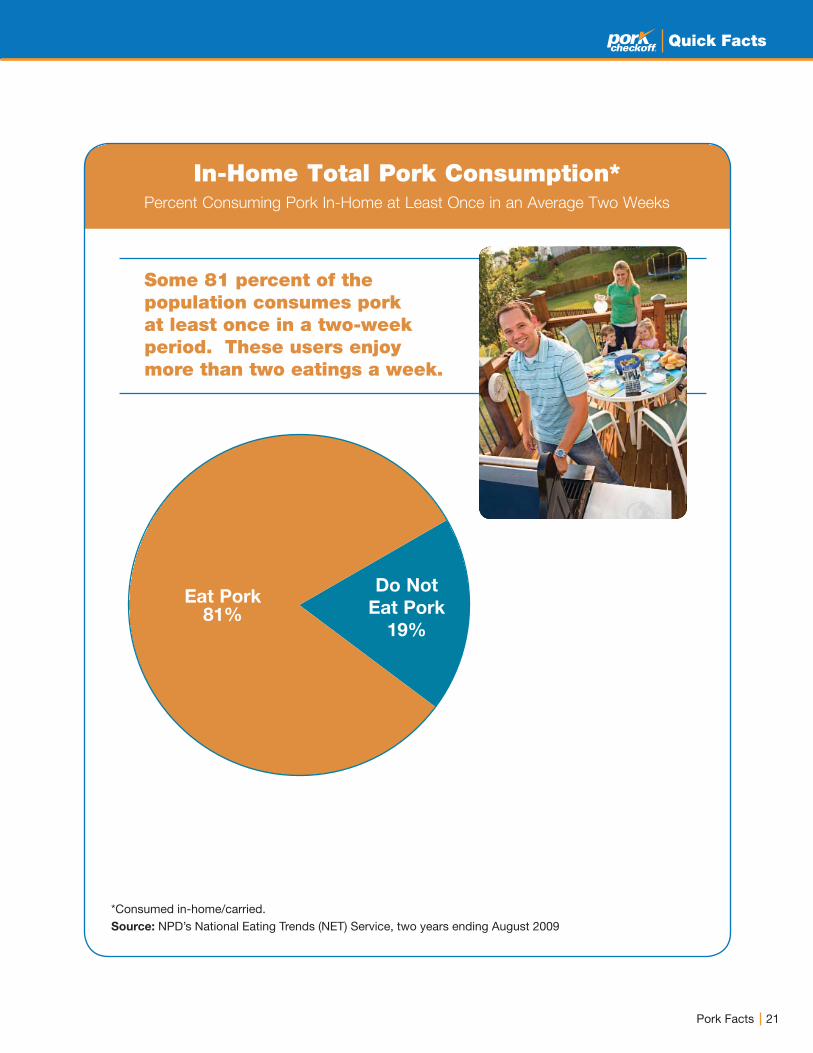
In-Home Total Pork Consumption*Percent Consuming Pork In-Home at Least Once in an Average Two Weeks
Some 81 percent of the population consumes pork at least once in a two-week period. These users enjoy more than two eatings a week.
*Consumed in-home/carried.Source: NPD’s National Eating Trends (NET) Service, two years ending August 2009
Do Not
Eat Pork
19%
Eat Pork81%

22 Pork Facts
Quick Facts
Total In-Home Consumption*(Annual Eatings Per Capita)
Source: NPD’s National Eating Trends (NET) Service, two years rolling August
Pork No. 1 in In-Home Protein Eatings
Fresh Pork Fresh Beef Poultry Seafood
Pt. Change
’08 vs. ’99
+7.9
-3.0
+5.0
+1.1
’99 ’00 ’01 ’02 ’03 ’04 ’05 ’06 ’07 ’08
23Pork Facts
Quick Facts
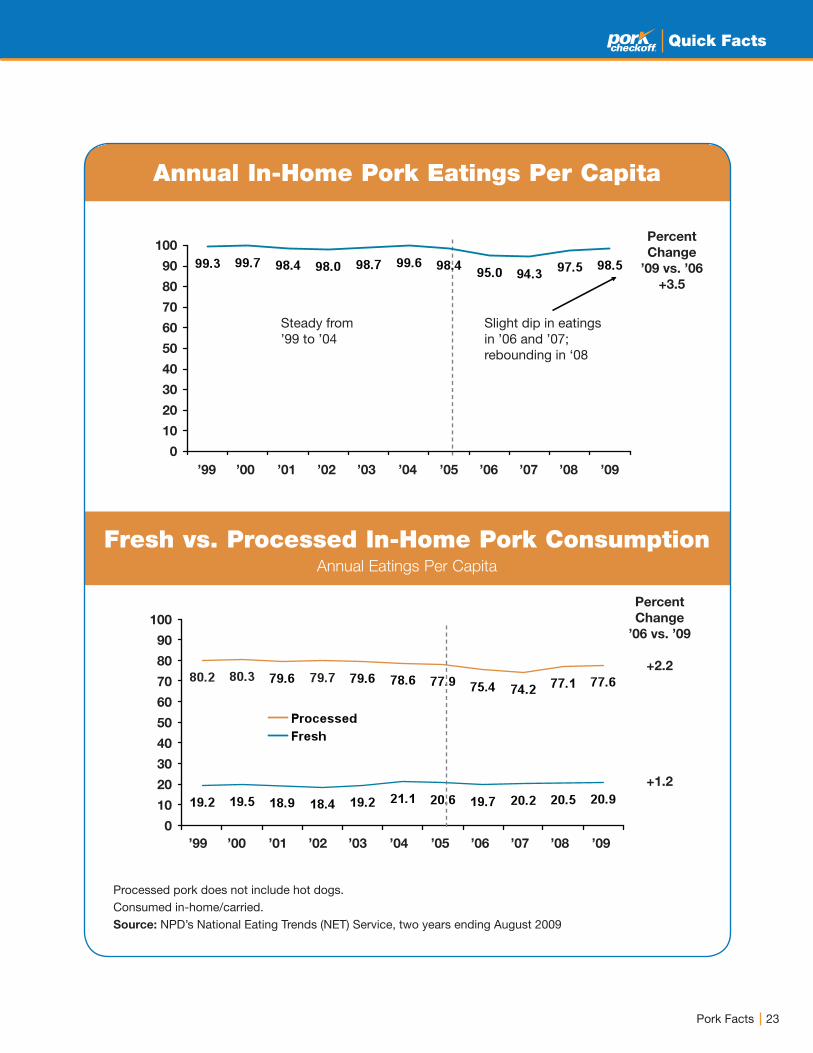
Annual In-Home Pork Eatings Per Capita
Fresh vs. Processed In-Home Pork ConsumptionAnnual Eatings Per Capita
Processed pork does not include hot dogs.Consumed in-home/carried.Source: NPD’s National Eating Trends (NET) Service, two years ending August 2009
Steady from’99 to ’04
Percent
Change
’09 vs. ’06
+3.5
Slight dip in eatings in ’06 and ’07; rebounding in ‘08
’99 ’00 ’01 ’02 ’03 ’04 ’05 ’06 ’07 ’08 ’09
100
90
80
70
60
50
40
30
20
10
0
Percent
Change
’06 vs. ’09
+2.2
+1.2
’99 ’00 ’01 ’02 ’03 ’04 ’05 ’06 ’07 ’08 ’09
100
90
80
70
60
50
40
30
20
10
0

24 Pork Facts
Quick Facts
Pork Consumption by Age and GenderTotal Processed Pork vs Pork, Fresh (excluding ham and bacon)
Percent of Eatings Indexed to Sample 2008/2009
Total Processed Pork Pork, Fresh (excluding ham and bacon)
Children Males Females
% of Sample 8.0 9.6 6.4 8.4 6.9 7.6 6.2 5.7 10.7 8.3 8.3 6.7 7.1
Total Processed Pork
% of Eatings 6.4 9.6 6.2 8.0 7.1 8.2 8.1 6.8 9.3 7.7 8.5 6.3 7.5
Pork, Fresh (Excluding Ham + Bacon)
% of Eatings 6.3 7.9 6.8 7.8 7.0 8.4 7.0 6.9 9.1 8.8 8.0 7.8 8.3
Source: NPD’s National Eating Trends (NET) Service, two years rolling August
Note: Index of 120+ = greater than average; Index of 80 or less = less than average
80
100 96 95 103 108
130 118
87 93 103
95 106
<6 6-12 13-17 18-34 35-44 45-54 55-64 65+ 18-34 35-44 45-54 55-64 65+
25Pork Facts
Quick Facts
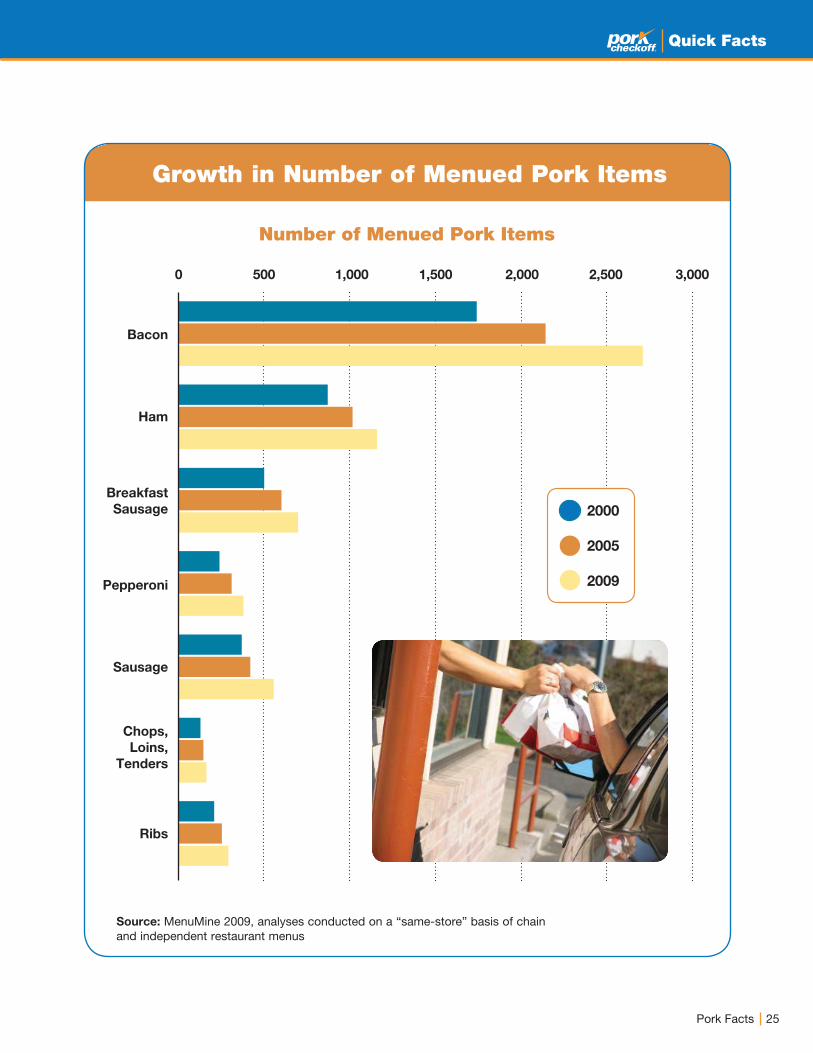
Source: MenuMine 2009, analyses conducted on a “same-store” basis of chain and independent restaurant menus
Growth in Number of Menued Pork Items
Number of Menued Pork Items
0 500 1,000 1,500 2,000 2,500 3,000
Bacon
Ham
Breakfast
Sausage
Pepperoni
Sausage
Chops,
Loins,
Tenders
Ribs
2000
2005
2009
26 Pork Facts
Quick Facts
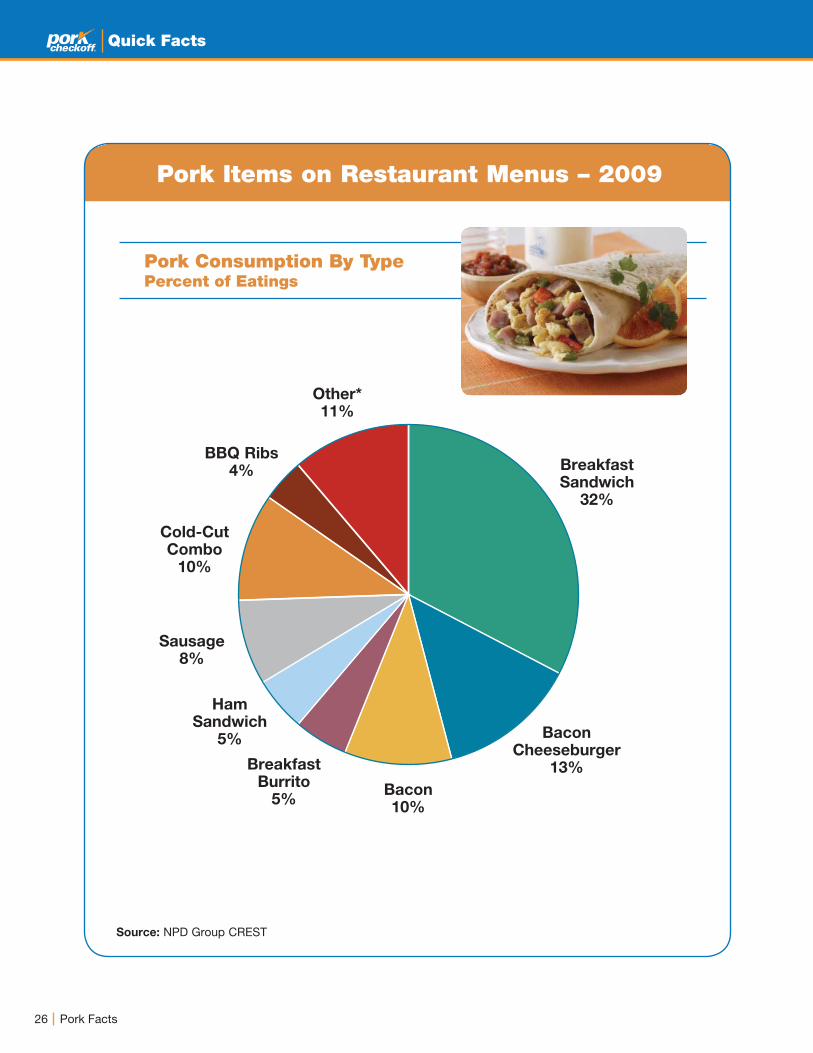
Source: NPD Group CREST
Pork Consumption By TypePercent of Eatings
Breakfast Sandwich
32%
Bacon Cheeseburger
13%
Other*11%
Cold-CutCombo
10%
Bacon10%
Sausage8%
HamSandwich
5%
Breakfast Burrito
5%
BBQ Ribs4%
Pork Items on Restaurant Menus – 2009
27Pork Facts
Quick Facts
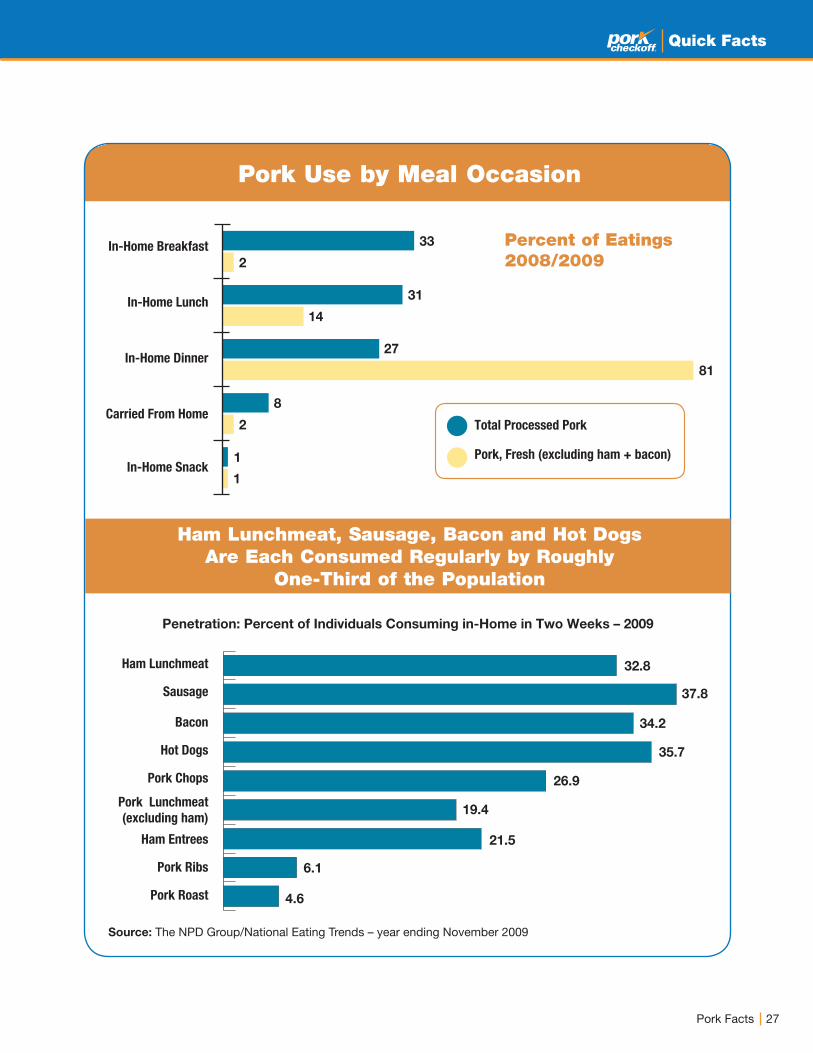
Source: The NPD Group/National Eating Trends – year ending November 2009
Pork Use by Meal Occasion
In-Home Breakfast
In-Home Lunch
In-Home Dinner
Carried From Home
In-Home Snack
Ham Lunchmeat
Sausage
Bacon
Hot Dogs
Pork Chops
Pork Lunchmeat
(excluding ham)
Ham Entrees
Pork Ribs
Pork Roast
Total Processed Pork
Pork, Fresh (excluding ham + bacon)
33
32.8
Penetration: Percent of Individuals Consuming in-Home in Two Weeks – 2009
37.8
34.2
26.9
21.5
35.7
19.4
6.1
4.6
31
81
8
1
2
14
27
2
1
Ham Lunchmeat, Sausage, Bacon and Hot Dogs Are Each Consumed Regularly by Roughly
One-Third of the Population
Percent of Eatings 2008/2009
28 Pork Facts
Quick Facts
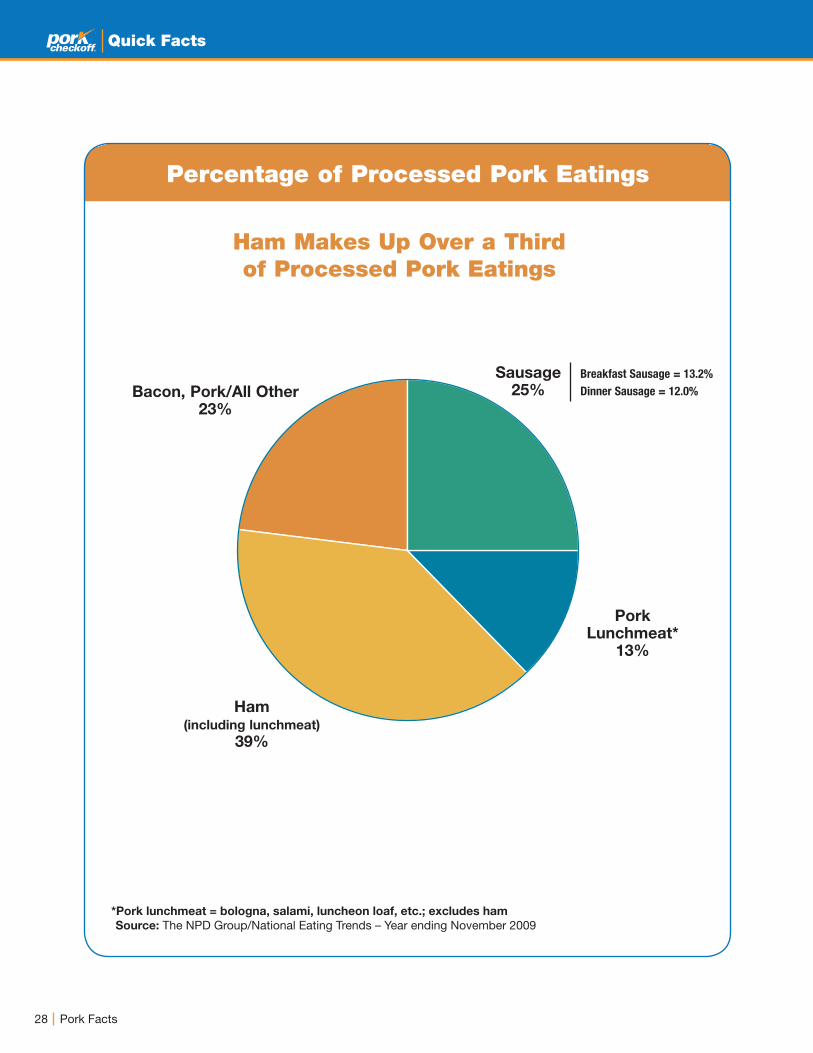
*Pork lunchmeat = bologna, salami, luncheon loaf, etc.; excludes ham
Source: The NPD Group/National Eating Trends – Year ending November 2009
Sausage25%
Breakfast Sausage = 13.2%
Dinner Sausage = 12.0%
PorkLunchmeat*
13%
Ham(including lunchmeat)
39%
Bacon, Pork/All Other23%
Percentage of Processed Pork Eatings
Ham Makes Up Over a Third of Processed Pork Eatings
29Pork Facts
Quick Facts
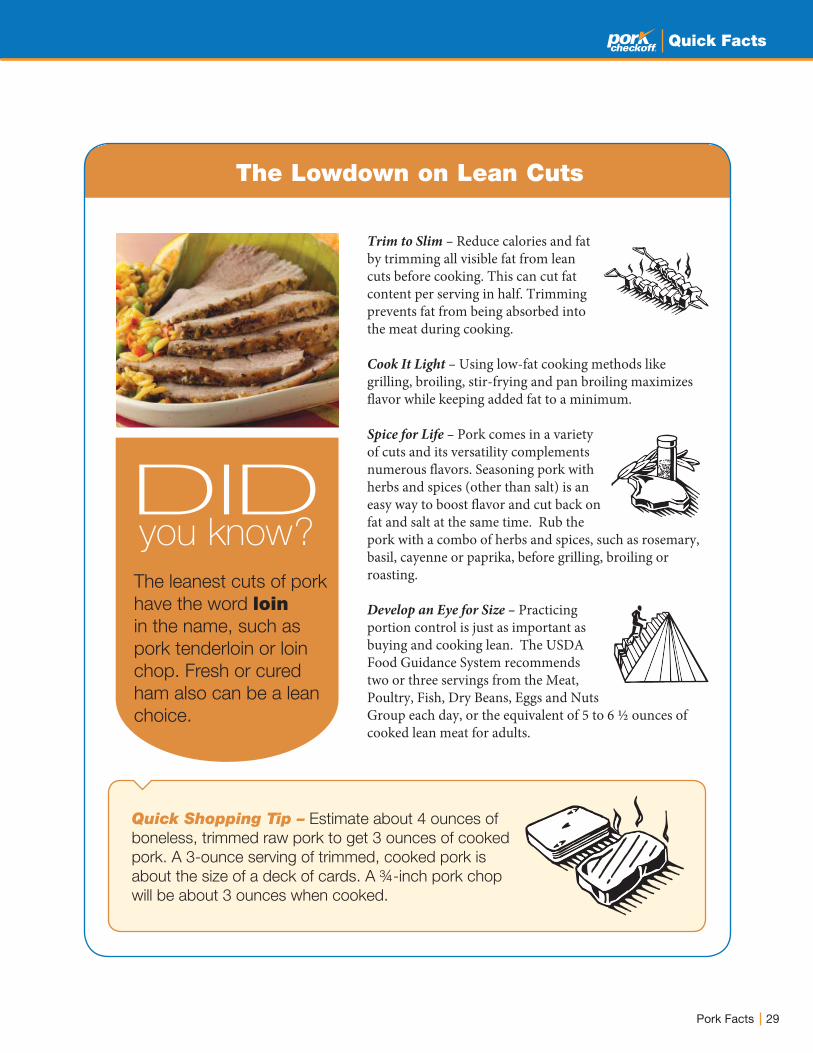
The Lowdown on Lean Cuts
The leanest cuts of pork
have the word loin in the name, such as
pork tenderloin or loin
chop. Fresh or cured
ham also can be a lean
choice.
DIDyou know?
Trim to Slim – Reduce calories and fat by trimming all visible fat from lean cuts before cooking. This can cut fat content per serving in half. Trimming prevents fat from being absorbed into the meat during cooking.
Cook It Light – Using low-fat cooking methods like grilling, broiling, stir-frying and pan broiling maximizes flavor while keeping added fat to a minimum.
Spice for Life – Pork comes in a variety of cuts and its versatility complements numerous flavors. Seasoning pork with herbs and spices (other than salt) is an easy way to boost flavor and cut back on fat and salt at the same time. Rub the pork with a combo of herbs and spices, such as rosemary, basil, cayenne or paprika, before grilling, broiling or roasting.
Develop an Eye for Size – Practicing portion control is just as important as buying and cooking lean. The USDA Food Guidance System recommends two or three servings from the Meat, Poultry, Fish, Dry Beans, Eggs and Nuts Group each day, or the equivalent of 5 to 6 ½ ounces of cooked lean meat for adults.
Quick Shopping Tip – Estimate about 4 ounces of
boneless, trimmed raw pork to get 3 ounces of cooked
pork. A 3-ounce serving of trimmed, cooked pork is
about the size of a deck of cards. A ¾-inch pork chop
will be about 3 ounces when cooked.
30 Pork Facts
Quick Facts
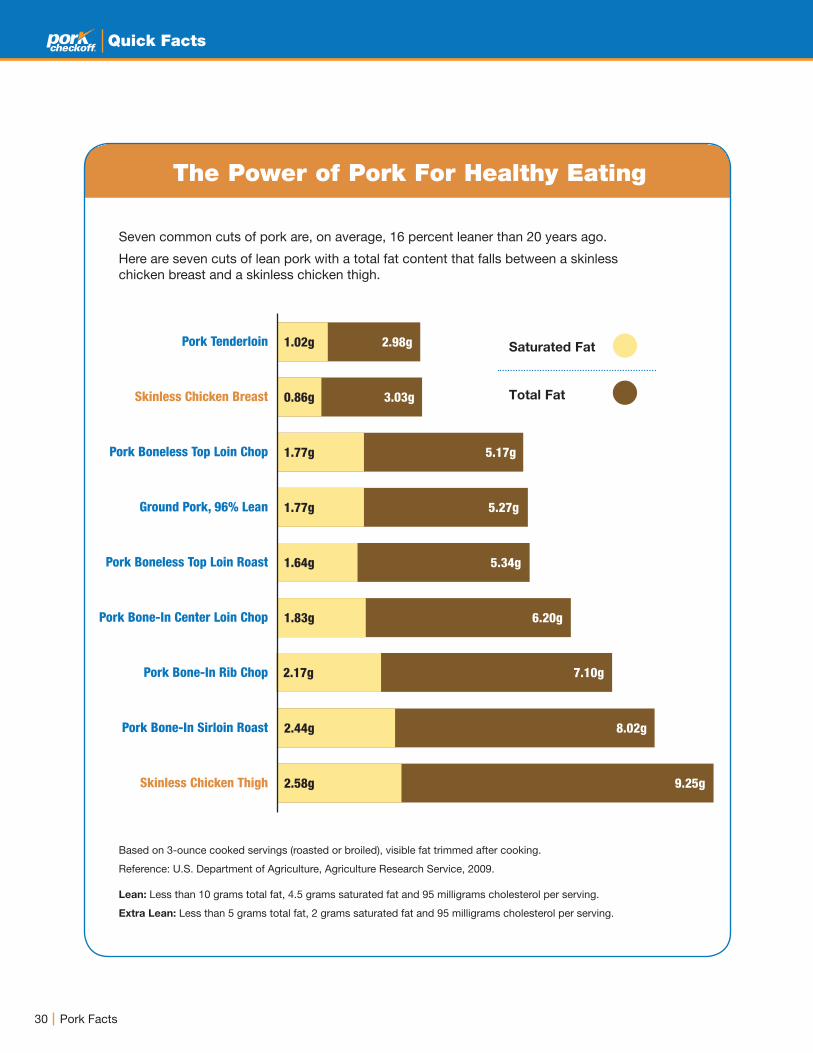
The Power of Pork For Healthy Eating
Seven common cuts of pork are, on average, 16 percent leaner than 20 years ago.
Here are seven cuts of lean pork with a total fat content that falls between a skinless chicken breast and a skinless chicken thigh.
Based on 3-ounce cooked servings (roasted or broiled), visible fat trimmed after cooking.
Reference: U.S. Department of Agriculture, Agriculture Research Service, 2009.
Lean: Less than 10 grams total fat, 4.5 grams saturated fat and 95 milligrams cholesterol per serving.
Extra Lean: Less than 5 grams total fat, 2 grams saturated fat and 95 milligrams cholesterol per serving.
1.02g 2.98g
0.86g 3.03g
1.77g 5.27g
1.77g 5.17g
1.64g 5.34g
1.83g 6.20g
2.17g 7.10g
2.44g 8.02g
2.58g 9.25g
Pork Tenderloin
Skinless Chicken Breast
Pork Boneless Top Loin Chop
Ground Pork, 96% Lean
Pork Boneless Top Loin Roast
Pork Bone-In Center Loin Chop
Pork Bone-In Rib Chop
Pork Bone-In Sirloin Roast
Skinless Chicken Thigh
Saturated Fat
Total Fat
31Pork Facts
Quick Facts
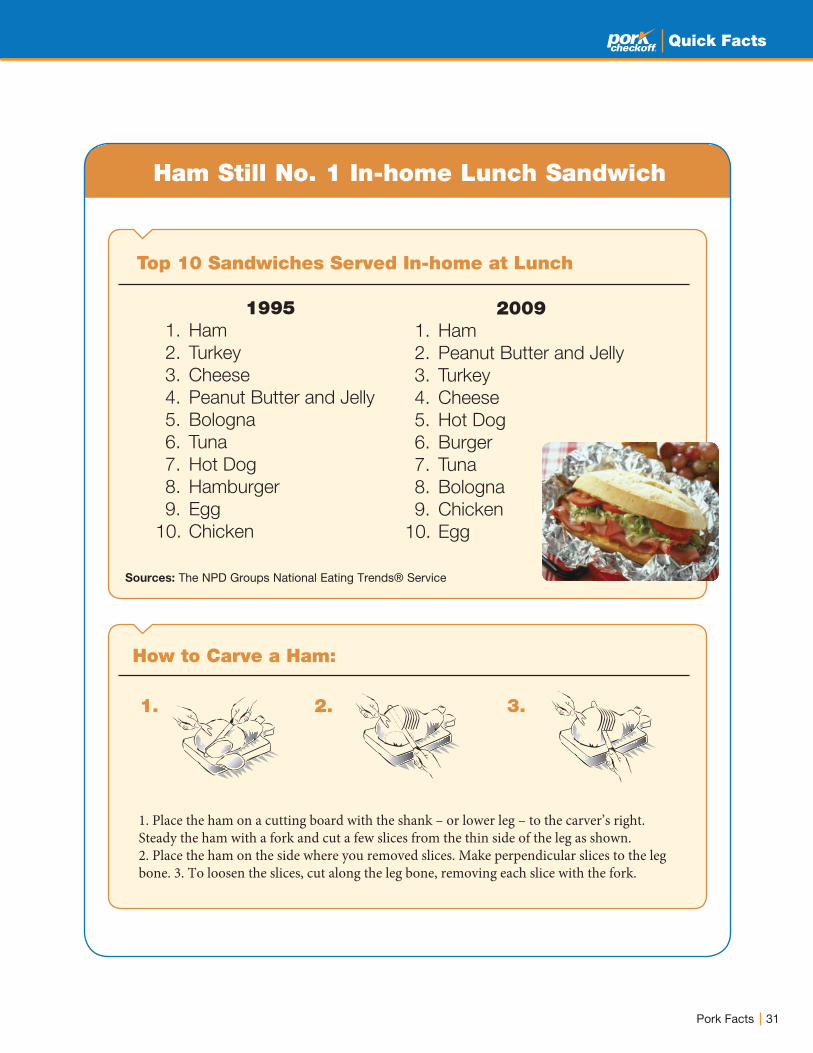
Sources: The NPD Groups National Eating Trends® Service
Top 10 Sandwiches Served In-home at Lunch
1995 1. Ham
2. Turkey
3. Cheese
4. Peanut Butter and Jelly
5. Bologna
6. Tuna
7. Hot Dog
8. Hamburger
9. Egg
10. Chicken
2009
1. Ham
2. Peanut Butter and Jelly
3. Turkey
4. Cheese
5. Hot Dog
6. Burger
7. Tuna
8. Bologna
9. Chicken
10. Egg
1. Place the ham on a cutting board with the shank – or lower leg – to the carver’s right. Steady the ham with a fork and cut a few slices from the thin side of the leg as shown. 2. Place the ham on the side where you removed slices. Make perpendicular slices to the leg bone. 3. To loosen the slices, cut along the leg bone, removing each slice with the fork.
1. 2. 3.
Ham Still No. 1 In-home Lunch Sandwich
How to Carve a Ham:
33Pork Facts
Quick Facts
Use an instant-read thermometer to determine when meat is cooked to a safe temperature. The U.S. Department of Agriculture recom-mends that pork be cooked to an internal temperature of 145° F, followed by a three-minute rest time (medium-rare), up to 160° F (medium). This range of cooking will result in a flavorful, tender and juicy eating experience.Keep hot foods hot (140° F or above) and cold foods cold (40° F or below).Never leave cooked meat out at room temperature for more than two hours (one hour in hot weather 90° F or above).Serve cooked food on a clean plate and use clean utensils. Use separate serving plates and utensils for raw and cooked meats.
Cues for the Conscientious Cook
A Plan for Preparation Wash hands, all utensils, contain-ers, cutting boards and work surfaces with warm soapy water for 20 seconds (count to 30) before and after handling meat or other food.Thaw meat in the refrigerator or microwave, not at room temperature.Do not wash raw meat before cooking.Cook meat immediately after thawing, especially if thawed by microwaving.Cut meat, poultry and fish on a separate cutting board from the one you use for fresh foods like vegetables, or thoroughly clean the cutting board between uses.
Pork Fits into a Healthy DietLeaner than ever – USDA research reveals that six of the most common cuts of pork are 16 percent leaner and contain 27 percent less saturated fat than they did 19 years ago. As a lean protein option, pork can be part of heart-healthy diet.Protein power – Women who cut calories but included more protein, including six ounces of lean pork per day, kept more muscle mass while losing weight than women who consumed the same amount of calories but less protein. Consuming a higher-protein diet also helped retain a sense of satiety or fullness after meals. Nutrient rich – One serving of pork tenderloin contains many vitamins and minerals. It’s an excel-lent source of many B-vitamins and a good source of other nutrients including phosphorus, zinc and potassium. It’s also naturally low in sodium – only 2 percent of the Daily Value per serving.

34 Pork Facts
Quick Facts
Method CutThickness/
Weight
Internal Temp.Followed By a
Three-Minute Rest
Average Recommended Cooking Time
(minutes per pound OR
total minutes)
RoastingRoast at 350° F.,
unless otherwise
noted. Roast in
a shallow pan,
uncovered
Loin Roast, Bone–In or
Boneless*2–5 lbs. 145° 20 minutes per lb.
Crown Roast* 10 lbs. 145° 12 minutes per lb.
Fresh Leg/Uncured Ham* 18-20 lbs. 145° 15 minutes per lb.
Tenderloin*
(roast at 425°F.)½–1½ lbs. 145°
20-27 minutes
total time
Ribs — Tender 1½–2 hours
Ham, fully cooked 5–6 lbs. 140° 20 minutes per lb.
Broiling
4-5 inches from heat
ORGrilling
over direct medium heat;
turn once halfway
through grilling
Loin Chops, Bone–In or
Boneless¾ inch 145° 8–9 minutes
Thick Chop 1½ inches 145° 12–16 minutes
Loin Kabobs 1 inch cubes Tender 10–15 minutes
Tenderloin ½–1½ lbs. 145° 20 minutes
Ground Pork Patties ½–inch 160° 8–10 minutes
Barbecuing
over indirect medium heat
(285° F.)
Loin Roast, Bone–In or
Boneless*2–5 lbs. 145°
2 lbs. roast =
20 minutes per lb.
3½–5 lbs roast =
15 minutes per lb.
Shoulder (Butt)* 3–6 lbs. Tender 45 minutes per lb.
Ribs — Tender 1½–2 hours
Sautéing
Add a little cooking oil
to pan; sauté over
medium-high heat and
turn once halfway through
cooking time
Cutlets ¼ inch Tender 3–4 minutes
Loin Chops, Bone–In or
Boneless¾ inch 145° 8 minutes total
Tenderloin Medallions ¼–½ inch Tender 4–8 minutes total
Ground Pork Patties ½ inch 160° 8–10 minutes total
Braising
Cook, covered, with a
liquid at a simmer; turn
once halfway through
cooking time
Loin Chops, Bone-In or
Boneless½–¾ inch 145° 6-8 minutes total
Loin Cubes 1 inch Tender 8–10 minutes
Tenderloin Medallions ½–¾ inch Tender 8–10 minutes
Shoulder Butt* 3–6 lbs. Tender 2–2½ hours
Ribs — Tender 1½–2 hours
StewingCook, covered, with liquid
at a slow simmer
Loin or Shoulder Cubes 1 inch Tender 45 minutes–1 hour
Pork today is very lean and shouldn’t be overcooked. To check doneness, use a digital cooking thermometer. The National Pork Board follows
the guidance of the U.S. Department of Agriculture, which recommends cooking roasts, tenderloins and chops to an internal temperature of
145° F, followed by a three-minute rest time, resulting in a flavorful, tender and juicy eating experience. Ground pork, like all ground meat,
should be cooked to 160° F. Pre-cooked ham can be reheated to 140° F or enjoyed cold.
*Note: For easier slicing and to let the pork juices redistribute throughout the meat, remove larger cuts, such as roasts, from the oven or grill
and let them stand for a total of 10 minutes before serving.
Pork Cooking Times and Temperatures

32 Pork Facts
Quick Facts
Quick meals – cuts that cook in 30 minutes or less
What’s for supper? Whether you’re in a hurry or have time to spend in the kitchen, pork
offers a variety of delicious options. Use this guide to help decide what cut will make the
most of your meal.
Time on your side – cuts that cook in 30 minutes or more
Cooking Tip: Paired with your favorite veggies, cubes of boneless chops or tenderloin make great kabobs.
Cooking Tip: For delicious pork burgers on the grill, form ground pork into 1/2-inch thick patties and broil 4 inches from heat for about 8 minutes.
Cooking Tip: Don’t boil ribs prior to grilling or roasting. They will keep their flavor and tenderness better if slow-cooked in the oven or over indirect heat on the grill.
Ribs: Back, spareribs, country-style
Roasts:Loin, ham,fresh leg,shoulder
Ham SteaksGround Pork
Chops:Loin, rib, sirloin, top loin, blade
Tenderloin
Making Sense of the Meatcase
33Pork Facts
Quick Facts
• Use an instant-read thermometer to determine when meat is cooked to a safe temperature. Correctly cooked pork is juicy and tender, with a slight blush of pink in the center and will be ready when it reaches an internal temperature of 160° F. For large cuts of pork, cook to 150° F and allow the roast to sit on the counter about 10 minutes before cut-ting. The temperature will rise to 160° F.
• Keep hot foods hot (140° F or above) and cold foods cold (40° F or below).
• Never leave cooked meat out at room temperature for more than two hours (one hour in hot weather 90° F or above).
• Serve cooked food on a clean plate and use clean utensils. Use separate serving plates and utensils for raw and cooked meats.
Cues for the Conscientious Cook
A Plan for Preparation • Wash hands, all utensils, contain-
ers, cutting boards and work surfaces with warm soapy water for 20 seconds (count to 30) before and after handling meat or other food.
• Thaw meat in the refrigerator or microwave, not at room temperature.
• Do not wash raw meat before cooking.• Cook meat immediately after thawing,
especially if thawed by microwaving.• Cut meat, poultry and fish on a
separate cutting board from the one you use for fresh foods like vegetables, or thoroughly clean the cutting board between uses.
Pork Fits into a Healthy DietLeaner than ever – USDA research reveals that six of the most common cuts of pork are 16 percent leaner and contain 27 percent less saturated fat than they did 19 years ago. As a lean protein option, pork can be part of heart-healthy diet.Protein power – Women who cut calories but included more protein, including six ounces of lean pork per day, kept more muscle mass while losing weight than women who consumed the same amount of calories but less protein. Consuming a higher-protein diet also helped retain a sense of satiety or fullness after meals. Nutrient rich – One serving of pork tenderloin contains many vitamins and minerals. It’s an excel-lent source of many B-vitamins and a good source of other nutrients including phosphorus, zinc and potassium. It’s also naturally low in sodium – only 2 percent of the Daily Value per serving.

35Pork Facts
Quick Facts
Convenience Drives the Dinner Menu
75 percent of consumers decide what to prepare for an in-home dinner that same day.
Four of the top five reasons listed for serving a specific dish revolve around time and ease. Family satisfaction also is important.
Source: The NPD Group’s NET Plus Dinner database
34 Pork Facts
Quick Facts
Method CutThickness/
Weight
Final Internal Temperature (Fahrenheit)
Total Cooking Time (Minutes)
RoastingRoast at 350° F.,
Roast in a shallow pan,
uncovered
Loin Roast*, Bone–In and
Boneless2–5 lbs. 150° 20 minutes per lb.
Crown Roast* 6-10 lbs. 150° 20 minutes per lb.
Fresh Leg/Uncured Ham* 3½ lbs. 150° 20 minutes per lb.
Shoulder Butt* 3-6 lbs. 160° 30 minutes per lb.
Tenderloin*
(roast at 425°F.-450°F.)½–1½ lbs. 160° 20-30 minutes
Ribs — Tender 1½–2 hours
Ham, fully cooked 5–6 lbs. 140° 20 minutes per lb.
Broiling4 inches from heat
OR
Grillingover direct heat
Loin Chops, Bone–In or
Boneless¾ inch 160° 8–10 minutes
Thick Chop 1½ inches 160° 12–16 minutes
Kabobs 1 inch cubes Tender 10–15 minutes
Tenderloin* ½–1½ lbs. 160° 15–25 minutes
Ground Pork Patties ½–inch 160° 8–10 minutes
Barbecuingover indirect heat
Loin Roast*, Bone–In or
Boneless2–5 lbs. 160° 20 minutes per lb.
Leg 3½ lbs. 160° 40 minutes per lb.
Shoulder Butt 3–6 lbs. 160° 45 minutes per lb.
Ribs — Tender 1½–2 hours
SautéingAdd a little fat to pan;
sauté over
medium-high heat
Cutlets ¼ inch Tender 3–4 minutes
Loin Chops, Bone–In or
Boneless¾ inch 160° 7-8 minutes
Tenderloin Medallions ¼–½ inch Tender 4–8 minutes
Ground Pork Patties ½ inch 160° 8–10 minutes
BraisingCook, covered,
with a liquid
at a simmer
Chops or Cutlets ¼–1 inch 160° 8-15 minutes
Cubes 1 inch Tender 8–10 minutes
Tenderloin Medallions ½–¾ inch Tender 8–10 minutes
Shoulder Butt 3–6 lbs. Tender 2–2½ hours
Ribs — Tender 1½–2 hours
StewingCook, covered, with liquid
at a slow simmer
Ribs — Tender 2–2½ hours
Cubes 1 inch Tender 45 minutes–1 hour
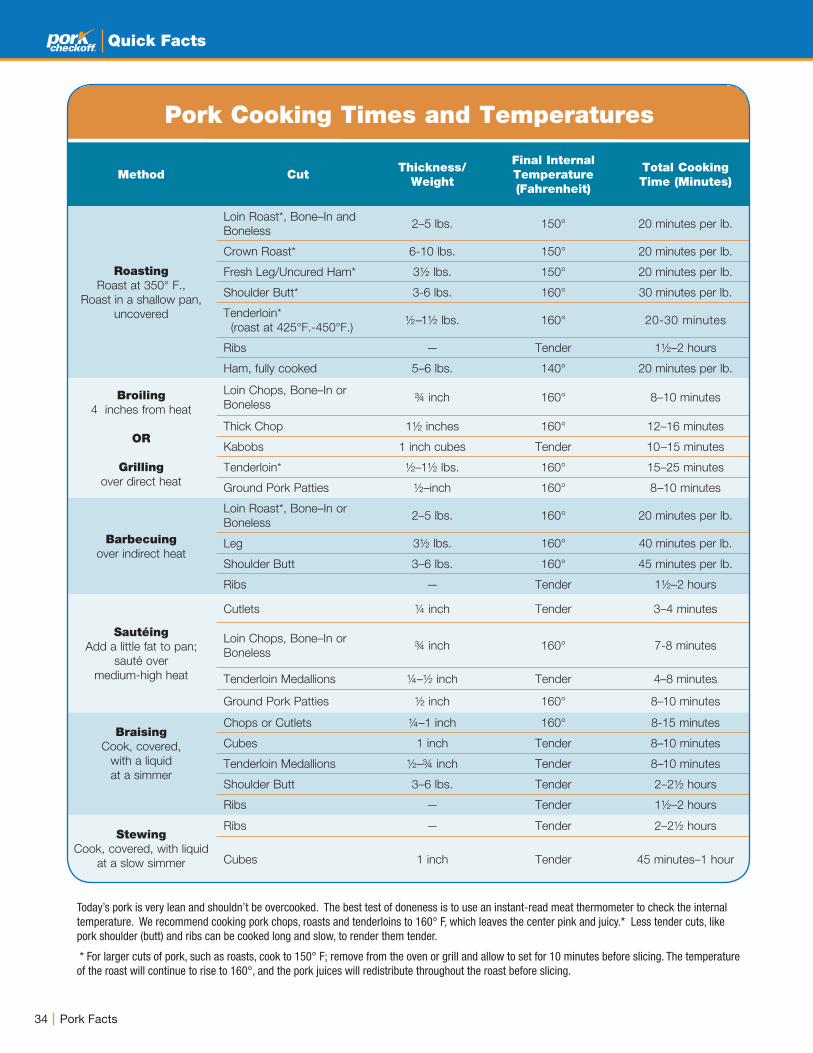
Pork Cooking Times and Temperatures
Today’s pork is very lean and shouldn’t be overcooked. The best test of doneness is to use an instant-read meat thermometer to check the internal temperature. We recommend cooking pork chops, roasts and tenderloins to 160° F, which leaves the center pink and juicy.* Less tender cuts, like pork shoulder (butt) and ribs can be cooked long and slow, to render them tender.
* For larger cuts of pork, such as roasts, cook to 150° F; remove from the oven or grill and allow to set for 10 minutes before slicing. The temperature of the roast will continue to rise to 160°, and the pork juices will redistribute throughout the roast before slicing.

35Pork Facts
Quick Facts
Convenience Drives the Dinner Menu
75 percent of consumers decide what to prepare for and in-home dinner that same day.
• 38 percent of these consumers
decide “right before” preparing.
Four of the top five reasons listed for serving a specific dish revolve around time and ease. Family satisfaction also is important.
• Requires little effort or easy
• Takes little/no planning
• Made with foods that are on hand
• Liked by everyone
• Easily cleaned up
Source: The NPD Group’s NET Plus Dinner database
ffort or easy
planning
s that are on hand
one
up
Quick Facts
36 Pork Facts
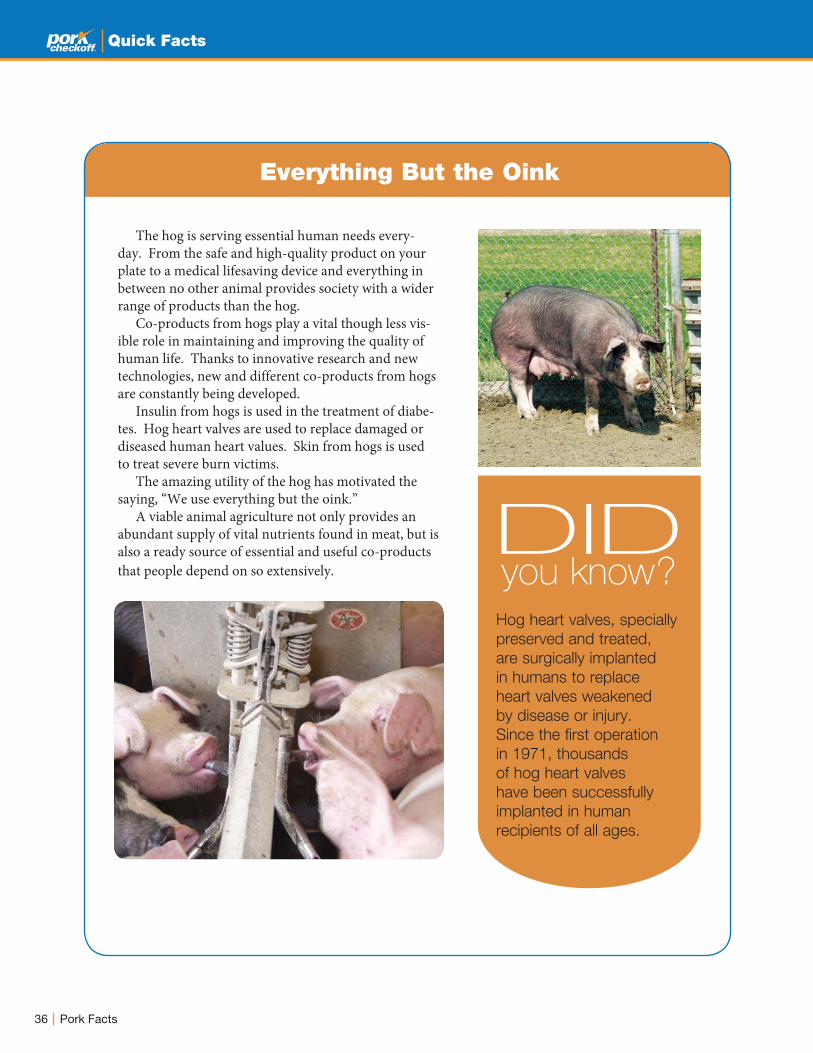
The hog is serving essential human needs every-day. From the safe and high-quality product on your plate to a medical lifesaving device and everything in between no other animal provides society with a wider range of products than the hog.
Co-products from hogs play a vital though less vis-ible role in maintaining and improving the quality of human life. Thanks to innovative research and new technologies, new and different co-products from hogs are constantly being developed.
Insulin from hogs is used in the treatment of diabe-tes. Hog heart valves are used to replace damaged or diseased human heart values. Skin from hogs is used to treat severe burn victims.
The amazing utility of the hog has motivated the saying, “We use everything but the oink.”
A viable animal agriculture not only provides an abundant supply of vital nutrients found in meat, but is also a ready source of essential and useful co-products that people depend on so extensively.
Hog heart valves, specially
preserved and treated,
are surgically implanted
in humans to replace
heart valves weakened
by disease or injury.
Since the first operation
in 1971, thousands
of hog heart valves
have been successfully
implanted in human
recipients of all ages.
DIDyou know?
Everything But the Oink

37Pork Facts
Quick Facts
Hogs also make a very significant contribution to the world of industrial and consumer products. Hog co-products are sources of chemicals used in the manufacture of a wide range of products that cannot be duplicated by syntheses. And, of course, pigskin is used extensively as high-quality leather for clothing, shoes, handbags, sporting goods, upholstery and more.Blood
Sticking AgentLeather Treating AgentsPlywood AdhesiveProtein Source in FeedsFabric Printing & Dyeing
Brains
Cholesterol
Bones & Skin
GluePigskin GarmentsGloves & Shoes
Dried Bones
ButtonsBone ChinaBone MealMineral Source in FeedFertilizerPorcelain EnamelGlassWater Filters
Gall Stones
Ornaments Hair
Artist’s BrushesInsulationUpholstery
Meat Scraps
Commercial FeedsPet food
Fatty Acids &
Glycerine
InsecticidesWeed KillersLubricantsOil Polishes
RubberCosmeticsAntifreezeNitroglycerinePlasticsPlasticizersPrinting RollersCellophaneFloor WaxesWaterproofing AgentsCementFiber SoftenersCrayonsChalk
Phonograph RecordsMatchesPuttyPaper SizingInsulationLinoleum
Pharmaceutical Co-ProductsPharmaceuticals rank second only to meat itself in the important contributions hogs make to society. Rapidly advancing science and technology are continually adding to the list of life-supporting and lifesaving products derived from the incredible hog.
Hogs are powerful medicine: All told, hogs are a source of nearly 20 drugs and pharmaceuticals.Adrenal Glands
CorticosteroidsCortisoneEpinephrineNorepinephrine
Blood
Blood AlbumensBlood FibrinFetal Pig PlasmaPlasmin
Brain
CholesterolHypothalamus
Gall Bladder
Chenodeoxycholic Acid
Everything But the Oink
Heart
Heart Valves
Intestines
EnterogastroneHeparinSecretin
Liver
Cholic Acid CatalaseDesiccated Liver
Ovaries
EstrogensProgesteroneRelaxin
Pancreas Gland
Insulin
KallikreinGlucagonLipasePancreatinTrypsinChymotrypsin
Pineal Gland
Melatonin
Pituitary Gland
ACTH - Adrenocorticotropic HormoneADH - Antidiuretic HormoneOxytocinProlactinTSH - Thyroid Stimulating Hormone
Skin
Porcine Burn DressingsGelatin
Spleen
Splenic Fluid
Stomach
PepsinMucinIntrinsic Factor
Thyroid Gland
ThyroxinCalcitoninThyrogloblin
Industrial Co-Products
38 Pork Facts
Quick Facts
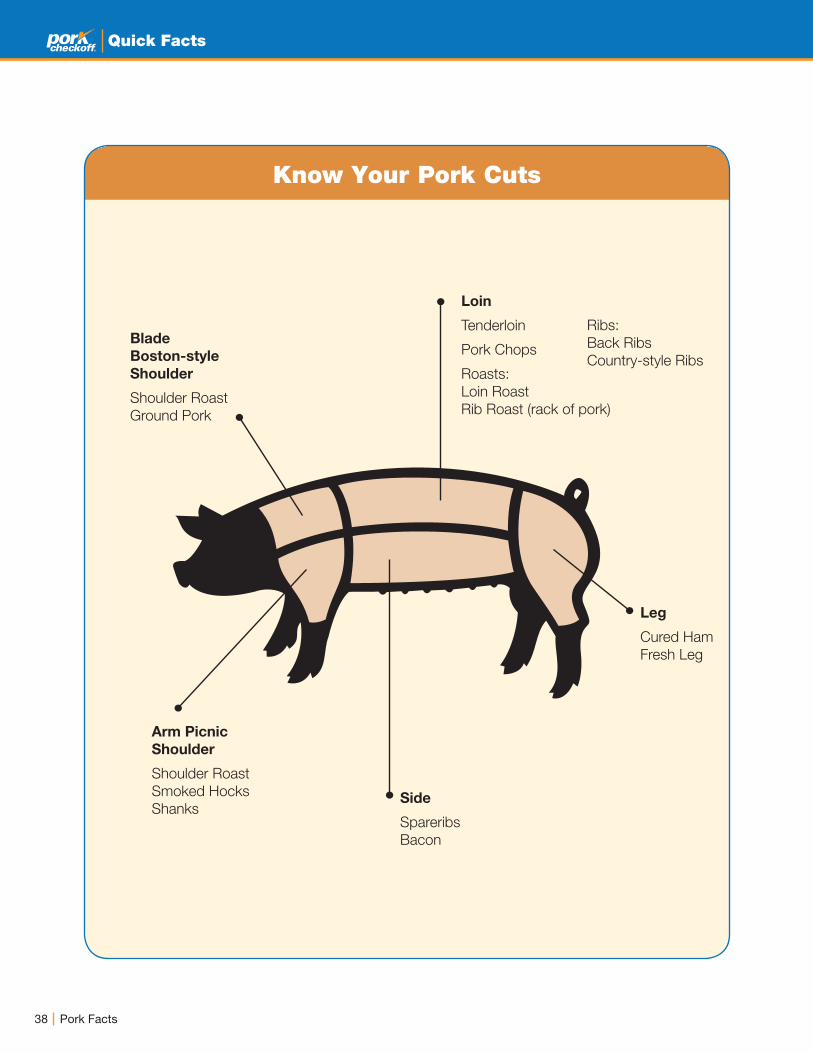
Know Your Pork Cuts
Blade
Boston-style
Shoulder
Shoulder Roast
Ground Pork
Arm Picnic
Shoulder
Shoulder Roast
Smoked Hocks
ShanksSide
Spareribs
Bacon
Leg
Cured Ham
Fresh Leg
Loin
Tenderloin
Pork Chops
Roasts:
Loin Roast
Rib Roast (rack of pork)
Ribs:
Back Ribs
Country-style Ribs
39History of Pork
History of Pork
Quick Facts
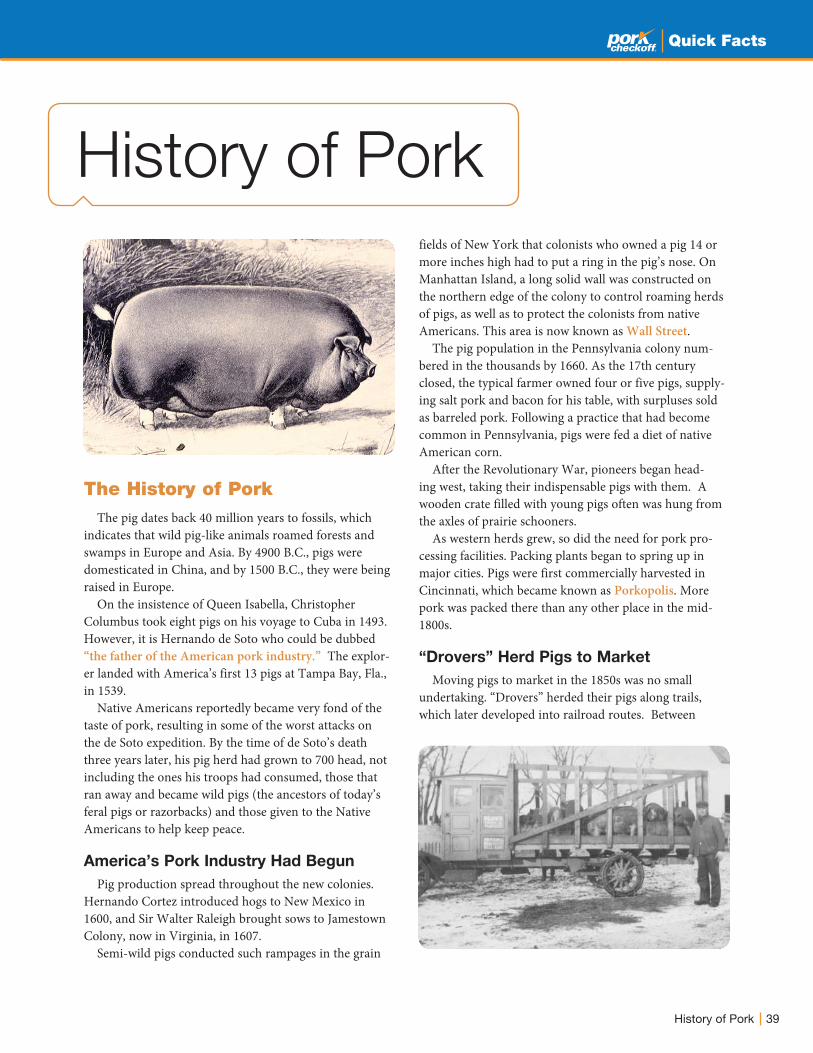
The History of PorkThe pig dates back 40 million years to fossils, which
indicates that wild pig-like animals roamed forests and swamps in Europe and Asia. By 4900 B.C., pigs were domesticated in China, and by 1500 B.C., they were being raised in Europe.
On the insistence of Queen Isabella, Christopher Columbus took eight pigs on his voyage to Cuba in 1493. However, it is Hernando de Soto who could be dubbed “the father of the American pork industry.” The explor-er landed with America’s first 13 pigs at Tampa Bay, Fla., in 1539.
Native Americans reportedly became very fond of the taste of pork, resulting in some of the worst attacks on the de Soto expedition. By the time of de Soto’s death three years later, his pig herd had grown to 700 head, not including the ones his troops had consumed, those that ran away and became wild pigs (the ancestors of today’s feral pigs or razorbacks) and those given to the Native Americans to help keep peace.
America’s Pork Industry Had Begun
Pig production spread throughout the new colonies. Hernando Cortez introduced hogs to New Mexico in 1600, and Sir Walter Raleigh brought sows to Jamestown Colony, now in Virginia, in 1607.
Semi-wild pigs conducted such rampages in the grain
fields of New York that colonists who owned a pig 14 or more inches high had to put a ring in the pig’s nose. On Manhattan Island, a long solid wall was constructed on the northern edge of the colony to control roaming herds of pigs, as well as to protect the colonists from native Americans. This area is now known as Wall Street.
The pig population in the Pennsylvania colony num-bered in the thousands by 1660. As the 17th century closed, the typical farmer owned four or five pigs, supply-ing salt pork and bacon for his table, with surpluses sold as barreled pork. Following a practice that had become common in Pennsylvania, pigs were fed a diet of native American corn.
After the Revolutionary War, pioneers began head-ing west, taking their indispensable pigs with them. A wooden crate filled with young pigs often was hung from the axles of prairie schooners.
As western herds grew, so did the need for pork pro-cessing facilities. Packing plants began to spring up in major cities. Pigs were first commercially harvested in Cincinnati, which became known as Porkopolis. More pork was packed there than any other place in the mid-1800s.
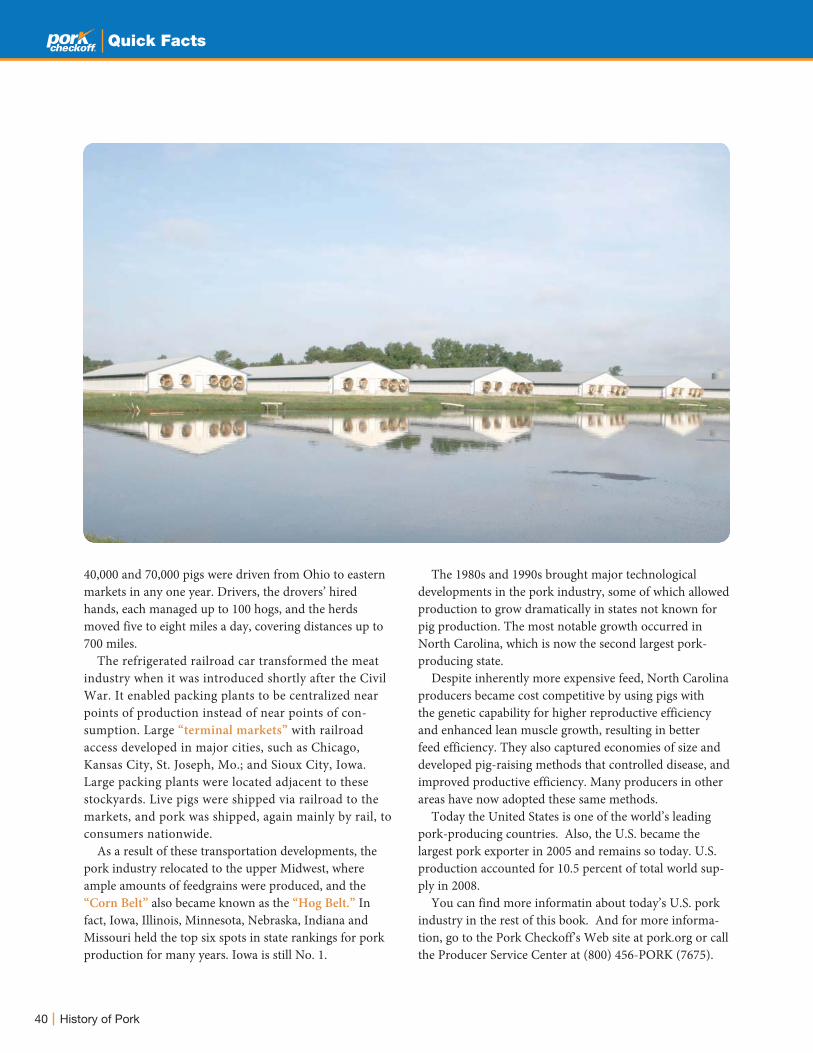
“Drovers” Herd Pigs to Market
Moving pigs to market in the 1850s was no small undertaking. “Drovers” herded their pigs along trails, which later developed into railroad routes. Between
40 History of Pork
Quick Facts
40,000 and 70,000 pigs were driven from Ohio to eastern markets in any one year. Drivers, the drovers’ hired hands, each managed up to 100 hogs, and the herds moved five to eight miles a day, covering distances up to 700 miles.
The refrigerated railroad car transformed the meat industry when it was introduced shortly after the Civil War. It enabled packing plants to be centralized near points of production instead of near points of con-sumption. Large “terminal markets” with railroad access developed in major cities, such as Chicago, Kansas City, St. Joseph, Mo.; and Sioux City, Iowa. Large packing plants were located adjacent to these stockyards. Live pigs were shipped via railroad to the markets, and pork was shipped, again mainly by rail, to consumers nationwide.
As a result of these transportation developments, the pork industry relocated to the upper Midwest, where ample amounts of feedgrains were produced, and the “Corn Belt” also became known as the “Hog Belt.” In fact, Iowa, Illinois, Minnesota, Nebraska, Indiana and Missouri held the top six spots in state rankings for pork production for many years. Iowa is still No. 1.
The 1980s and 1990s brought major technological developments in the pork industry, some of which allowed production to grow dramatically in states not known for pig production. The most notable growth occurred in North Carolina, which is now the second largest pork-producing state.
Despite inherently more expensive feed, North Carolina producers became cost competitive by using pigs with the genetic capability for higher reproductive efficiency and enhanced lean muscle growth, resulting in better feed efficiency. They also captured economies of size and developed pig-raising methods that controlled disease, and improved productive efficiency. Many producers in other areas have now adopted these same methods.
Today the United States is one of the world’s leading pork-producing countries. Also, the U.S. became the largest pork exporter in 2005 and remains so today. U.S. production accounted for 10.5 percent of total world sup-ply in 2008.
You can find more informatin about today’s U.S. pork industry in the rest of this book. And for more informa-tion, go to the Pork Checkoff’s Web site at pork.org or call the Producer Service Center at (800) 456-PORK (7675).

41Timeline
Timeline
Quick Facts
41
Quick Facts
1954 National Swine Growers Council formed to pursue goal of developing a leaner, meat-type hog and to develop more pork-specific promotion funding.
1966 Meeting of 90 pork producers – the “Moline 90” – in Moline, Ill., results in $40,000 “Get Ready” fund to launch a national voluntary market checkoff.
1967 The first voluntary market checkoff funds are collected in six pilot counties in Iowa and Illinois.
1968 Pork industry launches first national, pork-specific voluntary producer checkoff. Called “Nickels for Profit,” the program is based on a checkoff of five cents per hog.
1972 Pork industry starts celebrating October as National Pork Month.
1977 Voluntary producer checkoff is raised to 10 cents per head.
1985 The Pork Promotion, Research and Consumer Information Act of 1985 is signed into law. Known as the Pork Act, it provides a national, legislative Checkoff on sales of market hogs, breeding stock, imported hogs and pork products.
1986 National legislative Checkoff begins, with initial rate at 0.25 of one percent of the market value of each hog.
1987 The well-known national promotion campaign, Pork. The Other White Meat®, is introduced and through the Pork Checkoff
begins repositioning pork as a lean, nutritious protein source.
1988 The first World Pork Expo at the Iowa State Fairgrounds in Des Moines, Iowa, attracts 60,000 people.
1989 The Checkoff’s Pork Quality Assurance® (PQA) Program is introduced. The producer education and management program emphasizes good management practices in the handling and use of animal health products.
1989 Technology developed with producer Checkoff funds is used by McDonald’s nationally to market The McRib® pork sandwich.
1990 The Checkoff-funded Market Basket Study examines the nutrient composition of pork at supermarkets nationwide. It reinforces the Pork. The Other White Meat® slogan, and shows that pork is, on average, 31 percent leaner than it was 10 years before due to pork producers responding to consumers wanting leaner pork. Notably, the study identifies the eight cuts of pork that are as lean as chicken.
42 Timeline
Quick Facts
1991 The Checkoff rate increases to 0.35 of one percent of value (35 cents per $100 value).
1995 Through Checkoff-funded promotions and focus on market development activities, the United States becomes a net exporter of pork for the first time in more than 40 years.
1995 At the request of producers, Pork Checkoff increases to 0.45 of one percent (45 cents per $100 value). This checkoff rate stays the same until 2002.
1995 The Environmental Assurance Program (EAP) is launched to help producers meet environmental challenges.
1995 Results of the Checkoff-funded Terminal Line Genetic Evaluation Program are released. It is the largest unbiased study of genetic lines in U.S. pork industry.
1996 The second Market Basket Study confirms the comparable fat content between pork cuts and poultry cuts. This Checkoff-funded study also reinforces the initial Market Basket Study that provided revised data for USDA’s pork nutrient database, which continues to be used by nutritionists as a standard food reference.
1998 The U.S. government imposes Hazard Analysis Critical Control Point (HACCP) rules on packers. The Pork Quality Assurance® (PQA) Program provides producers a mechanism to comply.
1998 United States becomes the second largest pork exporter in the world.
2000 A Northwestern University study ranks the Pork. The Other White Meat® slogan as the fifth most recognized tagline in contemporary advertising.
2000 The Pork Checkoff plays a key role in shaping the U.S. Department of Agriculture’s point-in-time national study of the U.S. swine industry. Results are distributed in the National Animal Health Monitoring System (NAHMS).
2001 Changes from the Pork Checkoff agreement with USDA take effect July 1. The Pork Checkoff has its own location, accounting system and staff to expand domestic and foreign markets, conduct research and provide consumer information.
2001 The Checkoff-funded Transport Quality AssuranceTM (TQA) program starts, providing information on proper techniques to use when handling, loading and transporting hogs. By 2005, 330 trainers are certified to administer TQA examinations and more than 10,000 drivers are certified in the program.
2002 The Pork Checkoff rate drops 5 cents, to $0.40 per $100 of value for hogs sold in the United States.
2002 The new Pork Checkoff Service Center, now called the Producer Service Center, is launched to answer calls from individual pork producers at (800) 456-PORK (7675).
43Timeline
Quick Facts
2002 Checkoff-funded research determines that consumers spend an average of four minutes deciding what to buy in the meatcase, compared with one minute in other parts of the store. By showing that consumers take time to make their decisions at the meatcase, this research indicates that point-of-purchase promotions can be an effective way to bring pork to their attention.
2002 Pork Checkoff launches Consumer’s Choice Pork AwardsSM to showcase best new pork-based products in supermarkets.
2002 Checkoff-funded research leads to the development of Biosecurity and Security Guides.
2003 The Pork Checkoff launches the Swine Welfare Assurance ProgramSM supported by science-based research. The education and assessment program allows producers to demonstrate the care and well-being of their animals. This initiative was led by the pork producer members of the Animal Welfare Committee.
2003 The Pork Checkoff has two primary Internet sites: pork.org primarily for pork producers and TheOtherWhiteMeat.com for consumers.
2003 The United States continues to export more pork, setting a new record for pork exports for the 12th consecutive year.
2003 More than 480 producers participate in promotions related to Checkoff’s racing sponsorship. Some 61.7 million pounds of pork were sold in race -related promotions, up nearly 15 million pounds from 2002.
2003 Checkoff-funded retail promotions help sell more pork. In 2003, the Checkoff invested $1.1 million in retail promotions, or about 42 percent of the cost of the promotions. Retail partners sold 573 million pounds of pork, 16 percent more than during 2002.
2004 The Pork Quality AssuranceTM program celebrates 15 years of helping pork producers contribute to a healthy and safe food supply. Pork Checkoff launches the Youth PQA Program for youth ages 9 to 18.
2004 The Pork Checkoff creates the Animal Science Committee to serve producer needs for production and animal science-related information and research.
2004 The Pork Checkoff expands the Hispanic Marketing program to a dozen markets from five, continuing to share information that pork is lean and nutritious. The Hispanic Marketing initiative starts with Checkoff-funded research in 2001.
2004 The Operation Main Street program is launched to help train producers to share pork’s positive story, helping those
44 Timeline
Quick Facts
2006 The Pork Checkoff’s Porcine Reproductive and Respiratory Syndrome (PRRS) Initiative, has funded 18 research projects. Research needs are identified and prioritized so the USDA, university researchers, Extension personnel, animal health companies, state and federal agencies and swine veterinarians can work together to map out a plan to successfully manage and eliminate PRRS in the U.S. swine herd. It is estimated that PRRS costs U.S. producers $650 million annually.
2006 The Pork Checkoff and the Soybean Checkoff partner to create an informational campaign to help spread the word about the positive impact pork producers have on the local community.
not in pork production understand the value and importance of pork production to their local community.
2004 An advertising and information campaign for consumers who are counting carbohydrates is launched. New ads point out pork’s great taste and versatility: “Not all proteins are created equal.”
2004 TheOtherWhiteMeat.com is the Checkoff’s direct connection to consumers on the Internet. On average, more than 60,000 unique visitors come to TheOtherWhiteMeat.com each month.
2004 Through the Pork Checkoff, seven distance learning courses allow producers and their employees easy access to the latest production information via CD-ROM or the Internet.
2005 The Pork Checkoff successfully launches the new Don’t be blah™ campaign, an extension of The Other White Meat, to revitalize pork and reconnect with consumers.
2005 America’s pork producers continue to grow sales abroad, with the United States becoming the largest pork exporter.
2005 The Checkoff launches the Take Care™: Use Antibiotics Responsibly program, which defines how antibiotics should be used in pork production. This program helps identify pork producers as responsible stewards and caretakers, who are concerned with public health.
2009
I’m a pork producer. I’m a soybean farmer.
©2007 National Pork Board ©2007 United Soybean Board [29348 pk 05/07]
800-456-PORK www.pork.org www.animalag.org
Together, we raise our community’s standard of living.
Th e swine industry is the soybean industry’s second largest domestic customer. Pork producers purchase over 8.7 million tons of locally grown soybean meal to feed their hogs. And that’s just part of their economic impact. Th ey also account for more than 340,000 jobs nationwide, and generate more than $1.6 billion in tax revenue. A strong animal agriculture industry helps ensure a better living for pork producers, soybean farmers and the entire rural community.
Brought to you by America’s pork producers and soybean farmers.

Quick Facts
2006 A Web-based Air Management Practices Assessment Tool is designed to assist producers in identifying practices to address air quality issues on their farm in the areas of animal housing, manure storage and land application.
2007 A study of the economic value of Pork Checkoff programs concludes that the Checkoff has a significantly positive effect on the demand for hogs and pork. Specific results indicate that producers would gain an additional $13.80 for each additional $1 of program expenditures.
2007 Over 1,600 Operation Main Street presentations reach over 44,000 people. The Neighbor-to-Neighbor program, a three-hour short-course to help producers answer tough questions, trains 715 producers.
2007 U.S. Pork exports broke records for the 16th consecutive year. Exports totaled 1.3 million metric tons, nearly 2.9 billion pounds, at a value exceeding $3.15 billion.
2007 The Pork Quality Assurance Plus (PQA Plus®) program is introduced to pork producers at World Pork Expo. The workable, affordable, credible on-farm program answers customers’ questions about animal care and food safety. Over 5,300 producers are certified.
2008 The Pork Checkoff launches The Other White Meat® Tour, designed to involve consumers in a pork experience. The tour reaches pork’s consumer target audience with stops at 23 high-traffic events across the U.S. The tour stops celebrate pork’s positive benefits through cooking demonstrations, product sampling and one-on-one interactions.
2008 Historically unprecedented high feed costs lead to one of the most challenging times in history for pork producers. The blow, softened only by record-high market hog prices, causes many producers extreme financial distress. The Pork Checkoff provides producers tools to work with their lenders and information to help weather the storm, including how to take advantage of marketing opportunities and identify opportunities to improve efficiency in their production.
2008 Pork’s new spokesperson Guy Fieri (below), one of the rising stars of the Food Network
Channel, excites consumers about pork’s personality, flavor and fun
during promotions.
45Timeline
46 Timeline
Quick Facts
2008 The We Care, joint industry initiative is launched to help build consumer trust. Six ethical principles outline producers’ commitment to producing safe food, while protecting animal well-being, natural resources, public health and the environment, as well as contributing to their communities.
2009 Beginning in April, news coverage of H1N1, or “swine flu” as it was erroneously referred to by the media, added to an already challenging economic time for producers. It was estimated that producers lost more than $2 billion after the outbreak of H1N1.
2009 Over 40,000 producers and employees are certified in PQA Plus®, the most ever since
the program’s inception in 1989. And over 7,000 on-farm site assessments are completed, representing nearly 30 percent of the total U.S. hog inventory.
2009 The redesigned TheOtherWhiteMeat.com Web site features over 1,700 recipes and a new look to make it even easier for consumers to find the basics on pork cooking. The site remains the Checkoff’s go-to source for all things pork for consumers.
2009 Operation Main Street celebrates its 5th anniversary. More than 750 participants have made over 3,500 presentations, reaching millions of people through their talks and media coverage.
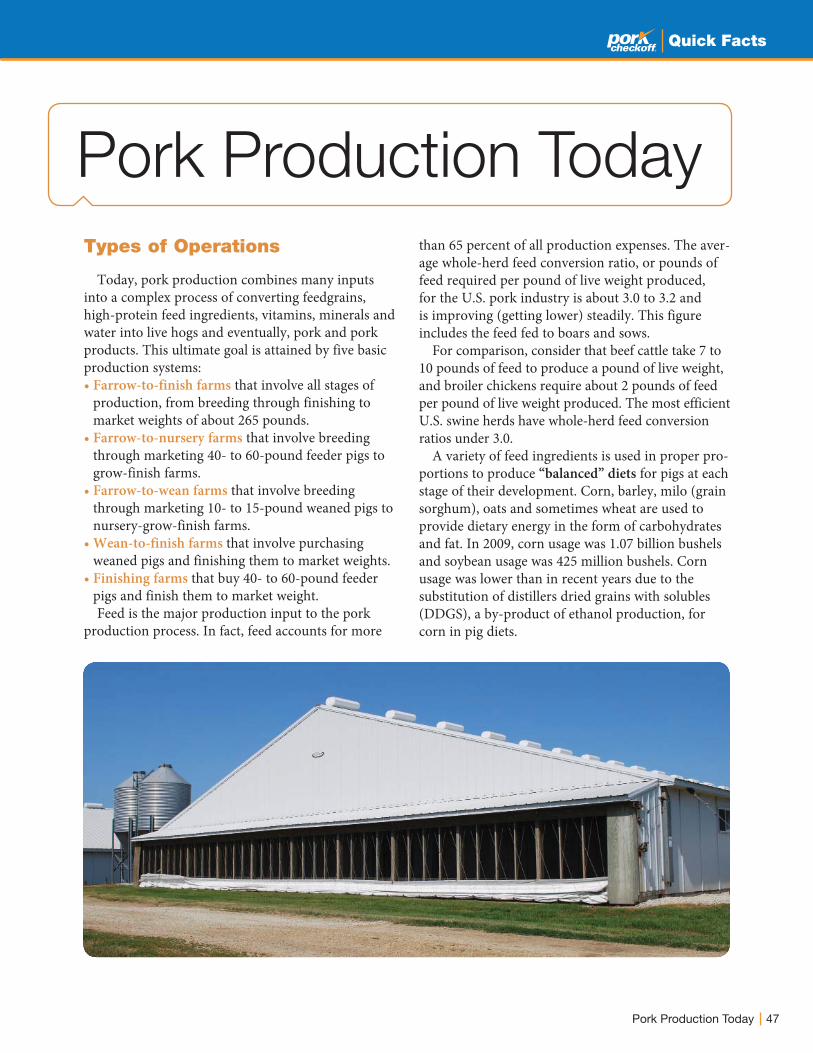
47Pork Production Today
Quick Facts
Pork Production Today
Types of Operations
Today, pork production combines many inputs into a complex process of converting feedgrains, high-protein feed ingredients, vitamins, minerals and water into live hogs and eventually, pork and pork products. This ultimate goal is attained by five basic production systems:• Farrow-to-finish farms that involve all stages of
production, from breeding through finishing to market weights of about 265 pounds.
• Farrow-to-nursery farms that involve breeding through marketing 40- to 60-pound feeder pigs to grow-finish farms.
• Farrow-to-wean farms that involve breeding through marketing 10- to 15-pound weaned pigs to nursery-grow-finish farms.
• Wean-to-finish farms that involve purchasing weaned pigs and finishing them to market weights.
• Finishing farms that buy 40- to 60-pound feeder pigs and finish them to market weight. Feed is the major production input to the pork
production process. In fact, feed accounts for more
than 65 percent of all production expenses. The aver-age whole-herd feed conversion ratio, or pounds of feed required per pound of live weight produced, for the U.S. pork industry is about 3.0 to 3.2 and is improving (getting lower) steadily. This figure includes the feed fed to boars and sows.
For comparison, consider that beef cattle take 7 to 10 pounds of feed to produce a pound of live weight, and broiler chickens require about 2 pounds of feed per pound of live weight produced. The most efficient U.S. swine herds have whole-herd feed conversion ratios under 3.0.
A variety of feed ingredients is used in proper pro-portions to produce “balanced” diets for pigs at each stage of their development. Corn, barley, milo (grain sorghum), oats and sometimes wheat are used to provide dietary energy in the form of carbohydrates and fat. In 2009, corn usage was 1.07 billion bushels and soybean usage was 425 million bushels. Corn usage was lower than in recent years due to the substitution of distillers dried grains with solubles (DDGS), a by-product of ethanol production, for corn in pig diets.
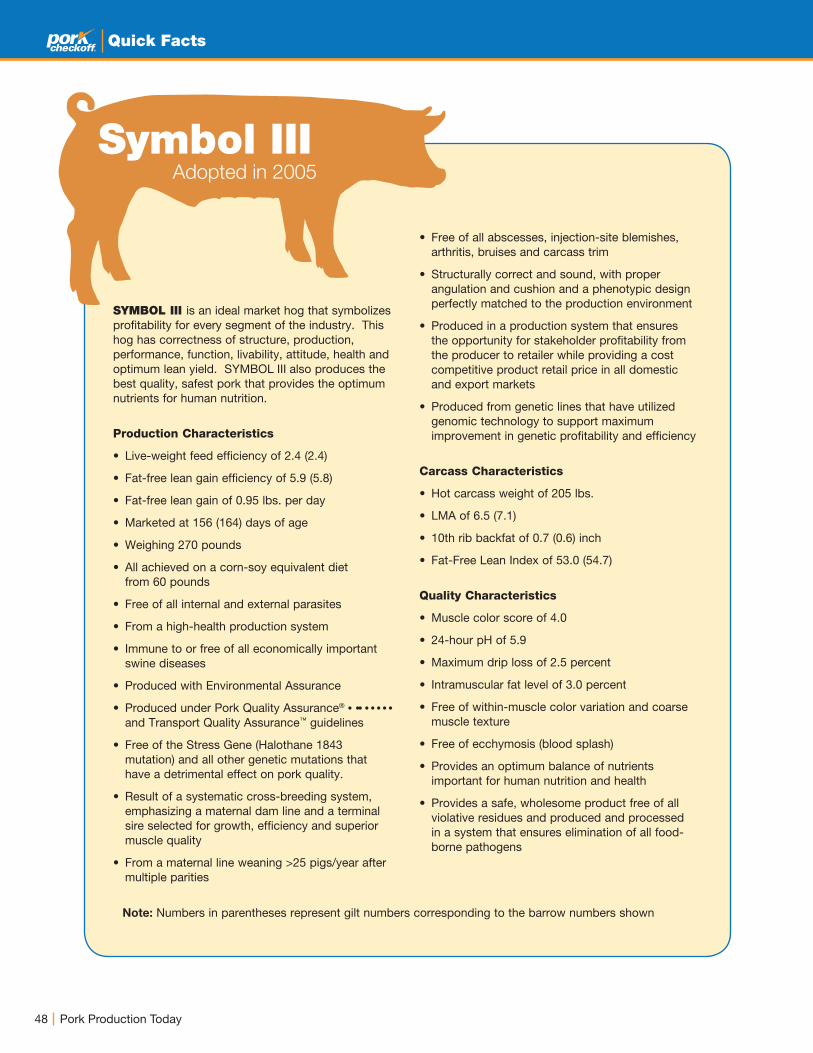
48 Pork Production Today
Quick Facts
Symbol IIIAdopted in 2005
SYMBOL III is an ideal market hog that symbolizes profitability for every segment of the industry. This hog has correctness of structure, production, performance, function, livability, attitude, health and optimum lean yield. SYMBOL III also produces the best quality, safest pork that provides the optimum nutrients for human nutrition.
Production Characteristics
• Live-weight feed efficiency of 2.4 (2.4)
• Fat-free lean gain efficiency of 5.9 (5.8)
• Fat-free lean gain of 0.95 lbs. per day
• Marketed at 156 (164) days of age
• Weighing 270 pounds
• All achieved on a corn-soy equivalent diet from 60 pounds
• Free of all internal and external parasites
• From a high-health production system
• Immune to or free of all economically important swine diseases
• Produced with Environmental Assurance
• Produced under Pork Quality Assurance® • •• • • • • •and Transport Quality Assurance™ guidelines
• Free of the Stress Gene (Halothane 1843 mutation) and all other genetic mutations that have a detrimental effect on pork quality.
• Result of a systematic cross-breeding system, emphasizing a maternal dam line and a terminal sire selected for growth, efficiency and superior muscle quality
• From a maternal line weaning >25 pigs/year after multiple parities
• Free of all abscesses, injection-site blemishes, arthritis, bruises and carcass trim
• Structurally correct and sound, with proper angulation and cushion and a phenotypic design perfectly matched to the production environment
• Produced in a production system that ensures the opportunity for stakeholder profitability from the producer to retailer while providing a cost competitive product retail price in all domestic and export markets
• Produced from genetic lines that have utilized genomic technology to support maximum improvement in genetic profitability and efficiency
Carcass Characteristics
• Hot carcass weight of 205 lbs.
• LMA of 6.5 (7.1)
• 10th rib backfat of 0.7 (0.6) inch
• Fat-Free Lean Index of 53.0 (54.7)
Quality Characteristics
• Muscle color score of 4.0
• 24-hour pH of 5.9
• Maximum drip loss of 2.5 percent
• Intramuscular fat level of 3.0 percent
• Free of within-muscle color variation and coarse muscle texture
• Free of ecchymosis (blood splash)
• Provides an optimum balance of nutrients important for human nutrition and health
• Provides a safe, wholesome product free of all violative residues and produced and processed in a system that ensures elimination of all food- borne pathogens
Note: Numbers in parentheses represent gilt numbers corresponding to the barrow numbers shown
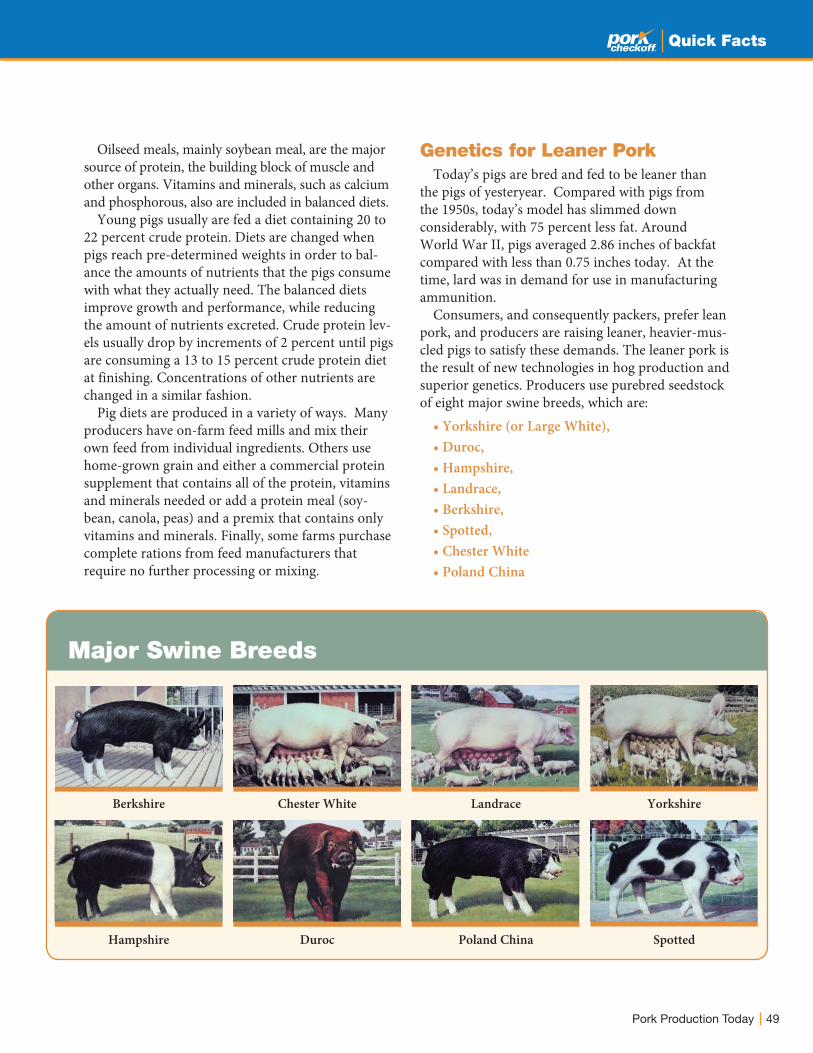
49Pork Production Today
Quick Facts
Berkshire Chester White Landrace Yorkshire
SpottedPoland ChinaDurocHampshire
Major Swine Breeds
Oilseed meals, mainly soybean meal, are the major source of protein, the building block of muscle and other organs. Vitamins and minerals, such as calcium and phosphorous, also are included in balanced diets.
Young pigs usually are fed a diet containing 20 to 22 percent crude protein. Diets are changed when pigs reach pre-determined weights in order to bal-ance the amounts of nutrients that the pigs consume with what they actually need. The balanced diets improve growth and performance, while reducing the amount of nutrients excreted. Crude protein lev-els usually drop by increments of 2 percent until pigs are consuming a 13 to 15 percent crude protein diet at finishing. Concentrations of other nutrients are changed in a similar fashion.
Pig diets are produced in a variety of ways. Many producers have on-farm feed mills and mix their own feed from individual ingredients. Others use home-grown grain and either a commercial protein supplement that contains all of the protein, vitamins and minerals needed or add a protein meal (soy-bean, canola, peas) and a premix that contains only vitamins and minerals. Finally, some farms purchase complete rations from feed manufacturers that require no further processing or mixing.
Genetics for Leaner PorkToday’s pigs are bred and fed to be leaner than
the pigs of yesteryear. Compared with pigs from the 1950s, today’s model has slimmed down considerably, with 75 percent less fat. Around World War II, pigs averaged 2.86 inches of backfat compared with less than 0.75 inches today. At the time, lard was in demand for use in manufacturing ammunition.
Consumers, and consequently packers, prefer lean pork, and producers are raising leaner, heavier-mus-cled pigs to satisfy these demands. The leaner pork is the result of new technologies in hog production and superior genetics. Producers use purebred seedstock of eight major swine breeds, which are:
• Yorkshire (or Large White), • Duroc, • Hampshire, • Landrace, • Berkshire, • Spotted, • Chester White• Poland China
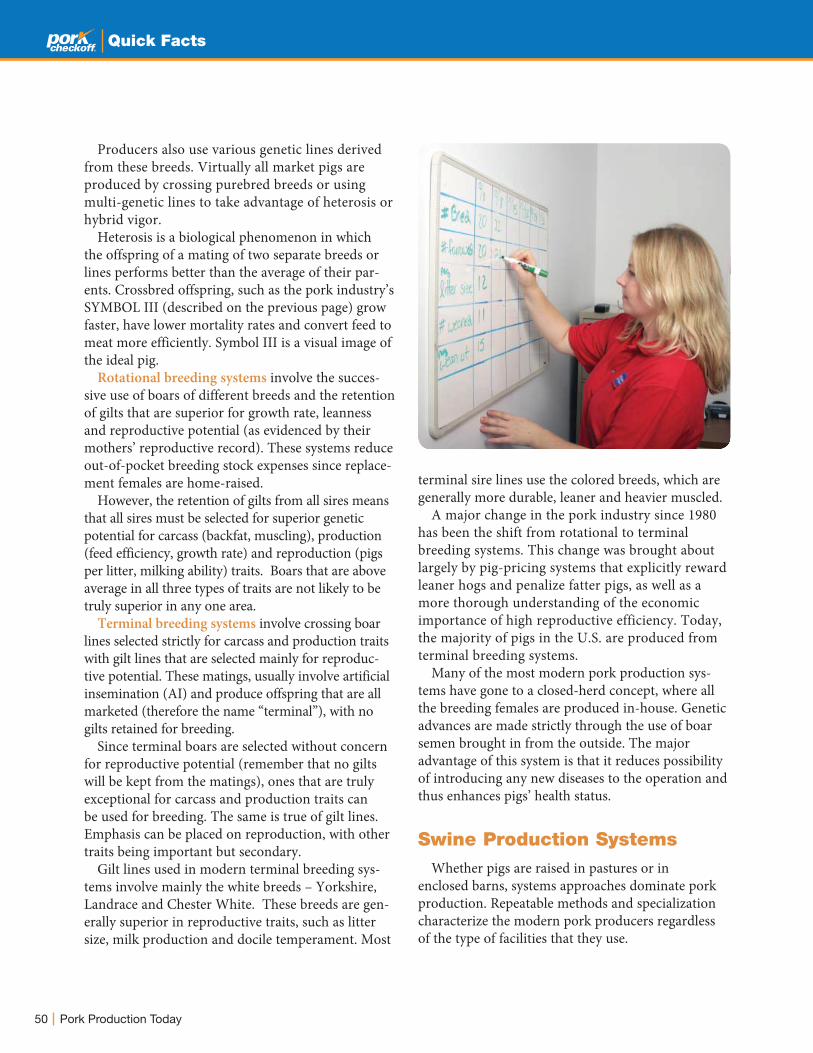
50 Pork Production Today
Quick Facts
Producers also use various genetic lines derived from these breeds. Virtually all market pigs are produced by crossing purebred breeds or using multi-genetic lines to take advantage of heterosis or hybrid vigor.
Heterosis is a biological phenomenon in which the offspring of a mating of two separate breeds or lines performs better than the average of their par-ents. Crossbred offspring, such as the pork industry’s SYMBOL III (described on the previous page) grow faster, have lower mortality rates and convert feed to meat more efficiently. Symbol III is a visual image of the ideal pig.
Rotational breeding systems involve the succes-sive use of boars of different breeds and the retention of gilts that are superior for growth rate, leanness and reproductive potential (as evidenced by their mothers’ reproductive record). These systems reduce out-of-pocket breeding stock expenses since replace-ment females are home-raised.
However, the retention of gilts from all sires means that all sires must be selected for superior genetic potential for carcass (backfat, muscling), production (feed efficiency, growth rate) and reproduction (pigs per litter, milking ability) traits. Boars that are above average in all three types of traits are not likely to be truly superior in any one area.
Terminal breeding systems involve crossing boar lines selected strictly for carcass and production traits with gilt lines that are selected mainly for reproduc-tive potential. These matings, usually involve artificial insemination (AI) and produce offspring that are all marketed (therefore the name “terminal”), with no gilts retained for breeding.
Since terminal boars are selected without concern for reproductive potential (remember that no gilts will be kept from the matings), ones that are truly exceptional for carcass and production traits can be used for breeding. The same is true of gilt lines. Emphasis can be placed on reproduction, with other traits being important but secondary.
Gilt lines used in modern terminal breeding sys-tems involve mainly the white breeds – Yorkshire, Landrace and Chester White. These breeds are gen-erally superior in reproductive traits, such as litter size, milk production and docile temperament. Most
terminal sire lines use the colored breeds, which are generally more durable, leaner and heavier muscled.
A major change in the pork industry since 1980 has been the shift from rotational to terminal breeding systems. This change was brought about largely by pig-pricing systems that explicitly reward leaner hogs and penalize fatter pigs, as well as a more thorough understanding of the economic importance of high reproductive efficiency. Today, the majority of pigs in the U.S. are produced from terminal breeding systems.
Many of the most modern pork production sys-tems have gone to a closed-herd concept, where all the breeding females are produced in-house. Genetic advances are made strictly through the use of boar semen brought in from the outside. The major advantage of this system is that it reduces possibility of introducing any new diseases to the operation and thus enhances pigs’ health status.
Swine Production SystemsWhether pigs are raised in pastures or in
enclosed barns, systems approaches dominate pork production. Repeatable methods and specialization characterize the modern pork producers regardless of the type of facilities that they use.

51Pork Production Today
Quick Facts
Housing System Description Benefits Challenges
Barn
(Confinement)
• Either naturally or mechanically ventilated, or a combination of the two, depending on the season.
• Bedding optional.• Can accommodate group and
individual housing.
• Reasonable control of the environment.
• Separation of manure from the pig resulting in fewer opportunities for disease transmission.
• Easy to clean and disinfect.• Multiple pens allow for split-sex
feeding and separation of pigs by weight.
• Excellent parasite control opportunities.
• Multiple pens and feeders allow for age-appropriate diets to be fed.
• Less time required for observing and managing pigs.
• High capital investment in a single purpose building.
Hoop Barn
• A lower-cost facility. • Deep bedding used to absorb
manure, which is handled as a solid.
• Usually used for gestation and grow-finish pigs.
• Group sizes often 100 or more.
• Low investment cost per pig.• Multiple-use building (can be
used for other storage purposes if notfor pigs).
• Reasonable control of the environment with adequate bedding.
• Lots of bedding required plus a place to store the bedding.
• Can be difficult to cool pigs in hot, humid weather.
• More difficult to identify and treat sick pigs.
• Difficult to clean and disinfect.• Difficult to separate pigs from
the manure.• More time required for handling
and bedding pigs.
Pasture
• Used for all stages of production, with obvious seasonal limitations for winter production in some parts of the United States.
• Pasture production systems involve intensive production management and pasture rotation.
• Low cost of facilities, but the opportunity cost of the land for crop production must be considered.
• Ability to disperse pigs over a large area.
• Low cost of facilities.• Quality forage on the pasture
can meet a portion of pigs’ nutritional needs.
• Ability to root and forage.
• Minimal control of the environment.• Difficult to clean and disinfect,
requiring adequate pastures to allow for rotation to clean ground each year.
• Controlling predators necessary.• Control of diseases spread by
wild animals.• Managing in cold, hot or rainy weather.• Parasite control needed.• More time required for
individually treating and handling pigs.
• Ground cover needs to be maintained.
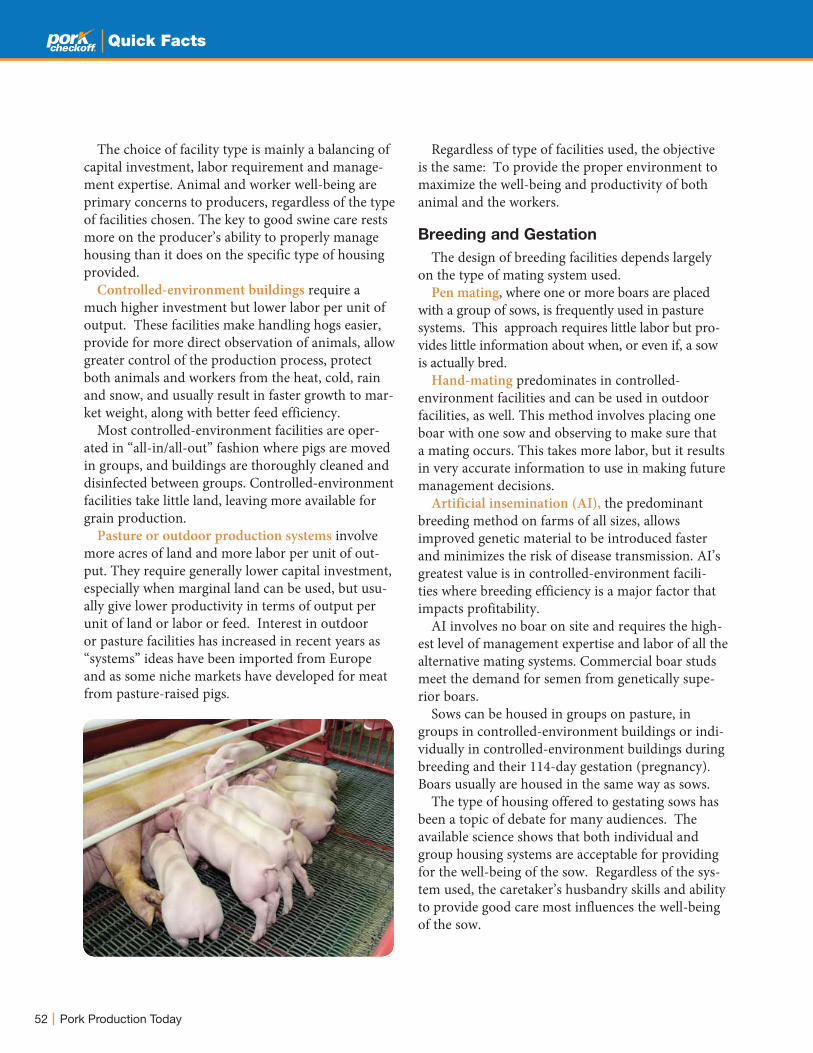
52 Pork Production Today
Quick Facts
The choice of facility type is mainly a balancing of capital investment, labor requirement and manage-ment expertise. Animal and worker well-being are primary concerns to producers, regardless of the type of facilities chosen. The key to good swine care rests more on the producer’s ability to properly manage housing than it does on the specific type of housing provided.
Controlled-environment buildings require a much higher investment but lower labor per unit of output. These facilities make handling hogs easier, provide for more direct observation of animals, allow greater control of the production process, protect both animals and workers from the heat, cold, rain and snow, and usually result in faster growth to mar-ket weight, along with better feed efficiency.
Most controlled-environment facilities are oper-ated in “all-in/all-out” fashion where pigs are moved in groups, and buildings are thoroughly cleaned and disinfected between groups. Controlled-environment facilities take little land, leaving more available for grain production.
Pasture or outdoor production systems involve more acres of land and more labor per unit of out-put. They require generally lower capital investment, especially when marginal land can be used, but usu-ally give lower productivity in terms of output per unit of land or labor or feed. Interest in outdoor or pasture facilities has increased in recent years as “systems” ideas have been imported from Europe and as some niche markets have developed for meat from pasture-raised pigs.
Regardless of type of facilities used, the objective is the same: To provide the proper environment to maximize the well-being and productivity of both animal and the workers.
Breeding and Gestation
The design of breeding facilities depends largely on the type of mating system used.
Pen mating, where one or more boars are placed with a group of sows, is frequently used in pasture systems. This approach requires little labor but pro-vides little information about when, or even if, a sow is actually bred.
Hand-mating predominates in controlled-environment facilities and can be used in outdoor facilities, as well. This method involves placing one boar with one sow and observing to make sure that a mating occurs. This takes more labor, but it results in very accurate information to use in making future management decisions.
Artificial insemination (AI), the predominant breeding method on farms of all sizes, allows improved genetic material to be introduced faster and minimizes the risk of disease transmission. AI’s greatest value is in controlled-environment facili-ties where breeding efficiency is a major factor that impacts profitability.
AI involves no boar on site and requires the high-est level of management expertise and labor of all the alternative mating systems. Commercial boar studs meet the demand for semen from genetically supe-rior boars.
Sows can be housed in groups on pasture, in groups in controlled-environment buildings or indi-vidually in controlled-environment buildings during breeding and their 114-day gestation (pregnancy). Boars usually are housed in the same way as sows.
The type of housing offered to gestating sows has been a topic of debate for many audiences. The available science shows that both individual and group housing systems are acceptable for providing for the well-being of the sow. Regardless of the sys-tem used, the caretaker’s husbandry skills and ability to provide good care most influences the well-being of the sow.
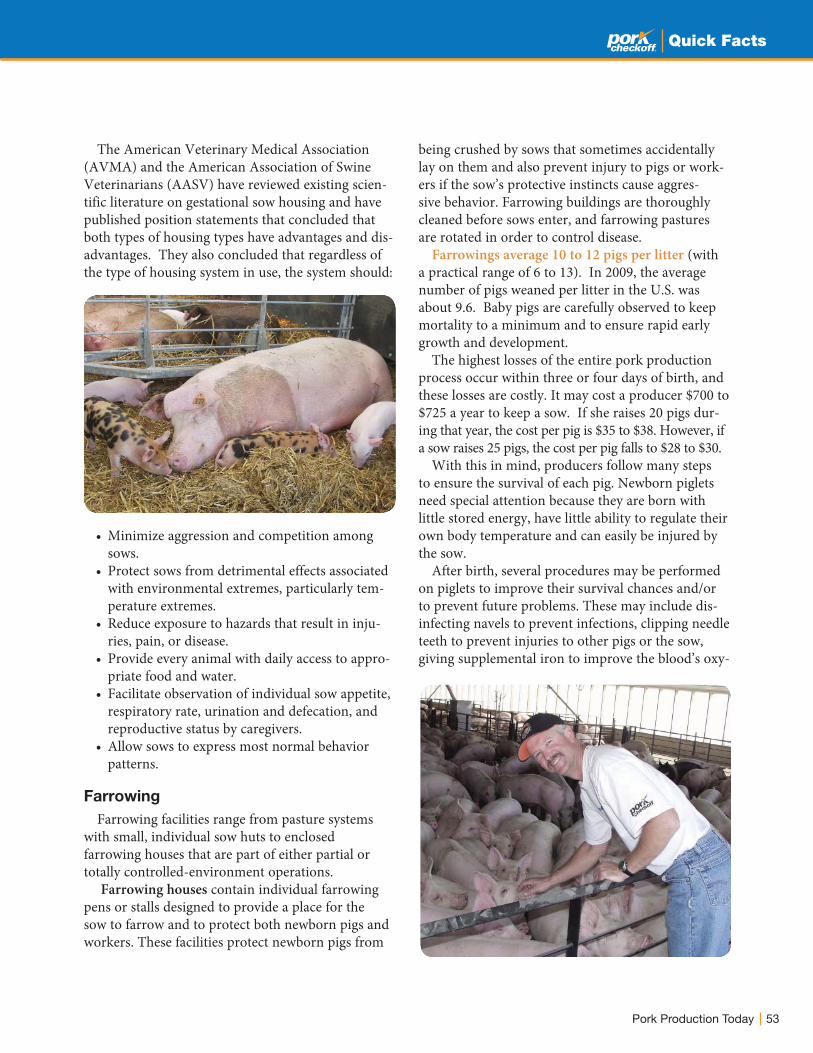
Quick Facts
The American Veterinary Medical Association (AVMA) and the American Association of Swine Veterinarians (AASV) have reviewed existing scien-tific literature on gestational sow housing and have published position statements that concluded that both types of housing types have advantages and dis-advantages. They also concluded that regardless of the type of housing system in use, the system should:
• Minimize aggression and competition among sows.
• Protect sows from detrimental effects associated with environmental extremes, particularly tem-perature extremes.
• Reduce exposure to hazards that result in inju-ries, pain, or disease.
• Provide every animal with daily access to appro-priate food and water.
• Facilitate observation of individual sow appetite, respiratory rate, urination and defecation, and reproductive status by caregivers.
• Allow sows to express most normal behavior patterns.
Farrowing
Farrowing facilities range from pasture systems with small, individual sow huts to enclosed farrowing houses that are part of either partial or totally controlled-environment operations.
Farrowing houses contain individual farrowing pens or stalls designed to provide a place for the sow to farrow and to protect both newborn pigs and workers. These facilities protect newborn pigs from
being crushed by sows that sometimes accidentally lay on them and also prevent injury to pigs or work-ers if the sow’s protective instincts cause aggres-sive behavior. Farrowing buildings are thoroughly cleaned before sows enter, and farrowing pastures are rotated in order to control disease.
Farrowings average 10 to 12 pigs per litter (with a practical range of 6 to 13). In 2009, the average number of pigs weaned per litter in the U.S. was about 9.6. Baby pigs are carefully observed to keep mortality to a minimum and to ensure rapid early growth and development.
The highest losses of the entire pork production process occur within three or four days of birth, and these losses are costly. It may cost a producer $700 to $725 a year to keep a sow. If she raises 20 pigs dur-ing that year, the cost per pig is $35 to $38. However, if a sow raises 25 pigs, the cost per pig falls to $28 to $30.
With this in mind, producers follow many steps to ensure the survival of each pig. Newborn piglets need special attention because they are born with little stored energy, have little ability to regulate their own body temperature and can easily be injured by the sow.
After birth, several procedures may be performed on piglets to improve their survival chances and/or to prevent future problems. These may include dis-infecting navels to prevent infections, clipping needle teeth to prevent injuries to other pigs or the sow, giving supplemental iron to improve the blood’s oxy-
53Pork Production Today
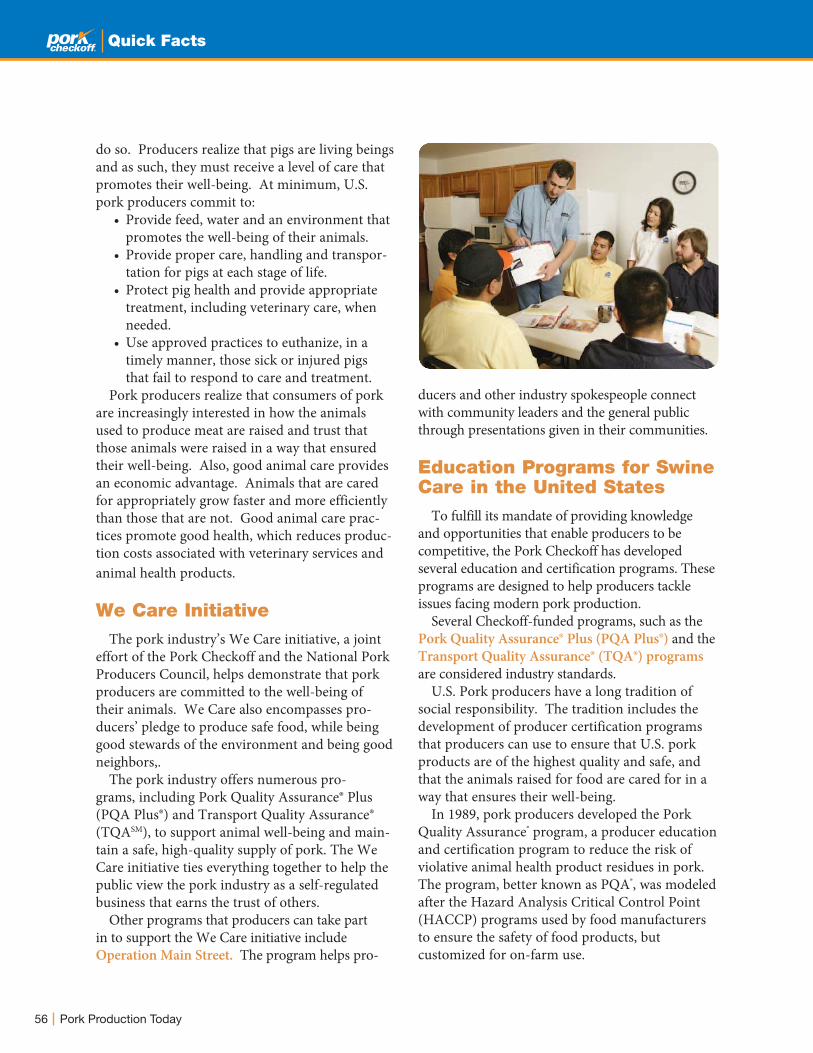
56 Pork Production Today
Quick Facts
ducers and other industry spokespeople connect with community leaders and the general public through presentations given in their communities.
Education Programs for Swine Care in the United States
To fulfill its mandate of providing knowledge and opportunities that enable producers to be competitive, the Pork Checkoff has developed several education and certification programs. These programs are designed to help producers tackle issues facing modern pork production.
Several Checkoff-funded programs, such as the Pork Quality Assurance® Plus (PQA Plus®) and the Transport Quality Assurance® (TQA®) programs are considered industry standards.
U.S. Pork producers have a long tradition of social responsibility. The tradition includes the development of producer certification programs that producers can use to ensure that U.S. pork products are of the highest quality and safe, and that the animals raised for food are cared for in a way that ensures their well-being.
In 1989, pork producers developed the Pork Quality Assurance® program, a producer education and certification program to reduce the risk of violative animal health product residues in pork. The program, better known as PQA®, was modeled after the Hazard Analysis Critical Control Point (HACCP) programs used by food manufacturers to ensure the safety of food products, but customized for on-farm use.
do so. Producers realize that pigs are living beings and as such, they must receive a level of care that promotes their well-being. At minimum, U.S. pork producers commit to:
Provide feed, water and an environment that promotes the well-being of their animals. Provide proper care, handling and transpor-tation for pigs at each stage of life. Protect pig health and provide appropriate treatment, including veterinary care, when needed. Use approved practices to euthanize, in a timely manner, those sick or injured pigs that fail to respond to care and treatment.
Pork producers realize that consumers of pork are increasingly interested in how the animals used to produce meat are raised and trust that those animals were raised in a way that ensured their well-being. Also, good animal care provides an economic advantage. Animals that are cared for appropriately grow faster and more efficiently than those that are not. Good animal care prac-tices promote good health, which reduces produc-tion costs associated with veterinary services and animal health products.
We Care InitiativeThe pork industry’s We Care initiative, a joint
effort of the Pork Checkoff and the National Pork Producers Council, helps demonstrate that pork producers are committed to the well-being of their animals. We Care also encompasses pro-ducers’ pledge to produce safe food, while being good stewards of the environment and being good neighbors,.
The pork industry offers numerous pro-grams, including Pork Quality Assurance® Plus (PQA Plus®) and Transport Quality Assurance® (TQASM), to support animal well-being and main-tain a safe, high-quality supply of pork. The We Care initiative ties everything together to help the public view the pork industry as a self-regulated business that earns the trust of others.
Other programs that producers can take part in to support the We Care initiative include Operation Main Street. The program helps pro-
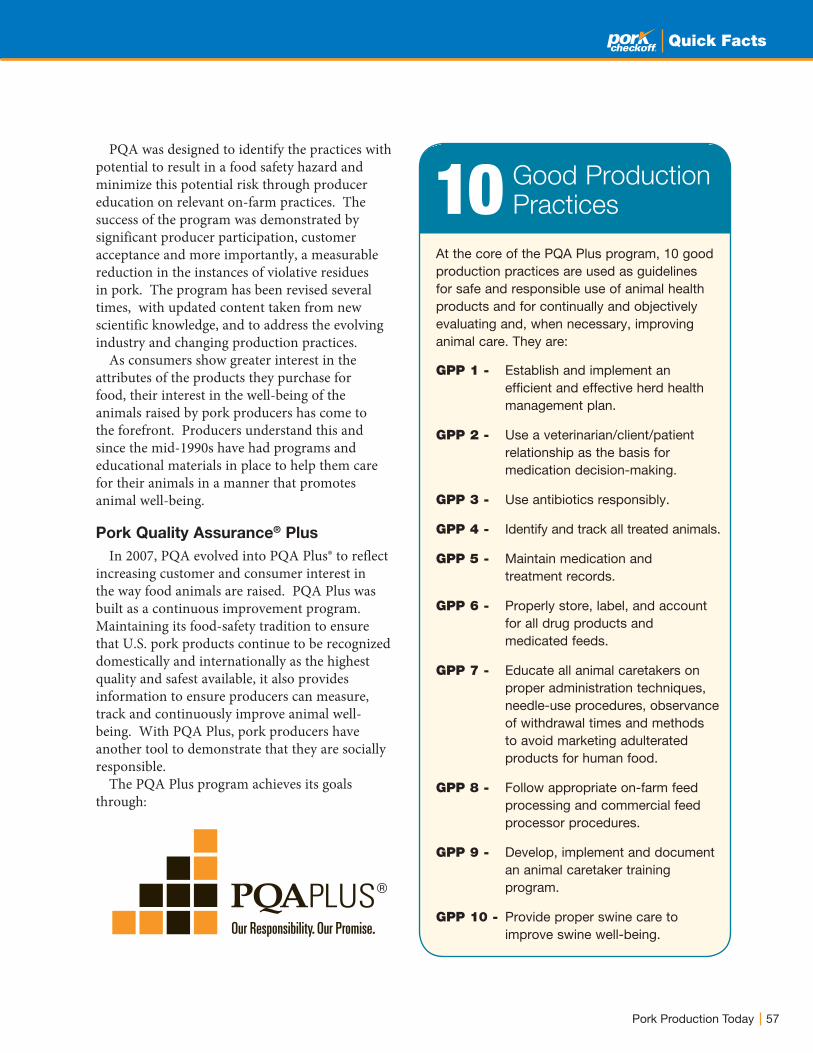
Quick Facts
PQA was designed to identify the practices with potential to result in a food safety hazard and minimize this potential risk through producer education on relevant on-farm practices. The success of the program was demonstrated by significant producer participation, customer acceptance and more importantly, a measurable reduction in the instances of violative residues in pork. The program has been revised several times, with updated content taken from new scientific knowledge, and to address the evolving industry and changing production practices.
As consumers show greater interest in the attributes of the products they purchase for food, their interest in the well-being of the animals raised by pork producers has come to the forefront. Producers understand this and since the mid-1990s have had programs and educational materials in place to help them care for their animals in a manner that promotes animal well-being.
Pork Quality Assurance® Plus
In 2007, PQA evolved into PQA Plus® to reflect increasing customer and consumer interest in the way food animals are raised. PQA Plus was built as a continuous improvement program. Maintaining its food-safety tradition to ensure that U.S. pork products continue to be recognized domestically and internationally as the highest quality and safest available, it also provides information to ensure producers can measure, track and continuously improve animal well-being. With PQA Plus, pork producers have another tool to demonstrate that they are socially responsible.
The PQA Plus program achieves its goals through:
At the core of the PQA Plus program, 10 good production practices are used as guidelines for safe and responsible use of animal health products and for continually and objectively evaluating and, when necessary, improving animal care. They are:
GPP 1 - Establish and implement an efficient and effective herd health management plan.
GPP 2 - Use a veterinarian/client/patient relationship as the basis for medication decision-making.
GPP 3 - Use antibiotics responsibly.
GPP 4 - Identify and track all treated animals.
GPP 5 - Maintain medication and treatment records.
GPP 6 - Properly store, label, and account for all drug products and medicated feeds.
GPP 7 - Educate all animal caretakers on proper administration techniques, needle-use procedures, observance of withdrawal times and methods to avoid marketing adulterated products for human food.
GPP 8 - Follow appropriate on-farm feed processing and commercial feed processor procedures.
GPP 9 - Develop, implement and document an animal caretaker training program.
GPP 10 - Provide proper swine care to improve swine well-being.
Good Production Practices10
57Pork Production Today
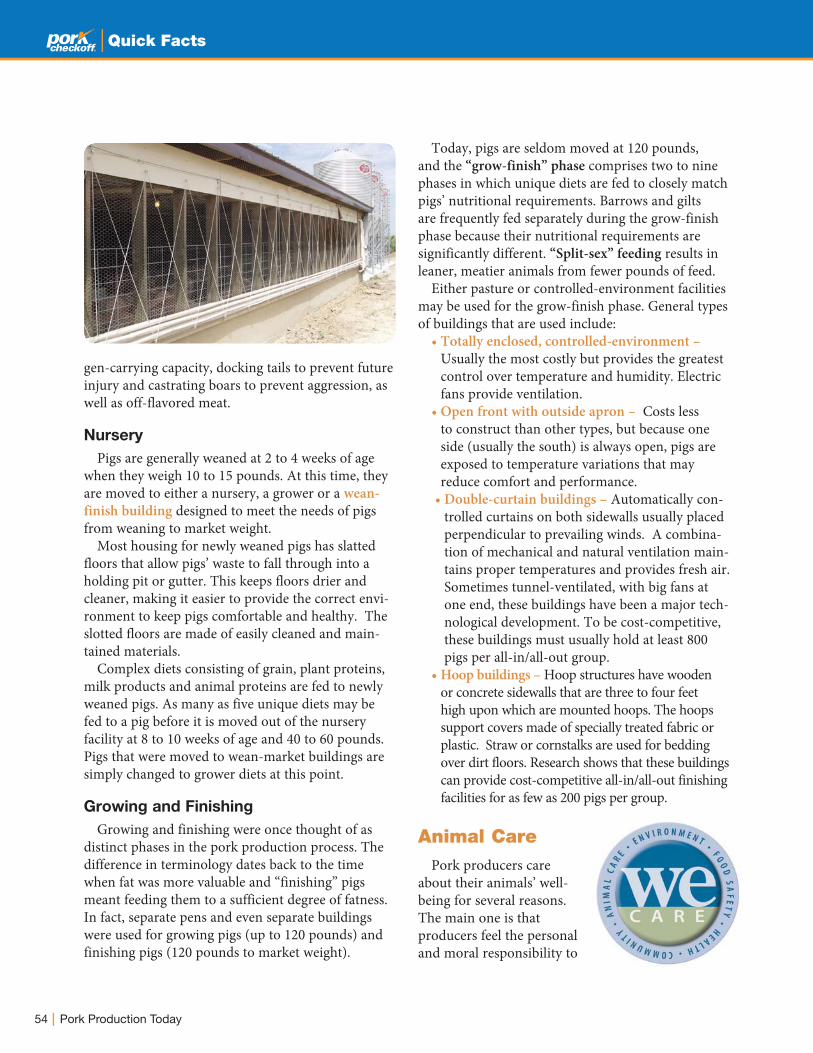
54 Pork Production Today
Quick Facts
gen-carrying capacity, docking tails to prevent future injury and castrating boars to prevent aggression, as well as off-flavored meat.
Nursery
Pigs are generally weaned at 2 to 4 weeks of age when they weigh 10 to 15 pounds. At this time, they are moved to either a nursery, a grower or a wean-finish building designed to meet the needs of pigs from weaning to market weight.
Most housing for newly weaned pigs has slatted floors that allow pigs’ waste to fall through into a holding pit or gutter. This keeps floors drier and cleaner, making it easier to provide the correct envi-ronment to keep pigs comfortable and healthy. The slotted floors are made of easily cleaned and main-tained materials.
Complex diets consisting of grain, plant proteins, milk products and animal proteins are fed to newly weaned pigs. As many as five unique diets may be fed to a pig before it is moved out of the nursery facility at 8 to 10 weeks of age and 40 to 60 pounds. Pigs that were moved to wean-market buildings are simply changed to grower diets at this point.
Growing and Finishing
Growing and finishing were once thought of as distinct phases in the pork production process. The difference in terminology dates back to the time when fat was more valuable and “finishing” pigs meant feeding them to a sufficient degree of fatness. In fact, separate pens and even separate buildings were used for growing pigs (up to 120 pounds) and finishing pigs (120 pounds to market weight).
Today, pigs are seldom moved at 120 pounds, and the “grow-finish” phase comprises two to nine phases in which unique diets are fed to closely match pigs’ nutritional requirements. Barrows and gilts are frequently fed separately during the grow-finish phase because their nutritional requirements are significantly different. “Split-sex” feeding results in leaner, meatier animals from fewer pounds of feed.
Either pasture or controlled-environment facilities may be used for the grow-finish phase. General types of buildings that are used include:
• Totally enclosed, controlled-environment – Usually the most costly but provides the greatest control over temperature and humidity. Electric fans provide ventilation.
• Open front with outside apron – Costs less to construct than other types, but because one side (usually the south) is always open, pigs are exposed to temperature variations that may reduce comfort and performance.
• Double-curtain buildings – Automatically con-trolled curtains on both sidewalls usually placed perpendicular to prevailing winds. A combina-tion of mechanical and natural ventilation main-tains proper temperatures and provides fresh air. Sometimes tunnel-ventilated, with big fans at one end, these buildings have been a major tech-nological development. To be cost-competitive, these buildings must usually hold at least 800 pigs per all-in/all-out group.
• Hoop buildings – Hoop structures have wooden or concrete sidewalls that are three to four feet high upon which are mounted hoops. The hoops support covers made of specially treated fabric or plastic. Straw or cornstalks are used for bedding over dirt floors. Research shows that these buildings can provide cost-competitive all-in/all-out finishing facilities for as few as 200 pigs per group.
Animal CarePork producers care
about their animals’ well-being for several reasons. The main one is that producers feel the personal and moral responsibility to

55Pork Production Today
Quick Facts

56 Pork Production Today
Quick Facts
ducers and other industry spokespeople connect with community leaders and the general public through presentations given in their communities.
Education Programs for Swine Care in the United States
To fulfill its mandate of providing knowledge and opportunities that enable producers to be competitive, the Pork Checkoff has developed several education and certification programs. These programs are designed to help producers tackle issues facing modern pork production.
Several Checkoff-funded programs, such as the Pork Quality Assurance•• Plus (PQA Plus®) and the Transport Quality Assurance® (TQA®) programs are considered industry standards.
U.S. Pork producers have a long tradition of social responsibility. The tradition includes the development of producer certification programs that producers can use to ensure that U.S. pork products are of the highest quality and safe, and that the animals raised for food are cared for in a way that ensures their well-being.
In 1989, pork producers developed the Pork Quality Assurance program, a producer education and certification program to reduce the risk of violative animal health product residues in pork. The program, better known as PQA , was modeled after the Hazard Analysis Critical Control Point (HACCP) programs used by food manufacturers to ensure the safety of food products, but customized for on-farm use.
do so. Producers realize that pigs are living beings and as such, they must receive a level of care that promotes their well-being. At minimum, U.S. pork producers commit to:
• Provide feed, water and an environment that promotes the well-being of their animals.
• Provide proper care, handling and transpor-tation for pigs at each stage of life.
• Protect pig health and provide appropriate treatment, including veterinary care, when needed.
• Use approved practices to euthanize, in a timely manner, those sick or injured pigs that fail to respond to care and treatment.
Pork producers realize that consumers of pork are increasingly interested in how the animals used to produce meat are raised and trust that those animals were raised in a way that ensured their well-being. Also, good animal care provides an economic advantage. Animals that are cared for appropriately grow faster and more efficiently than those that are not. Good animal care prac-tices promote good health, which reduces produc-tion costs associated with veterinary services and animal health products.
We Care InitiativeThe pork industry’s We Care initiative, a joint
effort of the Pork Checkoff and the National Pork Producers Council, helps demonstrate that pork producers are committed to the well-being of their animals. We Care also encompasses pro-ducers’ pledge to produce safe food, while being good stewards of the environment and being good neighbors,.
The pork industry offers numerous pro-grams, including Pork Quality Assurance Plus (PQA Plus®) and Transport Quality Assurance® (TQAS ), to support animal well-being and maintain a safe, high-quality supply of pork. The We Care initiative ties everything together to help the public view the pork industry as a self-regulat-ed business that earns the trust of others.
Other programs that producers can take part in to support the We Care initiative include Operation Main Street. The program helps pro-

Quick Facts
PQA was designed to identify the practices with potential to result in a food safety hazard and minimize this potential risk through producer education on relevant on-farm practices. The success of the program was demonstrated by significant producer participation, customer acceptance and more importantly, a measurable reduction in the instances of violative residues in pork. The program has been revised several times, with updated content taken from new scientific knowledge, and to address the evolving industry and changing production practices.
As consumers show greater interest in the attributes of the products they purchase for food, their interest in the well-being of the animals raised by pork producers has come to the forefront. Producers understand this and since the mid-1990s have had programs and educational materials in place to help them care for their animals in a manner that promotes animal well-being.
Pork Plus
In 2007, PQA evolved into PQA Plus® to reflect increasing customer and consumer interest in the way food animals are raised. PQA Plus was built as a continuous improvement program. Maintaining its food-safety tradition to ensure that U.S. pork products continue to be recognized domestically and internationally as the highest quality and safest available, it also provides information to ensure producers can measure, track and continuously improve animal well-being. With PQA Plus, pork producers have another tool to demonstrate that they are socially responsible.
The PQA Plus program achieves its goals through:
At the core of the PQA Plus program, 10 good production practices are used as guidelines for safe and responsible use of animal health products and for continually and objectively evaluating and, when necessary, improving animal care. They are:
GPP 1 - Establish and implement an efficient and effective herd health management plan.
GPP 2 - Use a veterinarian/client/patient relationship as the basis for medication decision-making.
GPP 3 - Use antibiotics responsibly.
GPP 4 - Identify and track all treated animals.
GPP 5 - Maintain medication and treatment records.
GPP 6 - Properly store, label, and account for all drug products and medicated feeds.
GPP 7 - Educate all animal caretakers on proper administration techniques, needle-use procedures, observance of withdrawal times and methods to avoid marketing adulterated products for human food.
GPP 8 - Follow appropriate on-farm feed processing and commercial feed processor procedures.
GPP 9 - Develop, implement and document an animal caretaker training program.
GPP 10 - Provide proper swine care to improve swine well-being.
Good Production Practices10
57Pork Production Today

58 Pork Production Today
Quick Facts
is the safest in the world and is safer than it has ever been.
Transport Quality Assurance®
The Transport Quality Assurance® (TQAsm) certification program ensures that pigs in the United States are handled and transported in a manner that ensures their well-being. Coupled with PQA Plus®, the producer education and site assessment program that promotes food safety and animal well-being on the farm, TQA gives the industry the information necessary so that animals receive a high standard of management and care as they are moved or transported.
TQA certified individuals receive training in areas that have been identified as critical to the well-being of animals being moved within a facility or transported from one facility to another. Key learning objectives include an understanding of:
• Pig behavior, animal health and condition and the implications of these during handling, moving, loading or unloading and during transport.
• The need to maintain the health and well-being of the animals, on-farm and during transport.
• The differences between animals of different sizes and the proper handling and transporting techniques for each type of animal.
• The use and maintenance of equipment, facilities and transport vehicles to facilitate humane and safe handling and transport of animals.
• Producer training by a certified PQA Plus advisor which results in the producer receiv-ing PQA Plus certification.
• An objective assessment of on-farm animal well-being which, when combined with the education of the producer through PQA Plus certification, results in the farm receiving PQA Plus site status.
• A PQA Plus survey designed to evaluate the implementation of PQA Plus in the industry. Survey results are used to identify opportuni-ties for improvement of the program’s infor-mation and delivery.
PQA Plus certification is valid for three years. To recertify every three years, producers must attend a PQA Plus training session with a certified PQA Plus advisor. Likewise, PQA Plus site status is valid for three years. An objective assessment of the well being of the animals on the farm is required for continuing a farm’s PQA Plus site status. While site status is valid for three years, producers may work with their PQA Plus advisor to determine the frequency and timing of assessments and training.
Producer training and third-party on-farm assessments are performed by certified PQA Plus advisors. The network of certified PQA Plus advisors spans the United States. Certified advisors are veterinarians, animal scientists, university Extension specialists or ag educators with a bachelor of science degree in animal science or a related degree. They also must have two years of recent, documented swine production experience. Advisors must attend a PQA Plus training session and successfully pass an examination proving knowledge of the program, the implementation of training and the assessment.
Pork industry customers and consumers can be comfortable with the knowledge that U.S. pork products are produced following good production practices that address their safety and in a way that promotes animal well-being because of programs such as PQA Plus. PQA Plus demonstrates America’s pork producers’ will to commit and to make themselves accountable for the way they produce the pork products that feed the world. Because of this commitment, U.S. pork
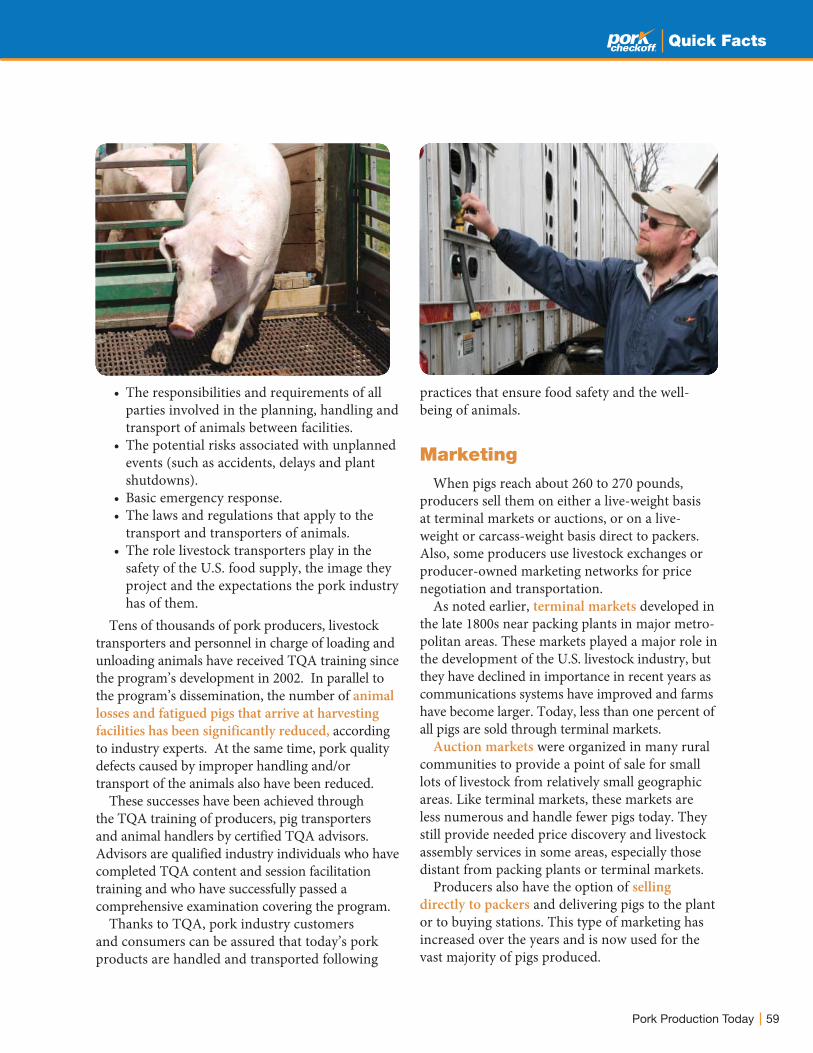
59Pork Production Today
Quick Facts
• The responsibilities and requirements of all parties involved in the planning, handling and transport of animals between facilities.
• The potential risks associated with unplanned events (such as accidents, delays and plant shutdowns).
• Basic emergency response.• The laws and regulations that apply to the
transport and transporters of animals.• The role livestock transporters play in the
safety of the U.S. food supply, the image they project and the expectations the pork industry has of them.
Tens of thousands of pork producers, livestock transporters and personnel in charge of loading and unloading animals have received TQA training since the program’s development in 2002. In parallel to the program’s dissemination, the number of animal losses and fatigued pigs that arrive at harvesting facilities has been significantly reduced, according to industry experts. At the same time, pork quality defects caused by improper handling and/or transport of the animals also have been reduced.
These successes have been achieved through the TQA training of producers, pig transporters and animal handlers by certified TQA advisors. Advisors are qualified industry individuals who have completed TQA content and session facilitation training and who have successfully passed a comprehensive examination covering the program.
Thanks to TQA, pork industry customers and consumers can be assured that today’s pork products are handled and transported following
practices that ensure food safety and the well-being of animals.
MarketingWhen pigs reach about 260 to 270 pounds,
producers sell them on either a live-weight basis at terminal markets or auctions, or on a live-weight or carcass-weight basis direct to packers. Also, some producers use livestock exchanges or producer-owned marketing networks for price negotiation and transportation.
As noted earlier, terminal markets developed in the late 1800s near packing plants in major metro-politan areas. These markets played a major role in the development of the U.S. livestock industry, but they have declined in importance in recent years as communications systems have improved and farms have become larger. Today, less than one percent of all pigs are sold through terminal markets.
Auction markets were organized in many rural communities to provide a point of sale for small lots of livestock from relatively small geographic areas. Like terminal markets, these markets are less numerous and handle fewer pigs today. They still provide needed price discovery and livestock assembly services in some areas, especially those distant from packing plants or terminal markets.
Producers also have the option of selling directly to packers and delivering pigs to the plant or to buying stations. This type of marketing has increased over the years and is now used for the vast majority of pigs produced.
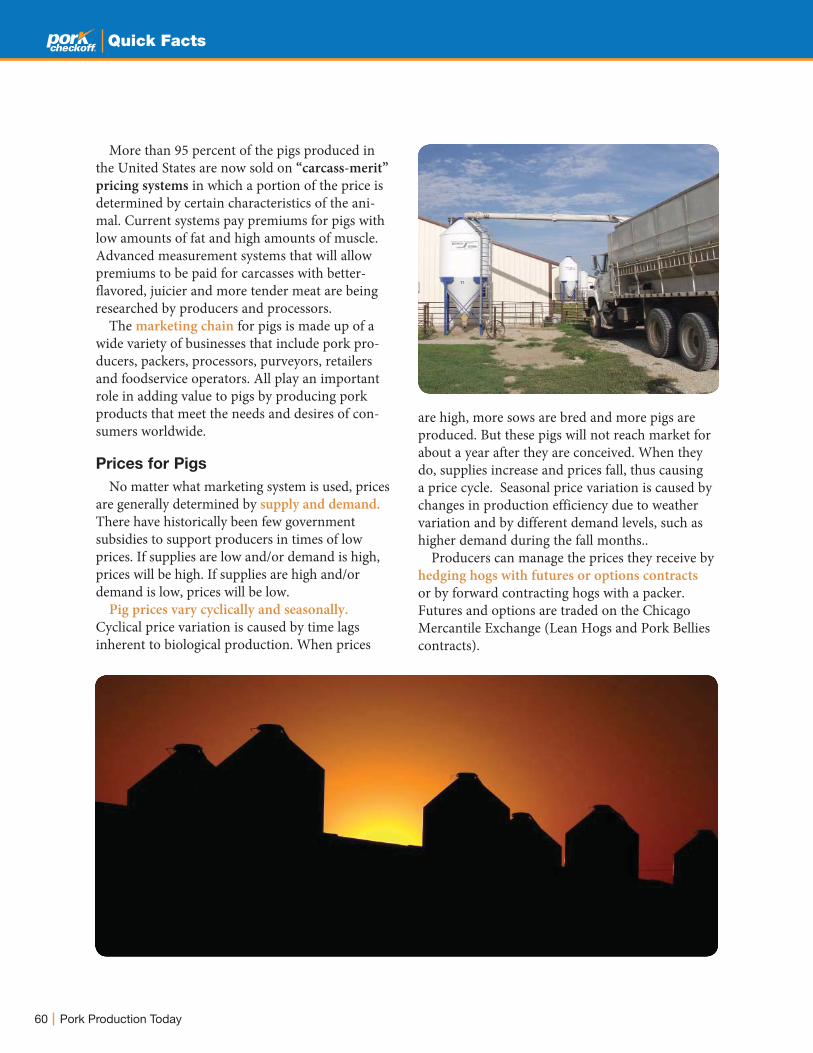
60 Pork Production Today
Quick Facts
More than 95 percent of the pigs produced in the United States are now sold on “carcass-merit” pricing systems in which a portion of the price is determined by certain characteristics of the ani-mal. Current systems pay premiums for pigs with low amounts of fat and high amounts of muscle. Advanced measurement systems that will allow premiums to be paid for carcasses with better-flavored, juicier and more tender meat are being researched by producers and processors.
The marketing chain for pigs is made up of a wide variety of businesses that include pork pro-ducers, packers, processors, purveyors, retailers and foodservice operators. All play an important role in adding value to pigs by producing pork products that meet the needs and desires of con-sumers worldwide.
Prices for Pigs
No matter what marketing system is used, prices are generally determined by supply and demand. There have historically been few government subsidies to support producers in times of low prices. If supplies are low and/or demand is high, prices will be high. If supplies are high and/or demand is low, prices will be low.
Pig prices vary cyclically and seasonally. Cyclical price variation is caused by time lags inherent to biological production. When prices
are high, more sows are bred and more pigs are produced. But these pigs will not reach market for about a year after they are conceived. When they do, supplies increase and prices fall, thus causing a price cycle. Seasonal price variation is caused by changes in production efficiency due to weather variation and by different demand levels, such as higher demand during the fall months..
Producers can manage the prices they receive by hedging hogs with futures or options contracts or by forward contracting hogs with a packer. Futures and options are traded on the Chicago Mercantile Exchange (Lean Hogs and Pork Bellies contracts).

Environmental
Stewardship
61Environmental Stewardship
Quick Facts
Pork producers are committed to managing their farms in an environmentally responsible manner in order to protect the environment and conserve the natural resources for future generations. Today’s pork production operations capture, treat and recycle the valuable nutrients produced in manure so they can be used as a natural source of fertilizer.
Over the last decade, America’s pork producers have played a leading role in advancing animal agriculture’s environmental and conservation efforts. Producers work to address environmental challenges in a cooperative and productive fashion by partnering with government, scientists, conservationists and the communities in which they live and farm.
For instance, the pork industry’s work on the environment has included helping to develop better best-management practices (BMPs) in manure containment and use, and working with the U.S. Environmental Protection Agency (EPA) to fund air-quality monitoring studies.
Most producers have implemented a nutrient management plan, which is a compilation of conservation practices and management activities developed for a specific production site that helps ensure that both production and natural-resource conservation goals are achieved. The plan incorporates practices to use animal manure as a beneficial resource for crop production.
Manure and Nutrient Management
Manure as Fertilizer
Using manure as a crop nutrient is a practice as old as agriculture itself. Applying manure to cropland benefits crops and soil. Manure helps build the organic content in soil and improve soil moisture-holding capacity, something commercial fertilizers can’t accomplish.
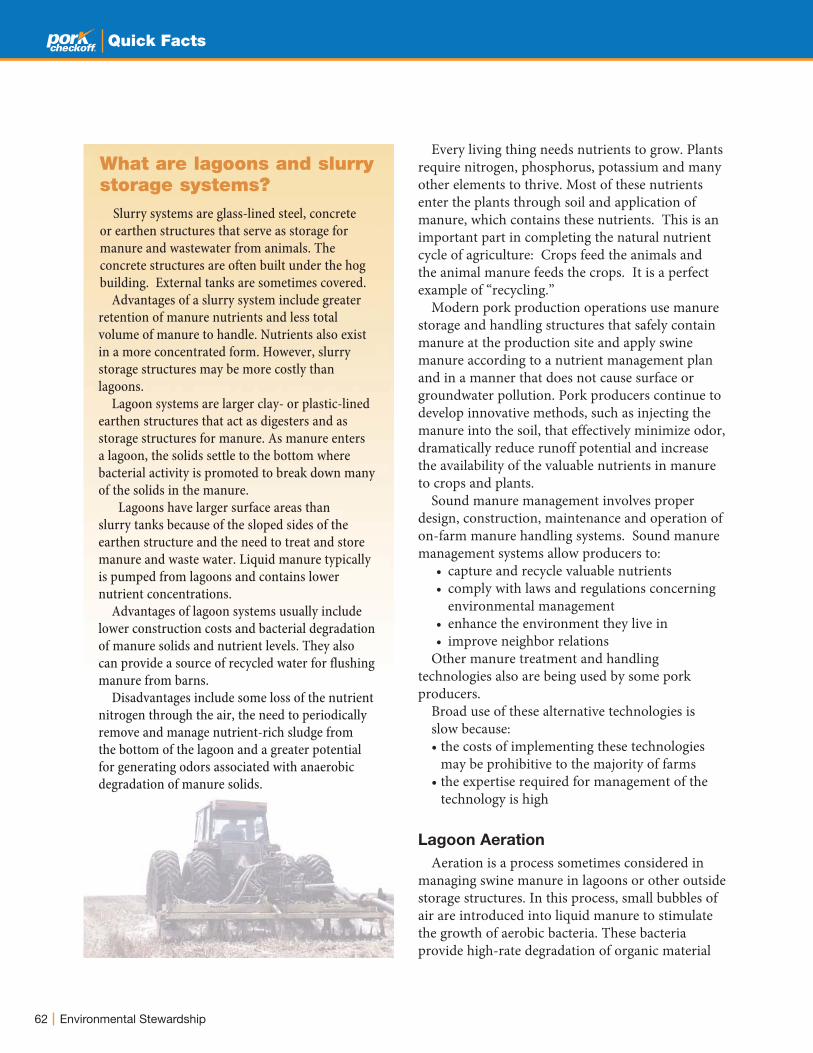
62 Environmental Stewardship
Quick Facts
What are lagoons and slurry storage systems?
Slurry systems are glass-lined steel, concrete or earthen structures that serve as storage for manure and wastewater from animals. The concrete structures are often built under the hog building. External tanks are sometimes covered.
Advantages of a slurry system include greater retention of manure nutrients and less total volume of manure to handle. Nutrients also exist in a more concentrated form. However, slurry storage structures may be more costly than lagoons.
Lagoon systems are larger clay- or plastic-lined earthen structures that act as digesters and as storage structures for manure. As manure enters a lagoon, the solids settle to the bottom where bacterial activity is promoted to break down many of the solids in the manure.
Lagoons have larger surface areas than slurry tanks because of the sloped sides of the earthen structure and the need to treat and store manure and waste water. Liquid manure typically is pumped from lagoons and contains lower nutrient concentrations.
Advantages of lagoon systems usually include lower construction costs and bacterial degradation of manure solids and nutrient levels. They also can provide a source of recycled water for flushing manure from barns.
Disadvantages include some loss of the nutrient nitrogen through the air, the need to periodically remove and manage nutrient-rich sludge from the bottom of the lagoon and a greater potential for generating odors associated with anaerobic degradation of manure solids.
Every living thing needs nutrients to grow. Plants require nitrogen, phosphorus, potassium and many other elements to thrive. Most of these nutrients enter the plants through soil and application of manure, which contains these nutrients. This is an important part in completing the natural nutrient cycle of agriculture: Crops feed the animals and the animal manure feeds the crops. It is a perfect example of “recycling.”
Modern pork production operations use manure storage and handling structures that safely contain manure at the production site and apply swine manure according to a nutrient management plan and in a manner that does not cause surface or groundwater pollution. Pork producers continue to develop innovative methods, such as injecting the manure into the soil, that effectively minimize odor, dramatically reduce runoff potential and increase the availability of the valuable nutrients in manure to crops and plants.
Sound manure management involves proper design, construction, maintenance and operation of on-farm manure handling systems. Sound manure management systems allow producers to:
• capture and recycle valuable nutrients • comply with laws and regulations concerning
environmental management• enhance the environment they live in • improve neighbor relations
Other manure treatment and handling technologies also are being used by some pork producers.
Broad use of these alternative technologies is slow because:• the costs of implementing these technologies
may be prohibitive to the majority of farms• the expertise required for management of the
technology is high
Lagoon Aeration
Aeration is a process sometimes considered in managing swine manure in lagoons or other outside storage structures. In this process, small bubbles of air are introduced into liquid manure to stimulate the growth of aerobic bacteria. These bacteria provide high-rate degradation of organic material
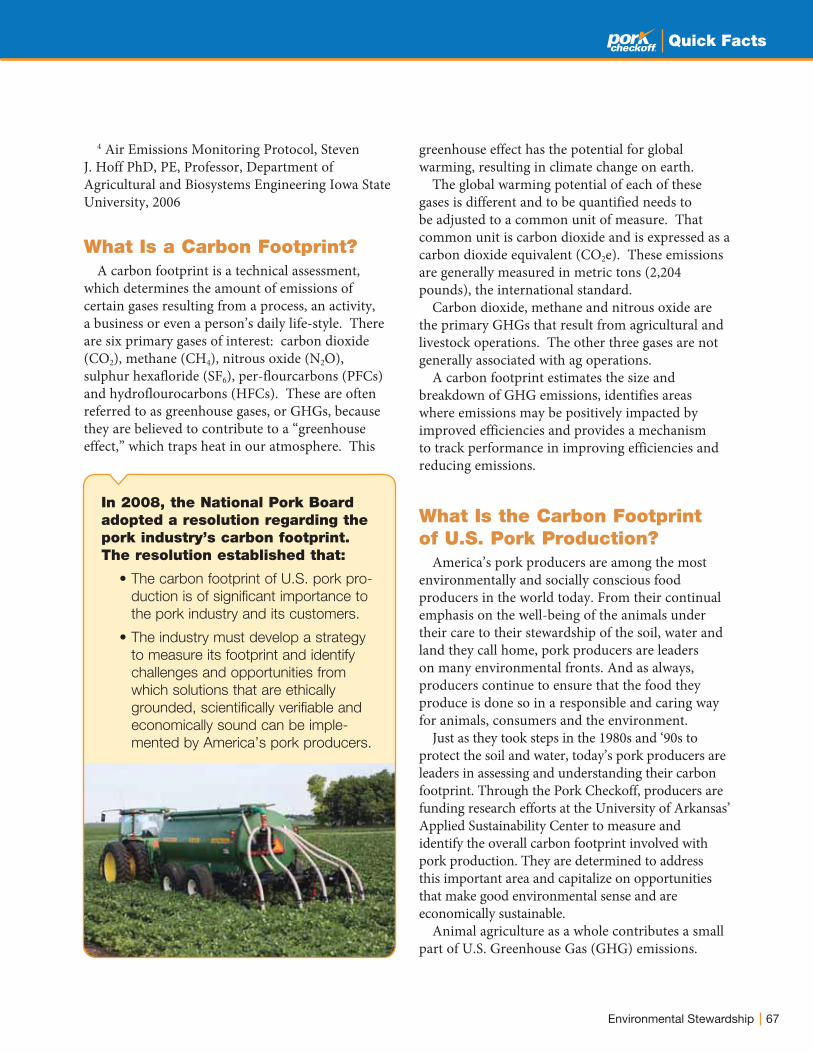
67Environmental Stewardship
Quick Facts
4 Air Emissions Monitoring Protocol, Steven J. Hoff PhD, PE, Professor, Department of Agricultural and Biosystems Engineering Iowa State University, 2006
What Is a Carbon Footprint? A carbon footprint is a technical assessment,
which determines the amount of emissions of certain gases resulting from a process, an activity, a business or even a person’s daily life-style. There are six primary gases of interest: carbon dioxide (CO2), methane (CH4), nitrous oxide (N2O), sulphur hexafloride (SF6), per-flourcarbons (PFCs) and hydroflourocarbons (HFCs). These are often referred to as greenhouse gases, or GHGs, because they are believed to contribute to a “greenhouse effect,” which traps heat in our atmosphere. This
greenhouse effect has the potential for global warming, resulting in climate change on earth.
The global warming potential of each of these gases is different and to be quantified needs to be adjusted to a common unit of measure. That common unit is carbon dioxide and is expressed as a carbon dioxide equivalent (CO2e). These emissions are generally measured in metric tons (2,204 pounds), the international standard.
Carbon dioxide, methane and nitrous oxide are the primary GHGs that result from agricultural and livestock operations. The other three gases are not generally associated with ag operations.
A carbon footprint estimates the size and breakdown of GHG emissions, identifies areas where emissions may be positively impacted by improved efficiencies and provides a mechanism to track performance in improving efficiencies and reducing emissions.
What Is the Carbon Footprint of U.S. Pork Production?
America’s pork producers are among the most environmentally and socially conscious food producers in the world today. From their continual emphasis on the well-being of the animals under their care to their stewardship of the soil, water and land they call home, pork producers are leaders on many environmental fronts. And as always, producers continue to ensure that the food they produce is done so in a responsible and caring way for animals, consumers and the environment.
Just as they took steps in the 1980s and ‘90s to protect the soil and water, today’s pork producers are leaders in assessing and understanding their carbon footprint. Through the Pork Checkoff, producers are funding research efforts at the University of Arkansas’ Applied Sustainability Center to measure and identify the overall carbon footprint involved with pork production. They are determined to address this important area and capitalize on opportunities that make good environmental sense and are economically sustainable.
Animal agriculture as a whole contributes a small part of U.S. Greenhouse Gas (GHG) emissions.
In 2008, the National Pork Board adopted a resolution regarding the pork industry’s carbon footprint. The resolution established that:
-
-
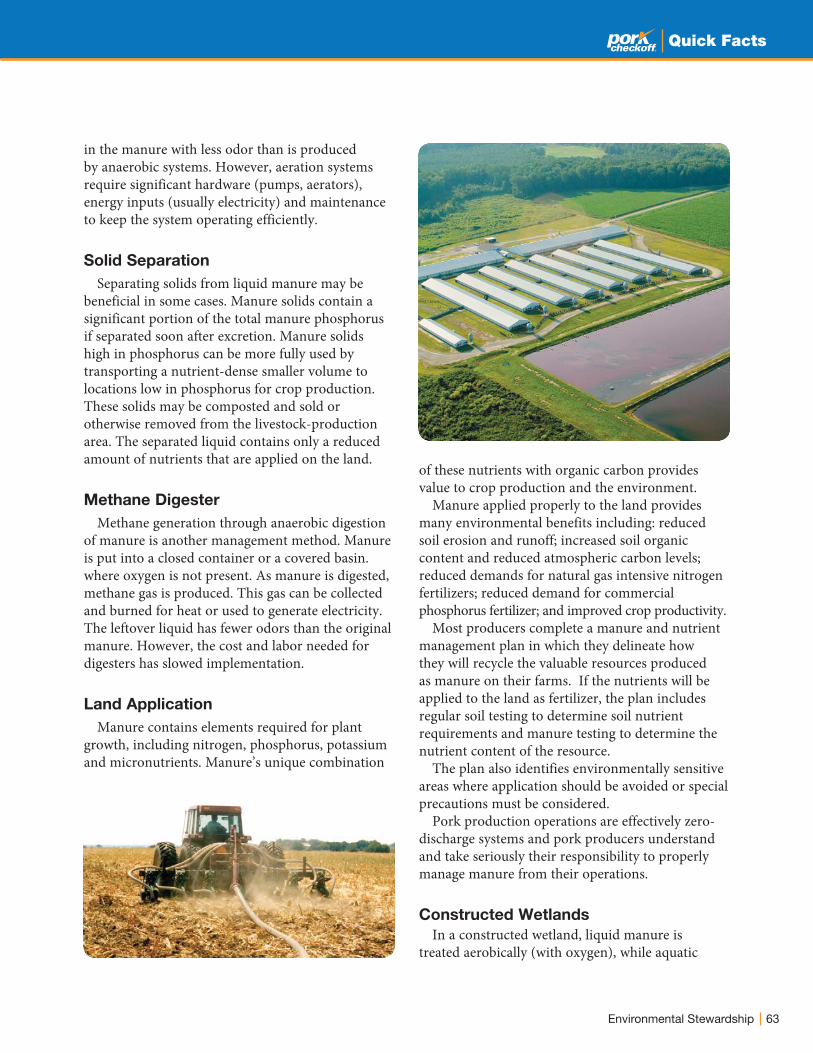
63Environmental Stewardship
Quick Facts
of these nutrients with organic carbon provides value to crop production and the environment.
Manure applied properly to the land provides many environmental benefits including: reduced soil erosion and runoff; increased soil organic content and reduced atmospheric carbon levels; reduced demands for natural gas intensive nitrogen fertilizers; reduced demand for commercial phosphorus fertilizer; and improved crop productivity.
Most producers complete a manure and nutrient management plan in which they delineate how they will recycle the valuable resources produced as manure on their farms. If the nutrients will be applied to the land as fertilizer, the plan includes regular soil testing to determine soil nutrient requirements and manure testing to determine the nutrient content of the resource.
The plan also identifies environmentally sensitive areas where application should be avoided or special precautions must be considered.
Pork production operations are effectively zero-discharge systems and pork producers understand and take seriously their responsibility to properly manage manure from their operations.
Constructed Wetlands
In a constructed wetland, liquid manure is treated aerobically (with oxygen), while aquatic
in the manure with less odor than is produced by anaerobic systems. However, aeration systems require significant hardware (pumps, aerators), energy inputs (usually electricity) and maintenance to keep the system operating efficiently.
Solid Separation
Separating solids from liquid manure may be beneficial in some cases. Manure solids contain a significant portion of the total manure phosphorus if separated soon after excretion. Manure solids high in phosphorus can be more fully used by transporting a nutrient-dense smaller volume to locations low in phosphorus for crop production. These solids may be composted and sold or otherwise removed from the livestock-production area. The separated liquid contains only a reduced amount of nutrients that are applied on the land.
Methane Digester
Methane generation through anaerobic digestion of manure is another management method. Manure is put into a closed container or a covered basin. where oxygen is not present. As manure is digested, methane gas is produced. This gas can be collected and burned for heat or used to generate electricity. The leftover liquid has fewer odors than the original manure. However, the cost and labor needed for digesters has slowed implementation.
Land Application
Manure contains elements required for plant growth, including nitrogen, phosphorus, potassium and micronutrients. Manure’s unique combination

64 Environmental Stewardship
Quick Facts
plants take up some of the nutrients in the manure. Constructed wetlands can provide a high degree of treatment to manure. So far, constructed wetlands have not been used by a lot of farmers. They require a large area of ground, are expensive to construct and establish. Vegetation requires more management after storm events due to more surface area that collects rain water and they do not work well during cold weather. Livestock producers are not allowed to release manure or wastewater into waterways, so land application is still required for water from a constructed wetland. Long-term use of wetlands with swine farms has not been well documented.
References
USDA Cooperative State Research, Education and Extension ServiceNational Pork Board-Environment FAQs ManureNational Pork Board-Quick FactsManure Management for Environmental Protection PublicationCommonwealth of Pennsylvania, Department of Environmental ProtectionOffice of Water Management 2001
Water QualityPork producers are good stewards of the
environment and strive to manage their farms in ways that protect the environment. They are committed to operating their farms in a responsible manner with respect and care for precious surface- and ground-water resources.
The nutrients in swine manure, principally nitrogen and phosphorous, are naturally occurring compounds that result from various biological processes other than animal agriculture. Nitrogen and phosphorous can result from the decomposition of organic material such as leaves, plants and wildlife droppings. These nutrients are also present in other sources that contribute to the environment such as the effluent from municipal and industrial sewage plants and urban runoff primarily from lawns and pet waste.
Pork producers carefully plan and design manure management systems to protect natural resources including water. Manure storage structures can be constructed of concrete, metal or earthen materials. If earthen structures are used, they are generally lined with compacted clay or synthetic materials to ensure protection of ground water. Earthen structures used by pork operations are very similar to the earthen structures used at many municipal sewage plants with one exception – pork operations do not discharge their effluent into surface-water sources like many municipal systems do.
When swine manure is applied to the land as fertilizer, pork producers follow nutrient management plans that carefully consider the amount of nutrients already available in the soil, the nutrients that will be needed by the farm crops to be raised and the nutrients in the manure. Manure is applied only as needed to meet the nutrient requirements of the crops and in ways that reduce the potential for runoff of manure into bodies of water.
The 2004 Water Quality Assessment Database compiled by state environmental regulatory agencies and the U.S. Environmental Protection Agency (EPA) lists sources of surface-water impairments of the nation’s rivers, streams and lakes. It shows that livestock agriculture ranks low as a potential source of impairment. In Iowa, the state that raises the most hogs, livestock production ranks last as the probable source of impairment for streams and rivers and is not a source of impairment for lakes,
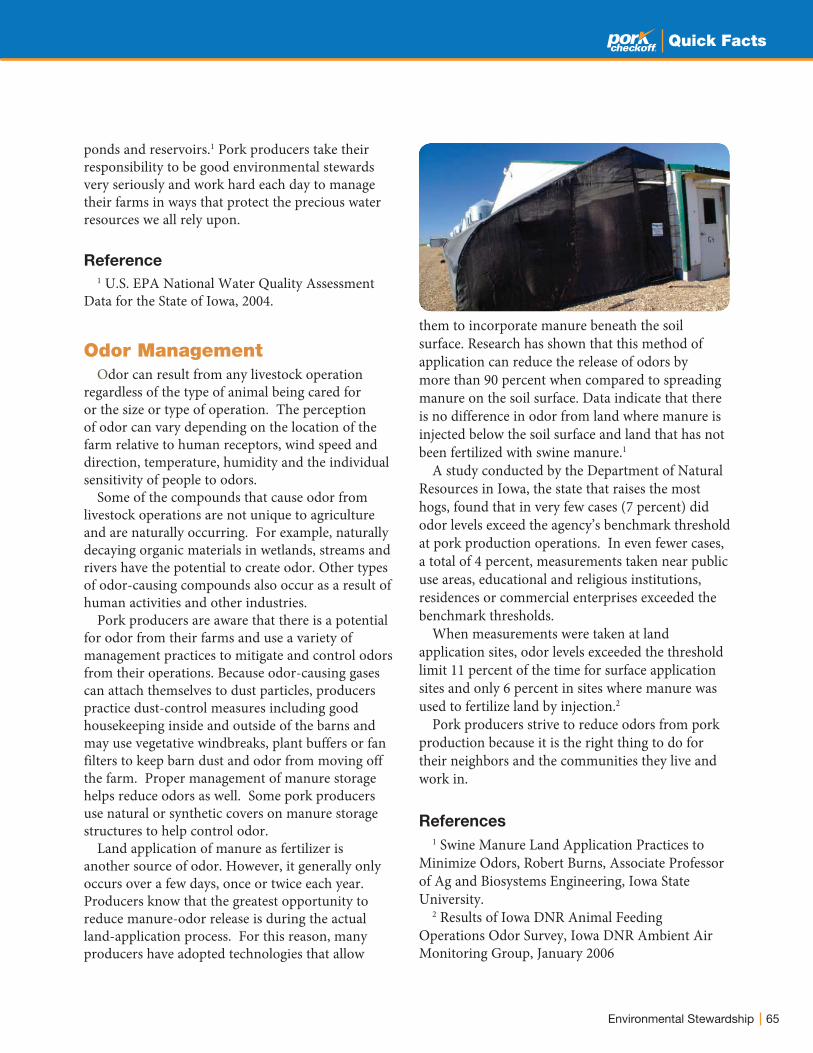
65Environmental Stewardship
Quick Facts
ponds and reservoirs.1 Pork producers take their responsibility to be good environmental stewards very seriously and work hard each day to manage their farms in ways that protect the precious water resources we all rely upon.
Reference1 U.S. EPA National Water Quality Assessment
Data for the State of Iowa, 2004.
Odor ManagementOdor can result from any livestock operation
regardless of the type of animal being cared for or the size or type of operation. The perception of odor can vary depending on the location of the farm relative to human receptors, wind speed and direction, temperature, humidity and the individual sensitivity of people to odors.
Some of the compounds that cause odor from livestock operations are not unique to agriculture and are naturally occurring. For example, naturally decaying organic materials in wetlands, streams and rivers have the potential to create odor. Other types of odor-causing compounds also occur as a result of human activities and other industries.
Pork producers are aware that there is a potential for odor from their farms and use a variety of management practices to mitigate and control odors from their operations. Because odor-causing gases can attach themselves to dust particles, producers practice dust-control measures including good housekeeping inside and outside of the barns and may use vegetative windbreaks, plant buffers or fan filters to keep barn dust and odor from moving off the farm. Proper management of manure storage helps reduce odors as well. Some pork producers use natural or synthetic covers on manure storage structures to help control odor.
Land application of manure as fertilizer is another source of odor. However, it generally only occurs over a few days, once or twice each year. Producers know that the greatest opportunity to reduce manure-odor release is during the actual land-application process. For this reason, many producers have adopted technologies that allow
them to incorporate manure beneath the soil surface. Research has shown that this method of application can reduce the release of odors by more than 90 percent when compared to spreading manure on the soil surface. Data indicate that there is no difference in odor from land where manure is injected below the soil surface and land that has not been fertilized with swine manure.1
A study conducted by the Department of Natural Resources in Iowa, the state that raises the most hogs, found that in very few cases (7 percent) did odor levels exceed the agency’s benchmark threshold at pork production operations. In even fewer cases, a total of 4 percent, measurements taken near public use areas, educational and religious institutions, residences or commercial enterprises exceeded the benchmark thresholds.
When measurements were taken at land application sites, odor levels exceeded the threshold limit 11 percent of the time for surface application sites and only 6 percent in sites where manure was used to fertilize land by injection.2
Pork producers strive to reduce odors from pork production because it is the right thing to do for their neighbors and the communities they live and work in.
References1 Swine Manure Land Application Practices to
Minimize Odors, Robert Burns, Associate Professor of Ag and Biosystems Engineering, Iowa State University.
2 Results of Iowa DNR Animal Feeding Operations Odor Survey, Iowa DNR Ambient Air Monitoring Group, January 2006
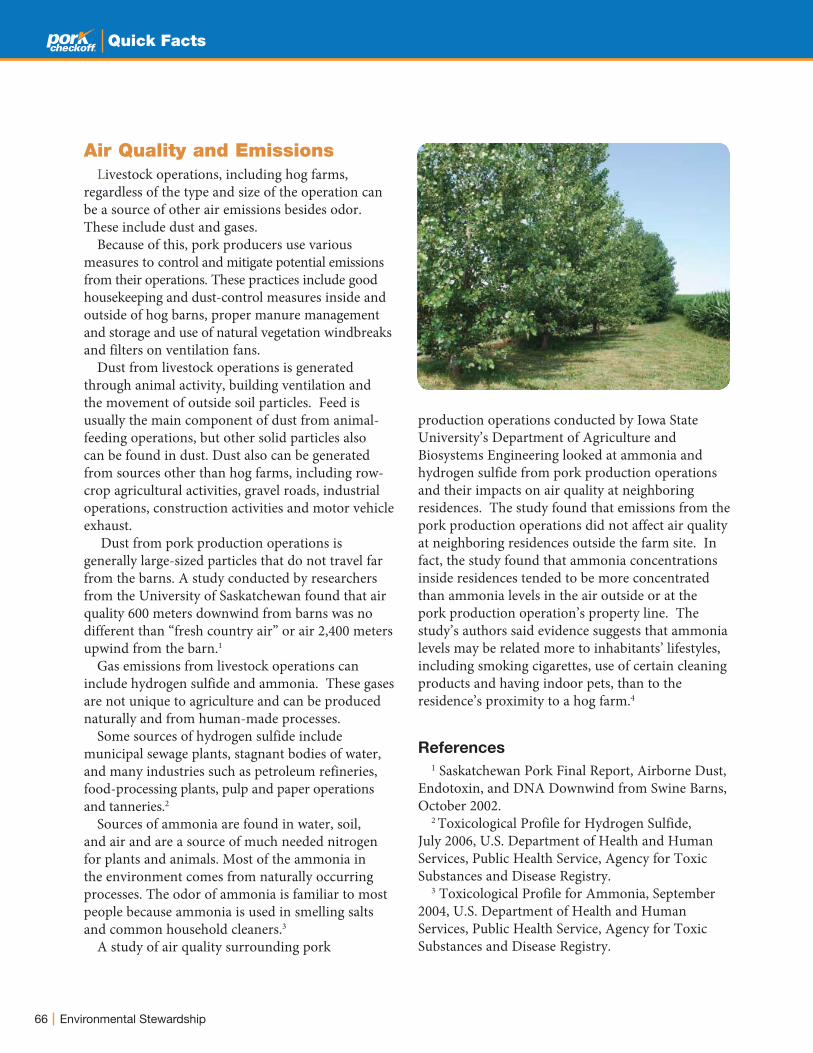
66 Environmental Stewardship
Quick Facts
Air Quality and EmissionsLivestock operations, including hog farms,
regardless of the type and size of the operation can be a source of other air emissions besides odor. These include dust and gases.
Because of this, pork producers use various measures to control and mitigate potential emissions from their operations. These practices include good housekeeping and dust-control measures inside and outside of hog barns, proper manure management and storage and use of natural vegetation windbreaks and filters on ventilation fans.
Dust from livestock operations is generated through animal activity, building ventilation and the movement of outside soil particles. Feed is usually the main component of dust from animal-feeding operations, but other solid particles also can be found in dust. Dust also can be generated from sources other than hog farms, including row-crop agricultural activities, gravel roads, industrial operations, construction activities and motor vehicle exhaust.
Dust from pork production operations is generally large-sized particles that do not travel far from the barns. A study conducted by researchers from the University of Saskatchewan found that air quality 600 meters downwind from barns was no different than “fresh country air” or air 2,400 meters upwind from the barn.1
Gas emissions from livestock operations can include hydrogen sulfide and ammonia. These gases are not unique to agriculture and can be produced naturally and from human-made processes.
Some sources of hydrogen sulfide include municipal sewage plants, stagnant bodies of water, and many industries such as petroleum refineries, food-processing plants, pulp and paper operations and tanneries.2
Sources of ammonia are found in water, soil, and air and are a source of much needed nitrogen for plants and animals. Most of the ammonia in the environment comes from naturally occurring processes. The odor of ammonia is familiar to most people because ammonia is used in smelling salts and common household cleaners.3
A study of air quality surrounding pork
production operations conducted by Iowa State University’s Department of Agriculture and Biosystems Engineering looked at ammonia and hydrogen sulfide from pork production operations and their impacts on air quality at neighboring residences. The study found that emissions from the pork production operations did not affect air quality at neighboring residences outside the farm site. In fact, the study found that ammonia concentrations inside residences tended to be more concentrated than ammonia levels in the air outside or at the pork production operation’s property line. The study’s authors said evidence suggests that ammonia levels may be related more to inhabitants’ lifestyles, including smoking cigarettes, use of certain cleaning products and having indoor pets, than to the residence’s proximity to a hog farm.4
References1 Saskatchewan Pork Final Report, Airborne Dust,
Endotoxin, and DNA Downwind from Swine Barns, October 2002.
2 Toxicological Profile for Hydrogen Sulfide, July 2006, U.S. Department of Health and Human Services, Public Health Service, Agency for Toxic Substances and Disease Registry.
3 Toxicological Profile for Ammonia, September 2004, U.S. Department of Health and Human Services, Public Health Service, Agency for Toxic Substances and Disease Registry.
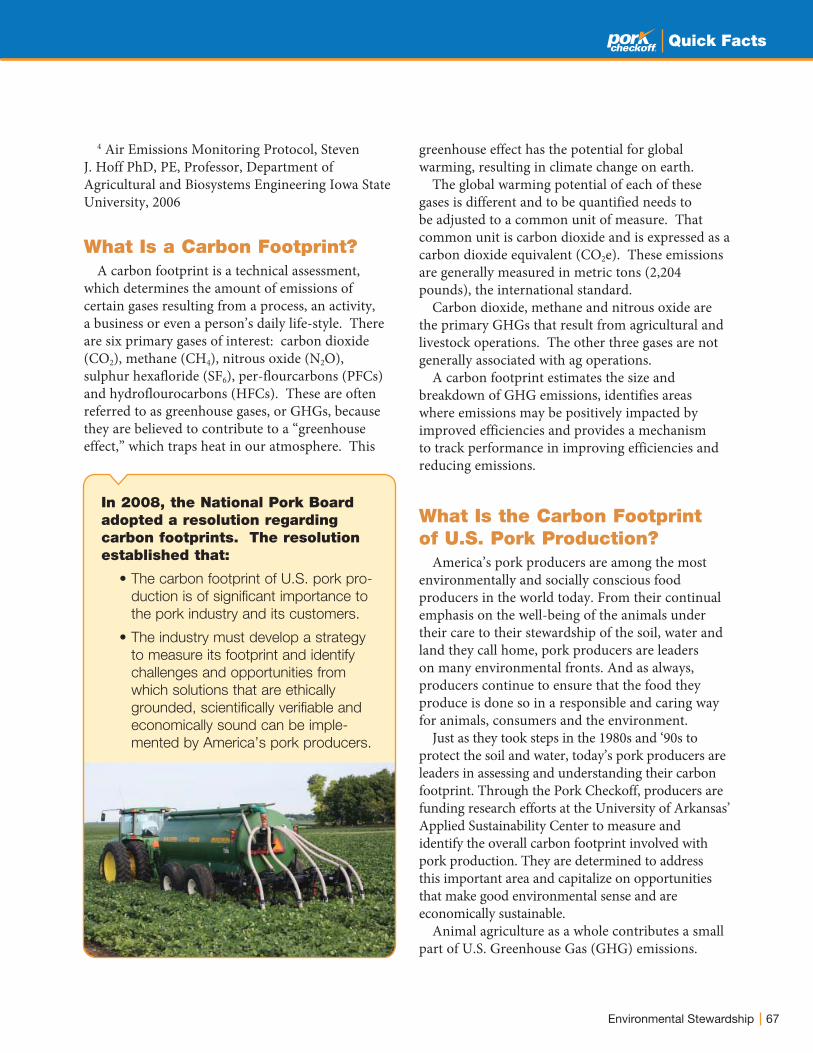
67Environmental Stewardship
Quick Facts
4 Air Emissions Monitoring Protocol, Steven J. Hoff PhD, PE, Professor, Department of Agricultural and Biosystems Engineering Iowa State University, 2006
What Is a Carbon Footprint? A carbon footprint is a technical assessment,
which determines the amount of emissions of certain gases resulting from a process, an activity, a business or even a person’s daily life-style. There are six primary gases of interest: carbon dioxide (CO2), methane (CH4), nitrous oxide (N2O), sulphur hexafloride (SF6), per-flourcarbons (PFCs) and hydroflourocarbons (HFCs). These are often referred to as greenhouse gases, or GHGs, because they are believed to contribute to a “greenhouse effect,” which traps heat in our atmosphere. This
greenhouse effect has the potential for global warming, resulting in climate change on earth.
The global warming potential of each of these gases is different and to be quantified needs to be adjusted to a common unit of measure. That common unit is carbon dioxide and is expressed as a carbon dioxide equivalent (CO2e). These emissions are generally measured in metric tons (2,204 pounds), the international standard.
Carbon dioxide, methane and nitrous oxide are the primary GHGs that result from agricultural and livestock operations. The other three gases are not generally associated with ag operations.
A carbon footprint estimates the size and breakdown of GHG emissions, identifies areas where emissions may be positively impacted by improved efficiencies and provides a mechanism to track performance in improving efficiencies and reducing emissions.
What Is the Carbon Footprint of U.S. Pork Production?
America’s pork producers are among the most environmentally and socially conscious food producers in the world today. From their continual emphasis on the well-being of the animals under their care to their stewardship of the soil, water and land they call home, pork producers are leaders on many environmental fronts. And as always, producers continue to ensure that the food they produce is done so in a responsible and caring way for animals, consumers and the environment.
Just as they took steps in the 1980s and ‘90s to protect the soil and water, today’s pork producers are leaders in assessing and understanding their carbon footprint. Through the Pork Checkoff, producers are funding research efforts at the University of Arkansas’ Applied Sustainability Center to measure and identify the overall carbon footprint involved with pork production. They are determined to address this important area and capitalize on opportunities that make good environmental sense and are economically sustainable.
Animal agriculture as a whole contributes a small part of U.S. Greenhouse Gas (GHG) emissions.
In 2008, the National Pork Board adopted a resolution regarding carbon footprints. The resolution established that:
• The carbon footprint of U.S. pork pro-
duction is of significant importance to
the pork industry and its customers.
• The industry must develop a strategy
to measure its footprint and identify
challenges and opportunities from
which solutions that are ethically
grounded, scientifically verifiable and
economically sound can be imple-
mented by America’s pork producers.
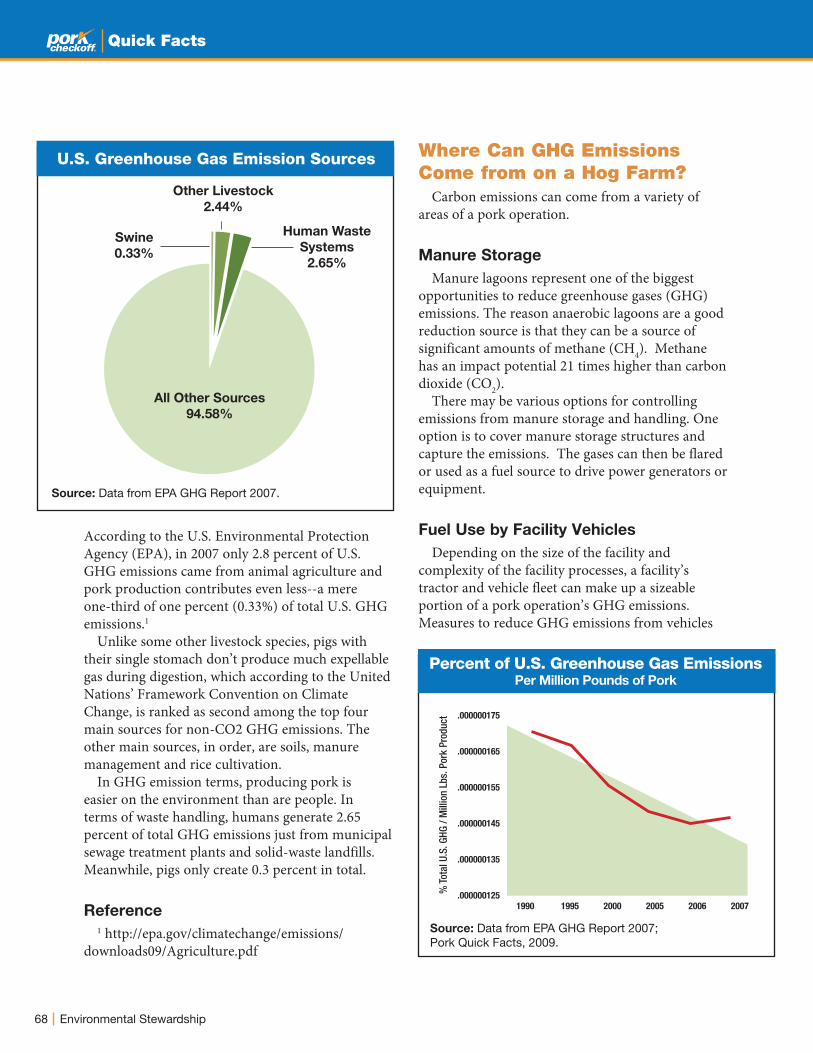
68 Environmental Stewardship
Quick Facts
According to the U.S. Environmental Protection Agency (EPA), in 2007 only 2.8 percent of U.S. GHG emissions came from animal agriculture and pork production contributes even less--a mere one-third of one percent (0.33%) of total U.S. GHG emissions.1
Unlike some other livestock species, pigs with their single stomach don’t produce much expellable gas during digestion, which according to the United Nations’ Framework Convention on Climate Change, is ranked as second among the top four main sources for non-CO2 GHG emissions. The other main sources, in order, are soils, manure management and rice cultivation.
In GHG emission terms, producing pork is easier on the environment than are people. In terms of waste handling, humans generate 2.65 percent of total GHG emissions just from municipal sewage treatment plants and solid-waste landfills. Meanwhile, pigs only create 0.3 percent in total.
Reference1 http://epa.gov/climatechange/emissions/
downloads09/Agriculture.pdf
Where Can GHG Emissions Come from on a Hog Farm?
Carbon emissions can come from a variety of areas of a pork operation.
Manure Storage
Manure lagoons represent one of the biggest opportunities to reduce greenhouse gases (GHG) emissions. The reason anaerobic lagoons are a good re duction source is that they can be a source of significant amounts of methane (CH4). Methane has an impact potential 21 times higher than carbon dioxide (CO2).
There may be various options for controlling emissions from manure storage and handling. One option is to cover manure storage structures and capture the emissions. The gases can then be flared or used as a fuel source to drive power generators or equipment.
Fuel Use by Facility Vehicles
Depending on the size of the facility and complexity of the facility processes, a facility’s tractor and vehicle fleet can make up a sizeable portion of a pork operation’s GHG emissions. Measures to reduce GHG emissions from vehicles
Source: Data from EPA GHG Report 2007; Pork Quick Facts, 2009.
1990 1995 2000 2005 2006 2007
.000000175
.000000165
.000000155
.000000145
.000000135
.000000125
% T
otal
U.S
. GHG
/ M
illio
n Lb
s. P
ork
Prod
uct
U.S. Greenhouse Gas Emission Sources
Percent of U.S. Greenhouse Gas EmissionsPer Million Pounds of Pork
Source: Data from EPA GHG Report 2007.
Swine
0.33%
Other Livestock
2.44%
Human Waste
Systems
2.65%
All Other Sources
94.58%
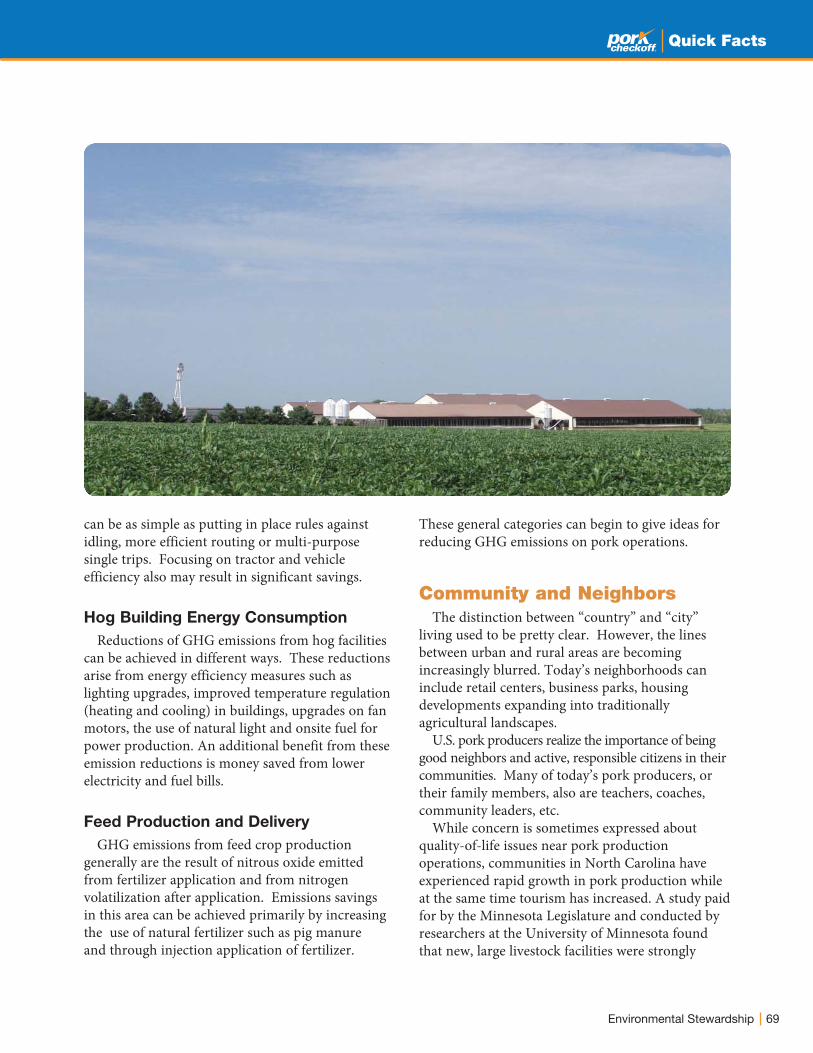
69Environmental Stewardship
Quick Facts
can be as simple as putting in place rules against idling, more efficient routing or multi-purpose single trips. Focusing on tractor and vehicle efficiency also may result in significant savings.
Hog Building Energy Consumption
Reductions of GHG emissions from hog facilities can be achieved in different ways. These reductions arise from energy efficiency measures such as lighting upgrades, improved temperature regulation (heating and cooling) in buildings, upgrades on fan motors, the use of natural light and onsite fuel for power production. An additional benefit from these emission reductions is money saved from lower electricity and fuel bills.
Feed Production and Delivery
GHG emissions from feed crop production generally are the result of nitrous oxide emitted from fertilizer application and from nitrogen volatilization after application. Emissions savings in this area can be achieved primarily by increasing the use of natural fertilizer such as pig manure and through injection application of fertilizer.
These general categories can begin to give ideas for reducing GHG emissions on pork operations.
Community and NeighborsThe distinction between “country” and “city”
living used to be pretty clear. However, the lines between urban and rural areas are becoming increasingly blurred. Today’s neighborhoods can include retail centers, business parks, housing developments expanding into traditionally agricultural landscapes.
U.S. pork producers realize the importance of being good neighbors and active, responsible citizens in their communities. Many of today’s pork producers, or their family members, also are teachers, coaches, community leaders, etc.
While concern is sometimes expressed about quality-of-life issues near pork production operations, communities in North Carolina have experienced rapid growth in pork production while at the same time tourism has increased. A study paid for by the Minnesota Legislature and conducted by researchers at the University of Minnesota found that new, large livestock facilities were strongly
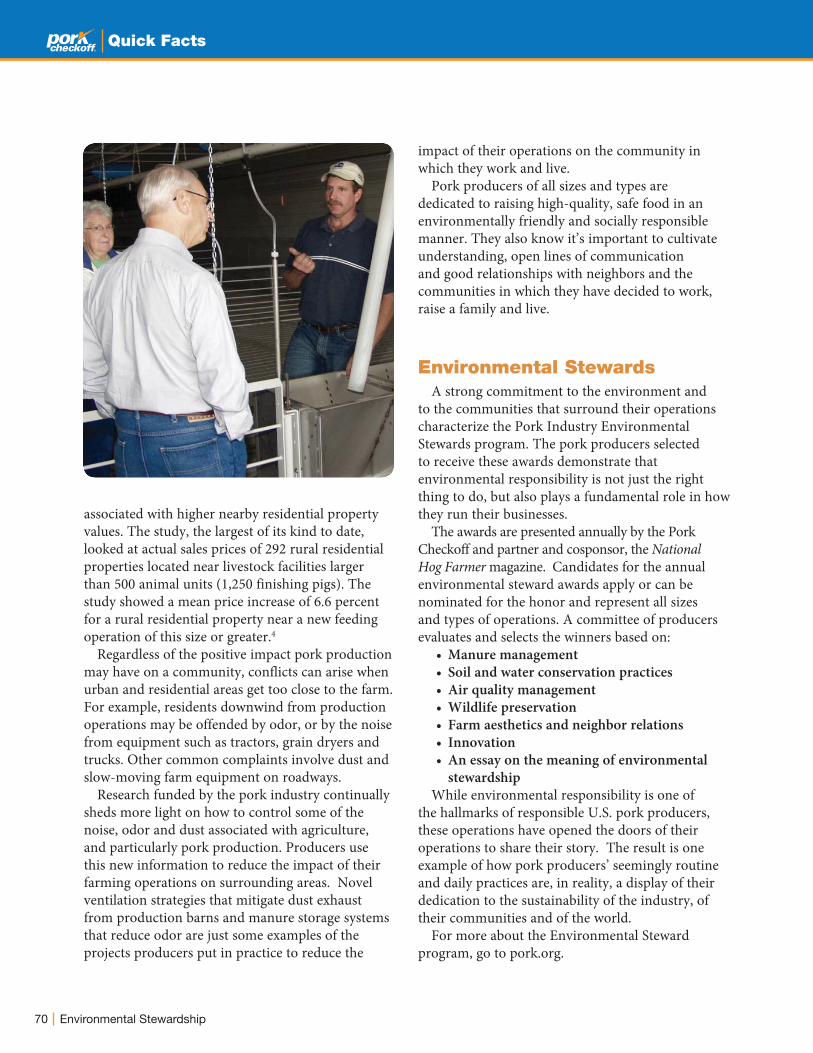
70 Environmental Stewardship
Quick Facts
associated with higher nearby residential property values. The study, the largest of its kind to date, looked at actual sales prices of 292 rural residential properties located near livestock facilities larger than 500 animal units (1,250 finishing pigs). The study showed a mean price increase of 6.6 percent for a rural residential property near a new feeding operation of this size or greater.4
Regardless of the positive impact pork production may have on a community, conflicts can arise when urban and residential areas get too close to the farm. For example, residents downwind from production operations may be offended by odor, or by the noise from equipment such as tractors, grain dryers and trucks. Other common complaints involve dust and slow-moving farm equipment on roadways.
Research funded by the pork industry continually sheds more light on how to control some of the noise, odor and dust associated with agriculture, and particularly pork production. Producers use this new information to reduce the impact of their farming operations on surrounding areas. Novel ventilation strategies that mitigate dust exhaust from production barns and manure storage systems that reduce odor are just some examples of the projects producers put in practice to reduce the
impact of their operations on the community in which they work and live.
Pork producers of all sizes and types are dedicated to raising high-quality, safe food in an environmentally friendly and socially responsible manner. They also know it’s important to cultivate understanding, open lines of communication and good relationships with neighbors and the communities in which they have decided to work, raise a family and live.
Environmental Stewards A strong commitment to the environment and
to the communities that surround their operations characterize the Pork Industry Environmental Stewards program. The pork producers selected to receive these awards demonstrate that environmental responsibility is not just the right thing to do, but also plays a fundamental role in how they run their businesses.
The awards are presented annually by the Pork Checkoff and partner and cosponsor, the National Hog Farmer magazine. Candidates for the annual environmental steward awards apply or can be nominated for the honor and represent all sizes and types of operations. A committee of producers evaluates and selects the winners based on:
• Manure management• Soil and water conservation practices• Air quality management• Wildlife preservation• Farm aesthetics and neighbor relations• Innovation• An essay on the meaning of environmental
stewardshipWhile environmental responsibility is one of
the hallmarks of responsible U.S. pork producers, these operations have opened the doors of their operations to share their story. The result is one example of how pork producers’ seemingly routine and daily practices are, in reality, a display of their dedication to the sustainability of the industry, of their communities and of the world.
For more about the Environmental Steward program, go to pork.org.

71Public Health
Public Health
Quick Facts
U.S. pork producers are committed to ensure their practices protect public health. As such, they:
• Use management practices consistent with pro-ducing safe food.
• Manage the use of animal health products to protect public health.
• Manage manure and air quality to protect pub-lic health.
Antibiotic ResistanceAntimicrobial (antibiotic) use in livestock agricul-
ture is an issue that has received increased attention in recent years.
Producers, veterinarians, and other food-chain participants share the concerns regarding the use of antibiotics as tools utilized in the production of our food supply. The responsible use of these products is beneficial both for the health and welfare of the animal and for food safety and human health. It is important to use antibiotics responsibly to minimize the development of antibiotic resistance, preserve their effectiveness and to maintain availability of these products. Antibiotics, and other animal health products, while important tools for good animal health management, are only one component in a comprehensive herd health program. Antibiotics are not used to replace good management, but rather as a supplement to management when appropriate.
Pork producers use antibiotics for three purposes: treatment of illness, prevention of disease, and to improve the nutritional efficiency of their animals.
• Treatment of Illness – The use of antibiotics in animals to combat a clinical illness. Antibiotics used for treatment are delivered by injection, in feed or in water.
• Prevention of Disease – The use of antibiotics in animals that have been, or are being, exposed to a bacterial infection, or are in operations that have historically experienced clinical out-breaks of disease at certain production stages.
Antibiotics for prevention are typically deliv-ered in feed or water.
• Improve Nutritional Efficiency – Antibiotics used to enhance the efficiency of pigs in con-verting feed. Antibiotics used to enhance nutritional efficiency are typically delivered in feed.
Producers and their veterinarians use their expe-rience and knowledge, in combination with scien-tific information, to decide when to use antibiotics in their pigs. The use of animal health products, including antibiotics, is only one part of a compre-hensive herd health program. Biosecurity, diagnos-tics, vaccination, facility maintenance and animal care also contribute to a farm’s overall animal health picture.
The appropriate use of antibiotics does not impact food safety negatively. There are animal health and societal benefits to using antibiotics to increase nutritional efficiency. Experience in Europe, where the political decision was made to ban the use of antibiotics to improve nutritional efficiency, shows that there are disease prevention benefits to using low levels of antibiotics. The ban was put in place in 1998 and there has been no demonstrated human health benefits from it.1 In addition, animals that convert feed efficiently con-sume less feed and produce less waste. That means
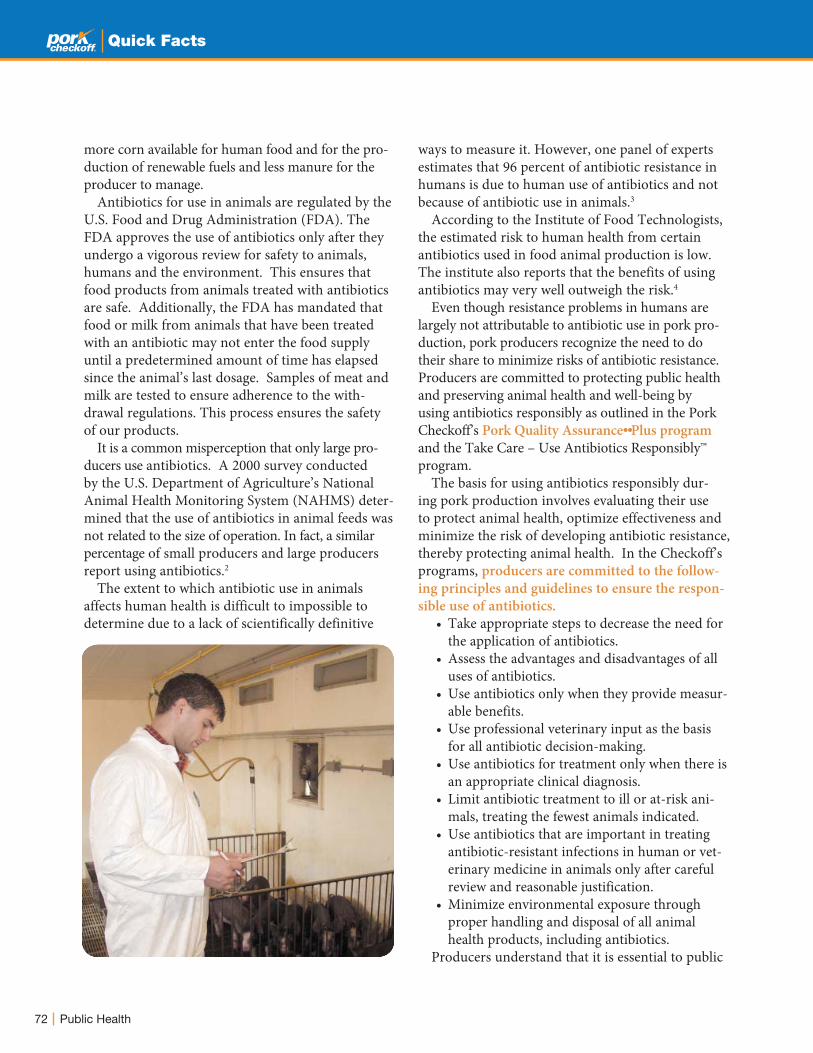
72 Public Health
Quick Facts
more corn available for human food and for the pro-duction of renewable fuels and less manure for the producer to manage.
Antibiotics for use in animals are regulated by the U.S. Food and Drug Administration (FDA). The FDA approves the use of antibiotics only after they undergo a vigorous review for safety to animals, humans and the environment. This ensures that food products from animals treated with antibiotics are safe. Additionally, the FDA has mandated that food or milk from animals that have been treated with an antibiotic may not enter the food supply until a predetermined amount of time has elapsed since the animal’s last dosage. Samples of meat and milk are tested to ensure adherence to the with-drawal regulations. This process ensures the safety of our products.
It is a common misperception that only large pro-ducers use antibiotics. A 2000 survey conducted by the U.S. Department of Agriculture’s National Animal Health Monitoring System (NAHMS) deter-mined that the use of antibiotics in animal feeds was not related to the size of operation. In fact, a similar percentage of small producers and large producers report using antibiotics.2
The extent to which antibiotic use in animals affects human health is difficult to impossible to determine due to a lack of scientifically definitive
ways to measure it. However, one panel of experts estimates that 96 percent of antibiotic resistance in humans is due to human use of antibiotics and not because of antibiotic use in animals.3
According to the Institute of Food Technologists, the estimated risk to human health from certain antibiotics used in food animal production is low. The institute also reports that the benefits of using antibiotics may very well outweigh the risk.4
Even though resistance problems in humans are largely not attributable to antibiotic use in pork pro-duction, pork producers recognize the need to do their share to minimize risks of antibiotic resistance. Producers are committed to protecting public health and preserving animal health and well-being by using antibiotics responsibly as outlined in the Pork Checkoff’s Pork Quality Assurance•• Plus program and the Take Care – Use Antibiotics Responsibly™ program.
The basis for using antibiotics responsibly dur-ing pork production involves evaluating their use to protect animal health, optimize effectiveness and minimize the risk of developing antibiotic resistance, thereby protecting animal health. In the Checkoff’s programs, producers are committed to the follow-ing principles and guidelines to ensure the respon-sible use of antibiotics.
• Take appropriate steps to decrease the need for the application of antibiotics.
• Assess the advantages and disadvantages of all uses of antibiotics.
• Use antibiotics only when they provide measur-able benefits.
• Use professional veterinary input as the basis for all antibiotic decision-making.
• Use antibiotics for treatment only when there is an appropriate clinical diagnosis.
• Limit antibiotic treatment to ill or at-risk ani-mals, treating the fewest animals indicated.
• Use antibiotics that are important in treating antibiotic-resistant infections in human or vet-erinary medicine in animals only after careful review and reasonable justification.
• Minimize environmental exposure through proper handling and disposal of all animal health products, including antibiotics.
Producers understand that it is essential to public
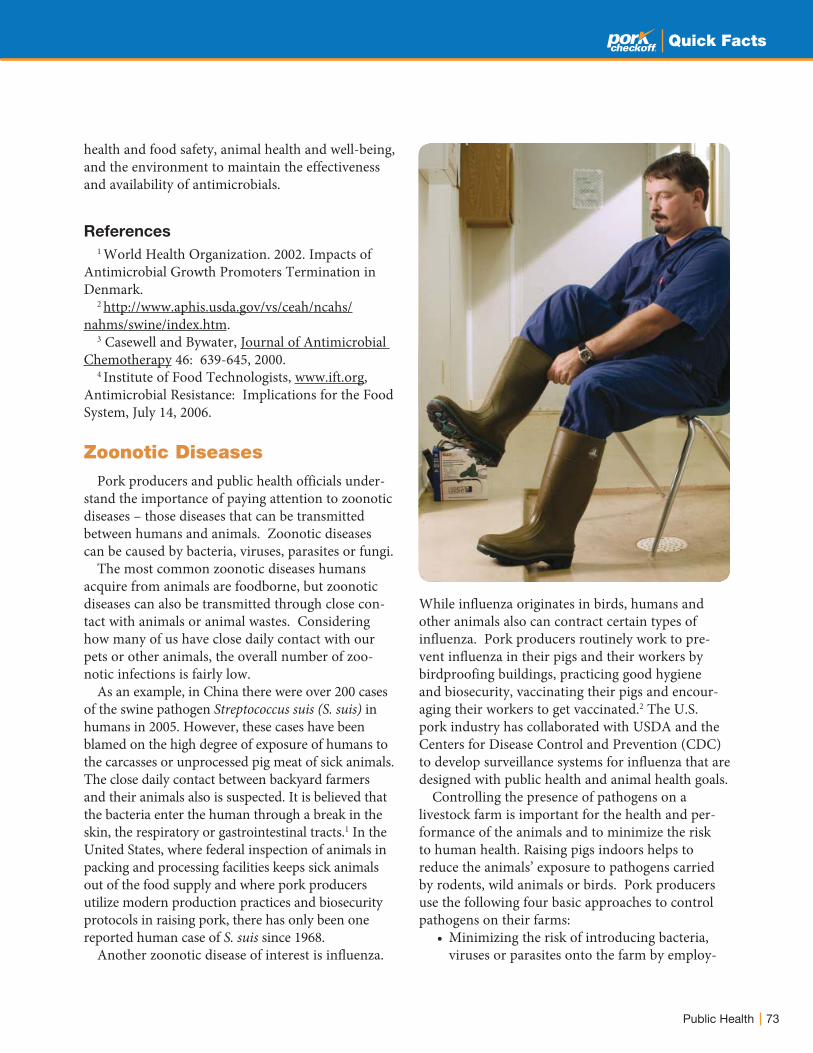
73Public Health
Quick Facts
While influenza originates in birds, humans and other animals also can contract certain types of influenza. Pork producers routinely work to pre-vent influenza in their pigs and their workers by birdproofing buildings, practicing good hygiene and biosecurity, vaccinating their pigs and encour-aging their workers to get vaccinated.2 The U.S. pork industry has collaborated with USDA and the Centers for Disease Control and Prevention (CDC) to develop surveillance systems for influenza that are designed with public health and animal health goals.
Controlling the presence of pathogens on a livestock farm is important for the health and per-formance of the animals and to minimize the risk to human health. Raising pigs indoors helps to reduce the animals’ exposure to pathogens carried by rodents, wild animals or birds. Pork producers use the following four basic approaches to control pathogens on their farms:
• Minimizing the risk of introducing bacteria, viruses or parasites onto the farm by employ-
health and food safety, animal health and well-being, and the environment to maintain the effectiveness and availability of antimicrobials.
References1 World Health Organization. 2002. Impacts of
Antimicrobial Growth Promoters Termination in Denmark.
2 http://www.aphis.usda.gov/vs/ceah/ncahs/nahms/swine/index.htm.
3 Casewell and Bywater, Journal of Antimicrobial Chemotherapy 46: 639-645, 2000.
4 Institute of Food Technologists, www.ift.org, Antimicrobial Resistance: Implications for the Food System, July 14, 2006.
Zoonotic DiseasesPork producers and public health officials under-
stand the importance of paying attention to zoonotic diseases – those diseases that can be transmitted between humans and animals. Zoonotic diseases can be caused by bacteria, viruses, parasites or fungi.
The most common zoonotic diseases humans acquire from animals are foodborne, but zoonotic diseases can also be transmitted through close con-tact with animals or animal wastes. Considering how many of us have close daily contact with our pets or other animals, the overall number of zoo-notic infections is fairly low.
As an example, in China there were over 200 cases of the swine pathogen Streptococcus suis (S. suis) in humans in 2005. However, these cases have been blamed on the high degree of exposure of humans to the carcasses or unprocessed pig meat of sick animals. The close daily contact between backyard farmers and their animals also is suspected. It is believed that the bacteria enter the human through a break in the skin, the respiratory or gastrointestinal tracts.1 In the United States, where federal inspection of animals in packing and processing facilities keeps sick animals out of the food supply and where pork producers utilize modern production practices and biosecurity protocols in raising pork, there has only been one reported human case of S. suis since 1968.
Another zoonotic disease of interest is influenza.
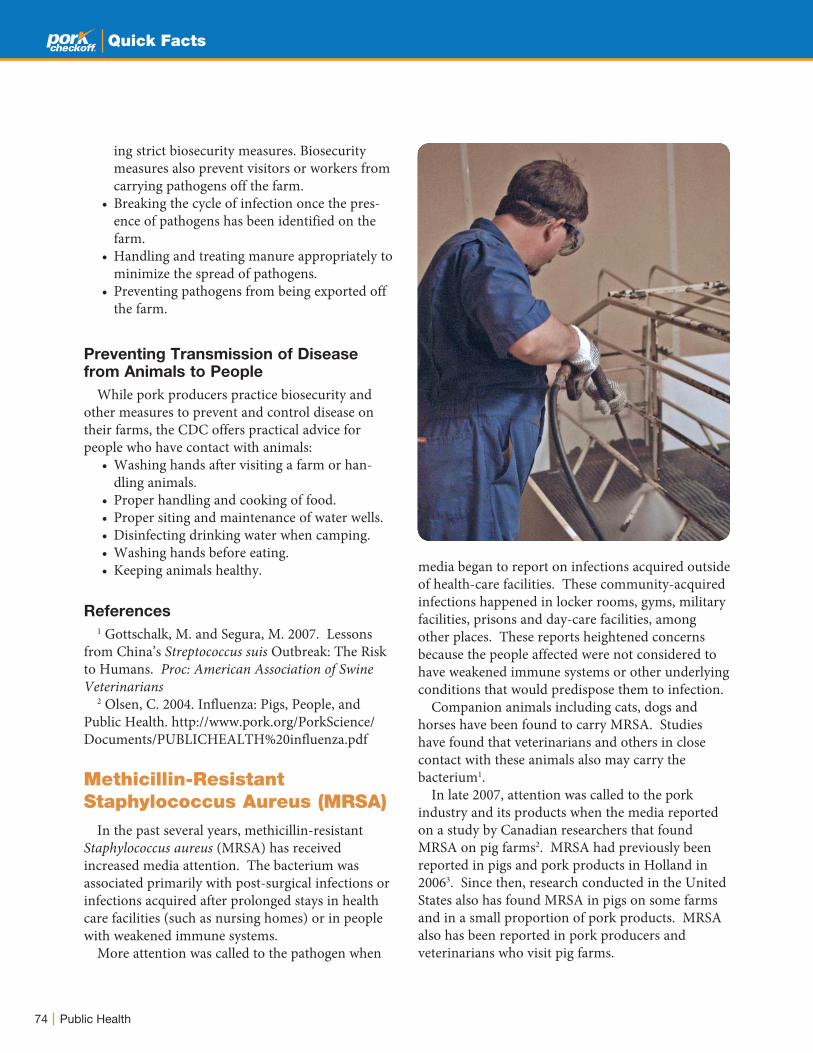
74 Public Health
Quick Facts
ing strict biosecurity measures. Biosecurity measures also prevent visitors or workers from carrying pathogens off the farm.
• Breaking the cycle of infection once the pres-ence of pathogens has been identified on the farm.
• Handling and treating manure appropriately to minimize the spread of pathogens.
• Preventing pathogens from being exported off the farm.
Preventing Transmission of Disease from Animals to People
While pork producers practice biosecurity and other measures to prevent and control disease on their farms, the CDC offers practical advice for people who have contact with animals:
• Washing hands after visiting a farm or han-dling animals.
• Proper handling and cooking of food. • Proper siting and maintenance of water wells. • Disinfecting drinking water when camping. • Washing hands before eating. • Keeping animals healthy.
References1 Gottschalk, M. and Segura, M. 2007. Lessons
from China’s Streptococcus suis Outbreak: The Risk to Humans. Proc: American Association of Swine Veterinarians
2 Olsen, C. 2004. Influenza: Pigs, People, and Public Health. http://www.pork.org/PorkScience/Documents/PUBLICHEALTH%20influenza.pdf
Methicillin-Resistant Staphylococcus Aureus (MRSA)
In the past several years, methicillin-resistant Staphylococcus aureus (MRSA) has received increased media attention. The bacterium was associated primarily with post-surgical infections or infections acquired after prolonged stays in health care facilities (such as nursing homes) or in people with weakened immune systems.
More attention was called to the pathogen when
media began to report on infections acquired outside of health-care facilities. These community-acquired infections happened in locker rooms, gyms, military facilities, prisons and day-care facilities, among other places. These reports heightened concerns because the people affected were not considered to have weakened immune systems or other underlying conditions that would predispose them to infection.
Companion animals including cats, dogs and horses have been found to carry MRSA. Studies have found that veterinarians and others in close contact with these animals also may carry the bacterium1.
In late 2007, attention was called to the pork industry and its products when the media reported on a study by Canadian researchers that found MRSA on pig farms2. MRSA had previously been reported in pigs and pork products in Holland in 20063. Since then, research conducted in the United States also has found MRSA in pigs on some farms and in a small proportion of pork products. MRSA also has been reported in pork producers and veterinarians who visit pig farms.
75Public Health
Quick Facts
MRSA, People and Pigs
MRSA is a type of Staphyloccocus aureus (Staph). Staph are bacteria found commonly in humans. In fact, the Centers for Disease Control and Prevention (CDC) report that Staph can be found in 25 to 50 percent of the United States’ population at any given time without causing infection4.
MRSA however, can only be found on between 1 to 3.5 percent of the U.S. population. As with Staph, a person usually carries MRSA in the nasal passages or on the skin without developing an infection.
MRSA also can be found on other animals, domestic and wild. Domestic animals such as cats, horses and dogs can carry the bacterium. Livestock, including cattle and pigs, and poultry also may carry MRSA. Wild animals (such as marine mammals, rabbits and turtles) and game animals also have been found to carry it.
Just as MRSA is a type of Staph, there are many types of MRSA. Some have been associated more commonly with health-care associated infections, some with community-acquired infections and some are more commonly associated with animals. The CDC has stated that the MRSA more commonly associated with health-care facilities is different than the one commonly found in community-acquired infections. It also has stated that the MRSA associated with community-acquired infections is clearly of human origin.
The MRSA most commonly found in pigs on North American farms is different from the one associated with health-care and community
infections. As is the case with small animal veterinarians and horse owners, it is not unusual for the people who come in contact with MRSA-carrying pigs to also carry MRSA. In many of those cases, the MRSA carried by people and by the pigs is of the same type. The bacteria do not appear to cause illness in the pigs and there are no data to support that the humans carrying this pathogen are at a higher risk of developing infection than the rest of the population.
Similarly, recent studies of health-care workers in Holland have found no statistical difference in the number that carry MRSA and have contact with livestock and those with no animal contact5.
MRSA and Pork
Several independent studies, abroad and in North America, have found MRSA in samples of meat offered for retail sale6. The bacterium has been found in samples of beef, veal, chicken, turkey, lamb, pork and game meats.
The European Union food safety and health agencies issued a joint scientific report on MRSA in livestock. They concluded that there is currently no evidence for increased risk of human colonization or infection following contact or consumption of food contaminated by MRSA both in the community and in a hospital.7
Furthermore, experiments designed to find MRSA in retail meats have found very small amounts of MRSA in the samples. It is not clear if the amount found would be enough to cause infection and no human infection has ever been reported from handling or consuming pork carrying MRSA. Dutch studies have determined that, “The numbers of MRSA bacteria found on foodstuffs are so low that the risk of [human] colonization as a result is considered to be particularly slight.”8
It is commonly accepted that conventional, safe handling and cooking practices reduce the risk of MRSA infection even further. In a report commissioned by the U.S. House Committee on Agriculture, the CDC states that, “it is reasonable to conclude that the vast majority of infections result from person-to-person contact.”9 The CDC also has stated that “although the finding of MRSA in
76 Public Health
Quick Facts
retail meats suggests a possible role for foodborne transmission, if such transmission occurs, it likely accounts for a very small proportion of human infections in the United States.”
Recommended guidelines10 for the handling of meat that reduce the potential for any type of foodborne illness are:
• Clean• Separate• Cook• Chill
Hand washing before handling food products and between different products to avoid cross contamination also is important.
Proper wound care, including prompt treatment and covering of wounds should always be done and especially if food is to be handled.
References1 Hanselman, Kruth, Rousseau, Low, Willey,
McGeer and Weese. 2006. Methicillin-resistant Staphylococcus aureus colonization in veterinary personnel. Emerg Infect Dis.
2 Khanna, Friendship, Dewey and Weese. 2007. Methicillin-resistant Staphylococcus aureus colonization in pigs and pig farmers. Vet. Microbiol.
3 van Loo, Diederen, Savelkoul, Woudenberg, Roosendaal, van Belkum, et al. 2007. Methicillin-resistant Staphylococcus aureus in meat products, the Netherlands. Online. Emerg Infect Dis. Accessed Aug. 2008. Available from http://www.cdc.gov/EID/content/13/11/1753.htm
4 Chambers. 2001. The changing epidemiology of Staph aureus?. Online. Emerg Infect. Dis. Accessed Nov. 2008. Available from http://www.cdc.gov/ncidod/eid/vol7no2/chambers.htm#6
5 Wulf, Tiemersma, Kluytmans, Bogaers, Leenders, Jansen, Berkhout, Ruijters, Haverkate, Isken, and Voss. 2008. MRSA carriage in healthcare personnel in contact with farm animals. Journal of Hospital Infection.
6 Weese, et al. 2008. International Conference on Emerging Infectious Diseases, Atlanta, Georgia. Proceedings.
7 Joint scientific report of ECDC, EFSA and EMEA on meticillin resistant Staphylococcus aureus
(MRSA) in livestock, companion animals and foods. EFSA-Q-2009-00612 (EFSA Scientific Report 2009 301, 1-10) and EMEA/CVMP/SAGAM/624/2009
8 Voedsel en Waren Autoriteit. Accessed Nov. 2008. www.vwa.nl
9 Centers for Disease Control and Prevention. 2007. Responses to questions on MRSA in food-producing animals addressed in the Dec. 14, 2007, Letter from the House Committee on Agriculture.
10 Partnership for Food Safety Education. Online. Accessed Nov. 2008. www.fightbac.org
Community Respiratory HealthPreserving the health of those employed in pork
production, as well as that of the people living in communities hosting pork production is a priority for pork producers.
People who work in close contact and for long hours with pigs may have an increase in respiratory symptoms such as sneezing, sinusitis or bronchitis. Pork producers routinely provide personal protec-tive equipment to their workers to help alleviate these symptoms. These concerns are not considered relevant to neighbors because the level of exposure that pork producers and their employees have to their work environment is much higher than the one neighbors experience.1 Research that includes medi-cal testing on neighbors in the United States has not been published. However, a systematic review of North American and European studies did not find consistent evidence for a strong association between community health and proximity to animal feeding operations.
There are several studies on the levels of emis-sions that neighbors of pork producers may experi-ence. In 2002, the Missouri Department of Health and Senior Services (DHSS) and the Agency for Toxic Substances and Disease Registry (ATSDR) conducted an exposure investigation to assess the community’s level of exposure to airborne ammonia from a swine concentrated animal feeding operation (CAFO) in northern Missouri. The site was permit-ted to house 123,648 hogs.
Air monitoring conducted during this study did not find airborne ammonia exposures from the farm occurring at a level expected to cause negative health
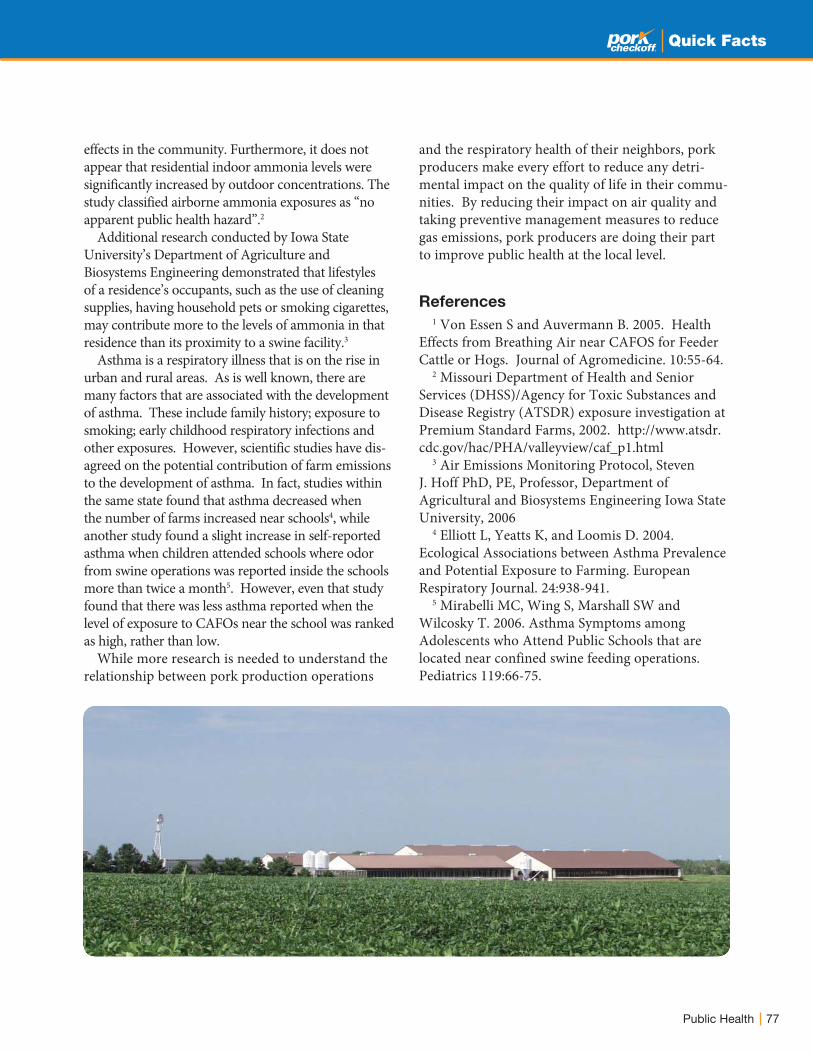
77Public Health
Quick Facts
effects in the community. Furthermore, it does not appear that residential indoor ammonia levels were significantly increased by outdoor concentrations. The study classified airborne ammonia exposures as “no apparent public health hazard”.2
Additional research conducted by Iowa State University’s Department of Agriculture and Biosystems Engineering demonstrated that lifestyles of a residence’s occupants, such as the use of cleaning supplies, having household pets or smoking cigarettes, may contribute more to the levels of ammonia in that residence than its proximity to a swine facility.3
Asthma is a respiratory illness that is on the rise in urban and rural areas. As is well known, there are many factors that are associated with the development of asthma. These include family history; exposure to smoking; early childhood respiratory infections and other exposures. However, scientific studies have dis-agreed on the potential contribution of farm emissions to the development of asthma. In fact, studies within the same state found that asthma decreased when the number of farms increased near schools4, while another study found a slight increase in self-reported asthma when children attended schools where odor from swine operations was reported inside the schools more than twice a month5. However, even that study found that there was less asthma reported when the level of exposure to CAFOs near the school was ranked as high, rather than low.
While more research is needed to understand the relationship between pork production operations
and the respiratory health of their neighbors, pork producers make every effort to reduce any detri-mental impact on the quality of life in their commu-nities. By reducing their impact on air quality and taking preventive management measures to reduce gas emissions, pork producers are doing their part to improve public health at the local level.
References1 Von Essen S and Auvermann B. 2005. Health
Effects from Breathing Air near CAFOS for Feeder Cattle or Hogs. Journal of Agromedicine. 10:55-64.
2 Missouri Department of Health and Senior Services (DHSS)/Agency for Toxic Substances and Disease Registry (ATSDR) exposure investigation at Premium Standard Farms, 2002. http://www.atsdr.cdc.gov/hac/PHA/valleyview/caf_p1.html
3 Air Emissions Monitoring Protocol, Steven J. Hoff PhD, PE, Professor, Department of Agricultural and Biosystems Engineering Iowa State University, 2006
4 Elliott L, Yeatts K, and Loomis D. 2004. Ecological Associations between Asthma Prevalence and Potential Exposure to Farming. European Respiratory Journal. 24:938-941.
5 Mirabelli MC, Wing S, Marshall SW and Wilcosky T. 2006. Asthma Symptoms among Adolescents who Attend Public Schools that are located near confined swine feeding operations. Pediatrics 119:66-75.
Quick Facts
78

79Public Health
Pork Safety
Quick Facts
U.S. pork producers recognize their obligation to
build and maintain the trust of customers and the public in their products. To achieve this, producers:
• Use management practices consistent with pro-ducing safe food.
• Manage the health of the herd to produce safe food.
• Manage technology to produce safe food. Their primary goal is to provide an abundant,
safe, and wholesome food supply to consumers, as outlined in the industry’s We Care initiative. Modern production systems and practices are designed to help accomplish that goal, together with Pork Checkoff programs, such as Pork Quality Assurance Plus.
Modern production practices have virtually elimi-nated some former common causes of human food-borne illness. Pathogens, such as Trichinella spiralis, formerly one of the most prominent pathogens, have largely disappeared with the movement of pigs to indoor production.
The changing face of the industry has led some to believe that modern and large pork producers contribute to foodborne illness more than the tradi-tional operations of the past. However, recent stud-ies (2008) have shown that exposure to Salmonella, Toxoplasma and Trichinella in pigs raised outdoors and in antibiotic-free systems were higher than in pigs raised in indoor production systems.
Additionally, according to the USDA (2006), bac-terial contamination of pork carcasses in packing plants is consistently lowest in large packing plants, which, due to the large volume of production, are most likely to acquire animals from large producers.
Residues and our Trade Partners
Never in the history of the pork industry has pork been as safe as it is today. However, the standards used to set market requirements for pork around the world may vary. As major exporters of pork around
the globe, U.S. pork producers work diligently to understand and satisfy product requirements for diverse customers.
One example of a market requirement is the establishment of maximum residue limits (MRLs) of chemicals, including animal health products in pork. The Pork Checkoff, working with the American Association of Swine Veterinarians and animal health companies has compiled a list of ani-mal health products and their withdrawal times to serve as a guideline for pork producers and veteri-narians when administering medications to animals that will enter the food supply.
More information on international MRLs is avail-able online at pork.org.

80
Quick Facts
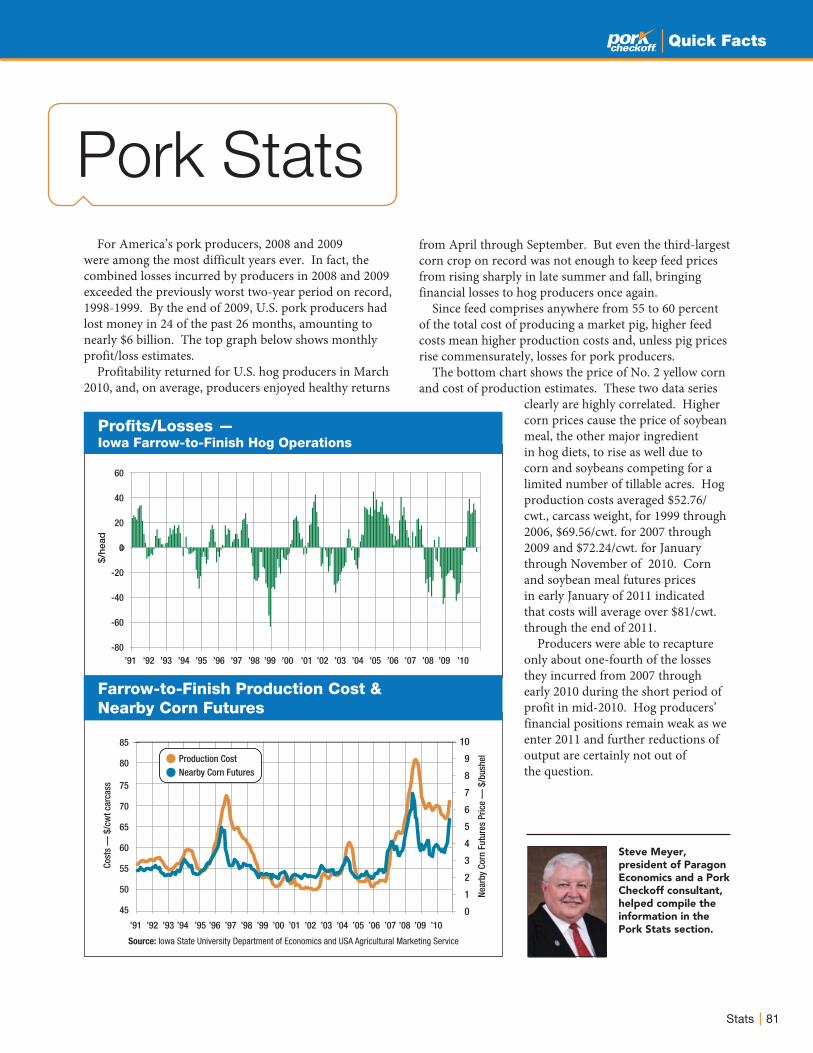
Quick Facts
Pork StatsFor America’s pork producers, 2008 and 2009
were among the most difficult years ever. In fact, the combined losses incurred by producers in 2008 and 2009 exceeded the previously worst two-year period on record, 1998-1999. By the end of 2009, U.S. pork producers had lost money in 24 of the past 26 months, amounting to nearly $6 billion. The top graph below shows monthly profit/loss estimates.
Profitability returned for U.S. hog producers in March 2010, and, on average, producers enjoyed healthy returns
from April through September. But even the third-largest corn crop on record was not enough to keep feed prices from rising sharply in late summer and fall, bringing financial losses to hog producers once again.
Since feed comprises anywhere from 55 to 60 percent of the total cost of producing a market pig, higher feed costs mean higher production costs and, unless pig prices rise commensurately, losses for pork producers.
The bottom chart shows the price of No. 2 yellow corn and cost of production estimates. These two data series
clearly are highly correlated. Higher corn prices cause the price of soybean meal, the other major ingredient in hog diets, to rise as well due to corn and soybeans competing for a limited number of tillable acres. Hog production costs averaged $52.76/cwt., carcass weight, for 1999 through 2006, $69.56/cwt. for 2007 through 2009 and $72.24/cwt. for January through November of 2010. Corn and soybean meal futures prices in early January of 2011 indicated that costs will average over $81/cwt. through the end of 2011.
Producers were able to recapture only about one-fourth of the losses they incurred from 2007 through early 2010 during the short period of profit in mid-2010. Hog producers’ financial positions remain weak as we enter 2011 and further reductions of output are certainly not out of the question.
Steve Meyer, president of Paragon Economics and a Pork Checkoff consultant, helped compile the information in the Pork Stats section.
0
60
40
20
0
-20
-40
-60
-80
$/he
ad
’91 ’92 ’93 ’94 ’95 ’96 ’97 ’98 ’99 ’00 ’01 ’02 ’03 ’04 ’05 ’06 ’07 ’08 ’09 ’10
Profi ts/Losses — Iowa Farrow-to-Finish Hog Operations
’91 ’92 ’93 ’94 ’95 ’96 ’97 ’98 ’99 ’00 ’01 ’02 ’03 ’04 ’05 ’06 ’07 ’08 ’09 ’10
85
80
75
70
65
60
55
50
45
10
9
8
7
6
5
4
3
2
1
0
Production CostNearby Corn Futures
Cost
s —
$/c
wt c
arca
ss
Near
by C
orn
Futu
res
Pric
e —
$/b
ushe
l
Farrow-to-Finish Production Cost & Nearby Corn Futures
Source: Iowa State University Department of Economics and USA Agricultural Marketing Service
Stats 81
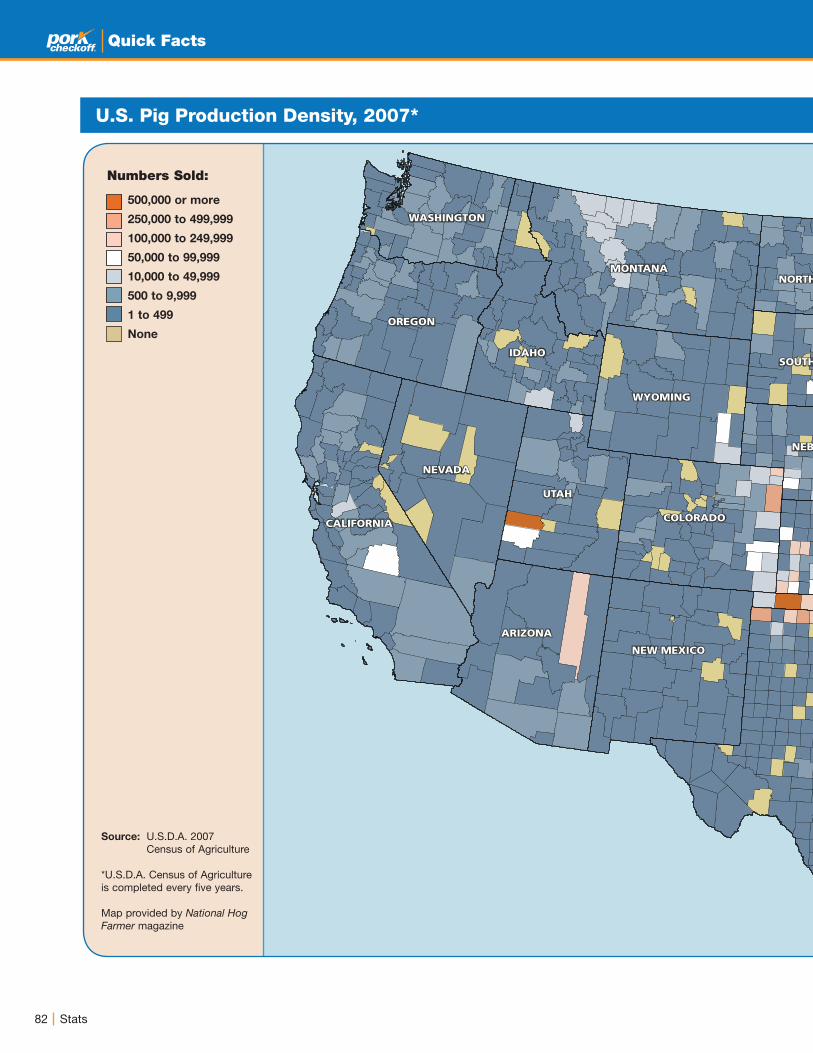
82 Stats
Quick Facts
U.S. Pig Production Density, 2007*
Source: U.S.D.A. 2007 Census of Agriculture
*U.S.D.A. Census of Agriculture is completed every five years.
Map provided by National Hog Farmer magazine
Numbers Sold:
500,000 or more
250,000 to 499,999
100,000 to 249,999
50,000 to 99,999
10,000 to 49,999
500 to 9,999
1 to 499
None

83Stats
Quick Facts
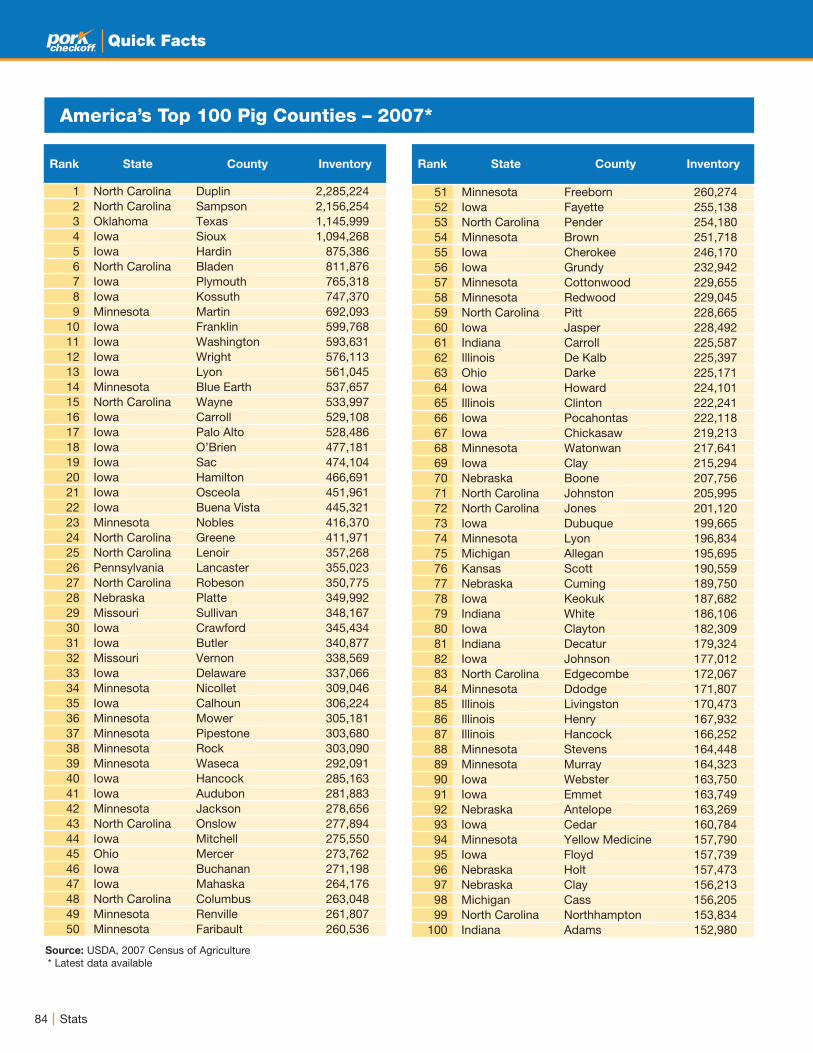
84 Stats
Quick Facts
Source: USDA, 2007 Census of Agriculture * Latest data available
America’s Top 100 Pig Counties – 2007*
Rank State County Inventory
1 North Carolina Duplin 2,285,2242 North Carolina Sampson 2,156,2543 Oklahoma Texas 1,145,9994 Iowa Sioux 1,094,2685 Iowa Hardin 875,3866 North Carolina Bladen 811,8767 Iowa Plymouth 765,3188 Iowa Kossuth 747,3709 Minnesota Martin 692,093
10 Iowa Franklin 599,76811 Iowa Washington 593,63112 Iowa Wright 576,11313 Iowa Lyon 561,04514 Minnesota Blue Earth 537,65715 North Carolina Wayne 533,99716 Iowa Carroll 529,10817 Iowa Palo Alto 528,48618 Iowa O’Brien 477,18119 Iowa Sac 474,10420 Iowa Hamilton 466,69121 Iowa Osceola 451,96122 Iowa Buena Vista 445,32123 Minnesota Nobles 416,37024 North Carolina Greene 411,97125 North Carolina Lenoir 357,26826 Pennsylvania Lancaster 355,02327 North Carolina Robeson 350,77528 Nebraska Platte 349,99229 Missouri Sullivan 348,16730 Iowa Crawford 345,43431 Iowa Butler 340,87732 Missouri Vernon 338,56933 Iowa Delaware 337,06634 Minnesota Nicollet 309,04635 Iowa Calhoun 306,22436 Minnesota Mower 305,18137 Minnesota Pipestone 303,68038 Minnesota Rock 303,09039 Minnesota Waseca 292,09140 Iowa Hancock 285,16341 Iowa Audubon 281,88342 Minnesota Jackson 278,65643 North Carolina Onslow 277,89444 Iowa Mitchell 275,55045 Ohio Mercer 273,76246 Iowa Buchanan 271,19847 Iowa Mahaska 264,17648 North Carolina Columbus 263,04849 Minnesota Renville 261,80750 Minnesota Faribault 260,536
Rank State County Inventory
51 Minnesota Freeborn 260,27452 Iowa Fayette 255,13853 North Carolina Pender 254,18054 Minnesota Brown 251,71855 Iowa Cherokee 246,17056 Iowa Grundy 232,94257 Minnesota Cottonwood 229,65558 Minnesota Redwood 229,04559 North Carolina Pitt 228,66560 Iowa Jasper 228,49261 Indiana Carroll 225,58762 Illinois De Kalb 225,39763 Ohio Darke 225,17164 Iowa Howard 224,10165 Illinois Clinton 222,24166 Iowa Pocahontas 222,11867 Iowa Chickasaw 219,21368 Minnesota Watonwan 217,64169 Iowa Clay 215,29470 Nebraska Boone 207,75671 North Carolina Johnston 205,99572 North Carolina Jones 201,12073 Iowa Dubuque 199,66574 Minnesota Lyon 196,83475 Michigan Allegan 195,69576 Kansas Scott 190,55977 Nebraska Cuming 189,75078 Iowa Keokuk 187,68279 Indiana White 186,10680 Iowa Clayton 182,30981 Indiana Decatur 179,32482 Iowa Johnson 177,01283 North Carolina Edgecombe 172,06784 Minnesota Ddodge 171,80785 Illinois Livingston 170,47386 Illinois Henry 167,93287 Illinois Hancock 166,25288 Minnesota Stevens 164,44889 Minnesota Murray 164,32390 Iowa Webster 163,75091 Iowa Emmet 163,74992 Nebraska Antelope 163,26993 Iowa Cedar 160,78494 Minnesota Yellow Medicine 157,79095 Iowa Floyd 157,73996 Nebraska Holt 157,47397 Nebraska Clay 156,21398 Michigan Cass 156,20599 North Carolina Northhampton 153,834
100 Indiana Adams 152,980

85Stats
Quick Facts
State Rankings by Inventory – 2010
Source: Meat Animal Production, Disposition and Income, USDA, NASS, April 2010
1 Adjustments made for changes in inventory and for inshipments.2 Excludes custom slaughter for use on farms where produced and interfarm sales within the state.3 Includes allowance for higher average price of state inshipment and outshipments of feeder pigs.4 Includes custom slaughter for use on farms where produced and state outshipments, but excludes interfarm sales within the state.
StateProduction1
(1,000 lbs.)
Marketings2
(1,000 lbs.)
Value of
Production3
($1,000)
Marketings4
(1,000 head)
Inventory on
Dec 1, 2009
(1,000 head)
Cash
Receipts3, 4
($1,000)
1 Iowa 9,623,124 10,339,702 3,585,441 40,476 19,200 4,427,3732 North Carolina 4,099,445 4,151,504 1,836,124 19,171 9,600 1,877,7983 Minnesota 3,426,675 3,720,325 1,420,587 16,563 7,300 1,661,3434 Illinois 1,840,656 1,875,824 908,335 10,276 4,300 951,8315 Indiana 1,730,277 1,798,910 724,077 7,633 3,650 834,0216 Missouri 1,697,108 1,752,581 675,320 8,874 3,100 766,5647 Nebraska 1,368,535 1,411,677 629,840 7,742 3,100 656,7798 Oklahoma 1,265,851 1,315,666 473,680 7,391 2,300 511,3019 Ohio 997,333 1,020,960 391,012 3,873 2,010 414,992
10 Kansas 915,237 945,505 326,925 3,628 1,810 364,85911 Pennsylvania 408,916 415,282 159,393 1,769 1,160 170,08612 South Dakota 675,571 727,222 295,942 4,062 1,160 337,46713 Michigan 606,574 611,350 223,320 2,206 1,080 229,61214 Texas 303,688 341,515 115,156 1,763 770 129,46115 Utah 324,647 326,550 154,114 1,556 730 155,11116 Colorado 268,688 280,771 129,681 2,684 710 137,64517 Mississippi 179,790 180,305 69,416 723 365 69,80418 Virginia 110,882 111,205 48,725 470 365 49,70119 Wisconsin 188,766 190,727 90,422 863 360 93,83320 Kentucky 173,505 181,620 66,522 755 350 72,49121 South Carolina 49,908 54,270 22,035 293 225 24,70622 Arkansas 109,779 129,037 75,542 1,695 200 85,38223 Georgia 89,957 102,929 43,588 791 195 52,24724 Tennessee 92,354 98,465 36,343 402 185 39,48925 Montana 78,601 80,750 33,794 421 175 36,50226 Arizona 76,521 75,660 38,575 292 167 38,36027 North Dakota 60,908 69,228 39,733 797 155 43,84528 Alabama 69,863 78,783 30,467 400 140 35,32229 California 53,886 56,880 18,979 253 100 24,77130 Wyoming 122,787 123,484 50,231 583 87 50,74131 New York 25,347 27,992 8,708 161 77 9,90132 Idaho 25,984 25,660 10,366 93 36 10,65633 Maryland 15,250 16,109 6,079 94 30 7,06734 Washington 11,453 11,585 4,377 56 23 4,62935 Florida 7,879 8,240 2,927 58 20 3,11836 Oregon 9,484 9,435 4,239 39 17 4,21737 Hawaii 3,319 3,096 3,212 15 13 2,99638 Massachusetts 1,813 1,608 666 10 11 63139 Louisiana 2,757 2,869 976 15 10 1,02440 New Jersey 1,814 2,520 426 27 8 83241 Deleware 4,241 4,683 1,793 39 8 2,10642 West Virginia 2,263 1,786 982 9 5 78143 Maine 2,135 1,633 857 9 5 69844 Vermont 1,285 1,087 501 5 3 42745 Connecticut 831 746 321 4 3 29246 Nevada 2,650 2,744 1,001 12 3 1,06647 New Hampshire 1,235 1,349 388 6 2 52848 Rhode Island 452 392 176 3 2 15449 New Mexico 780 524 267 3 2 18650 Alaska 604 409 547 2 1 368
US 31,131,408 32,693,154 12,762,128 149,065 65,327 14,395,114
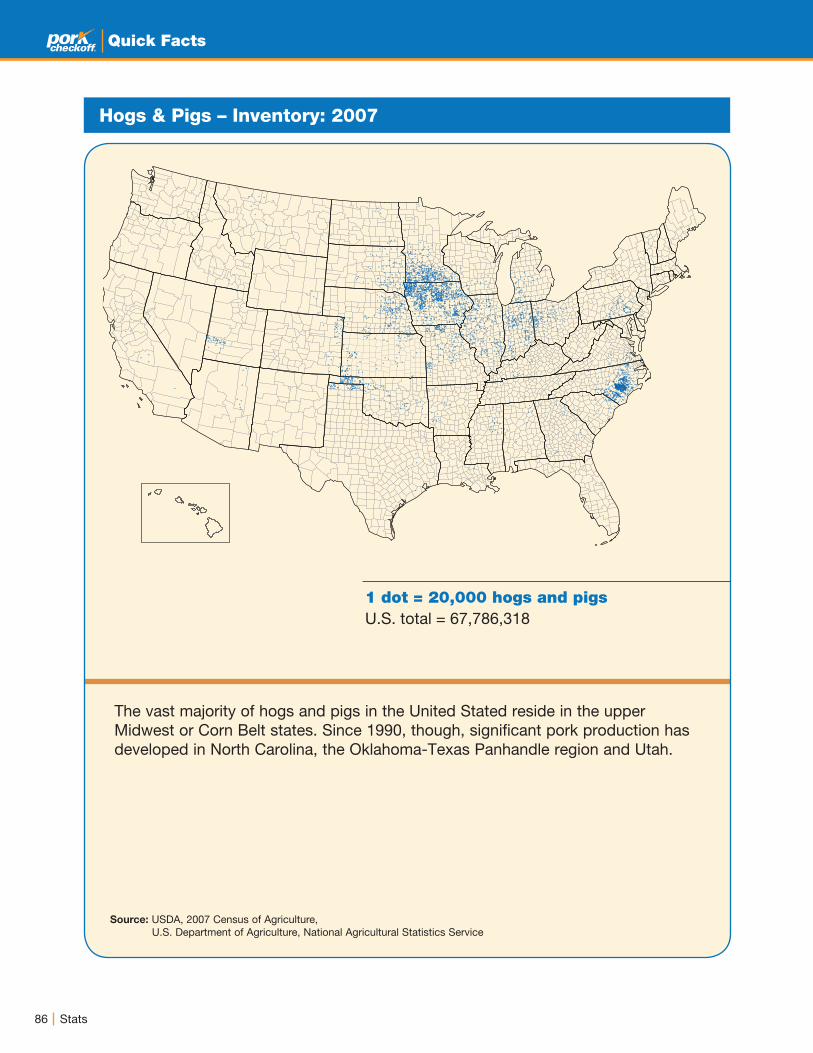
86 Stats
Quick Facts
1 dot = 20,000 hogs and pigsU.S. total = 67,786,318
Hogs & Pigs – Inventory: 2007
The vast majority of hogs and pigs in the United Stated reside in the upper Midwest or Corn Belt states. Since 1990, though, significant pork production has developed in North Carolina, the Oklahoma-Texas Panhandle region and Utah.
Source: USDA, 2007 Census of Agriculture, U.S. Department of Agriculture, National Agricultural Statistics Service

87Stats
Quick Facts
1 dot = increase of 5,000 hogs and pigs1 dot = decrease of 5,000 Hogs and PigsUnited States Net Increase + 7,381,215
Hogs & Pigs – Change in Inventory: 2002 to 2007
Since 1997, U.S. hog inventories have moved from “fringe” Corn Belt areas and the southeast states and have become even more concentrated in Iowa, Minnesota, the high plains of Oklahoma, Texas, Kansas, Colorado and Utah. Most of these areas are close to packing plants and have ample grain supplies.
Source: USDA, 2007 Census of Agriculture, U.S. Department of Agriculture, National Agricultural Statistics Service

88 Stats
Quick Facts
Number of U.S. Hog Operations by Inventory Size
Th
ou
sa
nd
Op
era
tio
ns
Sources: USDA, Hogs and Pigs Report (December 1977-2002) Livestock Operations (April 2004) Farms, Land in Farms and Livestock Operations (2005-2010)
• Categories for 500 head or more are cumulative (i.e., the 500+ column includes the 1,000+ column, which includes the 2,000+ etc.)
• An operation is any farm that has one or more hogs or pigs on hand at any time during the year.
0
100
200
300
400
500
600
700
’77 ’79 ’81 ’83 ’85 ’87 ’89 ’91’93
’95’97
’99’01
’03’05
’07’09
5000+
2000+
1000+
500+
100 - 499
1 - 99
Total
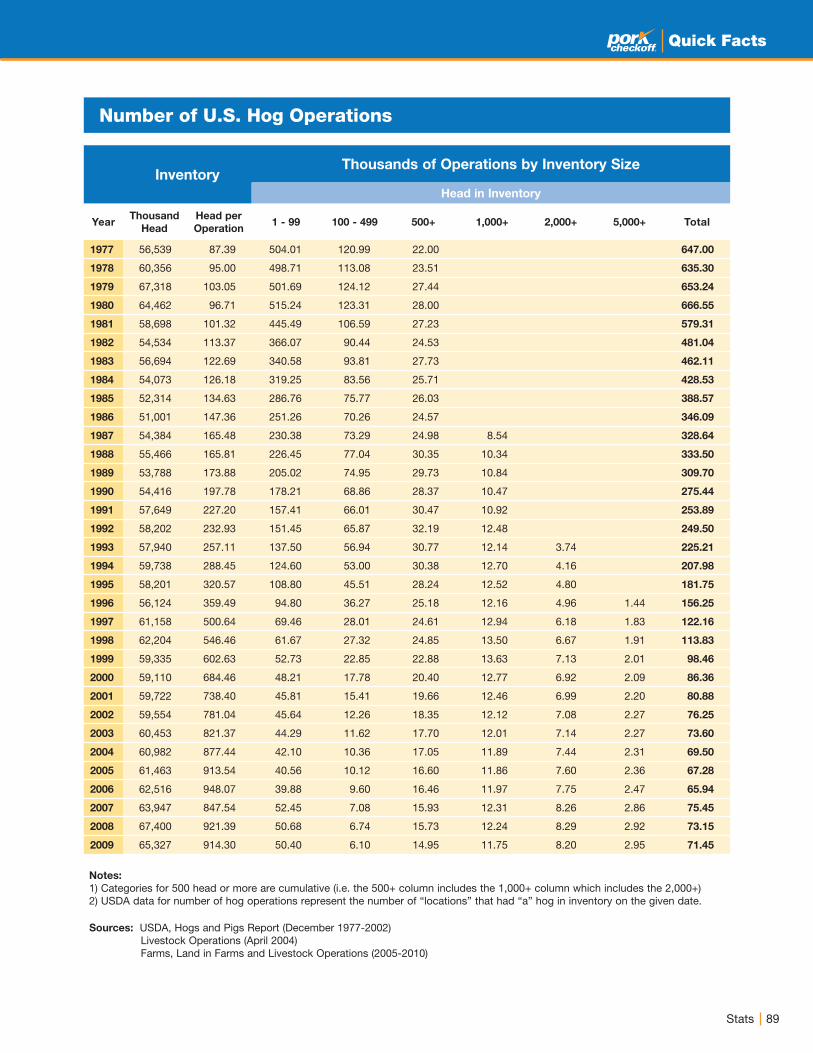
89Stats
Quick Facts
Number of U.S. Hog Operations
InventoryThousands of Operations by Inventory Size
Head in Inventory
YearThousand
Head
Head per
Operation1 - 99 100 - 499 500+ 1,000+ 2,000+ 5,000+ Total
1977 56,539 87.39 504.01 120.99 22.00 647.00
1978 60,356 95.00 498.71 113.08 23.51 635.30
1979 67,318 103.05 501.69 124.12 27.44 653.24
1980 64,462 96.71 515.24 123.31 28.00 666.55
1981 58,698 101.32 445.49 106.59 27.23 579.31
1982 54,534 113.37 366.07 90.44 24.53 481.04
1983 56,694 122.69 340.58 93.81 27.73 462.11
1984 54,073 126.18 319.25 83.56 25.71 428.53
1985 52,314 134.63 286.76 75.77 26.03 388.57
1986 51,001 147.36 251.26 70.26 24.57 346.09
1987 54,384 165.48 230.38 73.29 24.98 8.54 328.64
1988 55,466 165.81 226.45 77.04 30.35 10.34 333.50
1989 53,788 173.88 205.02 74.95 29.73 10.84 309.70
1990 54,416 197.78 178.21 68.86 28.37 10.47 275.44
1991 57,649 227.20 157.41 66.01 30.47 10.92 253.89
1992 58,202 232.93 151.45 65.87 32.19 12.48 249.50
1993 57,940 257.11 137.50 56.94 30.77 12.14 3.74 225.21
1994 59,738 288.45 124.60 53.00 30.38 12.70 4.16 207.98
1995 58,201 320.57 108.80 45.51 28.24 12.52 4.80 181.75
1996 56,124 359.49 94.80 36.27 25.18 12.16 4.96 1.44 156.25
1997 61,158 500.64 69.46 28.01 24.61 12.94 6.18 1.83 122.16
1998 62,204 546.46 61.67 27.32 24.85 13.50 6.67 1.91 113.83
1999 59,335 602.63 52.73 22.85 22.88 13.63 7.13 2.01 98.46
2000 59,110 684.46 48.21 17.78 20.40 12.77 6.92 2.09 86.36
2001 59,722 738.40 45.81 15.41 19.66 12.46 6.99 2.20 80.88
2002 59,554 781.04 45.64 12.26 18.35 12.12 7.08 2.27 76.25
2003 60,453 821.37 44.29 11.62 17.70 12.01 7.14 2.27 73.60
2004 60,982 877.44 42.10 10.36 17.05 11.89 7.44 2.31 69.50
2005 61,463 913.54 40.56 10.12 16.60 11.86 7.60 2.36 67.28
2006 62,516 948.07 39.88 9.60 16.46 11.97 7.75 2.47 65.94
2007 63,947 847.54 52.45 7.08 15.93 12.31 8.26 2.86 75.45
2008 67,400 921.39 50.68 6.74 15.73 12.24 8.29 2.92 73.15
2009 65,327 914.30 50.40 6.10 14.95 11.75 8.20 2.95 71.45
Notes: 1) Categories for 500 head or more are cumulative (i.e. the 500+ column includes the 1,000+ column which includes the 2,000+) 2) USDA data for number of hog operations represent the number of “locations” that had “a” hog in inventory on the given date.
Sources: USDA, Hogs and Pigs Report (December 1977-2002) Livestock Operations (April 2004) Farms, Land in Farms and Livestock Operations (2005-2010)
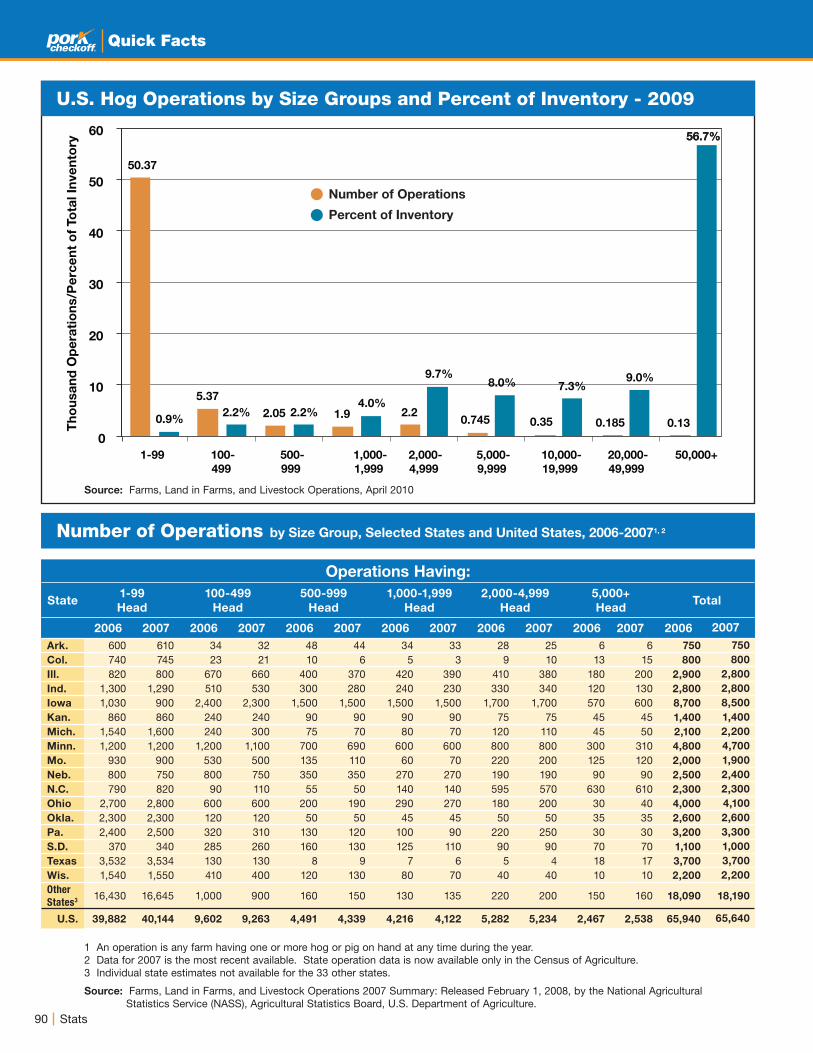
90 Stats
Quick Facts
U.S. Hog Operations by Size Groups and Percent of Inventory - 2009
Number of Operations by Size Group, Selected States and United States, 2006-20071, 2
Operations Having:
State1-99
Head
100-499
Head
500-999
Head
1,000-1,999
Head
2,000-4,999
Head
5,000+
HeadTotal
2006 2007 2006 2007 2006 2007 2006 2007 2006 2007 2006 2007 2006 2007
Ark. 600 610 34 32 48 44 34 33 28 25 6 6 750 750
Col. 740 745 23 21 10 6 5 3 9 10 13 15 800 800
Ill. 820 800 670 660 400 370 420 390 410 380 180 200 2,900 2,800
Ind. 1,300 1,290 510 530 300 280 240 230 330 340 120 130 2,800 2,800
Iowa 1,030 900 2,400 2,300 1,500 1,500 1,500 1,500 1,700 1,700 570 600 8,700 8,500
Kan. 860 860 240 240 90 90 90 90 75 75 45 45 1,400 1,400
Mich. 1,540 1,600 240 300 75 70 80 70 120 110 45 50 2,100 2,200
Minn. 1,200 1,200 1,200 1,100 700 690 600 600 800 800 300 310 4,800 4,700
Mo. 930 900 530 500 135 110 60 70 220 200 125 120 2,000 1,900
Neb. 800 750 800 750 350 350 270 270 190 190 90 90 2,500 2,400
N.C. 790 820 90 110 55 50 140 140 595 570 630 610 2,300 2,300
Ohio 2,700 2,800 600 600 200 190 290 270 180 200 30 40 4,000 4,100
Okla. 2,300 2,300 120 120 50 50 45 45 50 50 35 35 2,600 2,600
Pa. 2,400 2,500 320 310 130 120 100 90 220 250 30 30 3,200 3,300
S.D. 370 340 285 260 160 130 125 110 90 90 70 70 1,100 1,000
Texas 3,532 3,534 130 130 8 9 7 6 5 4 18 17 3,700 3,700
Wis. 1,540 1,550 410 400 120 130 80 70 40 40 10 10 2,200 2,200
Other
States316,430 16,645 1,000 900 160 150 130 135 220 200 150 160 18,090 18,190
U.S. 39,882 40,144 9,602 9,263 4,491 4,339 4,216 4,122 5,282 5,234 2,467 2,538 65,940 65,640
1 An operation is any farm having one or more hog or pig on hand at any time during the year.2 Data for 2007 is the most recent available. State operation data is now available only in the Census of Agriculture.3 Individual state estimates not available for the 33 other states.
Source: Farms, Land in Farms, and Livestock Operations 2007 Summary: Released February 1, 2008, by the National Agricultural Statistics Service (NASS), Agricultural Statistics Board, U.S. Department of Agriculture.
50.37
5.37
2.05 1.9 2.2 0.745 0.35 0.185 0.13 0.9%
2.2% 2.2% 4.0%
9.7% 8.0% 7.3%
9.0%
56.7% 56.7%
0
10
20
30
40
50
60
1-99 100-
499
500-
999
1,000-
1,999
2,000-
4,999
5,000-
9,999
10,000-
19,999
20,000-
49,999
50,000+
Th
ou
sa
nd
Op
era
tio
ns/P
erc
en
t o
f To
tal In
ve
nto
ry
Number of Operations
Percent of Inventory
Source: Farms, Land in Farms, and Livestock Operations, April 2010
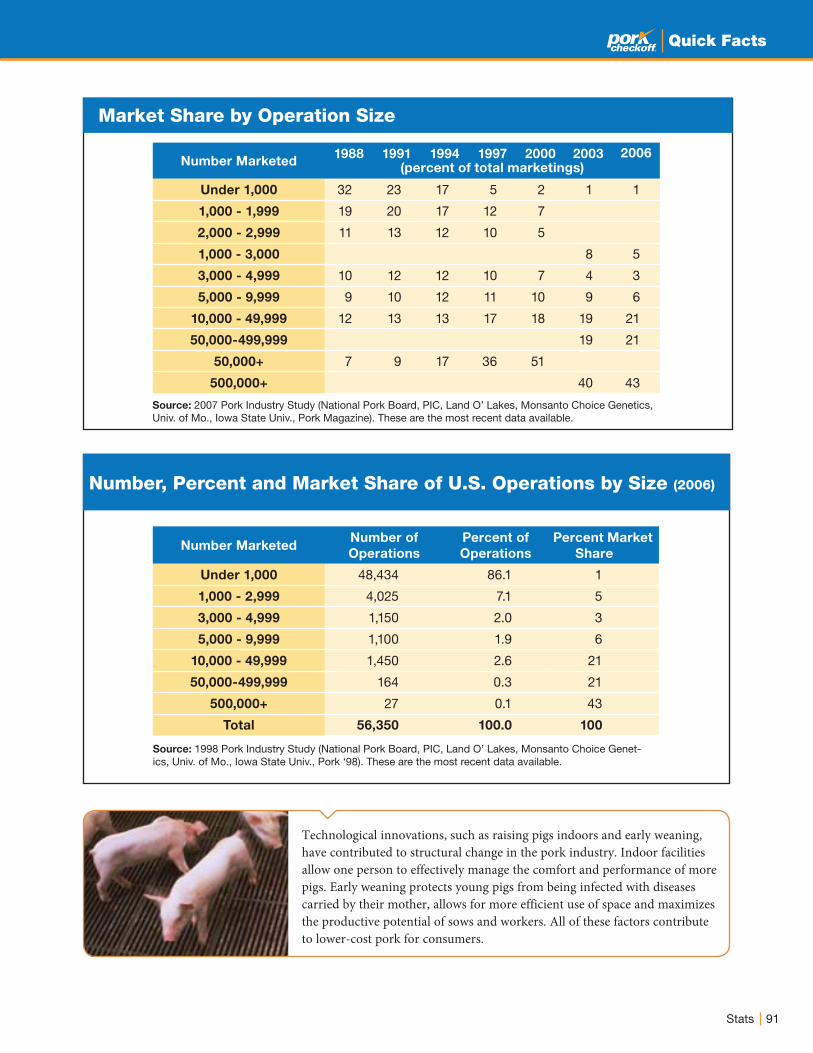
91Stats
Quick Facts
Market Share by Operation Size
Number, Percent and Market Share of U.S. Operations by Size (2006)
Number Marketed1988 1991 1994 1997 2000 2003 2006
Under 1,000 32 23 17 5 2 1 1
1,000 - 1,999 19 20 17 12 7
2,000 - 2,999 11 13 12 10 5
1,000 - 3,000 8 5
3,000 - 4,999 10 12 12 10 7 4 3
5,000 - 9,999 9 10 12 11 10 9 6
10,000 - 49,999 12 13 13 17 18 19 21
50,000-499,999 19 21
50,000+ 7 9 17 36 51
500,000+ 40 43
Number MarketedNumber of
Operations
Percent of
Operations
Percent Market
Share
Under 1,000 48,434 86.1 1
1,000 - 2,999 4,025 7.1 5
3,000 - 4,999 1,150 2.0 3
5,000 - 9,999 1,100 1.9 6
10,000 - 49,999 1,450 2.6 21
50,000-499,999 164 0.3 21
500,000+ 27 0.1 43
Total 56,350 100.0 100
Source: 1998 Pork Industry Study (National Pork Board, PIC, Land O’ Lakes, Monsanto Choice Genet-ics, Univ. of Mo., Iowa State Univ., Pork ‘98). These are the most recent data available.
Source: 2007 Pork Industry Study (National Pork Board, PIC, Land O’ Lakes, Monsanto Choice Genetics, Univ. of Mo., Iowa State Univ., Pork Magazine). These are the most recent data available.
Technological innovations, such as raising pigs indoors and early weaning, have contributed to structural change in the pork industry. Indoor facilities allow one person to effectively manage the comfort and performance of more pigs. Early weaning protects young pigs from being infected with diseases carried by their mother, allows for more efficient use of space and maximizes the productive potential of sows and workers. All of these factors contribute to lower-cost pork for consumers.
(percent of total marketings)
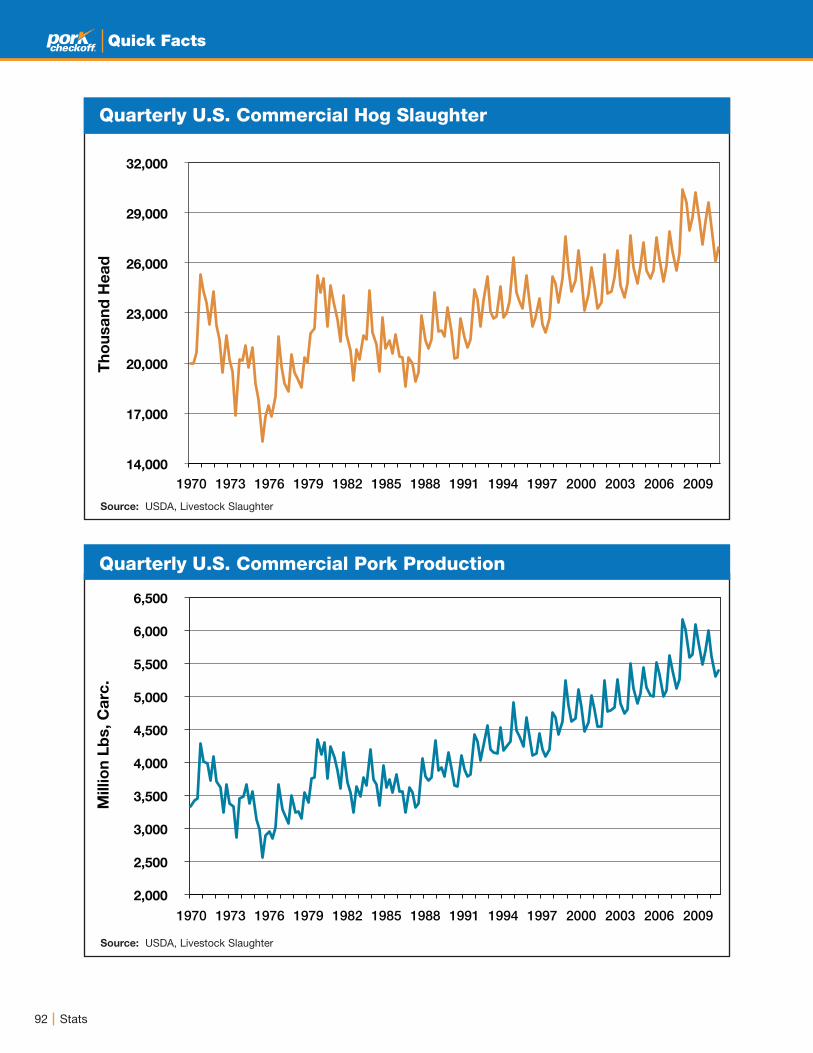
92 Stats
Quick Facts
Quarterly U.S. Commercial Hog Slaughter
14,000
17,000
20,000
23,000
26,000
29,000
32,000
1970 1973 1976 1979 1982 1985 1988 1991 1994 1997 2000 2003 2006 2009
Th
ou
sa
nd
He
ad
1970 1973 1976 1979 1982 1985 1988 1991 1994 1997 2000 2003 2006 2009
2,000
2,500
3,000
3,500
4,000
4,500
5,000
5,500
6,000
6,500
Millio
n L
bs, C
arc
.
Quarterly U.S. Commercial Pork Production
Source: USDA, Livestock Slaughter
Source: USDA, Livestock Slaughter

93Stats
Quick Facts
U.S. Breeding Herd, Quarterly
U.S. Pigs Saved Per Litter
U.S. Breeding Herd and Production
U.S. Swine Breeding Herd and Farrowings
1,000
1,500
2,000
2,500
3,000
3,500
5,000 ’85 ’87 ’89 ’91 ’93 ’95 ’97 ’99 ’01 ’03 ’05 ’07 ’09
5,500
6,000
6,500
7,000
7,500
8,000
Litters Born Thousand Head
Breeding Herd Farrowings
7.0
7.5
8.0
8.5
9.0
9.5
10.0
Pigs
Average Growth Rate, 1994 through 1997 = 1.7%
Average Growth Rate, Q3-'07 through Q3-'10 = 2.0%
Average Growth Rate,1998 through Q2-07 = 0.5%
’85 ’87 ’89 ’91 ’93 ’95 ’97 ’99 ’01 ’03 ’05 ’07 ’09
’85 ’87 ’89 ’91 ’93 ’95 ’97 ’99 ’01 ’03 ’05 ’07 ’09 5,000
5,500
6,000
6,500
7,000
7,500
8,000
Thousand Head
Sept. 1, 2010: 5.770 million head
’87 ’89 ’91 ’93 ’95 ’97 ’99 ’01 ’03 ’05 ’07 ’09
Quarterly Breeding Herd Quarterly Pork Production
3,000
3,500
4,000
4,500
5,000
5,500
6,000
6,500
5,000
5,500
6,000
6,500
7,000
7,500
8,000
Mil. lbs. carc. Thousand Head
Source: USDA, Hogs and Pigs and Livestock Slaughter
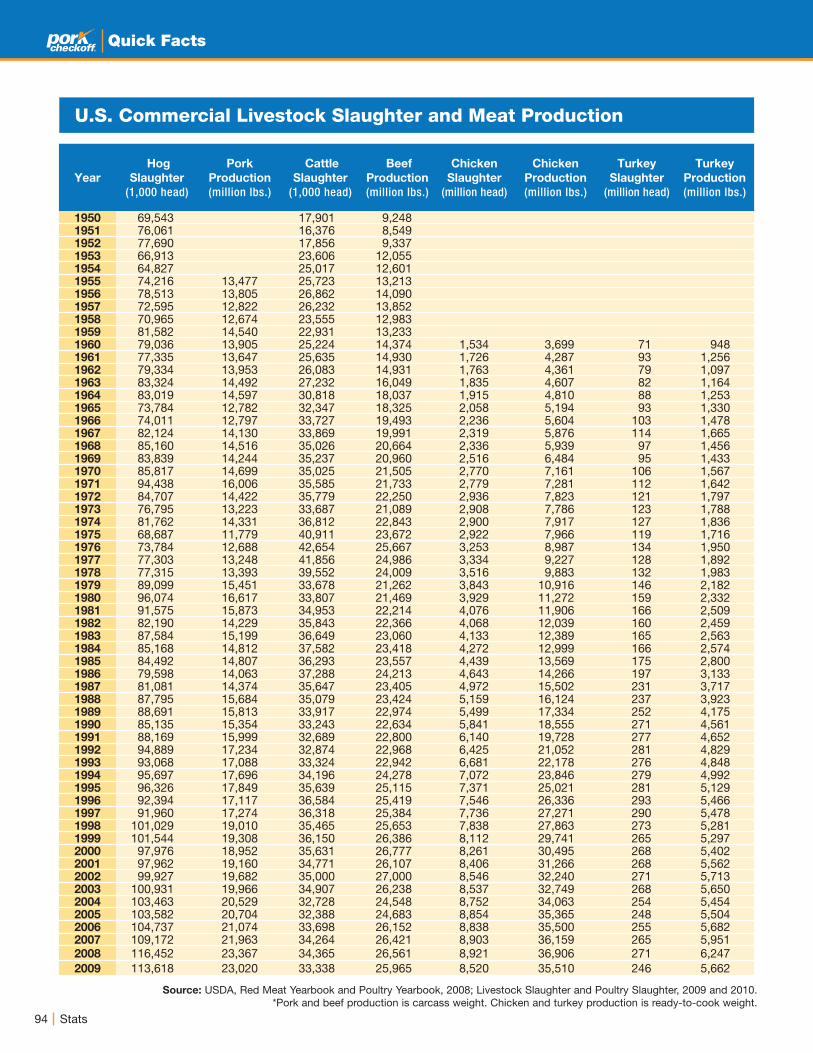
94 Stats
Quick Facts
U.S. Commercial Livestock Slaughter and Meat Production
Source: USDA, Red Meat Yearbook and Poultry Yearbook, 2008; Livestock Slaughter and Poultry Slaughter, 2009 and 2010. *Pork and beef production is carcass weight. Chicken and turkey production is ready-to-cook weight.
Year
Hog
Slaughter
(1,000 head)
Pork
Production
(million lbs.)
Cattle
Slaughter
(1,000 head)
Beef
Production
(million lbs.)
Chicken
Slaughter
(million head)
Chicken
Production
(million lbs.)
Turkey
Slaughter
(million head)
Turkey
Production
(million lbs.)
1950 69,543 17,901 9,2481951 76,061 16,376 8,5491952 77,690 17,856 9,3371953 66,913 23,606 12,0551954 64,827 25,017 12,6011955 74,216 13,477 25,723 13,2131956 78,513 13,805 26,862 14,0901957 72,595 12,822 26,232 13,8521958 70,965 12,674 23,555 12,9831959 81,582 14,540 22,931 13,2331960 79,036 13,905 25,224 14,374 1,534 3,699 71 9481961 77,335 13,647 25,635 14,930 1,726 4,287 93 1,2561962 79,334 13,953 26,083 14,931 1,763 4,361 79 1,0971963 83,324 14,492 27,232 16,049 1,835 4,607 82 1,1641964 83,019 14,597 30,818 18,037 1,915 4,810 88 1,2531965 73,784 12,782 32,347 18,325 2,058 5,194 93 1,3301966 74,011 12,797 33,727 19,493 2,236 5,604 103 1,4781967 82,124 14,130 33,869 19,991 2,319 5,876 114 1,6651968 85,160 14,516 35,026 20,664 2,336 5,939 97 1,4561969 83,839 14,244 35,237 20,960 2,516 6,484 95 1,4331970 85,817 14,699 35,025 21,505 2,770 7,161 106 1,5671971 94,438 16,006 35,585 21,733 2,779 7,281 112 1,6421972 84,707 14,422 35,779 22,250 2,936 7,823 121 1,7971973 76,795 13,223 33,687 21,089 2,908 7,786 123 1,7881974 81,762 14,331 36,812 22,843 2,900 7,917 127 1,8361975 68,687 11,779 40,911 23,672 2,922 7,966 119 1,7161976 73,784 12,688 42,654 25,667 3,253 8,987 134 1,9501977 77,303 13,248 41,856 24,986 3,334 9,227 128 1,8921978 77,315 13,393 39,552 24,009 3,516 9,883 132 1,9831979 89,099 15,451 33,678 21,262 3,843 10,916 146 2,1821980 96,074 16,617 33,807 21,469 3,929 11,272 159 2,3321981 91,575 15,873 34,953 22,214 4,076 11,906 166 2,5091982 82,190 14,229 35,843 22,366 4,068 12,039 160 2,4591983 87,584 15,199 36,649 23,060 4,133 12,389 165 2,5631984 85,168 14,812 37,582 23,418 4,272 12,999 166 2,5741985 84,492 14,807 36,293 23,557 4,439 13,569 175 2,8001986 79,598 14,063 37,288 24,213 4,643 14,266 197 3,1331987 81,081 14,374 35,647 23,405 4,972 15,502 231 3,7171988 87,795 15,684 35,079 23,424 5,159 16,124 237 3,9231989 88,691 15,813 33,917 22,974 5,499 17,334 252 4,1751990 85,135 15,354 33,243 22,634 5,841 18,555 271 4,5611991 88,169 15,999 32,689 22,800 6,140 19,728 277 4,6521992 94,889 17,234 32,874 22,968 6,425 21,052 281 4,8291993 93,068 17,088 33,324 22,942 6,681 22,178 276 4,8481994 95,697 17,696 34,196 24,278 7,072 23,846 279 4,9921995 96,326 17,849 35,639 25,115 7,371 25,021 281 5,1291996 92,394 17,117 36,584 25,419 7,546 26,336 293 5,4661997 91,960 17,274 36,318 25,384 7,736 27,271 290 5,4781998 101,029 19,010 35,465 25,653 7,838 27,863 273 5,2811999 101,544 19,308 36,150 26,386 8,112 29,741 265 5,2972000 97,976 18,952 35,631 26,777 8,261 30,495 268 5,4022001 97,962 19,160 34,771 26,107 8,406 31,266 268 5,5622002 99,927 19,682 35,000 27,000 8,546 32,240 271 5,7132003 100,931 19,966 34,907 26,238 8,537 32,749 268 5,6502004 103,463 20,529 32,728 24,548 8,752 34,063 254 5,4542005 103,582 20,704 32,388 24,683 8,854 35,365 248 5,5042006 104,737 21,074 33,698 26,152 8,838 35,500 255 5,6822007 109,172 21,963 34,264 26,421 8,903 36,159 265 5,9512008 116,452 23,367 34,365 26,561 8,921 36,906 271 6,2472009 113,618 23,020 33,338 25,965 8,520 35,510 246 5,662
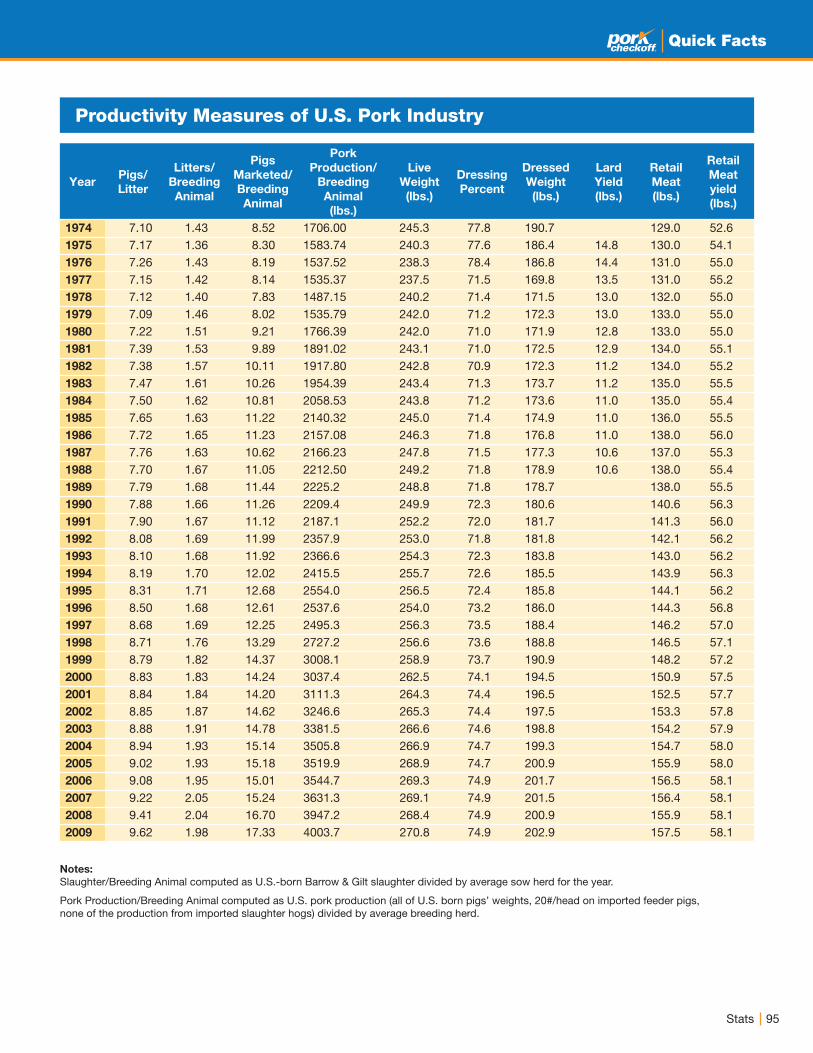
95Stats
Quick Facts
Productivity Measures of U.S. Pork Industry
YearPigs/
Litter
Litters/
Breeding
Animal
Pigs
Marketed/
Breeding
Animal
Pork
Production/
Breeding
Animal
(lbs.)
Live
Weight
(lbs.)
Dressing
Percent
Dressed
Weight
(lbs.)
Lard
Yield
(lbs.)
Retail
Meat
(lbs.)
Retail
Meat
yield
(lbs.)
1974 7.10 1.43 8.52 1706.00 245.3 77.8 190.7 129.0 52.61975 7.17 1.36 8.30 1583.74 240.3 77.6 186.4 14.8 130.0 54.11976 7.26 1.43 8.19 1537.52 238.3 78.4 186.8 14.4 131.0 55.01977 7.15 1.42 8.14 1535.37 237.5 71.5 169.8 13.5 131.0 55.21978 7.12 1.40 7.83 1487.15 240.2 71.4 171.5 13.0 132.0 55.01979 7.09 1.46 8.02 1535.79 242.0 71.2 172.3 13.0 133.0 55.01980 7.22 1.51 9.21 1766.39 242.0 71.0 171.9 12.8 133.0 55.01981 7.39 1.53 9.89 1891.02 243.1 71.0 172.5 12.9 134.0 55.11982 7.38 1.57 10.11 1917.80 242.8 70.9 172.3 11.2 134.0 55.21983 7.47 1.61 10.26 1954.39 243.4 71.3 173.7 11.2 135.0 55.51984 7.50 1.62 10.81 2058.53 243.8 71.2 173.6 11.0 135.0 55.41985 7.65 1.63 11.22 2140.32 245.0 71.4 174.9 11.0 136.0 55.51986 7.72 1.65 11.23 2157.08 246.3 71.8 176.8 11.0 138.0 56.01987 7.76 1.63 10.62 2166.23 247.8 71.5 177.3 10.6 137.0 55.31988 7.70 1.67 11.05 2212.50 249.2 71.8 178.9 10.6 138.0 55.41989 7.79 1.68 11.44 2225.2 248.8 71.8 178.7 138.0 55.51990 7.88 1.66 11.26 2209.4 249.9 72.3 180.6 140.6 56.31991 7.90 1.67 11.12 2187.1 252.2 72.0 181.7 141.3 56.01992 8.08 1.69 11.99 2357.9 253.0 71.8 181.8 142.1 56.21993 8.10 1.68 11.92 2366.6 254.3 72.3 183.8 143.0 56.21994 8.19 1.70 12.02 2415.5 255.7 72.6 185.5 143.9 56.31995 8.31 1.71 12.68 2554.0 256.5 72.4 185.8 144.1 56.21996 8.50 1.68 12.61 2537.6 254.0 73.2 186.0 144.3 56.81997 8.68 1.69 12.25 2495.3 256.3 73.5 188.4 146.2 57.01998 8.71 1.76 13.29 2727.2 256.6 73.6 188.8 146.5 57.11999 8.79 1.82 14.37 3008.1 258.9 73.7 190.9 148.2 57.22000 8.83 1.83 14.24 3037.4 262.5 74.1 194.5 150.9 57.52001 8.84 1.84 14.20 3111.3 264.3 74.4 196.5 152.5 57.72002 8.85 1.87 14.62 3246.6 265.3 74.4 197.5 153.3 57.82003 8.88 1.91 14.78 3381.5 266.6 74.6 198.8 154.2 57.92004 8.94 1.93 15.14 3505.8 266.9 74.7 199.3 154.7 58.02005 9.02 1.93 15.18 3519.9 268.9 74.7 200.9 155.9 58.02006 9.08 1.95 15.01 3544.7 269.3 74.9 201.7 156.5 58.12007 9.22 2.05 15.24 3631.3 269.1 74.9 201.5 156.4 58.12008 9.41 2.04 16.70 3947.2 268.4 74.9 200.9 155.9 58.12009 9.62 1.98 17.33 4003.7 270.8 74.9 202.9 157.5 58.1
Notes:
Slaughter/Breeding Animal computed as U.S.-born Barrow & Gilt slaughter divided by average sow herd for the year.
Pork Production/Breeding Animal computed as U.S. pork production (all of U.S. born pigs’ weights, 20#/head on imported feeder pigs, none of the production from imported slaughter hogs) divided by average breeding herd.
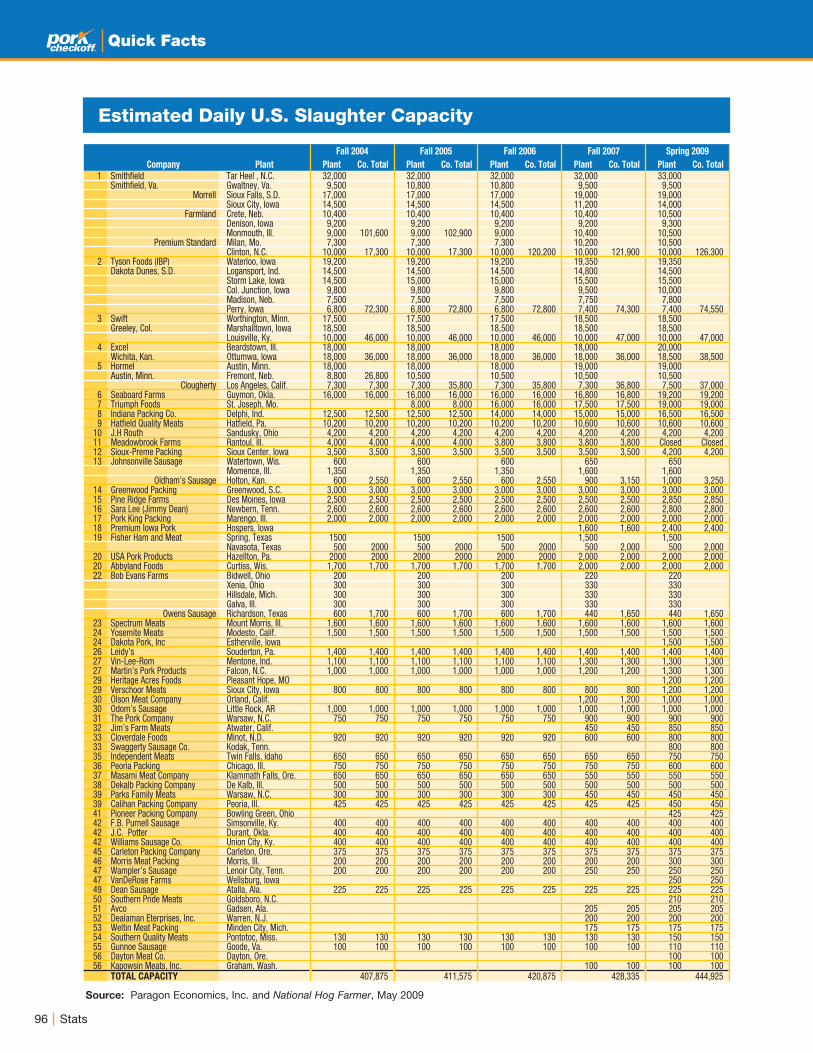
96 Stats
Quick Facts
Estimated Daily U.S. Slaughter Capacity
Source: Paragon Economics, Inc. and National Hog Farmer, May 2009
Fall 2004 Fall 2005 Fall 2006 Fall 2007 Spring 2009
Company Plant Plant Co. Total Plant Co. Total Plant Co. Total Plant Co. Total Plant Co. Total
1 Smithfi eld Tar Heel , N.C. 32,000 32,000 32,000 32,000 33,000Smithfi eld, Va. Gwaltney, Va. 9,500 10,800 10,800 9,500 9,500
Morrell Sioux Falls, S.D. 17,000 17,000 17,000 19,000 19,000 Sioux City, Iowa 14,500 14,500 14,500 11,200 14,000
Farmland Crete, Neb. 10,400 10,400 10,400 10,400 10,500 Denison, Iowa 9,200 9,200 9,200 9,200 9,300 Monmouth, Ill. 9,000 101,600 9,000 102,900 9,000 10,400 10,500
Premium Standard Milan, Mo. 7,300 7,300 7,300 10,200 10,500 Clinton, N.C. 10,000 17,300 10,000 17,300 10,000 120,200 10,000 121,900 10,000 126,300
2 Tyson Foods (IBP) Waterloo, Iowa 19,200 19,200 19,200 19,350 19,350Dakota Dunes, S.D. Logansport, Ind. 14,500 14,500 14,500 14,800 14,500
Storm Lake, Iowa 14,500 15,000 15,000 15,500 15,500 Col. Junction, Iowa 9,800 9,800 9,800 9,500 10,000 Madison, Neb. 7,500 7,500 7,500 7,750 7,800 Perry, Iowa 6,800 72,300 6,800 72,800 6,800 72,800 7,400 74,300 7,400 74,550
3 Swift Worthington, Minn. 17,500 17,500 17,500 18,500 18,500Greeley, Col. Marshalltown, Iowa 18,500 18,500 18,500 18,500 18,500
Louisville, Ky. 10,000 46,000 10,000 46,000 10,000 46,000 10,000 47,000 10,000 47,0004 Excel Beardstown, Ill. 18,000 18,000 18,000 18,000 20,000
Wichita, Kan. Ottumwa, Iowa 18,000 36,000 18,000 36,000 18,000 36,000 18,000 36,000 18,500 38,5005 Hormel Austin, Minn. 18,000 18,000 18,000 19,000 19,000
Austin, Minn. Fremont, Neb. 8,800 26,800 10,500 10,500 10,500 10,500Clougherty Los Angeles, Calif. 7,300 7,300 7,300 35,800 7,300 35,800 7,300 36,800 7,500 37,000
6 Seaboard Farms Guymon, Okla. 16,000 16,000 16,000 16,000 16,000 16,000 16,800 16,800 19,200 19,2007 Triumph Foods St. Joseph, Mo. 8,000 8,000 16,000 16,000 17,500 17,500 19,000 19,0008 Indiana Packing Co. Delphi, Ind. 12,500 12,500 12,500 12,500 14,000 14,000 15,000 15,000 16,500 16,5009 Hatfi eld Quality Meats Hatfi eld, Pa. 10,200 10,200 10,200 10,200 10,200 10,200 10,600 10,600 10,600 10,600
10 J.H Routh Sandusky, Ohio 4,200 4,200 4,200 4,200 4,200 4,200 4,200 4,200 4,200 4,20011 Meadowbrook Farms Rantoul, Ill. 4,000 4,000 4,000 4,000 3,800 3,800 3,800 3,800 Closed Closed12 Sioux-Preme Packing Sioux Center, Iowa 3,500 3,500 3,500 3,500 3,500 3,500 3,500 3,500 4,200 4,20013 Johnsonville Sausage Watertown, Wis. 600 600 600 650 650
Momence, Ill. 1,350 1,350 1,350 1,600 1,600Oldham’s Sausage Holton, Kan. 600 2,550 600 2,550 600 2,550 900 3,150 1,000 3,250
14 Greenwood Packing Greenwood, S.C. 3,000 3,000 3,000 3,000 3,000 3,000 3,000 3,000 3,000 3,00015 Pine Ridge Farms Des Moines, Iowa 2,500 2,500 2,500 2,500 2,500 2,500 2,500 2,500 2,850 2,85016 Sara Lee (Jimmy Dean) Newbern, Tenn. 2,600 2,600 2,600 2,600 2,600 2,600 2,600 2,600 2,800 2,80017 Pork King Packing Marengo, Ill. 2,000 2,000 2,000 2,000 2,000 2,000 2,000 2,000 2,000 2,00018 Premium Iowa Pork Hospers, Iowa 1,600 1,600 2,400 2,40019 Fisher Ham and Meat Spring, Texas 1500 1500 1500 1,500 1,500
Navasota, Texas 500 2000 500 2000 500 2000 500 2,000 500 2,00020 USA Pork Products Hazellton, Pa. 2000 2000 2000 2000 2000 2000 2,000 2,000 2,000 2,00020 Abbyland Foods Curtiss, Wis. 1,700 1,700 1,700 1,700 1,700 1,700 2,000 2,000 2,000 2,00022 Bob Evans Farms Bidwell, Ohio 200 200 200 220 220
Xenia, Ohio 300 300 300 330 330 Hillsdale, Mich. 300 300 300 330 330 Galva, Ill. 300 300 300 330 330
Owens Sausage Richardson, Texas 600 1,700 600 1,700 600 1,700 440 1,650 440 1,65023 Spectrum Meats Mount Morris, Ill. 1,600 1,600 1,600 1,600 1,600 1,600 1,600 1,600 1,600 1,60024 Yosemite Meats Modesto, Calif. 1,500 1,500 1,500 1,500 1,500 1,500 1,500 1,500 1,500 1,50024 Dakota Pork, Inc Estherville, Iowa 1,500 1,50026 Leidy’s Souderton, Pa. 1,400 1,400 1,400 1,400 1,400 1,400 1,400 1,400 1,400 1,40027 Vin-Lee-Rom Mentone, Ind. 1,100 1,100 1,100 1,100 1,100 1,100 1,300 1,300 1,300 1,30027 Martin’s Pork Products Falcon, N.C. 1,000 1,000 1,000 1,000 1,000 1,000 1,200 1,200 1,300 1,30029 Heritage Acres Foods Pleasant Hope, MO 1,200 1,20029 Verschoor Meats Sioux City, Iowa 800 800 800 800 800 800 800 800 1,200 1,20030 Olson Meat Company Orland, Calif. 1,200 1,200 1,000 1,00030 Odom’s Sausage Little Rock, AR 1,000 1,000 1,000 1,000 1,000 1,000 1,000 1,000 1,000 1,00031 The Pork Company Warsaw, N.C. 750 750 750 750 750 750 900 900 900 90032 Jim’s Farm Meats Atwater, Calif. 450 450 850 85033 Cloverdale Foods Minot, N.D. 920 920 920 920 920 920 600 600 800 80033 Swaggerty Sausage Co. Kodak, Tenn. 800 80035 Independent Meats Twin Falls, Idaho 650 650 650 650 650 650 650 650 750 75036 Peoria Packing Chicago, Ill. 750 750 750 750 750 750 750 750 600 60037 Masami Meat Company Klammath Falls, Ore. 650 650 650 650 650 650 550 550 550 55038 Dekalb Packing Company De Kalb, Ill. 500 500 500 500 500 500 500 500 500 50039 Parks Family Meats Warsaw, N.C. 300 300 300 300 300 300 450 450 450 45039 Calihan Packing Company Peoria, Ill. 425 425 425 425 425 425 425 425 450 45041 Pioneer Packing Company Bowling Green, Ohio 425 42542 F.B. Purnell Sausage Simsonville, Ky. 400 400 400 400 400 400 400 400 400 40042 J.C. Potter Durant, Okla. 400 400 400 400 400 400 400 400 400 40042 Williams Sausage Co. Union City, Ky. 400 400 400 400 400 400 400 400 400 40045 Carleton Packing Company Carleton, Ore. 375 375 375 375 375 375 375 375 375 37546 Morris Meat Packing Morris, Ill. 200 200 200 200 200 200 200 200 300 30047 Wampler’s Sausage Lenoir City, Tenn. 200 200 200 200 200 200 250 250 250 25047 VanDeRose Farms Wellsburg, Iowa 250 25049 Dean Sausage Atalla, Ala. 225 225 225 225 225 225 225 225 225 22550 Southern Pride Meats Goldsboro, N.C. 210 21051 Avco Gadsen, Ala. 205 205 205 20552 Dealaman Eterprises, Inc. Warren, N.J. 200 200 200 20053 Weltin Meat Packing Minden City, Mich. 175 175 175 17554 Southern Quality Meats Pontotoc, Miss. 130 130 130 130 130 130 130 130 150 15055 Gunnoe Sausage Goode, Va. 100 100 100 100 100 100 100 100 110 11056 Dayton Meat Co. Dayton, Ore. 100 10056 Kapowsin Meats, Inc. Graham, Wash. 100 100 100 100
TOTAL CAPACITY 407,875 411,575 420,875 428,335 444,925

97Stats
Quick Facts
U.S. Packing Plant Closings — 1993-2009
Estimated Daily U.S. Slaughter Capacity – Sows & Boars
Source: Paragon Economics, Inc.
Company Plant Date Closed Capacity
Swift St. Joseph, Mo. December 1993 10,000 Seaboard Alber Lea, Minn. February 1994 14,000 Thorn Apple Valley Hyrum, Utah 1995 1,500 Reeves Packing Ada, Okla. 1995 400 Worth’ton Pack Worthington, Ind. April 1996 4,700 Premium Pork Moultrie, Ga. April 1996 4,700 Ohio Packing Co. Columbus, Ohio April 1996 900 IBP Council Bluffs, Iowa April 1997 7,300 Dakota Pork Huron, S.D. August 1997 5,850 Thorn Apple Valley Detroit, Mich. July 1998 14,000 Fisher Packing Louisville, Ky. 1998 3,000 Field Packing Owensboro, Ky. July 1999 1,200 AVA Pork Shamokin, Pa. February 2000 2,500 Farmland Dubuque, Iowa June 2000 11,000 Brown Packing Little Rock, Ark. June 2000 600 Fineberg Packing Memphis, Tenn. February 2001 500 Excel Marshall, Mo. July 2001 8,000 Mosby Packing Co. Meridian, Miss. July 2001 400 AMPAC/Iowa Pack Chicago, Ill. December 2001 3,600 Hormel Rochelle, Ill. January 2003 7,100 Metzger Foods Paduca, Ky. March 2003 250 Simeus Foods Forest City, N.C. October 2003 300 America’s Family Farms Alcester, S.D. November 2003 600 RC Pork (Pork Packers Int’l) Downs, Kan. May 2004 1,500 Smithfi eld Foods Smithfi eld, Va. September 2005 7,800 Bryan Foods (Sara Lea) West Point, Miss. March 2006 6,200 Lowell Packing Fitzgerald, Ga. June 2005 350 Meadowbrook Farms Rantoul, Ill. December 2008 3,800
TOTAL CAPACITY 122,050
Fall 2006 Fall 2007 Spring 2009
Rank Company Plant Plant Co. Total Plant Co. Total PlantCo. Total
1 Johnsonville Foods Watertown, Wis. 600 650 650Momence, Ill. 1,350 1,600 1,600
Oldham’s Sausage Holton, Kan. 600 2,550 900 3,150 1,000 3,250 2 Pine Ridge Farms Des Moines, Iowa 2,500 2,500 2,500 2,500 2,850 2,850 3 Jimmy Dean (Sara Lee) Newburn, Tenn. 2,600 2,600 2,600 2,600 2,800 2,800 4 Pork King Packing Marengo, Ill. 2,000 2,000 2,000 2,000 2,000 2,000 4 USA Pork Products* Hazellton, Pa. 2,000 2,000 2,000 2,000 2,000 2,000 4 Abbyland Foods Curtiss, Wis. 1,700 1,700 2,000 2,000 2,000 2,000 7 Bob Evans Farms Bidwell, Ohio 200 220 220
Xenia, Ohio 300 330 330Hillsdale, Mich. 300 330 330Galva, Ill. 300 330 330
Owens Sausage Richardson, Texas 600 1,700 440 1,650 440 1,650 8 Odom’s Sausage Little Rock, Ark. 1,000 1,000 1,000 1,000 1,000 1,000 9 Calihan Packing Company Peoria, Ill. 425 425 425 425 450 450 10 Pioneer Packing Company Bowling Green, Ohio 425 425 11 F.B. Purnell Sausage Simsonville, Ky. 400 400 400 400 400 400 11 J.C. Potter Sausage Durant, Okla. 400 400 400 400 400 400 11 Williams Sausage Company Union City, Ky. 400 400 400 400 400 400 14 Swaggerty Sausage Co Kodak, Tenn. 300 300 15 Dean Sausage Atalla, Ala. 225 225 250 250 250 250 16 Wampler’s Sausage Lenoir City, Tenn. 200 200 225 225 225 225 17 Southern Pride Meats Goldsboro, N.C. 210 210 18 Avco Gadsen, Ala. 205 205 205 205 205 205 19 Gunnoe Sausage Goode, Va. 100 100 100 100 110 110
TOTAL 18,405 19,305 20,925
* USA Pork Products handles 80 percent boars, 20 percent butcher hogs
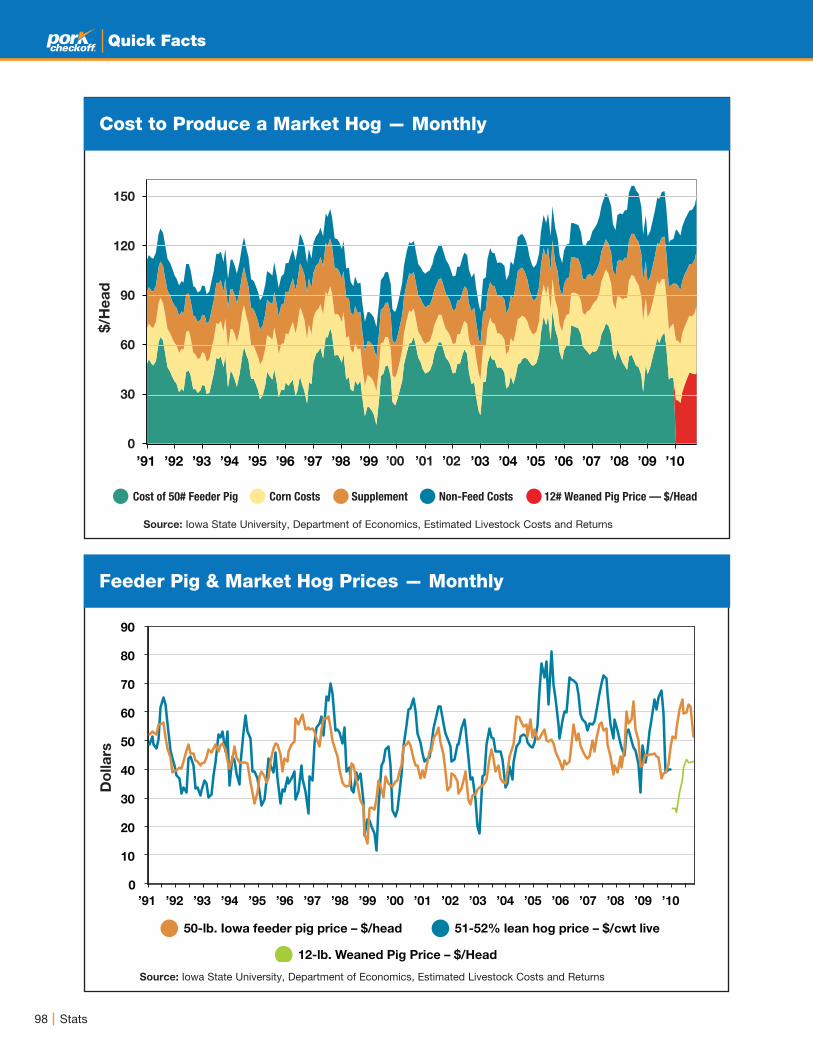
98 Stats
Quick Facts
Cost to Produce a Market Hog — Monthly
Feeder Pig & Market Hog Prices — Monthly
Source: Iowa State University, Department of Economics, Estimated Livestock Costs and Returns
Source: Iowa State University, Department of Economics, Estimated Livestock Costs and Returns
Do
lla
rs
Cost of 50# Feeder Pig Corn Costs Supplement Non-Feed Costs 12# Weaned Pig Price — $/Head
’91 ’92 ’93 ’94 ’95 ’96 ’97 ’98 ’99 ’00 ’01 ’02 ’03 ’04 ’05 ’06 ’07 ’08 ’09 ’10
50-lb. Iowa feeder pig price – $/head 51-52% lean hog price – $/cwt live
12-lb. Weaned Pig Price – $/Head
0
10
20
30
40
50
60
70
80
90
$/H
ea
d
150
120
90
60
30
0
’91 ’92 ’93 ’94 ’95 ’96 ’97 ’98 ’99 ’03 ’04 ’05 ’06 ’07 ’08 ’09 ’10
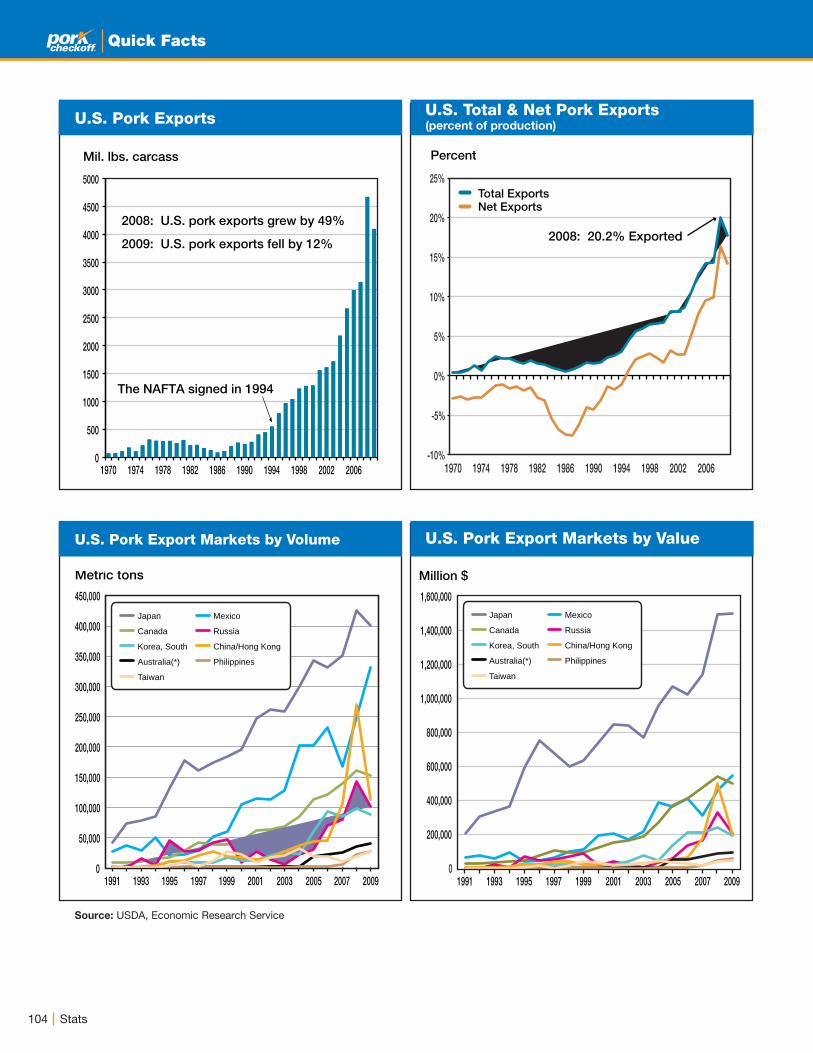
104 Stats
Quick Facts
Mil. lbs. carcass
0
500
1000
1500
2000
2500
3000
3500
4000
4500
5000
1970 1974 1978 1982 1986 1990 1994 1998 2002 2006
The NAFTA signed in 1994
2008: U.S. pork exports grew by 49%
2009: U.S. pork exports fell by 12%
Percent
Total Exports Net Exports
2008: 20.2% Exported
-10%
-5%
0%
5%
10%
15%
20%
25%
1970 1974 1978 1982 1986 1990 1994 1998 2002 2006
Metric tons
0
50,000
100,000
150,000
200,000
250,000
300,000
350,000
400,000
450,000
Japan Mexico
Canada Russia
Korea, South China/Hong Kong
Australia(*) Philippines
Taiwan
1991 1993 1995 1997 1999 2001 2003 2005 2007 2009
Million $
0
200,000
400,000
600,000
800,000
1,000,000
1,200,000
1,400,000
1,600,000 Japan Mexico
Canada Russia
Korea, South China/Hong Kong
Australia(*) Philippines
Taiwan
1991 1993 1995 1997 1999 2001 2003 2005 2007 2009
U.S. Pork Exports
U.S. Pork Export Markets by Volume U.S. Pork Export Markets by Value
U.S. Total & Net Pork Exports (percent of production)
Source: USDA, Economic Research Service

99Stats
Quick Facts
Hog-Corn Price Ratio
The hog-corn price ratio is a time-honored measure of pork production profitability, and, as such, is a good predictor of future production levels. The reason it works is that feed represents 65 to 70 percent of the cost of producing a pig while corn, or a close substitute, such as grain sorghum or barley, makes up about 60 percent of total feed costs.
The hog-corn price ratio is simply the ratio of the market hog price in dollars per 100 pounds (cwt.) to the price of corn in dollars per bushel. So if hogs are selling for $50 per cwt. and corn costs $2.50 per bushel, the hog-corn price ratio is 20.
History tells us that a hog-corn price ratio of 20 or greater suggests that pork production will exceed year-earlier levels 12 to 18 months later. Conversely, a hog-corn price ratio of 16 or less suggests that pork production will fall below year-earlier levels in about 12 to 18 months.
This lead-lag relationship was once a function of grain producers’ decisions on whether to sell corn or feed it to livestock. In this age of specialized production, many pork producers do not raise their own grain. However, the potential profitability indicated by the hog-corn price ratio is still a good indicator of the incentives that the marketplace provides producers to either expand or contract production.
Hog-Corn Price Ratio and Pork Production
Hog-Corn Price Ratio
Ratio
40
35
30
25
20
15
10
5
Hog Corn Ratio 8-week average of production change, no lag
Hog Corn Ratio
-15%
-10%
-5%
0%
5%
10%
15%
20%
5
10
15
20
25
30
35
40
’91
’91
’92
’92
’93
’93
’94
’94
’95
’95
’96
’96
’97
’97
’98
’98
’99
’99
’00
’00
’01
’01
’02
’02
’03
’03
’04
’04
’05
’05
’06
’06
’07
’07
’08
’08
’09
’09
’10
’10
Ratio Percent Change
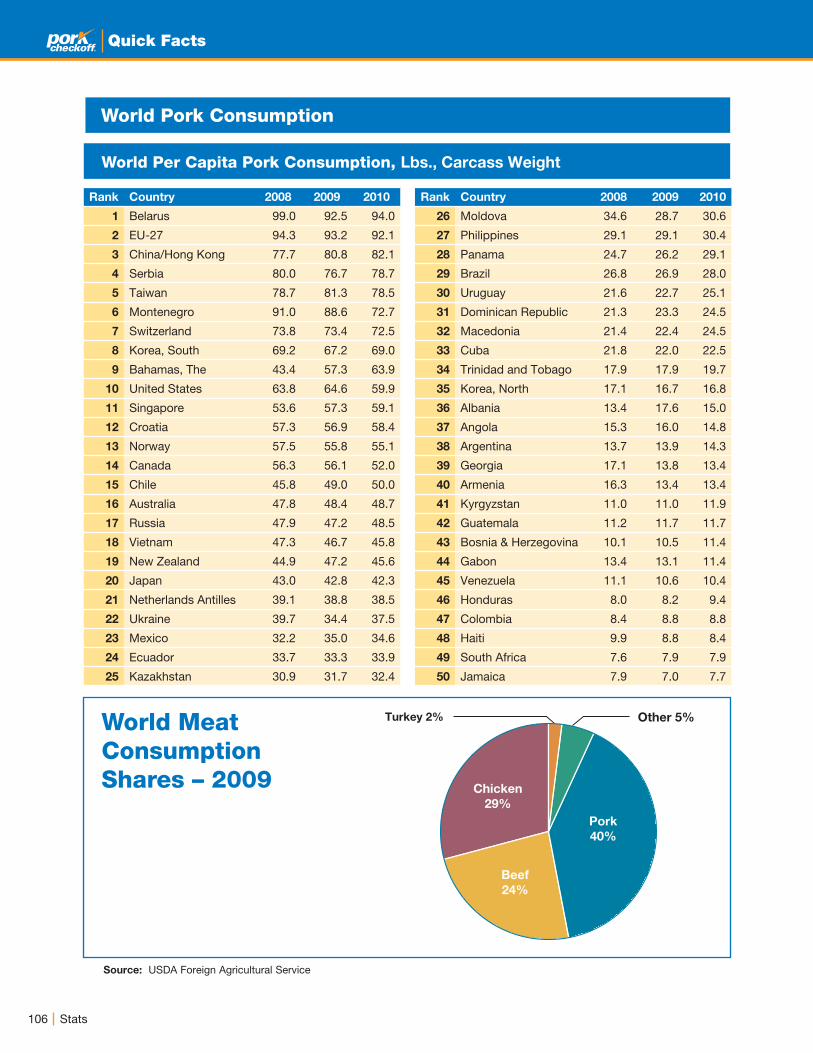
106 Stats
Quick Facts
World Pork Consumption
Rank Country 2008 2009 2010
1 Belarus 99.0 92.5 94.0
2 EU-27 94.3 93.2 92.1
3 China/Hong Kong 77.7 80.8 82.1
4 Serbia 80.0 76.7 78.7
5 Taiwan 78.7 81.3 78.5
6 Montenegro 91.0 88.6 72.7
7 Switzerland 73.8 73.4 72.5
8 Korea, South 69.2 67.2 69.0
9 Bahamas, The 43.4 57.3 63.9
10 United States 63.8 64.6 59.9
11 Singapore 53.6 57.3 59.1
12 Croatia 57.3 56.9 58.4
13 Norway 57.5 55.8 55.1
14 Canada 56.3 56.1 52.0
15 Chile 45.8 49.0 50.0
16 Australia 47.8 48.4 48.7
17 Russia 47.9 47.2 48.5
18 Vietnam 47.3 46.7 45.8
19 New Zealand 44.9 47.2 45.6
20 Japan 43.0 42.8 42.3
21 Netherlands Antilles 39.1 38.8 38.5
22 Ukraine 39.7 34.4 37.5
23 Mexico 32.2 35.0 34.6
24 Ecuador 33.7 33.3 33.9
25 Kazakhstan 30.9 31.7 32.4
Rank Country 2008 2009 2010
26 Moldova 34.6 28.7 30.6
27 Philippines 29.1 29.1 30.4
28 Panama 24.7 26.2 29.1
29 Brazil 26.8 26.9 28.0
30 Uruguay 21.6 22.7 25.1
31 Dominican Republic 21.3 23.3 24.5
32 Macedonia 21.4 22.4 24.5
33 Cuba 21.8 22.0 22.5
34 Trinidad and Tobago 17.9 17.9 19.7
35 Korea, North 17.1 16.7 16.8
36 Albania 13.4 17.6 15.0
37 Angola 15.3 16.0 14.8
38 Argentina 13.7 13.9 14.3
39 Georgia 17.1 13.8 13.4
40 Armenia 16.3 13.4 13.4
41 Kyrgyzstan 11.0 11.0 11.9
42 Guatemala 11.2 11.7 11.7
43 Bosnia & Herzegovina 10.1 10.5 11.4
44 Gabon 13.4 13.1 11.4
45 Venezuela 11.1 10.6 10.4
46 Honduras 8.0 8.2 9.4
47 Colombia 8.4 8.8 8.8
48 Haiti 9.9 8.8 8.4
49 South Africa 7.6 7.9 7.9
50 Jamaica 7.9 7.0 7.7
World Per Capita Pork Consumption, Lbs., Carcass Weight
Source: USDA Foreign Agricultural Service
Pork
40%
Other 5%Turkey 2%
Beef
24%
Chicken
29%
World Meat Consumption Shares – 2009
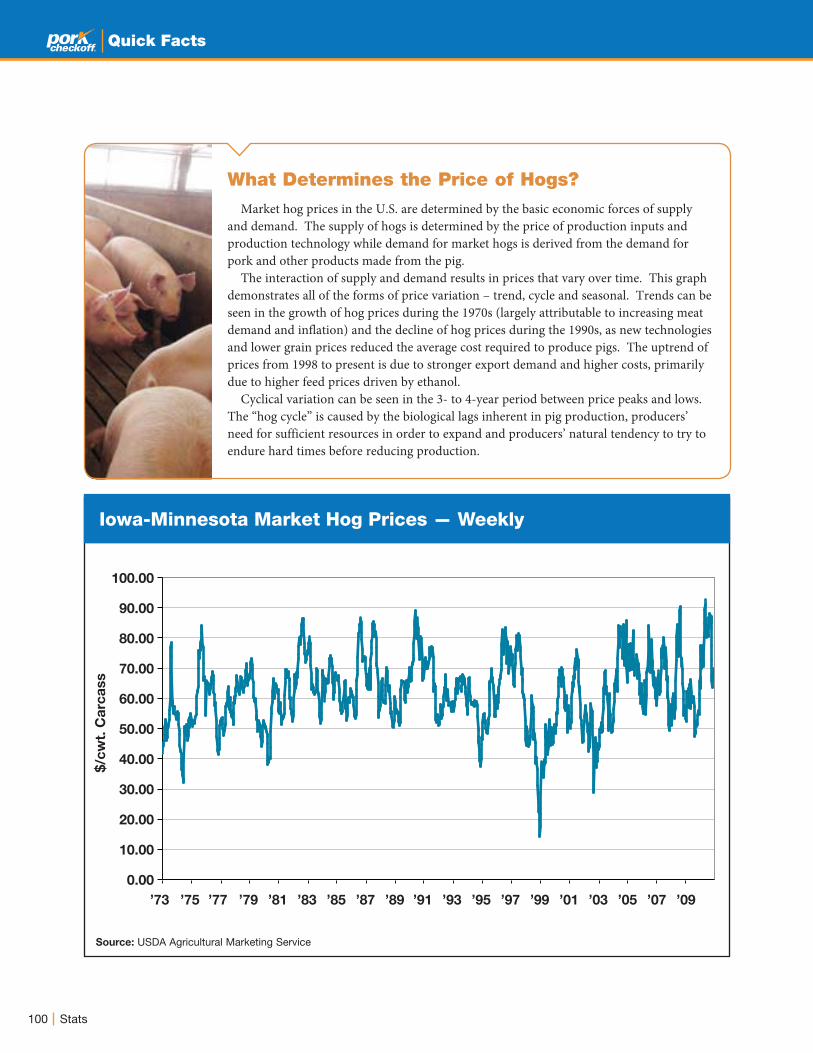
100 Stats
Quick Facts
Iowa-Minnesota Market Hog Prices — Weekly
What Determines the Price of Hogs?
Market hog prices in the U.S. are determined by the basic economic forces of supply and demand. The supply of hogs is determined by the price of production inputs and production technology while demand for market hogs is derived from the demand for pork and other products made from the pig.
The interaction of supply and demand results in prices that vary over time. This graph demonstrates all of the forms of price variation – trend, cycle and seasonal. Trends can be seen in the growth of hog prices during the 1970s (largely attributable to increasing meat demand and inflation) and the decline of hog prices during the 1990s, as new technologies and lower grain prices reduced the average cost required to produce pigs. The uptrend of prices from 1998 to present is due to stronger export demand and higher costs, primarily due to higher feed prices driven by ethanol.
Cyclical variation can be seen in the 3- to 4-year period between price peaks and lows. The “hog cycle” is caused by the biological lags inherent in pig production, producers’ need for sufficient resources in order to expand and producers’ natural tendency to try to endure hard times before reducing production.
Source: USDA Agricultural Marketing Service
$/c
wt.
Ca
rca
ss
’73 ’75 ’77 ’79 ’81 ’83 ’85 ’87 ’89 ’91 ’93 ’95 ’97 ’99 ’01 ’03 ’05 ’07 ’09
100.00
90.00
80.00
70.00
60.00
50.00
40.00
30.00
20.00
10.00
0.00
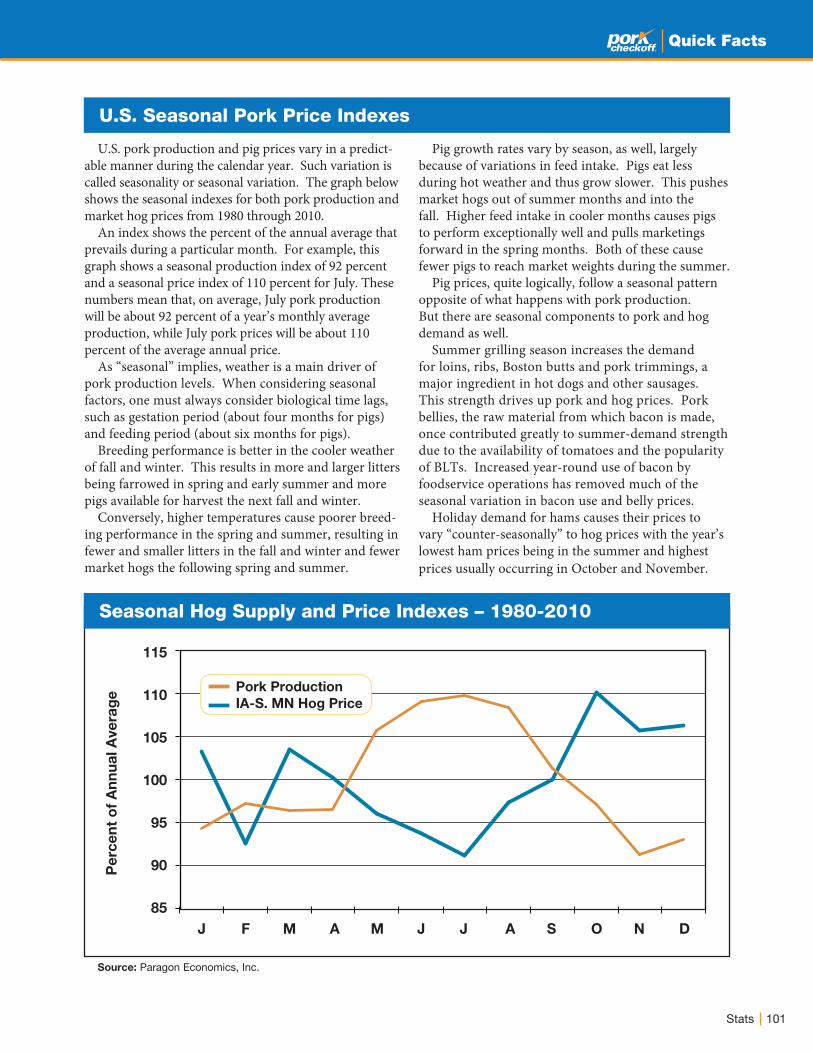
101Stats
Quick Facts
U.S. Seasonal Pork Price Indexes
Seasonal Hog Supply and Price Indexes – 1980-2010
U.S. pork production and pig prices vary in a predict-able manner during the calendar year. Such variation is called seasonality or seasonal variation. The graph below shows the seasonal indexes for both pork production and market hog prices from 1980 through 2010.
An index shows the percent of the annual average that prevails during a particular month. For example, this graph shows a seasonal production index of 92 percent and a seasonal price index of 110 percent for July. These numbers mean that, on average, July pork production will be about 92 percent of a year’s monthly average production, while July pork prices will be about 110 percent of the average annual price.
As “seasonal” implies, weather is a main driver of pork production levels. When considering seasonal factors, one must always consider biological time lags, such as gestation period (about four months for pigs) and feeding period (about six months for pigs).
Breeding performance is better in the cooler weather of fall and winter. This results in more and larger litters being farrowed in spring and early summer and more pigs available for harvest the next fall and winter.
Conversely, higher temperatures cause poorer breed-ing performance in the spring and summer, resulting in fewer and smaller litters in the fall and winter and fewer market hogs the following spring and summer.
Source: Paragon Economics, Inc.
Pig growth rates vary by season, as well, largely because of variations in feed intake. Pigs eat less during hot weather and thus grow slower. This pushes market hogs out of summer months and into the fall. Higher feed intake in cooler months causes pigs to perform exceptionally well and pulls marketings forward in the spring months. Both of these cause fewer pigs to reach market weights during the summer.
Pig prices, quite logically, follow a seasonal pattern opposite of what happens with pork production. But there are seasonal components to pork and hog demand as well.
Summer grilling season increases the demand for loins, ribs, Boston butts and pork trimmings, a major ingredient in hot dogs and other sausages. This strength drives up pork and hog prices. Pork bellies, the raw material from which bacon is made, once contributed greatly to summer-demand strength due to the availability of tomatoes and the popularity of BLTs. Increased year-round use of bacon by foodservice operations has removed much of the seasonal variation in bacon use and belly prices.
Holiday demand for hams causes their prices to vary “counter-seasonally” to hog prices with the year’s lowest ham prices being in the summer and highest prices usually occurring in October and November.
Pe
rce
nt
of
An
nu
al A
ve
rag
e
J F M A M J J A S O N D
115
110
105
100
95
90
85
Pork Production
IA-S. MN Hog Price
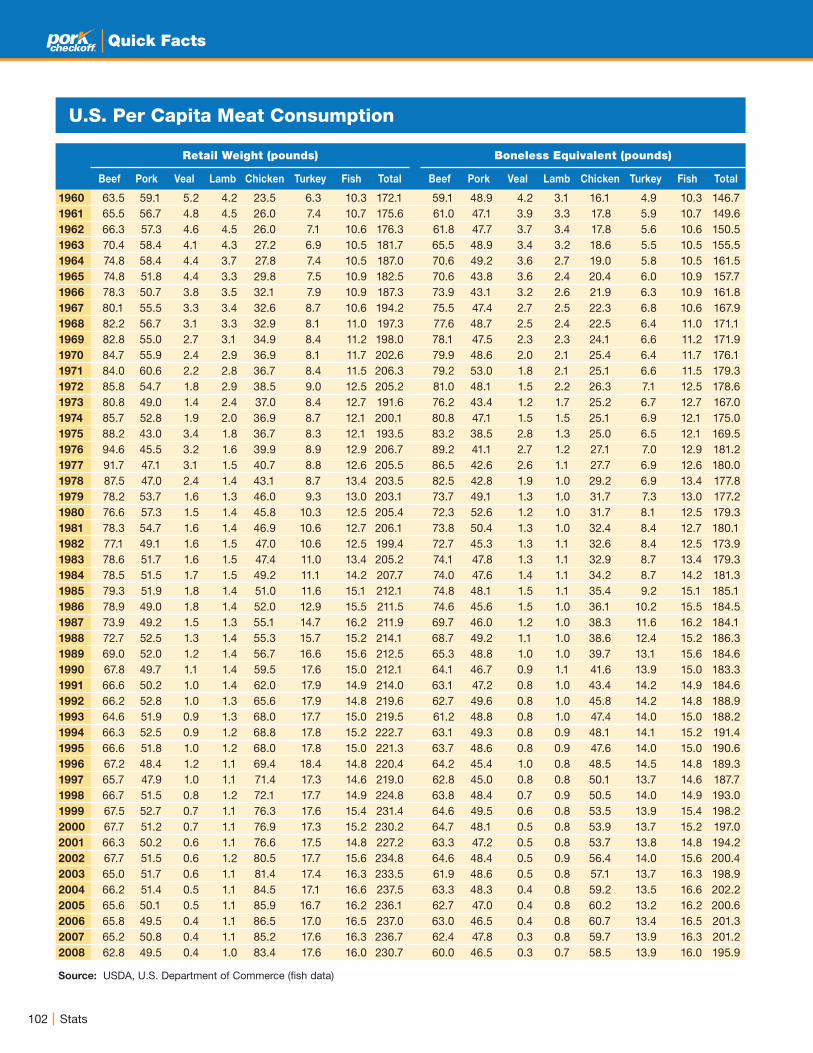
102 Stats
Quick Facts
U.S. Per Capita Meat Consumption
Retail Weight (pounds) Boneless Equivalent (pounds)
Beef Pork Veal Lamb Chicken Turkey Fish Total Beef Pork Veal Lamb Chicken Turkey Fish Total
1960 63.5 59.1 5.2 4.2 23.5 6.3 10.3 172.1 59.1 48.9 4.2 3.1 16.1 4.9 10.3 146.71961 65.5 56.7 4.8 4.5 26.0 7.4 10.7 175.6 61.0 47.1 3.9 3.3 17.8 5.9 10.7 149.61962 66.3 57.3 4.6 4.5 26.0 7.1 10.6 176.3 61.8 47.7 3.7 3.4 17.8 5.6 10.6 150.51963 70.4 58.4 4.1 4.3 27.2 6.9 10.5 181.7 65.5 48.9 3.4 3.2 18.6 5.5 10.5 155.51964 74.8 58.4 4.4 3.7 27.8 7.4 10.5 187.0 70.6 49.2 3.6 2.7 19.0 5.8 10.5 161.51965 74.8 51.8 4.4 3.3 29.8 7.5 10.9 182.5 70.6 43.8 3.6 2.4 20.4 6.0 10.9 157.71966 78.3 50.7 3.8 3.5 32.1 7.9 10.9 187.3 73.9 43.1 3.2 2.6 21.9 6.3 10.9 161.81967 80.1 55.5 3.3 3.4 32.6 8.7 10.6 194.2 75.5 47.4 2.7 2.5 22.3 6.8 10.6 167.91968 82.2 56.7 3.1 3.3 32.9 8.1 11.0 197.3 77.6 48.7 2.5 2.4 22.5 6.4 11.0 171.11969 82.8 55.0 2.7 3.1 34.9 8.4 11.2 198.0 78.1 47.5 2.3 2.3 24.1 6.6 11.2 171.91970 84.7 55.9 2.4 2.9 36.9 8.1 11.7 202.6 79.9 48.6 2.0 2.1 25.4 6.4 11.7 176.11971 84.0 60.6 2.2 2.8 36.7 8.4 11.5 206.3 79.2 53.0 1.8 2.1 25.1 6.6 11.5 179.31972 85.8 54.7 1.8 2.9 38.5 9.0 12.5 205.2 81.0 48.1 1.5 2.2 26.3 7.1 12.5 178.61973 80.8 49.0 1.4 2.4 37.0 8.4 12.7 191.6 76.2 43.4 1.2 1.7 25.2 6.7 12.7 167.01974 85.7 52.8 1.9 2.0 36.9 8.7 12.1 200.1 80.8 47.1 1.5 1.5 25.1 6.9 12.1 175.01975 88.2 43.0 3.4 1.8 36.7 8.3 12.1 193.5 83.2 38.5 2.8 1.3 25.0 6.5 12.1 169.51976 94.6 45.5 3.2 1.6 39.9 8.9 12.9 206.7 89.2 41.1 2.7 1.2 27.1 7.0 12.9 181.21977 91.7 47.1 3.1 1.5 40.7 8.8 12.6 205.5 86.5 42.6 2.6 1.1 27.7 6.9 12.6 180.01978 87.5 47.0 2.4 1.4 43.1 8.7 13.4 203.5 82.5 42.8 1.9 1.0 29.2 6.9 13.4 177.81979 78.2 53.7 1.6 1.3 46.0 9.3 13.0 203.1 73.7 49.1 1.3 1.0 31.7 7.3 13.0 177.21980 76.6 57.3 1.5 1.4 45.8 10.3 12.5 205.4 72.3 52.6 1.2 1.0 31.7 8.1 12.5 179.31981 78.3 54.7 1.6 1.4 46.9 10.6 12.7 206.1 73.8 50.4 1.3 1.0 32.4 8.4 12.7 180.11982 77.1 49.1 1.6 1.5 47.0 10.6 12.5 199.4 72.7 45.3 1.3 1.1 32.6 8.4 12.5 173.91983 78.6 51.7 1.6 1.5 47.4 11.0 13.4 205.2 74.1 47.8 1.3 1.1 32.9 8.7 13.4 179.31984 78.5 51.5 1.7 1.5 49.2 11.1 14.2 207.7 74.0 47.6 1.4 1.1 34.2 8.7 14.2 181.31985 79.3 51.9 1.8 1.4 51.0 11.6 15.1 212.1 74.8 48.1 1.5 1.1 35.4 9.2 15.1 185.11986 78.9 49.0 1.8 1.4 52.0 12.9 15.5 211.5 74.6 45.6 1.5 1.0 36.1 10.2 15.5 184.51987 73.9 49.2 1.5 1.3 55.1 14.7 16.2 211.9 69.7 46.0 1.2 1.0 38.3 11.6 16.2 184.11988 72.7 52.5 1.3 1.4 55.3 15.7 15.2 214.1 68.7 49.2 1.1 1.0 38.6 12.4 15.2 186.31989 69.0 52.0 1.2 1.4 56.7 16.6 15.6 212.5 65.3 48.8 1.0 1.0 39.7 13.1 15.6 184.61990 67.8 49.7 1.1 1.4 59.5 17.6 15.0 212.1 64.1 46.7 0.9 1.1 41.6 13.9 15.0 183.31991 66.6 50.2 1.0 1.4 62.0 17.9 14.9 214.0 63.1 47.2 0.8 1.0 43.4 14.2 14.9 184.61992 66.2 52.8 1.0 1.3 65.6 17.9 14.8 219.6 62.7 49.6 0.8 1.0 45.8 14.2 14.8 188.91993 64.6 51.9 0.9 1.3 68.0 17.7 15.0 219.5 61.2 48.8 0.8 1.0 47.4 14.0 15.0 188.21994 66.3 52.5 0.9 1.2 68.8 17.8 15.2 222.7 63.1 49.3 0.8 0.9 48.1 14.1 15.2 191.41995 66.6 51.8 1.0 1.2 68.0 17.8 15.0 221.3 63.7 48.6 0.8 0.9 47.6 14.0 15.0 190.61996 67.2 48.4 1.2 1.1 69.4 18.4 14.8 220.4 64.2 45.4 1.0 0.8 48.5 14.5 14.8 189.31997 65.7 47.9 1.0 1.1 71.4 17.3 14.6 219.0 62.8 45.0 0.8 0.8 50.1 13.7 14.6 187.71998 66.7 51.5 0.8 1.2 72.1 17.7 14.9 224.8 63.8 48.4 0.7 0.9 50.5 14.0 14.9 193.01999 67.5 52.7 0.7 1.1 76.3 17.6 15.4 231.4 64.6 49.5 0.6 0.8 53.5 13.9 15.4 198.22000 67.7 51.2 0.7 1.1 76.9 17.3 15.2 230.2 64.7 48.1 0.5 0.8 53.9 13.7 15.2 197.02001 66.3 50.2 0.6 1.1 76.6 17.5 14.8 227.2 63.3 47.2 0.5 0.8 53.7 13.8 14.8 194.22002 67.7 51.5 0.6 1.2 80.5 17.7 15.6 234.8 64.6 48.4 0.5 0.9 56.4 14.0 15.6 200.42003 65.0 51.7 0.6 1.1 81.4 17.4 16.3 233.5 61.9 48.6 0.5 0.8 57.1 13.7 16.3 198.92004 66.2 51.4 0.5 1.1 84.5 17.1 16.6 237.5 63.3 48.3 0.4 0.8 59.2 13.5 16.6 202.22005 65.6 50.1 0.5 1.1 85.9 16.7 16.2 236.1 62.7 47.0 0.4 0.8 60.2 13.2 16.2 200.62006 65.8 49.5 0.4 1.1 86.5 17.0 16.5 237.0 63.0 46.5 0.4 0.8 60.7 13.4 16.5 201.32007 65.2 50.8 0.4 1.1 85.2 17.6 16.3 236.7 62.4 47.8 0.3 0.8 59.7 13.9 16.3 201.22008 62.8 49.5 0.4 1.0 83.4 17.6 16.0 230.7 60.0 46.5 0.3 0.7 58.5 13.9 16.0 195.9
Source: USDA, U.S. Department of Commerce (fish data)
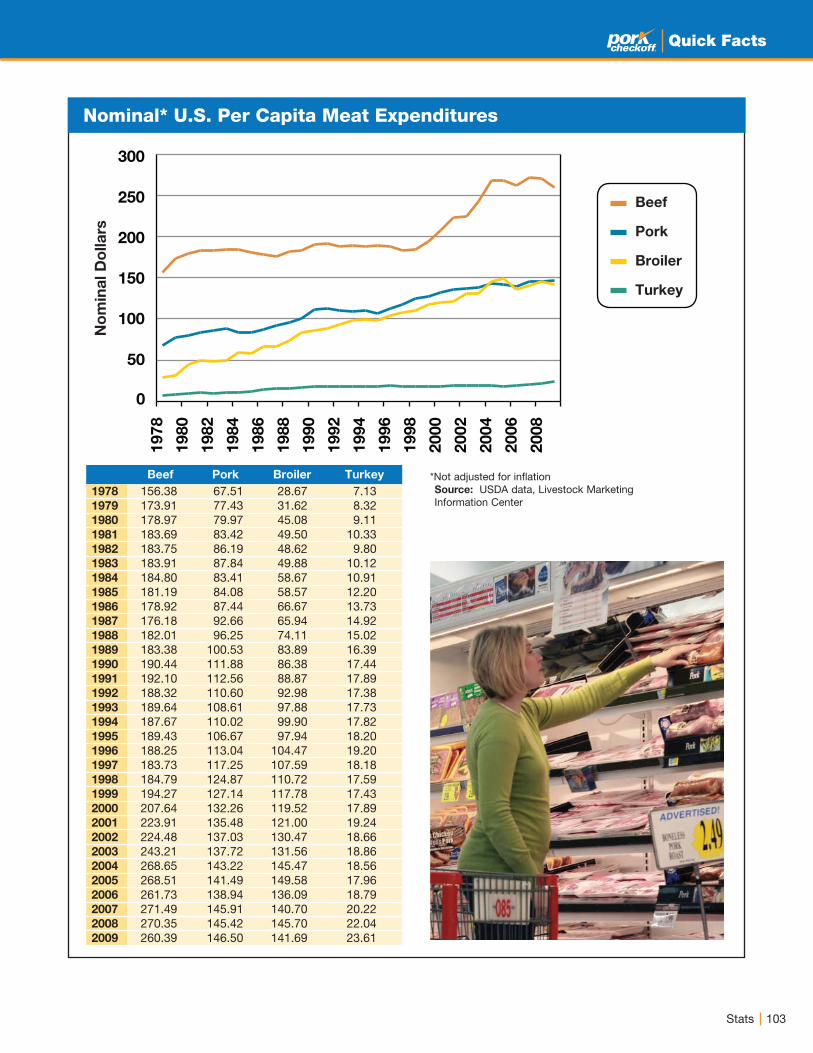
103Stats
Quick Facts
Nominal* U.S. Per Capita Meat ExpendituresN
om
ina
l D
olla
rs
1978
1980
1982
1984
1986
1988
1990
1992
1994
1996
1998
2000
2002
2004
2006
2008
0
50
100
150
200
250
300
Beef
Pork
Broiler
Turkey
*Not adjusted for inflationSource: USDA data, Livestock Marketing Information Center
Beef Pork Broiler Turkey
1978 156.38 67.51 28.67 7.131979 173.91 77.43 31.62 8.321980 178.97 79.97 45.08 9.111981 183.69 83.42 49.50 10.331982 183.75 86.19 48.62 9.801983 183.91 87.84 49.88 10.121984 184.80 83.41 58.67 10.911985 181.19 84.08 58.57 12.201986 178.92 87.44 66.67 13.731987 176.18 92.66 65.94 14.921988 182.01 96.25 74.11 15.021989 183.38 100.53 83.89 16.391990 190.44 111.88 86.38 17.441991 192.10 112.56 88.87 17.891992 188.32 110.60 92.98 17.381993 189.64 108.61 97.88 17.731994 187.67 110.02 99.90 17.821995 189.43 106.67 97.94 18.201996 188.25 113.04 104.47 19.201997 183.73 117.25 107.59 18.181998 184.79 124.87 110.72 17.591999 194.27 127.14 117.78 17.432000 207.64 132.26 119.52 17.892001 223.91 135.48 121.00 19.242002 224.48 137.03 130.47 18.662003 243.21 137.72 131.56 18.862004 268.65 143.22 145.47 18.562005 268.51 141.49 149.58 17.962006 261.73 138.94 136.09 18.792007 271.49 145.91 140.70 20.222008 270.35 145.42 145.70 22.042009 260.39 146.50 141.69 23.61

104 Stats
Quick Facts
Mil. lbs. carcass
0
500
1000
1500
2000
2500
3000
3500
4000
4500
5000
1970 1974 1978 1982 1986 1990 1994 1998 2002 2006
The NAFTA signed in 1994
2008: U.S. pork exports grew by 49%
2009: U.S. pork exports fell by 12%
Percent
Total Exports Net Exports
2008: 20.2% Exported
-10%
-5%
0%
5%
10%
15%
20%
25%
1970 1974 1978 1982 1986 1990 1994 1998 2002 2006
Metric tons
0
50,000
100,000
150,000
200,000
250,000
300,000
350,000
400,000
450,000
Japan Mexico
Canada Russia
Korea, South China/Hong Kong
Australia(*) Philippines
Taiwan
1991 1993 1995 1997 1999 2001 2003 2005 2007 2009
Million $
0
200,000
400,000
600,000
800,000
1,000,000
1,200,000
1,400,000
1,600,000 Japan Mexico
Canada Russia
Korea, South China/Hong Kong
Australia(*) Philippines
Taiwan
1991 1993 1995 1997 1999 2001 2003 2005 2007 2009
U.S. Pork Exports
U.S. Pork Export Markets by Volume U.S. Pork Export Markets by Value
U.S. Total & Net Pork Exports (as a Percent of Production)
Source: USDA, Economic Research Service
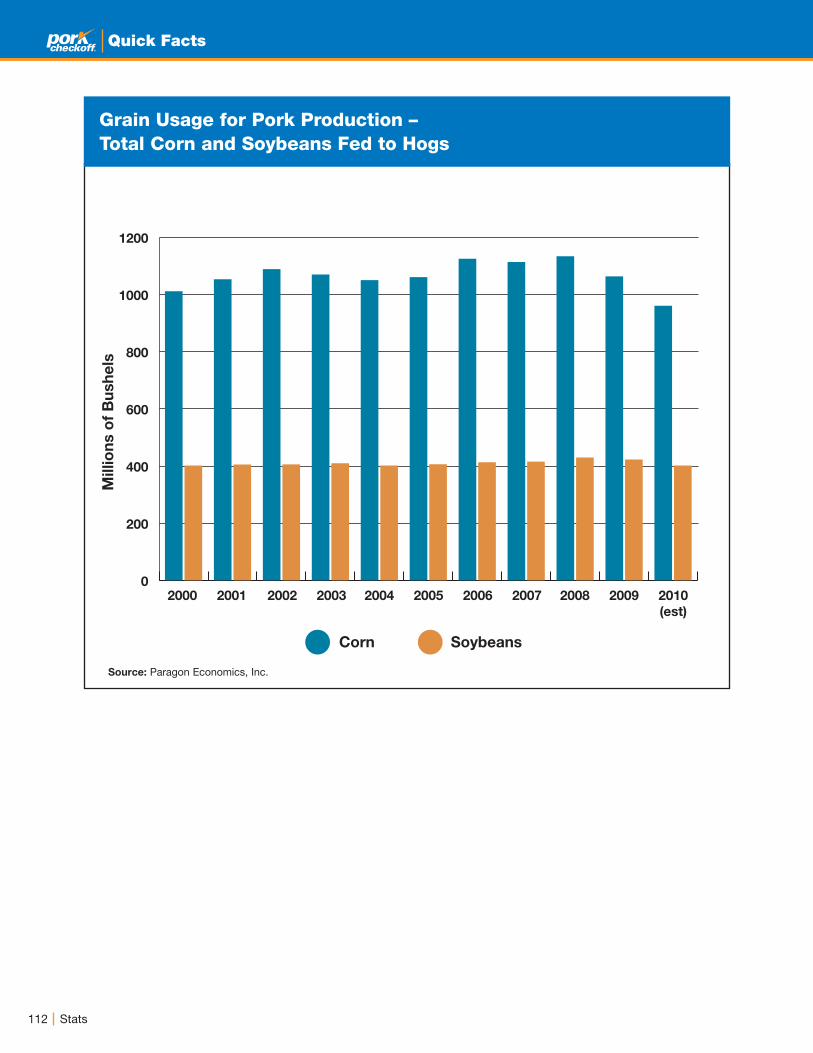
112 Stats
Quick Facts
Grain Usage for Pork Production – Total Corn and Soybeans Fed to Hogs
Source: Paragon Economics, Inc.
Millio
ns o
f B
ush
els
Corn Soybeans
1200
1000
800
600
400
200
0 2000 2001 2002 2003 2004 2005 2006 2007 2008 2009 2010
(est)

104 Stats
Quick Facts
Mil. lbs. carcass
0
500
1000
1500
2000
2500
3000
3500
4000
4500
5000
1970 1974 1978 1982 1986 1990 1994 1998 2002 2006
The NAFTA signed in 1994
2008: U.S. pork exports grew by 49%
2009: U.S. pork exports fell by 12%
Percent
Total Exports Net Exports
2008: 20.2% Exported
-10%
-5%
0%
5%
10%
15%
20%
25%
1970 1974 1978 1982 1986 1990 1994 1998 2002 2006
Metric tons
0
50,000
100,000
150,000
200,000
250,000
300,000
350,000
400,000
450,000
Japan Mexico
Canada Russia
Korea, South China/Hong Kong
Australia(*) Philippines
Taiwan
1991 1993 1995 1997 1999 2001 2003 2005 2007 2009
Million $
0
200,000
400,000
600,000
800,000
1,000,000
1,200,000
1,400,000
1,600,000 Japan Mexico
Canada Russia
Korea, South China/Hong Kong
Australia(*) Philippines
Taiwan
1991 1993 1995 1997 1999 2001 2003 2005 2007 2009
U.S. Pork Exports
U.S. Pork Export Markets by Volume U.S. Pork Export Markets by Value
U.S. Total & Net Pork Exports (as a Percent of Production)
Source: USDA, Economic Research Service
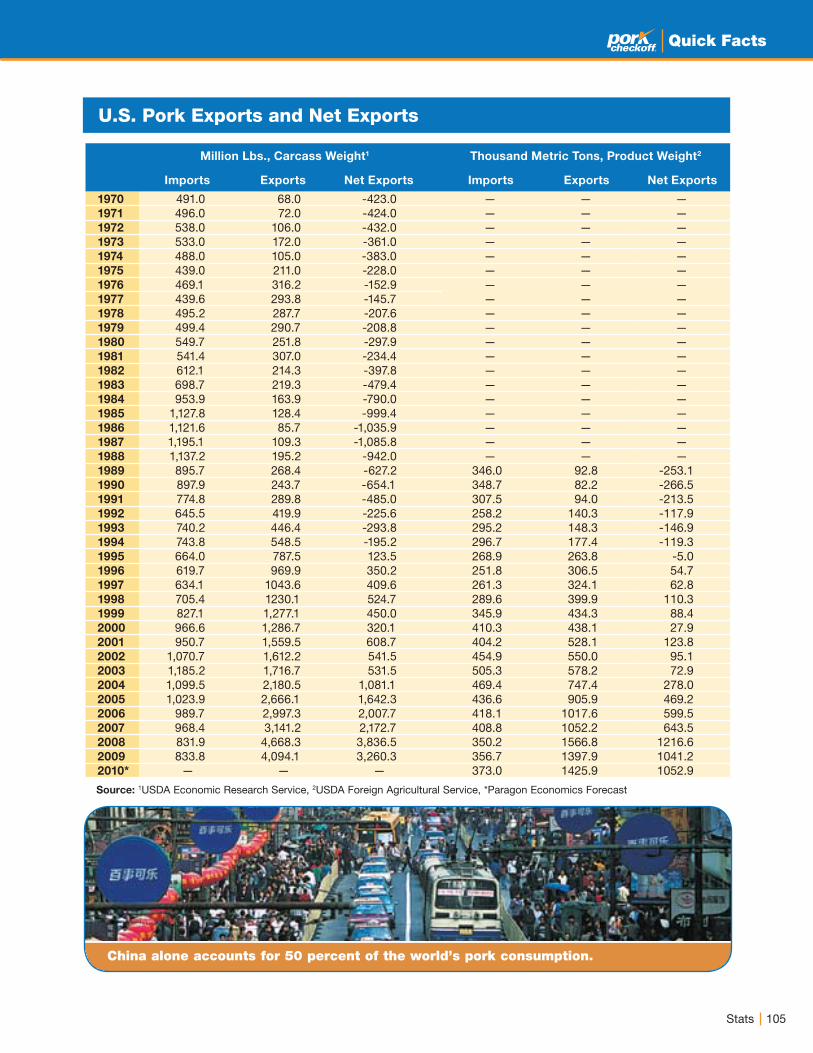
105Stats
Quick Facts
U.S. Pork Exports and Net Exports
China alone accounts for 50 percent of the world’s pork consumption.
Million Lbs., Carcass Weight1 Thousand Metric Tons, Product Weight2
Imports Exports Net Exports Imports Exports Net Exports
1970 491.0 68.0 -423.0 — — —1971 496.0 72.0 -424.0 — — —1972 538.0 106.0 -432.0 — — —1973 533.0 172.0 -361.0 — — —1974 488.0 105.0 -383.0 — — —1975 439.0 211.0 -228.0 — — —1976 469.1 316.2 -152.9 — — —1977 439.6 293.8 -145.7 — — —1978 495.2 287.7 -207.6 — — —1979 499.4 290.7 -208.8 — — —1980 549.7 251.8 -297.9 — — —1981 541.4 307.0 -234.4 — — —1982 612.1 214.3 -397.8 — — —1983 698.7 219.3 -479.4 — — —1984 953.9 163.9 -790.0 — — —1985 1,127.8 128.4 -999.4 — — —1986 1,121.6 85.7 -1,035.9 — — —1987 1,195.1 109.3 -1,085.8 — — —1988 1,137.2 195.2 -942.0 — — —1989 895.7 268.4 -627.2 346.0 92.8 -253.11990 897.9 243.7 -654.1 348.7 82.2 -266.51991 774.8 289.8 -485.0 307.5 94.0 -213.51992 645.5 419.9 -225.6 258.2 140.3 -117.91993 740.2 446.4 -293.8 295.2 148.3 -146.91994 743.8 548.5 -195.2 296.7 177.4 -119.31995 664.0 787.5 123.5 268.9 263.8 -5.01996 619.7 969.9 350.2 251.8 306.5 54.71997 634.1 1043.6 409.6 261.3 324.1 62.81998 705.4 1230.1 524.7 289.6 399.9 110.31999 827.1 1,277.1 450.0 345.9 434.3 88.42000 966.6 1,286.7 320.1 410.3 438.1 27.92001 950.7 1,559.5 608.7 404.2 528.1 123.82002 1,070.7 1,612.2 541.5 454.9 550.0 95.12003 1,185.2 1,716.7 531.5 505.3 578.2 72.92004 1,099.5 2,180.5 1,081.1 469.4 747.4 278.02005 1,023.9 2,666.1 1,642.3 436.6 905.9 469.22006 989.7 2,997.3 2,007.7 418.1 1017.6 599.52007 968.4 3,141.2 2,172.7 408.8 1052.2 643.52008 831.9 4,668.3 3,836.5 350.2 1566.8 1216.62009 833.8 4,094.1 3,260.3 356.7 1397.9 1041.22010* — — — 373.0 1425.9 1052.9
Source: 1USDA Economic Research Service, 2USDA Foreign Agricultural Service, *Paragon Economics Forecast

106 Stats
Quick Facts
World Pork Consumption
Rank Country 2008 2009 2010
1 Belarus 99.0 92.5 94.0
2 EU-27 94.3 93.2 92.1
3 China/Hong Kong 77.7 80.8 82.1
4 Serbia 80.0 76.7 78.7
5 Taiwan 78.7 81.3 78.5
6 Montenegro 91.0 88.6 72.7
7 Switzerland 73.8 73.4 72.5
8 Korea, South 69.2 67.2 69.0
9 Bahamas, The 43.4 57.3 63.9
10 United States 63.8 64.6 59.9
11 Singapore 53.6 57.3 59.1
12 Croatia 57.3 56.9 58.4
13 Norway 57.5 55.8 55.1
14 Canada 56.3 56.1 52.0
15 Chile 45.8 49.0 50.0
16 Australia 47.8 48.4 48.7
17 Russia 47.9 47.2 48.5
18 Vietnam 47.3 46.7 45.8
19 New Zealand 44.9 47.2 45.6
20 Japan 43.0 42.8 42.3
21 Netherlands Antilles 39.1 38.8 38.5
22 Ukraine 39.7 34.4 37.5
23 Mexico 32.2 35.0 34.6
24 Ecuador 33.7 33.3 33.9
25 Kazakhstan 30.9 31.7 32.4
Rank Country 2008 2009 2010
26 Moldova 34.6 28.7 30.6
27 Philippines 29.1 29.1 30.4
28 Panama 24.7 26.2 29.1
29 Brazil 26.8 26.9 28.0
30 Uruguay 21.6 22.7 25.1
31 Dominican Republic 21.3 23.3 24.5
32 Macedonia 21.4 22.4 24.5
33 Cuba 21.8 22.0 22.5
34 Trinidad and Tobago 17.9 17.9 19.7
35 Korea, North 17.1 16.7 16.8
36 Albania 13.4 17.6 15.0
37 Angola 15.3 16.0 14.8
38 Argentina 13.7 13.9 14.3
39 Georgia 17.1 13.8 13.4
40 Armenia 16.3 13.4 13.4
41 Kyrgyzstan 11.0 11.0 11.9
42 Guatemala 11.2 11.7 11.7
43 Bosnia & Herzegovina 10.1 10.5 11.4
44 Gabon 13.4 13.1 11.4
45 Venezuela 11.1 10.6 10.4
46 Honduras 8.0 8.2 9.4
47 Colombia 8.4 8.8 8.8
48 Haiti 9.9 8.8 8.4
49 South Africa 7.6 7.9 7.9
50 Jamaica 7.9 7.0 7.7
World Per Capita Pork Consumption, Lbs., Carcass weight
Source: USDA Foreign Agricultural Service
Pork
40%
Other 5%Turkey 2%
Beef
24%
Chicken
29%
World Meat Consumption Shares – 2009
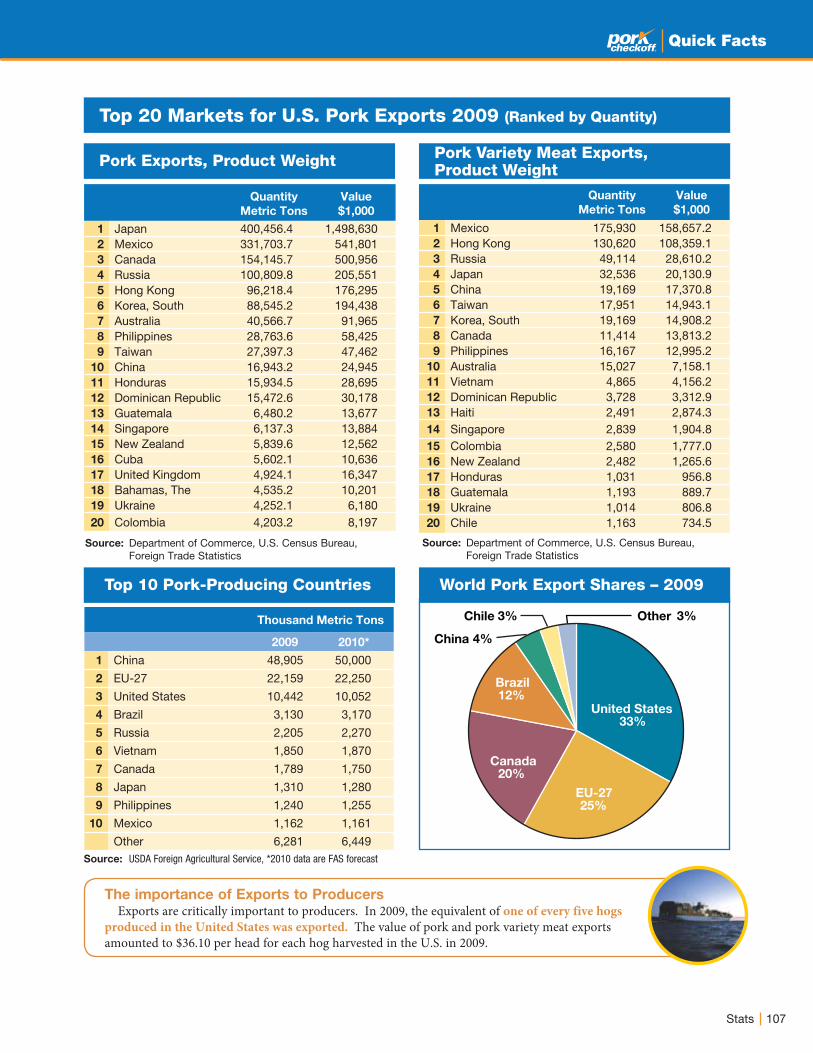
107Stats
Quick Facts
Top 20 Markets for U.S. Pork Exports 2009 (Ranked by Quantity)
Pork Exports, Product Weight
Top 10 Pork-Producing Countries World Pork Export Shares – 2009
Pork Variety Meat Exports, Product Weight
Thousand Metric Tons
2009 2010*
1 China 48,905 50,000
2 EU-27 22,159 22,250
3 United States 10,442 10,052
4 Brazil 3,130 3,170
5 Russia 2,205 2,270
6 Vietnam 1,850 1,870
7 Canada 1,789 1,750
8 Japan 1,310 1,280
9 Philippines 1,240 1,255
10 Mexico 1,162 1,161
Other 6,281 6,449Source: USDA Foreign Agricultural Service, *2010 data are FAS forecast
Source: Department of Commerce, U.S. Census Bureau, Foreign Trade Statistics
Quantity
Metric Tons
Value
$1,000
1 Japan 400,456.4 1,498,630 2 Mexico 331,703.7 541,801 3 Canada 154,145.7 500,956 4 Russia 100,809.8 205,551 5 Hong Kong 96,218.4 176,295 6 Korea, South 88,545.2 194,438 7 Australia 40,566.7 91,965 8 Philippines 28,763.6 58,425 9 Taiwan 27,397.3 47,462
10 China 16,943.2 24,945 11 Honduras 15,934.5 28,695 12 Dominican Republic 15,472.6 30,178 13 Guatemala 6,480.2 13,677 14 Singapore 6,137.3 13,884 15 New Zealand 5,839.6 12,562 16 Cuba 5,602.1 10,636 17 United Kingdom 4,924.1 16,347 18 Bahamas, The 4,535.2 10,201 19 Ukraine 4,252.1 6,180 20 Colombia 4,203.2 8,197
Quantity
Metric Tons
Value
$1,000
1 Mexico 175,930 158,657.22 Hong Kong 130,620 108,359.13 Russia 49,114 28,610.24 Japan 32,536 20,130.95 China 19,169 17,370.86 Taiwan 17,951 14,943.17 Korea, South 19,169 14,908.28 Canada 11,414 13,813.29 Philippines 16,167 12,995.2
10 Australia 15,027 7,158.111 Vietnam 4,865 4,156.212 Dominican Republic 3,728 3,312.913 Haiti 2,491 2,874.314 Singapore 2,839 1,904.815 Colombia 2,580 1,777.016 New Zealand 2,482 1,265.617 Honduras 1,031 956.818 Guatemala 1,193 889.719 Ukraine 1,014 806.820 Chile 1,163 734.5
Source: Department of Commerce, U.S. Census Bureau, Foreign Trade Statistics
United States 33%
EU-27 25%
Canada 20%
Brazil 12%
China 4%
Chile
3%
Other 3%
The importance of Exports to ProducersExports are critically important to producers. In 2009, the equivalent of one of every five hogs
produced in the United States was exported. The value of pork and pork variety meat exports amounted to $36.10 per head for each hog harvested in the U.S. in 2009.

108 Stats
Quick Facts
Canadian Hog/Pork Exports
Live Exports1
(<50 kg head)
Live Exports1
(> 50 kg head)
Exports of
Live Pigs2
(head)
Total PigsPork Exports1
(tonnes3)
1976 44,984 39,350
1977 43,347 43,347 59,456
1978 187,966 187,966 72,139
1979 131,192 131,192 101,612
1980 237,590 237,590 149,277
1981 147,344 147,344 164,354
1982 305,294 305,294 207,898
1983 459,303 459,303 201,205
1984 1,346,472 1,346,472 223,869
1985 1,152,442 1,152,442 250,806
1986 512,183 512,183 271,898
1987 427,591 427,591 301,086
1988 146,963 716,588 863,551 301,156
1989 170,568 835,140 1,005,708 253,946
1990 204,985 684,903 889,888 266,159
1991 225,856 837,781 1,063,637 243,001
1992 226,308 443,861 670,169 275,240
1993 280,813 556,611 837,424 281,934
1994 401,541 513,002 914,543 290,414
1995 650,748 1,096,003 1,746,751 350,565
1996 766,974 2,010,864 2,777,838 373,376
1997 987,287 2,188,633 3,175,920 423,242
1998 1,466,077 2,655,872 4,121,949 433,023
1999 2,083,426 2,052,625 4,136,051 519,587
2000 2,335,848 2,018,517 4,354,365 636,646
2001 3,168,770 2,152,298 5,321,068 718,703
2002 3,757,366 1,966,268 5,723,634 827,379
2003 4,974,044 2,458,173 7,432,217 924,344
2004 5,623,494 2,881,478 8,504,972 928,382
2005 5,416,249 2,774,218 8,190,467 1,030,522
2006 6,013,546 2,749,832 8,763,378 1,037,267
2007 6,720,515 3,283,802 10,004,317 996,985
2008 7,036,493 2,311,411 9,347,904 1,094,499
2009 5,221,439 1,143,114 6,364,553 1,075,181
1 Source: Statistics Canada Red Meat Section, Agriculture and Agri-Food Canada 2 Breakdown of exports by > or < 50 kg not available prior to 1988 3 1976-1987 weight of exports is on a dressed carcass basis, whereas 1988 onward is an actual shipped weight
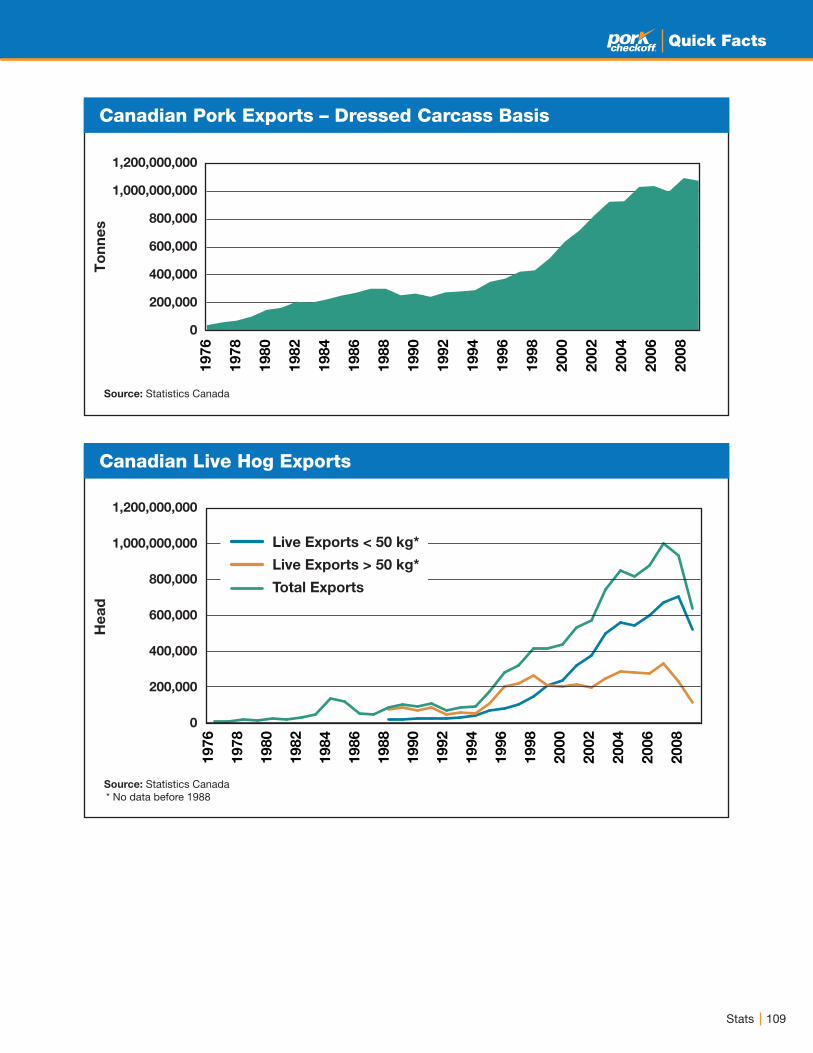
109Stats
Quick Facts
Canadian Pork Exports – Dressed Carcass Basis
Canadian Live Hog Exports
To
nn
es
He
ad
Source: Statistics Canada * No data before 1988
Source: Statistics Canada
19
76
19
78
19
80
19
82
19
84
19
86
19
88
19
90
19
92
19
94
19
96
19
98
20
00
20
02
20
04
20
06
20
08
1,200,000,000
1,000,000,000
800,000
600,000
400,000
200,000
0
1976
1978
1980
1982
1984
1986
1988
1990
1992
1994
1996
1998
2000
2002
2004
2006
2008
Live Exports < 50 kg*
Live Exports > 50 kg*
Total Exports
1,200,000,000
1,000,000,000
800,000
600,000
400,000
200,000
0

110 Stats
Quick Facts
Canadian Hog Inventory (January 1 of each year)
16,000
14,000
12,000
10,000
8,000
6,000
4,000
2,000
0
Canada has long had a vibrant pork industry that has for many years depended heavily on exports. With a population of only 32.6 million people who now eat just slightly less pork per capita than their U.S. neighbors, Canada has a domestic market for only about 1.9 billion pounds of carcass-weight pork per year. In 2009, Canada produced a record 4.30 billion pounds, carcass-weight, and exported 2.37 billion pounds, slightly less than 2008’s record exports of 2.41 billion pounds.
Canada also exported 6.4 million live hogs to the United States for feeding and/or harvest in 2009. Of the 6.4 million head, 5.22 million were feeder pigs (about 45 lbs.) or weaned pigs (10 to 12 lbs.) that were subsequently fed to market weight in the United States. The other 1.14 million head were market-weight hogs or culled sows and boars headed for U.S. packing plants.
Canada’s pork industry grew rapidly from 1995 to 2004. It’s breeding herd grew by over 50 percent, litters farrowed (born) grew by 70 percent and pigs born grew by 83 percent. The larger numbers for farrowings (births) and pigs born indicate a dramatic increase in productivity.
This growth was driven by two major developments. First, the repeal of transportation subsidies on grain shipments from the Prairie Provinces (Saskatchewan, Manitoba and Alberta) to the Pacific Coast, Ontario and Quebec drove grain prices lower in the prairies and encouraged livestock production. Due to supply controls, neither the dairy nor poultry sectors could grow, so the pork and, to a lesser degree, beef sectors took advantage of this opportunity.
Also, the Canadian dollar lost substantial value from 1997 through 2001. Canadian hog prices are simply U.S. hog prices converted into Canadian dollars. So, when the Canadian dollar loses value relative to the U.S. dollar, Canadian producers see more Canadian dollars when they sell pigs – regardless
Th
ou
sa
nd
He
ad
East West Total
of whether that sale is to a packing plant in the U.S. or one in Canada.
About half of Canadian pork producers’ production costs (primarily feed) rose due to the cheaper Canadian dollar. The weaker dollar thus caused all revenue to rise but only about half of costs to rise, meaning Canadian producers saw higher profits as the Canadian dollar weakened. They responded quite logically by increasing the breeding herd and output.
But conditions have changed dramatically since 2002. The Canadian dollar has strengthened by as much as 70 percent, reaching a high of $1.07U.S. per $Canada in May of 2007 and spending much of 2010 near par with the U.S. dollar. This increase reduced 100 percent of Canadian producers’ income while reducing only about 50 percent of their costs – thus driving profits lower. Canadian producers have also had to deal with the same higher grain and oilseed prices that have plagued U.S. producers since late 2006.
Canada’s breeding herd shrunk 17 percent from 1.634 million head in January 2005 to 1.298 million head in October 2010. Many observers believe it will eventually decline to less than 1.2 million head. Canada’s contribution to U.S. hog supplies has declined, as well. After a peak of 10.04 million head in 2007, imports of pigs from Canada fell to 9.35 million in 2008 and 6.4 million in 2009.
The reduction in imports of Canadian pigs has been exacerbated by the U.S. mandatory country-of-origin labeling law that went into effect in September 2008. The law made handling pork from pigs that were either born in Canada and fed in the U.S. or born and fed in Canada more expensive and troublesome for U.S. packers, processors and retailers. Some now refuse to buy pigs that originate in Canada in order to simplify product inventory and flow systems.
1976
1978
1980
1982
1984
1986
1988
1990
1992
1994
1996
1998
2000
2002
2004
2006
2008
2010
Source: Statistics Canada
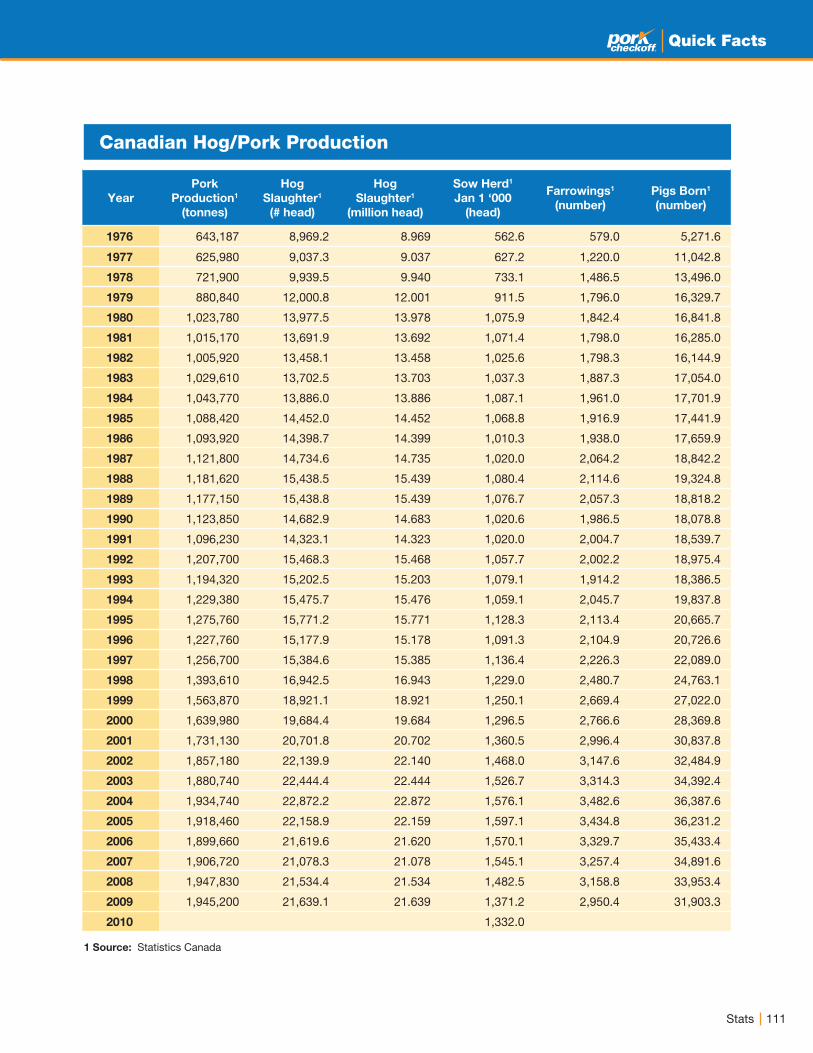
111Stats
Quick Facts
Canadian Hog/Pork Production
1 Source: Statistics Canada
Year
Pork
Production1
(tonnes)
Hog
Slaughter1
(# head)
Hog
Slaughter1
(million head)
Sow Herd1
Jan 1 ‘000
(head)
Farrowings1
(number)
Pigs Born1
(number)
1976 643,187 8,969.2 8.969 562.6 579.0 5,271.6
1977 625,980 9,037.3 9.037 627.2 1,220.0 11,042.8
1978 721,900 9,939.5 9.940 733.1 1,486.5 13,496.0
1979 880,840 12,000.8 12.001 911.5 1,796.0 16,329.7
1980 1,023,780 13,977.5 13.978 1,075.9 1,842.4 16,841.8
1981 1,015,170 13,691.9 13.692 1,071.4 1,798.0 16,285.0
1982 1,005,920 13,458.1 13.458 1,025.6 1,798.3 16,144.9
1983 1,029,610 13,702.5 13.703 1,037.3 1,887.3 17,054.0
1984 1,043,770 13,886.0 13.886 1,087.1 1,961.0 17,701.9
1985 1,088,420 14,452.0 14.452 1,068.8 1,916.9 17,441.9
1986 1,093,920 14,398.7 14.399 1,010.3 1,938.0 17,659.9
1987 1,121,800 14,734.6 14.735 1,020.0 2,064.2 18,842.2
1988 1,181,620 15,438.5 15.439 1,080.4 2,114.6 19,324.8
1989 1,177,150 15,438.8 15.439 1,076.7 2,057.3 18,818.2
1990 1,123,850 14,682.9 14.683 1,020.6 1,986.5 18,078.8
1991 1,096,230 14,323.1 14.323 1,020.0 2,004.7 18,539.7
1992 1,207,700 15,468.3 15.468 1,057.7 2,002.2 18,975.4
1993 1,194,320 15,202.5 15.203 1,079.1 1,914.2 18,386.5
1994 1,229,380 15,475.7 15.476 1,059.1 2,045.7 19,837.8
1995 1,275,760 15,771.2 15.771 1,128.3 2,113.4 20,665.7
1996 1,227,760 15,177.9 15.178 1,091.3 2,104.9 20,726.6
1997 1,256,700 15,384.6 15.385 1,136.4 2,226.3 22,089.0
1998 1,393,610 16,942.5 16.943 1,229.0 2,480.7 24,763.1
1999 1,563,870 18,921.1 18.921 1,250.1 2,669.4 27,022.0
2000 1,639,980 19,684.4 19.684 1,296.5 2,766.6 28,369.8
2001 1,731,130 20,701.8 20.702 1,360.5 2,996.4 30,837.8
2002 1,857,180 22,139.9 22.140 1,468.0 3,147.6 32,484.9
2003 1,880,740 22,444.4 22.444 1,526.7 3,314.3 34,392.4
2004 1,934,740 22,872.2 22.872 1,576.1 3,482.6 36,387.6
2005 1,918,460 22,158.9 22.159 1,597.1 3,434.8 36,231.2
2006 1,899,660 21,619.6 21.620 1,570.1 3,329.7 35,433.4
2007 1,906,720 21,078.3 21.078 1,545.1 3,257.4 34,891.6
2008 1,947,830 21,534.4 21.534 1,482.5 3,158.8 33,953.4
2009 1,945,200 21,639.1 21.639 1,371.2 2,950.4 31,903.3
2010 1,332.0
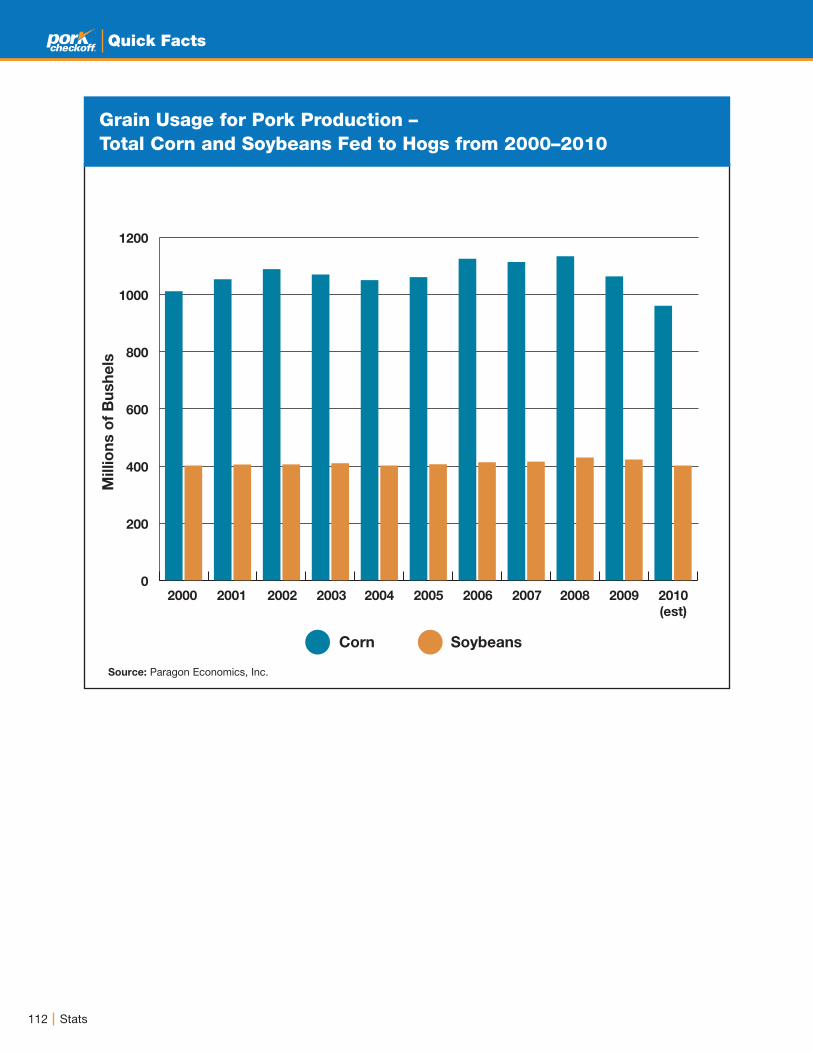
112 Stats
Quick Facts
Grain Usage for Pork Production – Total Corn and Soybeans Fed to Hogs from 2000–2010
Source: Paragon Economics, Inc.
Millio
ns o
f B
ush
els
Corn Soybeans
1200
1000
800
600
400
200
0 2000 2001 2002 2003 2004 2005 2006 2007 2008 2009 2010
(est)
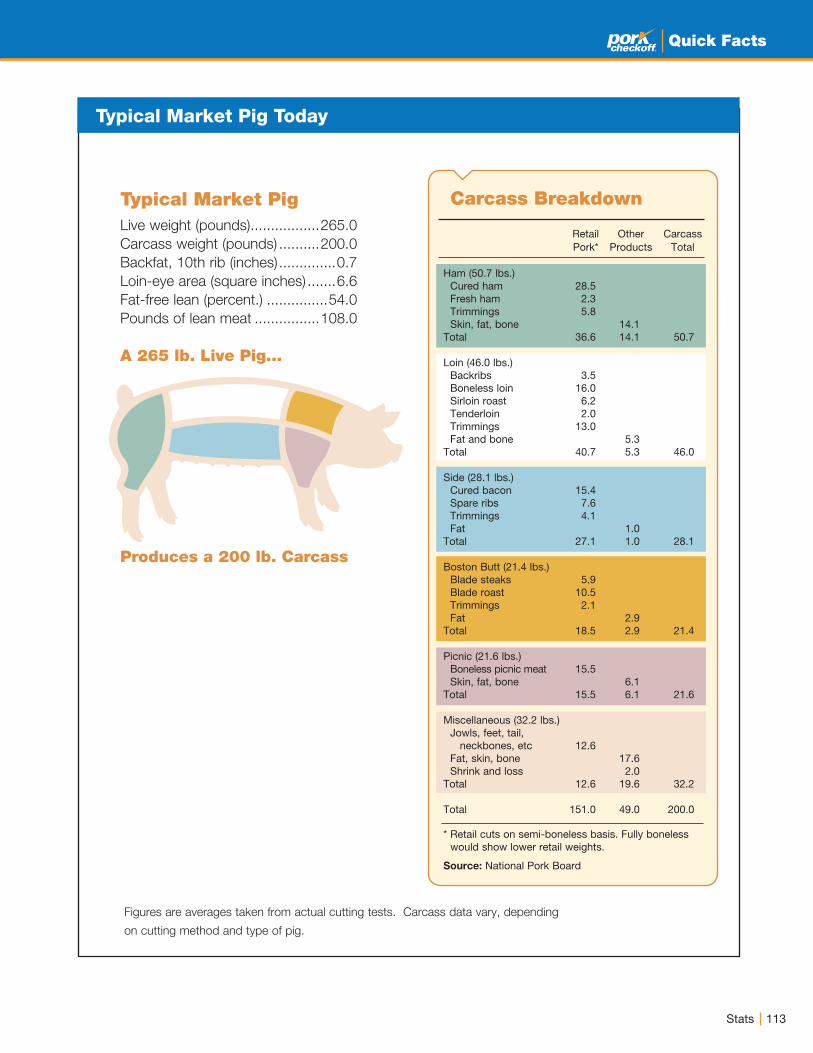
Typical Market PigLive weight (pounds) .................265.0
Carcass weight (pounds) ..........200.0
Backfat, 10th rib (inches) ..............0.7
Loin-eye area (square inches) .......6.6
Fat-free lean (percent.) ...............54.0
Pounds of lean meat ................108.0
A 265 lb. Live Pig…
Produces a 200 lb. Carcass
Figures are averages taken from actual cutting tests. Carcass data vary, depending
on cutting method and type of pig.
Retail Other Carcass Pork* Products Total
Ham (50.7 lbs.) Cured ham 28.5 Fresh ham 2.3 Trimmings 5.8 Skin, fat, bone 14.1Total 36.6 14.1 50.7
Loin (46.0 lbs.) Backribs 3.5 Boneless loin 16.0 Sirloin roast 6.2 Tenderloin 2.0 Trimmings 13.0 Fat and bone 5.3Total 40.7 5.3 46.0
Side (28.1 lbs.) Cured bacon 15.4 Spare ribs 7.6 Trimmings 4.1 Fat 1.0Total 27.1 1.0 28.1
Boston Butt (21.4 lbs.) Blade steaks 5.9 Blade roast 10.5 Trimmings 2.1 Fat 2.9Total 18.5 2.9 21.4
Picnic (21.6 lbs.) Boneless picnic meat 15.5 Skin, fat, bone 6.1Total 15.5 6.1 21.6
Miscellaneous (32.2 lbs.) Jowls, feet, tail, neckbones, etc 12.6 Fat, skin, bone 17.6 Shrink and loss 2.0Total 12.6 19.6 32.2
Total 151.0 49.0 200.0
* Retail cuts on semi-boneless basis. Fully boneless would show lower retail weights.
Source: National Pork Board
Carcass Breakdown
Quick Facts
113Stats
Typical Market Pig Today
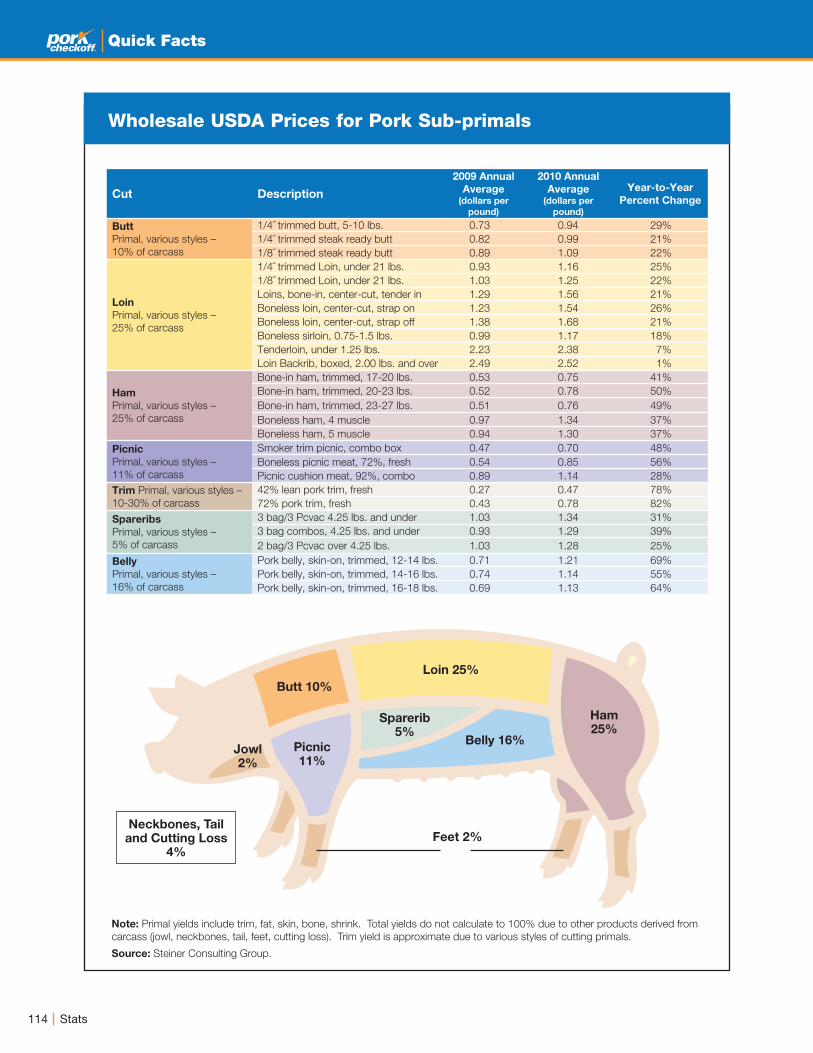
114 Stats
Quick Facts
Wholesale USDA Prices for Pork Sub-primals
Ham25%
Feet 2%
Belly 16%
Loin 25%
Butt 10%
Picnic11%
Jowl2%
Sparerib 5%
Note: Primal yields include trim, fat, skin, bone, shrink. Total yields do not calculate to 100% due to other products derived from
carcass (jowl, neckbones, tail, feet, cutting loss). Trim yield is approximate due to various styles of cutting primals.
Source: Steiner Consulting Group.
Cut Description
2009 Annual
Average (dollars per
pound)
2010 Annual
Average(dollars per
pound)
Year-to-Year
Percent Change
Butt
Primal, various styles –
10% of carcass
1/4˝ trimmed butt, 5-10 lbs. 0.73 0.94 29%
1/4˝ trimmed steak ready butt 0.82 0.99 21%
1/8˝ trimmed steak ready butt 0.89 1.09 22%
Loin
Primal, various styles –
25% of carcass
1/4˝ trimmed Loin, under 21 lbs. 0.93 1.16 25%
1/8˝ trimmed Loin, under 21 lbs. 1.03 1.25 22%
Loins, bone-in, center-cut, tender in 1.29 1.56 21%
Boneless loin, center-cut, strap on 1.23 1.54 26%
Boneless loin, center-cut, strap off 1.38 1.68 21%
Boneless sirloin, 0.75-1.5 lbs. 0.99 1.17 18%
Tenderloin, under 1.25 lbs. 2.23 2.38 7%
Loin Backrib, boxed, 2.00 lbs. and over 2.49 2.52 1%
Ham
Primal, various styles –
25% of carcass
Bone-in ham, trimmed, 17-20 lbs. 0.53 0.75 41%
Bone-in ham, trimmed, 20-23 lbs. 0.52 0.78 50%
Bone-in ham, trimmed, 23-27 lbs. 0.51 0.76 49%
Boneless ham, 4 muscle 0.97 1.34 37%
Boneless ham, 5 muscle 0.94 1.30 37%
Picnic
Primal, various styles –
11% of carcass
Smoker trim picnic, combo box 0.47 0.70 48%
Boneless picnic meat, 72%, fresh 0.54 0.85 56%
Picnic cushion meat, 92%, combo 0.89 1.14 28%
Trim Primal, various styles –
10-30% of carcass
42% lean pork trim, fresh 0.27 0.47 78%
72% pork trim, fresh 0.43 0.78 82%
Spareribs
Primal, various styles –
5% of carcass
3 bag/3 Pcvac 4.25 lbs. and under 1.03 1.34 31%
3 bag combos, 4.25 lbs. and under 0.93 1.29 39%
2 bag/3 Pcvac over 4.25 lbs. 1.03 1.28 25%
Belly
Primal, various styles –
16% of carcass
Pork belly, skin-on, trimmed, 12-14 lbs. 0.71 1.21 69%
Pork belly, skin-on, trimmed, 14-16 lbs. 0.74 1.14 55%
Pork belly, skin-on, trimmed, 16-18 lbs. 0.69 1.13 64%
Neckbones, Tail and Cutting Loss
4%
115Glossary
Quick Facts
Glossary
Ag ronomy – branch of agriculture dealing with crop production and soil management
AI – artificial insemination; mechanical insertion of semen into the female’s reproduction tract
All -in/all-out production – production system where animals are moved in and out of facilities in distinct groups to help reduce the spread of disease; facilities are normally cleaned and disinfected thoroughly between groups
An imal welfare – The American Veterinary Medical Association (AVMA) has defined animal welfare as “a human responsibility that encompasses all aspects of animal well-being, including proper housing, management, nutrition, disease prevention and treatment, responsible care, human handling and, when necessary, humane euthanasia.”
An tibiotic – a chemical substance produced by a microorganism that has the capacity to inhibit the growth of or to kill other microorganisms
An timicrobial – an agent that kills bacteria or suppresses their multiplication or growth; includes antibiotics and synthetic agents
Aq uifer – layer of permeable rock, sand or gravel that contains or conducts groundwater indicator of the overall fat content of the animal; used in selecting breeding stock and in grading carcasses
Barrow – a male hog that has been castratedBa lanced diet – feed that has all the nutrients an
animal needs to stay healthy and grow normallyBe lly – lower side of a hog remaining after the loin and
spareribs are removed; used to make baconBi o security program – a program to help prevent
diseases from being spread between herds; the program isolates animals, controls human traffic in and around the operation and includes facilities sanitation
Boar – intact male pig; used for breedingBoston butt – upper part of the pork shoulderBr eeding herd – boars and females in gestation,
breeding and farrowing stages of production
CAFO – confi ned animal feed operationCarbon cycle – the movement of carbon between
its main reservoirs (atmosphere, ground surface, including fresh surface water, ocean and sediments)
Carbon footprint – a measure of an entity’s impact on the environment in terms of the amount of greenhouse gas emissions it produces; usually measured in units of carbon dioxide.
Ca rcass – the two sides of the same processed animalCa se-ready – meat that is pre-packaged by the
processor for immediate display in the meatcaseCold storage – the system whereby meat is stored
under refrigeration or in the frozen state for a period of time to provide flexibility in the marketing of various products; not intended to take the heat out of products but rather maintain their previous cold state achieved before entering the facility. Stocks of various products in cold storage may fluctuate during the year depending upon the supply and demand for that product. For instance, hams are collected in cold storage throughout the fall in anticipation of the huge demand for hams during the Christmas season.
Confinement – modern hog facility where hogs are raised indoors
Co nservation plan – a combination of land uses and practices to protect and improve soil productivity and to prevent soil deterioration
Co nsumption – the total amount of a product consumed. Note: No direct measurement of meat consumption is available, so for pork and other meats, consumption is assumed to equal other disappearance.
116 Glossary
Quick Facts
Co ntract production – a business model in which one or more phases of the pig production enterprise is performed by a person or company (a “grower”) that does not own the pigs; growers provide land, buildings, labor, utilities and waste management services in return for a per pig or per pig space fee
Co nventional buildings – totally enclosed housing facility where the environment (temperature, humidity and lighting) and manure disposal is typically automated; automated heating, cooling and ventilation equipment is used to ensure the pig’s health and access to feed and water
Cr oss-fostering – the practice of placing piglets from mothers with too many piglets to feed adequately to mothers with extra udder space; done preferably within the first hours after birth after piglets have consumed colostrum
Cr ude protein – chemically analyzed protein content in a given feed
Cu t-out value – the weighted average value of all wholesale cuts in a pig carcass
De mand – the quantities of a good consumers are willing and able to purchase at alternative prices
Deep pit – pit under a hog barn used to temporarily store manure; typically below a slotted floor
Dis appearance, other – the amount of production that cannot be accounted for by uses where the quantity is known
For pork, other disappearance is determined by:
Beginning inventory (a known quantity, USDA Cold Storage Report)+ Production (a known quantity, USDA Livestock Slaughter)+ Imports (a known quantity, U.S. Department of Commerce and USDA FAS)
= Total supply
- Exports (a known quantity, U.S. Department of Commerce and USDA FAS)- Ending inventory (a known quantity, USDA Cold Storage Report)
= Other Disappearance
Ef f luent – the liquid layer of manure after solids have settled out, such as in a lagoon
Es trus – period during which a gilt or sow is receptive to mating and during which ovulation occurs
Estrous female – a gilt or sow in estrusEu thansia – the humane death of an animal occurring
without pain or distressFarrow – to give birth to pigletsFarrowing – the process of birthing for swine
Fa rrow-to-finish operation – a production system that contains all production phases, from breeding to gestation to farrowing to nursery to grow-finishing to market
Fe ed efficiency (or feed conversion ratio) – the amount of feed a pig consumes to gain one unit of body weight; the smaller the amount, the more efficient the pig
Fe eder pig – a young pig weighing 30 and 90 poundsFe eder pig operation – a production system where
pigs are sold out of the nursery phase to a finishing operation to grow them to market weight
Finish – to feed a pig until it reaches market weightFin isher pig – a pig that is beyond the feeder stage being
raised for saleFin ishing operation – an operation that purchases
feeder pigs and feeds them to market weightGestation – pregnancy; 112-114 days in length for pigsGil t – young female that has not farrowed her first litterGreenhouse gases (GHG) – Gases that accumulate
infrared radiation in the atmosphere resulting in climate change. Some result from natural processes while others are generated only through human activities.
117Glossary
Quick Facts
Greenhouse gas emissions – A term that describes greenhouse gases emitted into the atmosphere by an activity, a process, an individual or an organization. Also known as carbon emissions.
Grower pig – a young pig weighing between about 50 and 200 pounds
Ha m – cured and smoked meat from the hind leg of pork, excluding the shank
Ha nd mating – an individual female that is ready to be bred is exposed to an individual boar in a small pen for mating, under the supervision of the producer
Harvest – the process of animals being harvested for food usage. There are two measures in the U.S. Federally inspected (FI) slaughter is the number of animals harvested in plants that are subject to inspection by USDA Food Safety Inspection Service. Commercial slaughter/ harvest includes FI slaughter and the harvest that occurs in state-inspected facilities
Ho op structure – low-cost, uninsulated and naturally ventilated hoop-shaped production building; the floor is usually earthen and typically bedded with straw or cornstalk
Im munization – the process of rendering a subject immune or of becoming immune, either by conventional vaccination or exposure to disease
In tact pigs – male pigs that have not been castrated but have not been kept for breeding purposes
La ctating – period when a sow provides milk to her pigs
La goon – a biological treatment system designed and operated for biodegradation, or converting organic matter to a more stable end product; lagoons may be anaerobic, aerobic or facultative
Lit ter – the group of pigs born to a sow during one farrowing; normally 8-12 pigs per litter
Lo in – wholesale cut of pork that is comprised of the spine and associated muscles between the shoulder and the ham
Ma rket-weight pigs – pigs that have reached 240 to 280 pounds
Mating – breeding an estrous gilt or sowMe at breeds – breeds used in boar lines in cross-
breeding schemes; include Hampshire, Duroc, Poland China, and Pietrain
Mo ther breeds – used in maternal lines in cross-breeding schemes; include Yorkshire, English Large White, Landrace, and Chester White
Necropsy – post-mortum excamination of a pig; used as a veterinarian diagnostic tool
No n-productive sow days – days a sow is neither lactating or gestating
Nic he pork production – supplying unique pork and pork products in a way that specific customer segments prefer or value; does not use traditional commodity market channels and does not necessarily mean “small”
Nu rsery pig – the growth phase from weaning until pigs enter the feeder phase
Nursing pig – any pig not yet weanedOffal – entrails and internal organisms of an animal
used for foodPa sture system – a pork production system in which
pigs are housed in large paddocks containing grass or legume forages; housing is usually limited to primitive, portable, open front buildings that are manually ventilated and bedded with straw, corn stalks or other materials as needed
118 Glossary
Quick Facts
Picnic – a wholesale cut of pork comprised of the lower portion of the shoulder and front leg
Pig – term usually applied to young, immature swinePig let – newborn pigsPig let – the number of pigs produced by a given number
of sows; usually expressed as the percent of pigs weaned to sows bred
Pr o duction – the number of pounds of a specific meat produced; determined by the number of animals slaughtered/ harvested and the average weight of the animals; usually measured in carcass weight for pork and beef, and in ready-to-cook weight for poultry
Se gregated Early Weaning (SEW) – removal of pigs from mother at 10 - 14 days of age in order to reduce disease transmission from the mother to her offspring
Se rvice – breeding, or the deposition of boar semen into the female; may be done naturally by a boar or artificially by the manager using semen obtained from a local boar or purchased from a supplier
Sir loin – the distal (rearward) end of the loin.Sl udge – a layer of settled solids found in manure
storage; primarily accumulated in lagoonsSl urry – manure with a consistency of 5-10 percent dry
matter handled by some liquid storage systemsSow – female pig that has farrowed at least one litterSu pply – the quantities of a good which producers are
willing and able to sell at alternative prices. Tenderloin – the muscle that lies on both sides of the
spine against the ribs at the distal end of the loinTilth – the workability of soilWean – to separate young pigs from the sowWe aner pig – pigs from weaning up to about 40 poundsYie ld – amount of salable retail cuts that can be obtained
from a carcass
Parity – the condition of having given birth or, for sows, farrowed; second-parity sows have farrowed two litters, third-parity sows three litters, etc.
Pe n mating – boar is placed in a pen with a group of sows to allow for breeding
Pe r capita consumption – total consumption of a good divided by total U.S. population; can be measured on three different weight bases
Ca rcass weight - the weight of pork in carcass form after evisceration, de-hairing and removal of the head and internal fat. The most appropriate measure of pork produced by packing plants.
Re tail weight - the estimated weight of the retail cuts that comes from a carcass. USDA currently estimates that one pound of carcass weight pork yields 0.762 pounds of retail weight pork. This is the most appropriate estimate of pork purchased by consumers.
Bo neless equivalent - the estimated weight of boneless pork that comes from a carcass. USDA currently estimates that one pound of retail weight pork yields 0.96 pounds of boneless pork. This is the most appropriate estimate of pork actually eaten by consumers.

119Names and Numbers
For More Information…
Quick Facts
Pork CheckoffContact the National Pork Board, which oversees the Pork Checkoff, for more information about Checkoff-funded research, eduation and promotion programs.
National Pork Board1776 NW 114th St.Des Moines, IA 50325(515) 223-2600
Pork Checkoff Service Center(800) 456-7675
State Associations
The Pork Act requires that a percentage of the Checkoff funds collected each year be returned to the state pork producer associations. On average, about 20 percent of producer and importer Checkoff receipts are returned to states and used for state Checkoff-funded projects. Contact information for the 44 state pork associations as of Jan. 15, 2011 was as follows.
Alabama Pork ProducersGuy HallPO Box 110002108 East South BoulevardMontgomery, AL 36191(334) 612-5181(800) 392-5705 [email protected]
Arizona Pork CouncilTom Miller1102 E Avenida GrandeCasa Grande, AZ 85222-1004(520) [email protected]
Arkansas Pork Producers AssociationJerry Masters625 Buck Mountain RdDover, AR 72837(479) 331-9708(877) [email protected]
California Pork Producers AssociationLesa Carlton 1225 H St Ste 106Sacramento, CA 95814(916) [email protected]
Colorado Pork Producers CouncilIvan Steinke 822 7th StGreeley, CO 80631(970) 378-0500 [email protected]
Delaware Pork Producers AssociationJohn Tigner 2582 Arthursville RdHartly, DE 19953-3239(302) [email protected]
Florida Pork Improvement GroupFrankie Hall PO Box 147030Gainesville, FL 32614-7030(352) [email protected]
Georgia Pork Producers AssociationCharles GriffinPO Box 272Camilla, GA 31730(229) [email protected]
Hawaii Pork Industry AssociationElliot Telles1654 Kaumoli StPearl City, HI 96782(808) [email protected]
Idaho Pork Producers AssociationBonnie Hanson6770 Happy Valley Rd.Kuna, ID 83634(208) [email protected]
Illinois Pork Producers AssociationJim Kaitschuk6411 S 6th St RdSpringfield, IL 62712-6817(217) [email protected]
Indiana PorkMike Platt5722 W 74th StIndianapolis, IN 46278(317) 872-7500 [email protected]
Iowa Pork Producers AssociationRich Degner1636 NW 114th StClive, IA 50325-7071(515) 225-7675(800) [email protected]
Kansas Pork AssociationTim Stroda2601 Farm Bureau RdManhattan, KS 66502-3066(785) [email protected]
Kentucky Pork Producers AssociationBonnie Jolly1110 Hawkins DrElizabethtown, KY 42701-0607(270) [email protected]
Louisiana Pork Producers AssociationChip LeMieux319 W Claude StLake Charles, LA 70605(337) [email protected]
Maine Hog Growers AssociationClark Souther161 Souther RdLivermore Falls, ME 04254-4227(207) [email protected]/mainepork
Maryland Pork Producers AssociationLynne Hoot53 Slama RdEdgewater, MD 21037-1423(410) [email protected]
Michigan Pork Producers AssociationSam Hines4801 Willoughby Rd Ste 5Holt, MI 48842-1000(517) [email protected]

120 Names and Numbers
Quick Facts
Minnesota Pork BoardDave Preisler151 Saint Andrews Ct Ste 810Mankato, MN 56001(507) [email protected]
Mississippi Pork Producers AssociationMark CrenshawPO Box 9815Mississippi State, MS 39762-9815(662) [email protected]
Missouri Pork Producers AssociationDon Nikodim6235 W Cunningham DrColumbia, MO 65202-9162(573) [email protected]
Montana Pork Producers CouncilAnne MillerPO Box 485Jordan, MT 59337(406) [email protected]
Nebraska Pork Producers Association IncLarry Sitzman7441 O Street Ste 104Lincoln, NE 68510(402) [email protected]
Nevada Pork Producers AssociationDave LoukPO Box 493Winnemucca, NV 89446-0493(775) [email protected]
New Hampshire Pork Producers CouncilDoreen Gitschier206 Currier RdHill, NH 03243(603) [email protected]
New York Pork Producers Cooperative IncJamie MesmerPO Box 124Fayette, NY 13165(315) [email protected]
North Carolina Pork Council IncDeborah Johnson2300 Rexwoods Dr Ste 340Raleigh, NC 27607-3361(919) [email protected]
North Dakota Pork CouncilCharlotte Meier9905 66th St SWRegent, ND 58650(701) [email protected]
Ohio Pork Producers CouncilDick Isler5930 Sharon Woods Blvd Ste 101Columbus, OH 43229-2666(614) 882-5887(800) [email protected]
Oklahoma Pork CouncilRoy Lee LindseyOne North Hudson Ste 900Oklahoma City, OK 73102(405) 232-3781(888) [email protected]
Oregon Pork Producers AssociationLee Letsch14600 Salt Creek RdDallas, OR 97338(503) [email protected]
Pennsylvania Pork Producers CouncilAmy BradfordNorthwood Office Center2215 Forest Hills Drive Suite 39Harrisburg, PA 17112-1099(717) [email protected]
South Carolina Pork BoardChad TruesdalePO Box 11280Columbia, SC 29211(803) [email protected]
South Dakota Pork Producers CouncilGlenn Muller500 N Western Ave Ste 500Sioux Falls, SD 57104(605) [email protected]
Tennessee Pork Producers AssociationPhyllis Ferguson13994 Versailles RdRockvale, TN 37153(615) [email protected]
Texas Pork Producers AssociationKen HortonPO Box 101688500 Shoal Creek Blvd. Bldg 4 Suite 120Austin, TX 78757(512) 453-0615(800) [email protected]
Utah Pork Producers AssociationHaven Hendricks55 E 200 NProvidence, UT 84332-9605(435) [email protected]
Virginia Pork Industry AssociationJohn Parker102 Governor St Rm 316Richmond, VA 23219-3642(804) [email protected]
Washington Pork ProducersDon VanTine2001 VanTine RdGarfield, WA 99130-9768(509) [email protected]
West Virginia Pork ProducersJack YokumHC 32 Box 418Petersburg, WV [email protected]
Wisconsin Pork AssociationMike WehlerHwy C Plain, WI 53577(608) [email protected]
Wyoming Pork ProducersAnne MillerPhone: (406) [email protected]

©2009-2011 National Pork Board, Des Moines, IA USA.
This message funded by America’s Pork Checkoff Program. #09133-12/09
National Pork Board 1776 NW 114th Street • Des Moines, Iowa 50325
Phone: (515) 223-2600 • Fax: (515) 223-2646