quraterly report september 30 2017 - suraj … uarterly report september 30, 2017 company...
TRANSCRIPT

[email protected]+92 42 35760381 +92 42 35760376
7-B III, Aziz Avenue,Gulberg-V, Lahore - Pakistan
Suraj Cotton Mills Limited
SURAJ COTTON MILLS LIMITED
QURATERLYREPORT
September 302017
Un-Audited


02 Company Information
03 Directors’ Report
04 Directors’ Report (Urdu)
06 Balance Sheet
08 Profit & Loss Account
09 Statement of Comprehensive Income
10 Cash Flow Statement
11 Statement of Changes in Equity
12 Notes to the Financial Statements
Content

2 QUARTERLY REPORT SEPTEMBER 30, 2017
Company Information
Board of DirectorsKhalid Bashir (Chairman)
Ahsan Bashir
Amjad Mahmood
Adil Bashir
Humayun Maqbool
Mohammad Iqbal
Sharik Bashir
Chief ExecutiveNadeem Maqbool (Chief Executive)
Chief Financial OfficerFarooq Ahmad
Audit CommitteeHumayun Maqbool (Chairman)
Ahsan Bashir (Member)
Adil Bashir (Member)
HR & R CommitteeAhsan Bashir (Chairman)
Adil Bashir (Member)
Humayun Maqbool (Member)
Share RegistrarCorptec Associates (Pvt.) Ltd.
503-E, Johar Town, Lahore
AuditorsEY Ford Rhodes
Chartered Accountants
BankersAllied Bank Limited
Habib Bank Limited
MCB Bank Limited
Standard Chartered Bank (Pakistan) Limited
United Bank Limited
Dubai Islamic Bank Limited
Habib Metropolitan Bank Limited
Registered Office7-B-III, Aziz Avenue, Gulberg-V, Lahore
Ph: +92-423-576 0379, 576 0382
Fax: +92-423-576 0376
Email: [email protected]
Web: www.suraj.com
Project LocationsNooriabad, District Dadu, Sindh.
Kotla Kahloon, District Nankana Sahib, Punjab.
Bhaikot, Rawind, District Lahore, Punjab.
3
Directors’ Report
On behalf of the Board of Directors, I present the financial statements for the first quarter ended 30 September 2017. The company’s performance resulted in a net profit of Rs. 22.564 million with earnings per share of Rs. 0.78.
Sales for the period were approximately 5% higher than the corresponding period. Administrative expenses were higher by 5% and operating expenses reduced as compared to the previous period. Distribution costs declined due to lower exports. Financial charges increased significantly and the main reason was the due to trial production of the new spinning unit. Due to a sharp decline in portfolio equity values, the company suffered a loss of almost Rs. 10 million.
Future Prospects
The textile industry has begun to show signs of improvement towards the second half of the quarter with demand showing signs of improvement as also the prospect of a good cotton crop. The Government has also approved continuation of the export package with additional incentives and we are confident that this will improve our competitiveness to some extent as the industry begins to regain its share of export markets.
Raw material prices opened on a lower note and although the prices have increased in the last two weeks we feel that with increased demand and better pricing of end products, part of the increase will be absorbed. The cotton crop is expected to be significantly better in quantity terms as compared to the previous year.
However, the competitiveness of the textile industry has not reached acceptable levels as our energy prices remain high compared to the regional countries. It is imperative that the government moves to address this issue urgently so that the gains to be realised from increased demand are not lost. The government has managed to bring load shedding to a negligible level which is commendable.
We expect that the current year will be very challenging but we will make efforts to take advantage of improved conditions and increase our profitability over the first quarter. It is essential that we maintain our focus on reducing costs in order to remain competitive. Our new spinning unit has commenced trial production and with its coming on line we should be able to improve our operating margins.
The management is working towards improvement in efficiencies and productivity as well as enhanced cost controls.
Acknowledgements
We would like to thank the Board of Directors for their guidance at all times and to our employees for their dedication. We would also like to thank our shareholders and all our business partners for their cooperation.
Nadeem Maqbool Hamayun MaqboolChief Executive Director
October 30, 2017Lahore

4 QUARTERLY REPORT SEPTEMBER 30, 2017

5
Financial Statements
For the Period ended September 30, 2017

6 QUARTERLY REPORT SEPTEMBER 30, 2017
Condensed Interim Balance Sheet As At September 30, 2017
Un-Audited Audited
Sep 30,2017
June 30,2017
Note (Rupees in thousand)
EQUITY AND LIABILITIES
Share capital and reserves
Authorized share capital
50,000,000 (30 June 2016: 50,000,000) ordinary
shares of Rupees 10/- each 500,000 500,000
Issued, subscribed and paid up share capital 289,892 289,892
Share premium 29,000 29,000
Revenue reserves 4,803,402 4,780,838
Available for sale reserve 149,427 180,506
Total equity 5,271,721 5,280,236
Non-current liabilities
Long term financing 5 2,334,841 2,307,475
Liabilities against assets subject to finance lease 916 1,198
Deferred tax 195,817 195,817
2,531,574 2,504,490
Current liabilities
Trade and other payables 1,448,592 1,304,379
Accrued interest on loans 24,478 35,084
Short term borrowings 369,559 379,394
Current portion of non current liabilities 46,660 64,112
1,889,289 1,782,969
Total Liabilities 4,420,863 4,287,459
TOTAL EQUITY AND LIABILITIES 9,692,584 9,567,695
CONTINGENCIES AND COMMITMENTS 6
The annexed notes form an integral part of this interim financial information.
DIRECTORCHIEF EXECUTIVE OFFICER CHIEF FINANCIAL OFFICER

7
Un-Audited Audited
Sep 30,2017
June 30,2017
Note (Rupees in thousand)
ASSETS
Non-current assets
Property, plant and equipment 7 5,059,615 4,952,530
Investment properties 100,000 100,000
Investment in joint venture 50,000 50,000
Long term deposits 19,879 19,879
5,229,494 5,122,409
Current assets
Stores, spares and loose tools 169,958 149,265
Stock in trade 1,308,390 1,407,007
Trade debts 492,545 371,238
Loans and advances 8 61,392 116,749
Trade deposits and short term prepayments 33,535 17,540
Balances with statutory authorities 2,239 2,239
Tax refunds due from the government 414,415 375,157
Other receivables 8,095 10,414
Short term investments 9 1,813,679 1,909,120
Cash and bank balances 109,243 41,676
Assets held for sale 49,599 44,882
4,463,090 4,445,286
TOTAL ASSETS 9,692,584 9,567,695
DIRECTORCHIEF EXECUTIVE OFFICER CHIEF FINANCIAL OFFICER
8 QUARTERLY REPORT SEPTEMBER 30, 2017
Sep 30,
2017
Sep 30,
2016
Note (Rupees in thousand)
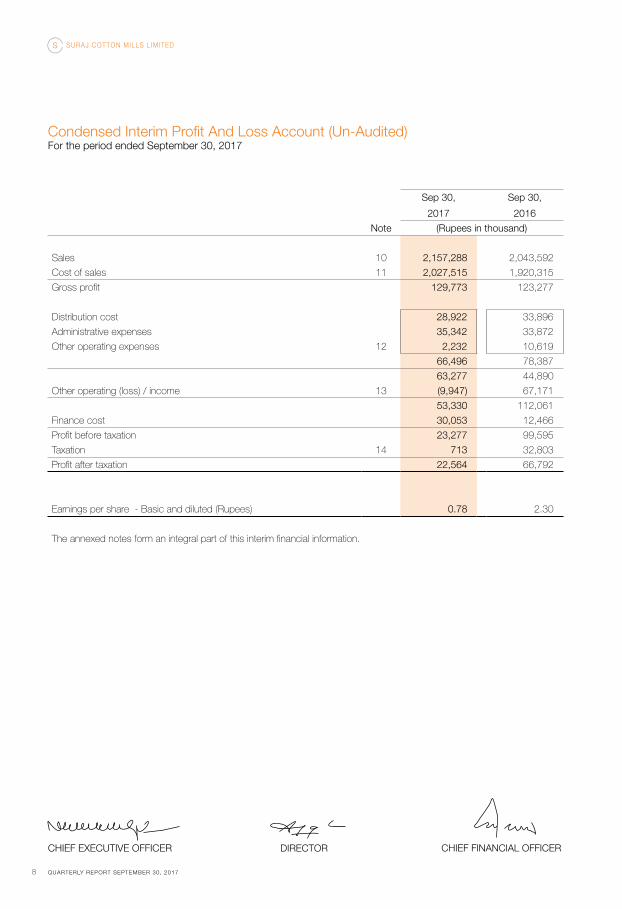
Sales 10 2,157,288 2,043,592
Cost of sales 11 2,027,515 1,920,315
Gross profit 129,773 123,277
Distribution cost 28,922 33,896
Administrative expenses 35,342 33,872
Other operating expenses 12 2,232 10,619
66,496 78,387
63,277 44,890
Other operating (loss) / income 13 (9,947) 67,171
53,330 112,061
Finance cost 30,053 12,466
Profit before taxation 23,277 99,595
Taxation 14 713 32,803
Profit after taxation 22,564 66,792
Earnings per share - Basic and diluted (Rupees) 0.78 2.30
The annexed notes form an integral part of this interim financial information.
Condensed Interim Profit And Loss Account (Un-Audited)For the period ended September 30, 2017
DIRECTORCHIEF EXECUTIVE OFFICER CHIEF FINANCIAL OFFICER

9
Sep 31,
2017
Sep 31,
2016
(Rupees in thousand)
Profit for the period 22,564 66,792
Other comprehensive income / (loss):
Items not to be reclassified to profit and loss in subsequent periods
Net realized (loss) / gain on available for sale investment (31,079) 85,450
Total comprehensive (loss) / income for the period (8,515) 152,242
The annexed notes form an integral part of this interim financial information.
Condensed Interim Statement of Comprehensive Income (Un-Audited)For the period ended September 30, 2017
DIRECTORCHIEF EXECUTIVE OFFICER CHIEF FINANCIAL OFFICER

10 QUARTERLY REPORT SEPTEMBER 30, 2017
Sep 30,
2017
Sep 30,
2016(Rupees in thousand)
CASH FLOWS FROM OPERATING ACTIVITIESProfit before taxation 23,277 99,595 Adjustment for non-cash and other items:Depreciation 51,281 48,144 Gain on disposal of property, plant and equipment (1,987) (231)Net gain / (loss) of short term investment 14,003 (64,411)Impairment loss on available for sale investment - - Dividend income (700) (500)Exchange loss / (gain) 381 - Finance cost 30,053 12,466 Cash flows from operating activities before working capital changes 116,308 95,063
EFFECT ON CASH FLOW DUE TO WORKING CAPITAL CHANGES (Increase) / decrease in current assets:Stores, spares and loose tools (20,693) (1,286)Stock in trade 98,617 (55,043)Trade debts (121,688) 72,811 Loans and advances 55,357 24,868 Trade deposits and short term prepayments (15,995) (12,264)Balances with statutory authorities - 34,000 Other receivables 2,319 947 Increase in current liabilities:Trade and other payables 144,213 75,299 Net cash used in working capital 142,130 139,332 CASH GENERATED FROM OPERATIONS 258,438 234,395 Finance cost paid (40,659) (13,539)Income tax paid (39,971) (19,808)NET CASH FROM OPERATING ACTIVITIES 177,808 201,048
CASH FLOWS FROM INVESTING ACTIVITIESCapital expenditure incurred (164,447) (43,432)Proceeds from disposal of property, plant and equipment 3,350 1,175 Investments - net 50,358 (168,827)Dividend received 700 500 Increase in long term deposits - NET CASH USED IN INVESTING ACTIVITIES (110,039) (210,584)
CASH FLOWS FROM FINANCING ACTIVITIESLong term financing - net 9,860 (7,356)Repayment of finance lease liabilities - net (227) - (Decrease) in short term borrowings - net (9,835) (47,595)Net Cash (Used In) Financing Activities (202) (54,951)Net Cash From / (Used In) Financing Activities 67,567 (64,487)Cash and cash equivalents at the beginning of the period 41,676 222,085 Cash and cash equivalents at the end of the period 109,243 157,598
The annexed notes form an integral part of this interim financial information.
Condensed Interim Cash Flow Statement (Un-Audited)For the period ended September 30, 2017
DIRECTORCHIEF EXECUTIVE OFFICER CHIEF FINANCIAL OFFICER
11
Share capital
Share premium
Revenue ReservesAvailable for sale reserve
TotalGeneral
Unapprop-riated profit
Sub total
---------------------------------------------------(Rupees in thousand)--------------------------------------------------
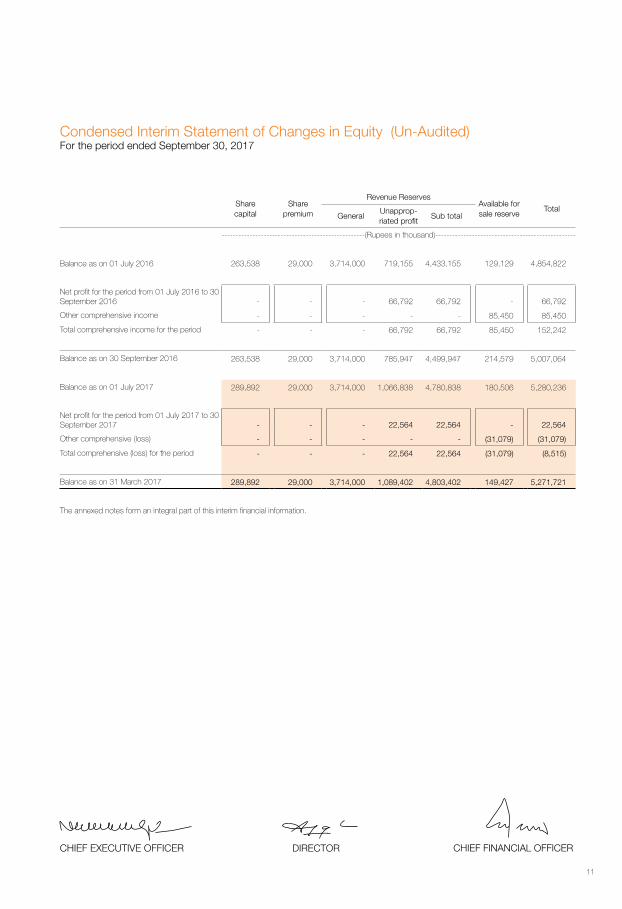
Balance as on 01 July 2016 263,538 29,000 3,714,000 719,155 4,433,155 129,129 4,854,822
Net profit for the period from 01 July 2016 to 30 September 2016 - - - 66,792 66,792 - 66,792
Other comprehensive income - - - - - 85,450 85,450
Total comprehensive income for the period - - - 66,792 66,792 85,450 152,242
Balance as on 30 September 2016 263,538 29,000 3,714,000 785,947 4,499,947 214,579 5,007,064
Balance as on 01 July 2017 289,892 29,000 3,714,000 1,066,838 4,780,838 180,506 5,280,236
Net profit for the period from 01 July 2017 to 30 September 2017 - - - 22,564 22,564 - 22,564
Other comprehensive (loss) - - - - - (31,079) (31,079)
Total comprehensive (loss) for the period - - - 22,564 22,564 (31,079) (8,515)
Balance as on 31 March 2017 289,892 29,000 3,714,000 1,089,402 4,803,402 149,427 5,271,721
The annexed notes form an integral part of this interim financial information.
Condensed Interim Statement of Changes in Equity (Un-Audited)For the period ended September 30, 2017
DIRECTORCHIEF EXECUTIVE OFFICER CHIEF FINANCIAL OFFICER

12 QUARTERLY REPORT SEPTEMBER 30, 2017
1. THE COMPANY AND ITS ACTIVITIES
Suraj Cotton Mills Limited (the Company) is a public limited company incorporated in Pakistan under the Companies Act, 1913 (Now Companies Ordinance, 1984). The registered office of the Company is located at 7-B-III, Aziz Avenue, Gulberg-V, Lahore. Its shares are quoted on Pakistan Stock Exchange Limited in Pakistan. The Company is engaged in the manufacturing, sale and trading of yarn, cloth and processing of cloth.
2. STATEMENT OF COMPLIANCE
2.1 This interim financial information of the Company for the six month period ended 31 December 2016 has been prepared in accordance with the requirements of the International Accounting Standard (IAS) 34, “Interim Financial Reporting” and provisions of and directives issued under the Companies Ordinance, 1984. In case where requirements differ, the provisions of or directives issued under the Companies Ordinance, 1984 have been followed.
2.2 This condensed interim financial statement is unaudited and is being submitted to shareholders, as required by section 245 of Companies Ordinance, 1984.
3. BASIS OF PREPARATION
3.1 The interim condensed financial statements do not include all the information and disclosures required in the annual financial statements, and should be read in conjunction with the annual financial statements as at 30 June 2017.
3.2 The interim condensed financial statements do not include all the information and disclosures required in the annual financial statements, and should be read in conjunction with the annual financial statements as at 30 June 2017.
3.3 The Company has adopted the following amended International Financial Reporting Standards (IFRSs ) which became effective during the period:
IFRS 10 - Consolidated Financial Statements
IFRS 12 - Disclosure of Interests in Other Entities
IAS 27 - Separate Financial Statements - Investment Entities: Applying the Consolidation Exception (Amendment)
IFRS 11 - Joint Arrangements - Accounting for Acquisition of Interest in Joint Operation (Amendment)
IAS 1 - Presentation of Financial Statements - Disclosure Initiative (Amendment)
IAS 16 - Property, Plant and Equipment and IAS 38 intangible assets - Clarification of Acceptable Method
of Depreciation and Amortization (Amendment)
IAS 16 - Property, Plant and Equipment IAS 41 Agriculture - Agriculture: Bearer Plants (Amendment)
IAS 27 - Separate Financial Statements - Equity Method in Separate Financial Statements (Amendment)
Improvements to Accounting Standards Issued by the IASB.
IFRS 5 - Non-current Assets Held for Sale and Discontinued Operations - Changes in methods of disposal
IFRS 7 - Financial Instruments: Disclosures - Servicing contracts
IFRS 7 - Financial Instruments: Disclosures - Applicability of the offsetting disclosures to condensed interim
financial statements.
IAS 19 - Employee Benefits - Discount rate: regional market issue
IAS 34 - Interim Financial Reporting - Disclosure of information 'elsewhere in the interim financial report'
Selected Notes To The Interim Financial Information (Un-Audited)For the period ended September 30, 2017

13
Selected Notes To The Interim Financial Information (Un-Audited)For the period ended September 30, 2017
The adoption of the above amendments and interpretation did not have any significant impact on this condensed interim financial statements.
4 ACCOUNTING ESTIMATES AND JUDGMENTS
The preparation of condensed interim financial information requires management to make judgements, estimates and assumptions that affect the application of accounting policies and reported amount of assets and liabilities, income and expenses. Actual results may differ from these estimates. The significant judgments made by management in applying the Company’s accounting policies and the key sources of the estimation are the same as those that applied to the financial statements for the year ended 30 June 2017.
Un-Audited Audited
Note Sep 30,
2017 June 30,
2017
( Rupees in thousand )
5. LONG TERM FINANCING - secured
Opening balance 2,370,242 287,773
Financing during the period / year - net 9,860 2,082,469
2,380,102 2,370,242
Less: Current portion 45,261 62,767
2,334,841 2,307,475
6. CONTINGENCIES AND COMMITMENTS
Contingencies
- There has been no significant change in the contingencies since the date of preceding published annual financial statements.
Commitments
- As on balance sheet date the commitments in respect of capital expenditure was amounted to Rs. 481,076 thousand (June 30, 2017: Rs. 280,710 thousand).
7. PROPERTY, PLANT AND EQUIPMENT
Operating fixed assets - tangible (7.1) 2,391,481 2,441,092
Assets subject to finance lease (7.2) 3,125 3,290
Capital work-in-progress 2,665,009 2,508,148
5,059,615 4,952,530
7.1 Operating fixed assets - tangible
Opening book value 2,441,092 2,291,827
Add: Additions during the period / year -cost (7.1.1) 7,586 390,489
2,448,678 2,682,316
Less: deletions during the period / year 6,081 42,969

14 QUARTERLY REPORT SEPTEMBER 30, 2017
2,442,597 2,639,347
Less: depreciation during the period / year 51,116 198,255
Book value at the end of the period / year 2,391,481 2,441,092
7.1.1 Additions during the period / year - cost
Land - 13,510
Plant and machinery 2,129 325,985
Electric installations - 1,461
Office equipment - 20,712
Vehicles 5,457 28,821
7,586 390,489
7.2 Assets subject to finance lease
Opening book value 3,290 4,113
Add: Additions during the period / year -cost - -
Less: Depreciation during the period / year 165 823
Book value at the end of the period / year 3,125 3,290
8. LOANS AND ADVANCES
Considered good:
Loans to employees 5,928 5,406
Advances to suppliers 43,305 95,034
Advance against letter of credit 12,159 16,309
61,392 116,749
9. SHORT TERM INVESTMENTS
Available for sale 9.1 1,345,124 1,326,457
Held for trading 9.2 468,555 582,663
1,813,679 1,909,120
9.1 AVAILABLE FOR SALE
Related party - unquoted 2,200 2,200
Related party - quoted 49,960 38,735
Other - quoted 1,200,812 1,162,292
1,252,972 1,203,227
Unrealized gain on revaluation of investment - net 149,429 180,506
Impairment (loss) (57,277) (57,277)
1,345,124 1,326,457
9.2 HELD FOR TRADING
Others-quoted 468,555 582,663
468,555 582,663
Un-Audited Audited
Sep 30, 2017
June 30,2017
Note ( Rupees in thousand )
Selected Notes To The Interim Financial Information (Un-Audited)For the period ended September 30, 2017

15
Un-Audited Audited
Sep 30, 2017
June 30,2017
( Rupees in thousand )
10. SALES
Export 126,653 280,559
Local 1,959,007 1,701,860
Waste 71,628 61,173
2,157,288 2,043,592
11. COST OF SALES
Raw material consumed 1,473,131 1,442,471
Sizing expenses 13,750 14,254
Stores, spares and loose tools consumed 58,156 30,246
Packing materials 21,438 24,013
Salaries, wages and other benefits 190,804 171,024
Fuel and power 252,169 238,302
Repairs and maintenance 11,436 11,260
Insurance 6,514 6,677
Depreciation 47,454 44,865
Other factory overheads 4,969 3,326
2,079,821 1,986,438
Work-in-process:
Opening stock 104,445 106,511
Closing stock (119,297) (113,261)
(14,852) (6,750)
Cost of goods manufactured 2,064,969 1,979,688
Finished goods:
Opening stock 715,798 574,949
Closing stock (753,252) (634,321)
(37,454) (59,372)
2,027,515 1,920,315
12. OTHER OPERATING EXPENSES
Workers profit participation fund 1,070 6,797
Workers welfare fund - 2,583
Others 1,162 1,239
2,232 10,619
Selected Notes To The Interim Financial Information (Un-Audited)For the period ended September 30, 2017

16 QUARTERLY REPORT SEPTEMBER 30, 2017
Un-Audited
Sep 30, 2017
June 30,2017
( Rupees in thousand )
13. OTHER OPERATING INCOME
Exchange (loss) - net (381) -
Profit on bank deposits 370 1,273
Dividend income 700 500
Net gain / (loss) of short term investment (14,003) 64,411
Sale of empties and scrap 1,380 756
Gain on disposal of operating fixed assets 1,987 231
(9,947) 67,171
14. TAXATION
Charge for the period:
Current 713 32,803
713 32,803
Selected Notes To The Interim Financial Information (Un-Audited)For the period ended September 30, 2017
17
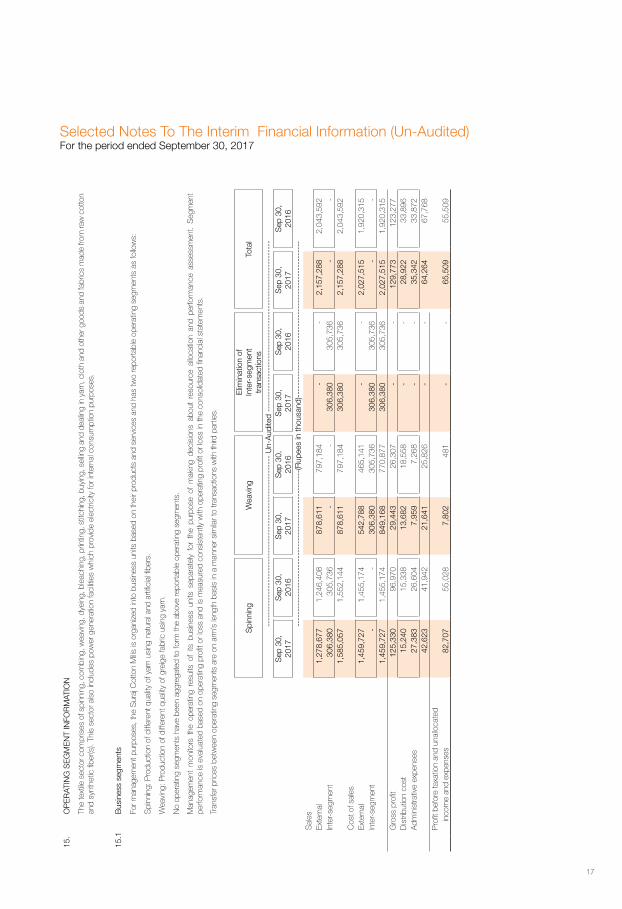
15.
OP
ER
ATIN
G S
EG
ME
NT
INFO
RM
ATIO
N
The
text
ile s
ecto
r com
pris
es o
f spi
nnin
g, c
ombi
ng, w
eavi
ng, d
yein
g, b
leac
hing
, prin
ting,
stit
chin
g, b
uyin
g, s
ellin
g an
d de
alin
g in
yar
n, c
loth
and
oth
er g
oods
and
fabr
ics
mad
e fro
m ra
w c
otto
n an
d sy
nthe
tic fi
ber(s
). Th
is s
ecto
r als
o in
clud
es p
ower
gen
erat
ion
faci
litie
s w
hich
pro
vide
ele
ctric
ity fo
r int
erna
l con
sum
ptio
n pu
rpos
es.
15.1
Bus
ines
s se
gmen
ts
For m
anag
emen
t pur
pose
s, th
e S
uraj
Cot
ton
Mills
is o
rgan
ized
into
bus
ines
s un
its b
ased
on
thei
r pro
duct
s an
d se
rvic
es a
nd h
as tw
o re
porta
ble
oper
atin
g se
gmen
ts a
s fo
llow
s:
Spi
nnin
g: P
rodu
ctio
n of
diff
eren
t qua
lity
of y
arn
usin
g na
tura
l and
arti
ficia
l fibe
rs.
Wea
ving
: Pro
duct
ion
of d
iffer
ent q
ualit
y of
gre
ige
fabr
ic u
sing
yar
n.
No
oper
atin
g se
gmen
ts h
ave
been
agg
rega
ted
to fo
rm th
e ab
ove
repo
rtabl
e op
erat
ing
segm
ents
.
Man
agem
ent
mon
itors
the
ope
ratin
g re
sults
of
its b
usin
ess
units
sep
arat
ely
for
the
purp
ose
of m
akin
g de
cisi
ons
abou
t re
sour
ce a
lloca
tion
and
perfo
rman
ce a
sses
smen
t. S
egm
ent
perfo
rman
ce is
eva
luat
ed b
ased
on
oper
atin
g pr
ofit o
r los
s an
d is
mea
sure
d co
nsis
tent
ly w
ith o
pera
ting
profi
t or l
oss
in th
e co
nsol
idat
ed fi
nanc
ial s
tate
men
ts.
Tran
sfer
pric
es b
etw
een
oper
atin
g se
gmen
ts a
re o
n ar
m’s
leng
th b
asis
in a
man
ner s
imila
r to
trans
actio
ns w
ith th
ird p
artie
s.
Spi
nnin
gW
eavi
ngE
limin
atio
n of
Inte
r-se
gmen
t tr
ansa
ctio
nsTo
tal
----
----
----
----
----
----
----
----
----
----
----
----
----
----
-- U
n-A
udite
d --
----
----
----
----
----
----
----
----
----
----
----
----
----
----
Sep
30,
20
17S
ep 3
0,
2016
Sep
30,
20
17S
ep 3
0,
2016
Sep
30,
20
17S
ep 3
0,
2016
Sep
30,
20
17S
ep 3
0,
2016
----
----
----
----
----
----
----
----
----
----
----
----
----
-(R
upee
s in
thou
sand
)---
----
----
----
----
----
----
----
----
----
----
----
----
--S
ales
Ex
tern
al
1,2
78,6
77
1,2
46,4
08
878
,611
7
97,1
84
-
-
2,1
57,2
88
2,0
43,5
92
Inte
r-se
gmen
t 3
06,3
80
305
,736
-
-
3
06,3
80
305
,736
-
-
1
,585
,057
1
,552
,144
8
78,6
11
797
,184
3
06,3
80
305
,736
2
,157
,288
2
,043
,592
C
ost o
f sal
esEx
tern
al
1,4
59,7
27
1,4
55,1
74
542,
788
465
,141
-
-
2
,027
,515
1
,920
,315
In
ter-
segm
ent
-
-
306
,380
3
05,7
36
306
,380
3
05,7
36
-
-
1,4
59,7
27
1,4
55,1
74
849,
168
770
,877
3
06,3
80
305
,736
2
,027
,515
1
,920
,315
G
ross
pro
fit 1
25,3
30
96,
970
29,
443
26,
307
-
-
129
,773
1
23,2
77
Dis
tribu
tion
cost
15,
240
15,
338
13,
682
18,
558
-
-
28,
922
33,
896
Adm
inis
trativ
e ex
pens
es 2
7,38
3 2
6,60
4 7
,959
7
,268
-
-
3
5,34
2 3
3,87
2 4
2,62
3 4
1,94
2 2
1,64
1 2
5,82
6 -
-
6
4,26
4 6
7,76
8 P
rofit
bef
ore
taxa
tion
and
unal
loca
ted
in
com
e an
d ex
pens
es 8
2,70
7 5
5,02
8 7,
802
481
-
-
6
5,50
9 5
5,50
9
Selected Notes To The Interim Financial Information (Un-Audited)For the period ended September 30, 2017

18 QUARTERLY REPORT SEPTEMBER 30, 2017
Spi
nnin
gW
eavi
ngE
limin
atio
n of
Inte
r-se
gmen
t tr
ansa
ctio
nsTo
tal
----
----
----
----
----
----
----
----
----
----
----
Un-
Aud
ited
----
----
----
----
----
----
----
----
----
----
----
----
----
----
--S
ep 3
0,
2017
Sep
30,
20
16S
ep 3
0,
2017
Sep
30,
20
16S
ep 3
0,
2017
Sep
30,
20
16S
ep 3
0,
2017
Sep
30,
20
16--
----
----
----
----
----
----
----
----
----
----
----
----
---(
Rup
ees
in th
ousa
nd)-
----
----
----
----
----
----
----
----
----
----
----
----
----
Una
lloca
ted
inco
me
and
expe
nses
:O
ther
ope
ratin
g ex
pens
es (2
,232
) (1
0,61
9)O
ther
ope
ratin
g in
com
e /
(loss
) (9
,947
) 6
7,17
1 Fi
nanc
e co
st (3
0,05
3) (1
2,46
6) (4
2,23
2) 4
4,08
6 P
rofit
bef
ore
taxa
tion
23,
277
99,
595
Taxa
tion
713
3
2,80
3 P
rofit
for t
he y
ear
22,
564
66,
792
Inte
r seg
men
t sal
es a
nd p
urch
ases
hav
e be
en e
limin
ated
on
cons
olid
atio
n.
Oth
er d
iscl
osur
esC
apita
l exp
endi
ture
164
,447
4
3,43
2 -
-
-
-
1
64,4
47
43,
432
Un-
audi
ted
Aud
ited
Un-
audi
ted
Aud
ited
Un-
audi
ted
Aud
ited
Un-
audi
ted
Aud
ited
Sep
30,
20
17
Sep
30,
20
16
Sep
30,
20
17
Sep
30,
20
16
Sep
30,
20
17
Sep
30,
20
16
Sep
30,
20
17
Sep
30,
20
16
----
----
----
----
----
----
----
----
----
----
----
----
----
----
----
----
----
--(R
upee
s in
thou
sand
)---
----
----
----
----
----
----
----
----
----
----
----
---
Ope
ratin
g A
sset
s 3
,415
,025
3
,421
,559
1
,182
,618
1
,156
,591
-
-
4
,597
,643
4
,578
,150
15.2
Geo
grap
hica
l seg
men
ts
Sec
onda
ry in
form
atio
n is
repo
rted
geog
raph
ical
ly.Th
e C
ompa
ny o
pera
tes
in o
nly
one
geog
raph
ical
seg
men
t i.e
. P
akis
tan,
as
the
Com
pany
has
no
dist
ingu
isha
ble
com
pone
nt o
ther
than
Pak
ista
n th
at is
eng
aged
in p
rovi
ding
pro
duct
s w
ithin
a
parti
cula
r eco
nom
ic e
nviro
nmen
t.
Selected Notes To The Interim Financial Information (Un-Audited)For the period ended September 30, 2017
19
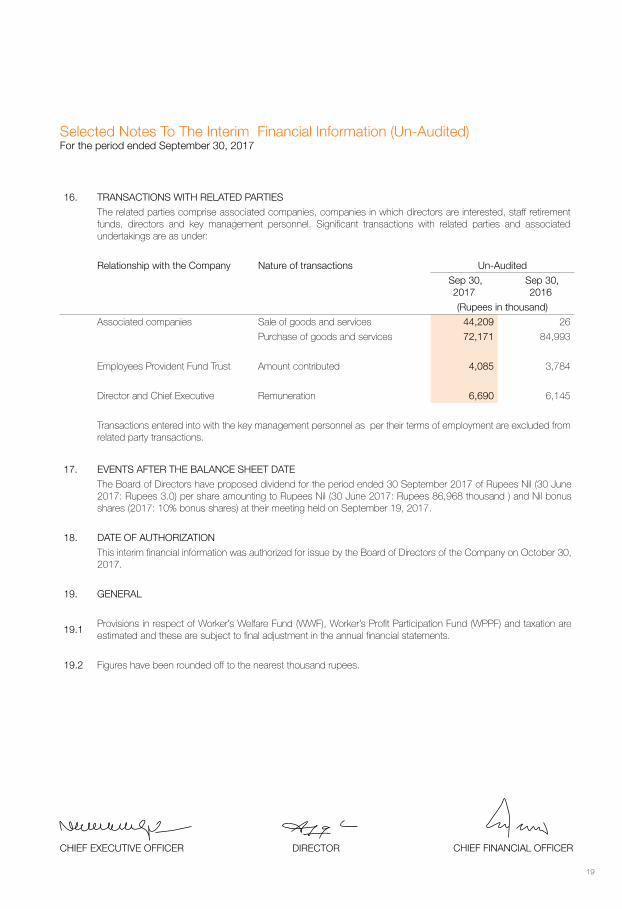
17. EVENTS AFTER THE BALANCE SHEET DATE
The Board of Directors have proposed dividend for the period ended 30 September 2017 of Rupees Nil (30 June 2017: Rupees 3.0) per share amounting to Rupees Nil (30 June 2017: Rupees 86,968 thousand ) and Nil bonus shares (2017: 10% bonus shares) at their meeting held on September 19, 2017.
18. DATE OF AUTHORIZATION
This interim financial information was authorized for issue by the Board of Directors of the Company on October 30, 2017.
19. GENERAL
19.1Provisions in respect of Worker’s Welfare Fund (WWF), Worker’s Profit Participation Fund (WPPF) and taxation are estimated and these are subject to final adjustment in the annual financial statements.
19.2 Figures have been rounded off to the nearest thousand rupees.
Selected Notes To The Interim Financial Information (Un-Audited)For the period ended September 30, 2017
DIRECTORCHIEF EXECUTIVE OFFICER CHIEF FINANCIAL OFFICER
16. TRANSACTIONS WITH RELATED PARTIES
The related parties comprise associated companies, companies in which directors are interested, staff retirement funds, directors and key management personnel. Significant transactions with related parties and associated undertakings are as under:
Relationship with the Company Nature of transactions Un-Audited
Sep 30, 2017
Sep 30, 2016
(Rupees in thousand)
Associated companies Sale of goods and services 44,209 26
Purchase of goods and services 72,171 84,993
Employees Provident Fund Trust Amount contributed 4,085 3,784
Director and Chief Executive Remuneration 6,690 6,145
Transactions entered into with the key management personnel as per their terms of employment are excluded from related party transactions.


[email protected]+92 42 35760381 +92 42 35760376
7-B III, Aziz Avenue,Gulberg-V, Lahore - Pakistan
Suraj Cotton Mills Limited
SURAJ COTTON MILLS LIMITED
QURATERLYREPORT
September 302017
Un-Audited