qut digital repository: //eprints.qut.edu.au/ ... cooking pizza, smoking, candle vaporizing...
TRANSCRIPT
QUT Digital Repository: http://eprints.qut.edu.au/
This is the accepted version of the following journal article:
He, Congrong, Morawska, Lidia, Hitchins, Jane, & Gilbert, Dale (2004) Contribution from indoor sources to particle number and mass concentrations in residential houses. Atmospheric Envrionment, 38(21), pp. 3405‐3415.
© Copyright 2004 Elsevier

12:16 PM 11/03/2011
1
Contribution from indoor sources to particle number and mass concentrations in residential houses
Congrong He1
, Lidia Morawska1, Jane Hitchins1, Dale Gilbert2,
1International Laboratory for Air Quality and Health, Queensland University of
Technology, Brisbane, QLD 4001, Australia 2Built Environment Research Unit, Queensland Department of Public Works,
Brisbane, QLD 4001, Australia
Abstract
As part of a large study investigating indoor air in residential houses in Brisbane,
Australia, the purpose of this work was to quantify emission characteristics of indoor
particle sources in 14 houses. Submicrometer particle number and approximation of
PM2.5 concentrations were measured simultaneously for more than 48 hours in the
kitchen of all the houses by using a condensation particle counter (CPC) and a
photometer (DustTrak), respectively. In addition, characterizations of particles
resulting from cooking conducted in an identical way in all the houses were measured
by using a scanning mobility particle sizer (SMPS), an aerodynamic particle sizer
(APS) and a DustTrak. All the events of elevated particle concentrations were linked
to indoor activities using house occupants diary entries, and catalogued into 21
different types of indoor activities. This enabled quantification of the effect of indoor
sources on indoor particle concentrations as well as quantification of emission rates
from the sources. For example, the study found that frying, grilling, stove use,
toasting, cooking pizza, smoking, candle vaporizing eucalyptus oil and fan heater use,
could elevate the indoor submicrometer particle number concentration levels by more
than 5 times, while PM2.5 concentrations could be up to 3, 30 and 90 times higher than
the background levels during smoking, frying and grilling, respectively.

12:16 PM 11/03/2011
2
Keywords: indoor air quality, indoor emission sources, ultrafine particles, emission
rates, submicrometer particles,
1. INTRODUCTION
Both indoor and outdoor sources contribute to and affect the concentration and
composition of particles in indoor air. There is usually more information available on
emission characteristics, such as emission factors or emission rates, of outdoor
particle sources than of indoor sources. However, quantification of emissions from
indoor sources is very important for assessment of total human exposure to particles.
As a result of the operation of certain indoor sources, particle concentration levels
indoors could be temporarily or even for prolonged periods of time elevated up to
tenfold compared to the situation without the sources. This can have a significant
effect on human health.
A large number of indoor particle sources have been identified and emissions from
these sources investigated by many studies reported in the literature. The most
significant sources include tobacco smoking, cooking, kerosene heating and wood
burning (eg Tuckett et al., 1998, Long et. al., 2000). Other sources or human activities
contributing to elevated levels of indoor particles include re-suspension of particles by
people and pets, dusting and vacuuming, showering, operation of humidifiers, electric
motors, etc (eg Monn et al., 1995; Tucker, 2000).
Combustion processes are the main indoor sources of smaller particles, with the vast
majority of them in the submicrometer range, containing a host of organic and
inorganic material (Morawska and Zhang, 2002). Re-suspension of particles by

12:16 PM 11/03/2011
3
human movement on the other hand, contributes to the coarse mode of indoor
particles, usually in the size above one micrometer.
Secondary particles in the indoor environment are formed from gaseous pollutants
through the process of gas-to-particle conversion. For example, Rohr et al., (2003)
reported the effect of reactions between ozone and selected terpenes on the
concentration and size distributions of airborne particles in a chamber setting. Their
results demonstrated that ozone/terpene reactions could be a significant source of
submicrometer secondary particles in indoor settings.
Quantitative assessment of indoor source emission characteristics in real situations is
a complex task, and therefore only qualitative information about the contribution of
many indoor particle sources, or about indoor ranges of concentration levels as a
result of operation of the sources is available. Emissions from tobacco smoking have
attracted considerable attention and as a result there is more information available on
emission rates from this, compared to other indoor sources (eg Brauer et al. 2000).
The existing database is limited to particle mass emission rates with only a few
studies reported on particle number emission rates. However, since smaller particles,
which can be high in number but contribute very little to particle mass, have a higher
probability of penetration into the deeper parts of the respiratory tract (eg James et al,
1991), and also contain higher levels of trace elements and toxins such as the
polycyclic aromatic hydrocarbons and mutagens (eg Kiss et al., 1998), they have been
a subject of increasing concern. Recent health effects studies have also suggested that
number concentration may be a more appropriate predictor of health effects than mass
concentration (eg Penttinen et al., 2001; Stephenson et. al., 2003). Thus, it is clear that
knowledge of particle number emission rates or factors is of importance for exposure
assessment and for developing of appropriate control strategies.

12:16 PM 11/03/2011
4
As part of a large study investigating various aspects of indoor air in residential
houses in Brisbane, Australia, the purpose of this work was to investigate the
emission characteristics of the most common indoor particle sources. The specific
objectives of the study included: (1) identification of the main indoor sources
contributing to the elevated number and mass (PM2.5) concentration levels; (2)
quantitative evaluation of the effect of these sources on indoor particle concentration
levels; (3) estimation of the emission strength of the sources; (4) characterization and
comparison of particle size distributions resulting from cooking conducted in an
identical way in different types of residential houses under normal and minimum
ventilation conditions. It was expected that cooking activities would be one of the
major source of indoor particles and the hypothesis was that stove properties affect
characteristics of emissions resulting from cooking
2. EXPERIMENTAL METHOD
2.1. Sampling site and house
Detailed information about the sampling site and the houses included in this study has
been provided earlier (Morawska et al. 2001). Briefly, a residential suburb in Brisbane
of a reasonably flat topography and with a good mix of houses, both in terms of age
and of style ie. newer and older houses, brick and timber, high set and low set, was
chosen as the measurement site. Thirteen houses in the suburb were chosen for the
study and one additional house was chosen from another suburb as a comparison site.
2.2. Instrumentation
Particle size and number concentration measurements were conducted using three
different instruments: (1) the TSI Model 3320 Aerodynamic Particle Sizer (APS) (TSI

12:16 PM 11/03/2011
5
Incorporated, St. Paul, MN, USA), which measures particle size distribution and
number concentration in real time, in the range from 0.5 to 20 m and up to the order
of 102 or 103 particle cm-3 for coincidence errors of 1% and 5% respectively; (2) the
TSI Model 3934 Scanning Mobility Particle Sizer (SMPS) (TSI Incorporated, St.
Paul, MN, USA), which was set to measure particle size distribution and number
concentration, in the range from 0.015 to 0.685 m, and (3) the TSI Model 3022A
Condensation Particle Counter (CPC) (TSI Incorporated, St. Paul, MN, USA), which
measured the total number concentration of submicrometer particles in the size range
from 0.007 to 0.808 m.
For the purpose of this paper particles measured by the SMPS and CPC are called
submicrometer particles, while the particles measured by the APS, are called
supermicrometer particles.
Approximation of fine particle mass concentration (PM2.5) was measured by the TSI
Model 8520 DustTrak aerosol monitor (TSI Incorporated, St. Paul, MN, USA). It
should be noted that the DustTrak operates based on a light scattering technique
where the amount of scattered light is proportional to the volume concentration of the
aerosol. The approximation of PM2.5 values obtained in this study using this
instrument are not actual gravimetric values, as the instrument was not calibrated for
each specific aerosol studied. For simplification, all the DustTrak results discussed in
this paper are referred to as PM2.5, omitting the term ‘approximation’.
The TSI Model 8551 Qtrak (Q-Trak - TSI Incorporated, St. Paul, MN, USA) was
employed to measure CO2 concentrations, which was used to estimate air exchange
rates (AER).

12:16 PM 11/03/2011
6
These instruments were chosen as the most suitable for indoor studies because of their
low flow rates (and thus negligible impact on particle concentrations indoors), quiet
operation and their short sampling times (10 and 30 seconds for CPC and DustTrak,
respectively).
2.3. Sampling protocol
The experiments consisted of three parts: air exchange rate (AER) measurement,
controlled cooking test, and time series of indoor particle concentration measurement.
All measurements (except House1) were conducted between May and July 1999,
which is wintertime in Brisbane.
Knowledge of AER is important for determination of source emission rates measured
in real residential houses. Before commencement of measurements in the houses, a
comparison test between CO2 and SF6 methods for measuring AER was conducted in
a room at the International Laboratory for Air Quality and Health, Queensland
University of Technology. The results were comparable for the two methods. Under
normal ventilation conditions the SF6 method yielded 3.15 air changes per hour
(ACH) and the CO2 method 3.34 ACH; under minimum ventilation condition: SF6 –
0.96 ACH, CO2 – 0.76 ACH,). Since the method using CO2 decay is cheaper (did not
require renting of an instrument) and is widely used in AER measurement, it was
chosen for the measurements in the houses. During the measurements of the AER the
occupants were not present in the houses and CO2 was released until its concentration
was at least three times higher than the background level. The Q-Trak monitor was
used to record the decay of the CO2 concentration.
For the cooking test, the APS, SMPS and DusTrak were employed and measurements
were conducted under both normal and minimum ventilation conditions for each
house. Normal ventilation condition means all the door and windows of the house,

12:16 PM 11/03/2011
7
which are normally opened, stayed opened during the measurements. Minimum
ventilation condition means that all the doors and windows of the house were closed.
The procedure for the cooking test was as follows: 10 minutes of background
concentration measurements in the kitchen, followed by measurements during 10
minutes of cooking (half an onion was sliced and placed in a small frying pan
containing 1 spoonful of vegetable oil, and the stove was switched onto high.), and
then by a further 20 minutes of measurements after the cooking ceased. Cooking tests
were conducted first under minimum ventilation conditions, and then under normal
ventilation conditions (in all houses with the exception of House7). These controlled
cooking tests provided information about characteristics of particle size distribution
and number median diameter resulting from one particular source (frying), which
could be compared between the houses. The data obtained from the test was used for
calculation of particle emission rates in conjunction with AER and other house data.
For indoor time series concentration measurements, a CPC and DustTrak were
employed. PM2.5 and particle number concentrations were measured simultaneously
for more than 48 hours in the kitchen of all the houses. The CPC and DustTrak were
placed side-by-side and positioned on average two metres from the stove in the
kitchen. The occupants of the houses were asked to fill in a diary, noting the time and
duration of any activity occurring throughout the house during the time of the
measurements. From the time series concentration data and the information about
indoor activities, contribution from the individual indoor sources or activities was
qualitatively identified. Then in conjunction with AER and other house data this
information was used to calculate sources emission rates according to the method
described below.
2.4. Calculation of air exchange rate

12:16 PM 11/03/2011
8
The tracer gas technique involves injecting a tracer gas and mixing it through the
house, then measuring its decay rate with an appropriate instrument. If exfiltration
rates of the tracer gas are constant, mixing is uniform, the chemical reaction between
the gas and other chemicals is negligible and no indoor source of the gas is operating,
the air exchange rate, , can be calculated from the following equation (Nantka,
1990):
0
ln1
C
C
tt (1)
where t is time, Ct and C0 are concentrations of the gas at times t and 0, respectively.
Equation 1 was used for calculation of AER of the houses in this study based on
measured CO2 decay rates.
2.5. Estimation of source emission rates
Residential houses in Brisbane do not normally use air filtration systems. This means
that the principal factors governing the levels of airborne particles indoors are the
contributions from indoor and outdoor sources, the deposition rate of particles on
indoor surfaces, and the air exchange rate (eg Thatcher and Layton, 1995). A formula
for calculation of indoor particle concentration levels taking into consideration these
factors can be written as follows (Koutrakis et al. 1992, Chen et al., 2000):
ins
outin C
V
QCP
dt
dC)( (2)
where Cin and Cout are the indoor and outdoor particle concentrations, respectively; P
is the penetration efficiency; is the air exchange rate; k is the deposition rate; Qs is
the indoor particle generation rate; t is time; and V is the efficient volume of the
house. A number of previous studies discussed the use of this equation for

12:16 PM 11/03/2011
9
determination of source emissions and prediction of indoor air pollutant concentration
levels (eg Dockery et al., 1981; Ott 1999). All the factors in this equation, with the
exception of the efficient volume of the house (V), are functions of some other factors
and can vary in time (for example penetration efficiency is a function of particle size).
In order to estimate the average emission rate ( sQ ), Equation 2 is simplified by using
average values instead of functions and also by making some further assumptions
about the experimental conditions. The penetration efficiency (P) is commonly
assumed to be close to one for both fine and coarse particles (Wallace 1996).
However, it should be noted that a number of studies indicated that the penetration
efficiency and its variability is higher for fine particles than for coarse ones (eg Abt et
al., 2000a; Long et al., 2001). In addition, for conditions when no indoor source is in
operation, the indoor particle concentration can be approximated by outdoor particle
concentration (Morawska et. al. 2001), and the initial indoor particle concentration
(Cin0) could be used to replace outdoor particle concentrations. Thus, Equation 2 can
be written as:
00int
)( ininin
s CCT
CCVQ (3)
where ( sQ ) is average emission rate, Cint and Cin0 are the peak and initial indoor
particle concentrations, respectively; is the average air exchange rate; is the
average total removal rate; T is time difference between initial and peak
concentration. This equation ignores the effects of processes involving particles, such
as condensation, evaporation or coagulation, since these are minor effects under
particle concentrations and conditions normally encountered in residential
environments (eg Thatcher and Layton, 1995). Equation (3) has most commonly been
12:16 PM 11/03/2011
10
used for particle mass concentration and emission calculations (mass balance
equation), but it can also be used for calculations of particle number concentration and
emissions.
Using the average decay rate of indoor particle concentration after the indoor activity
ceased (the source stoped operating), the average total removal rate can be
obtained. The average air exchange rate for each house was determined
experimentally for two different ventilation conditions through CO2 decay test. Thus,
Equation 3 can be used to determine indoor source particle emission rates, using the
above data on the total removal rate, air exchange rate and background concentration
(initial indoor concentration).
2.6. Data processing and analysis
All statistical analyses (correlation, regression, t-test, One-Way ANOVA) were
conducted using a statistical analysis software package – SPSS for Windows version
10 (SPSS Inc.). A level of significance of p = 0.05 was used for all statistical
procedures. When the distribution of the data was not a normal distribution, the robust
analysis (trim off the maximum and minimum) was employed.
3. RESULTS AND DISCUSSION
3.1 Source identification and emission rate
Analyses of particles time series concentration data collected over 48 hours in each
house and comparison of this data with the entries in the residents’ diaries enabled
identification of the activities, which contributed to the elevated particle concentration
levels. A total of 153 events were identified for which elevated concentrations were

12:16 PM 11/03/2011
11
matched with a diary entry for specific activities. All the events linked to indoor
activities were catalogued into 21 different types of indoor activities. One of the most
common activities, cooking, was defined as any food preparation using stove not
involving frying or grilling, without restricting, however, the number of dishes cooked
simultaneously (e.g. boiling pasta and cooking sauce).
In addition to the events linked to indoor sources, there were a number of events when
elevated indoor concentrations resulted from particles generated by outdoor sources,
such as neighbour burning off rubbish, smoking outside or opening of the door. These
events have also been included in the analyses to enable comparison between the
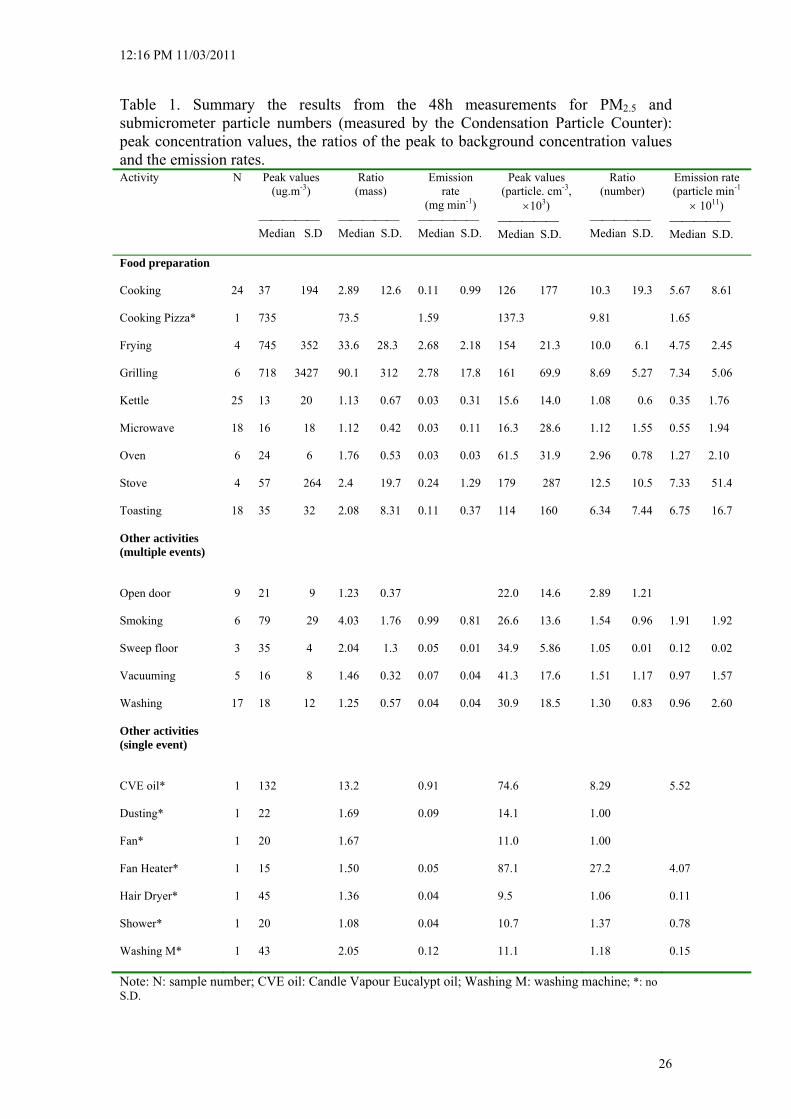
effects of indoor and outdoor particle sources. Table 1 presents a list of the types of
activities the identified together with the frequency of their occurrence, median peak
concentration of PM2.5 and submicrometer particle number resulting from the type of
activity. Included in Table 1 are also the ratios of peak to background values and
estimated particle PM2.5 and submicrometer number emission rates for the specific
activities.
3.1.1 PM2.5 concentrations and emission rates
While there are large errors associated with the concentration levels presented in
Table 1 for all the activities, it can be seen that some activities result in particularly
high indoor PM2.5 concentrations. These include frying (median peak value: 745 g
m-3
), grilling (718 g m-3
), candle vaporizing eucalyptus oil (132 g m-3
) and
smoking (79 g m-3
). The high median peak concentrations caused by these activities
may result in excedence of the US EPA PM2.5 24h standards of 65 g m-3
in the
houses where such activities are conducted, provided that duration of the activity is
sufficiently long. Indoor concentration levels are significantly elevated as a result of

12:16 PM 11/03/2011
12
these activities, as can be concluded from the ratios of concentrations during the
activity to the background level. There was an increase over the background by 89, 32
and 3 during grilling, frying and smoking, respectively.
As could be expected from the above discussion, the estimated PM2.5 emission rates
from frying, grilling, cooking pizza, smoking and vaporizing eucalyptus oil were the
highest compared with other indoor particle emission sources investigated in this
study. The emission rates derived from this study can be compared with those
presented in the literature, however, for some activities the comparison is not
straightforward since the classification of the activity as described in the literature was
not necessarily the same as in this study.
For example, Wallace (1996) concluded from a review of three major studies on
particle concentrations in US homes, that cooking results in emission of 1.70.6 mg
minute-1 of PM2.5, and sources other than cooking and smoking in emission of about
0.0180.017 mg minute-1. Thus, the estimate of emission rates from cooking is higher
than in this study (0.11 mg minute-1), however it was not specified in the review how
the cooking was conducted or whether it included frying or grilling, which both have
very high emission rates. This value is, however, within the range of values found in
this study for emission rates related to various types of cooking activities and ranging
from 0.03 mg minute-1 (microwave) to 2.78 mg minute-1 (grilling).
The emission rate of 0.99 mg minute-1 resulting from tobacco smoking found in this
study is comparable to the results presented in the literature. For example, Klepeis et.
al., (1999) measured respirable suspended particle (PM3.5) emitted in a residence
where smoking took place. They found that the average particle emission rate of
PM3.5 ranged from 0.98 mg minute-1 (cigar) to 1.9 mg minute-1 (Marblboro cigarette).
Brauer et al., (2000) conducted a measurement of cigarette smoking by using a
12:16 PM 11/03/2011
13
nephelometer in environmental chamber settings and found that the particle emission
rate of PM2.5 was 1.67 mg minute-1. Other researchers characterised tobacco smoking
in terms of emission factors, which could be compared to emission rates only if the
duration of smoking was known. For example, Özkaynak et al., (1996) reported the
emission factor for PM2.5 to be 13.8± 3.6 mg cigarette-1.
PM2.5 emission rates from candle burning ranging from 0.055 to 0.443 mg minute-1
depending on the burning rate were reported by Fine et. al., (1999). The emission rate
of candle vaporizing eucalyptus oil of 0.91 mg minute-1 found in this study was about
twice as the high as the higher end of the range reported by Fine et. al., (1999), which,
however, it is not surprising considering that both candle burning and eucalyptus oil
vaporising result in particle emissions.
Data presented in Table 1 also indicate how outdoor particle sources affect indoor
particle concentration levels. For example PM2.5 concentration levels could be
elevated by about 20%, due to opening the outside door.
3.1.2. Particle number concentrations and emission rates
The ratios of peak to background values for submicrometer particle number
concentrations presented in Table 1 indicate that some types of indoor activities, such
as cooking, frying, grilling, stove use, toasting, cooking pizza, smoking, candle
vaporizing eucalyptus oil and fan heater use, can elevate the indoor particle number
concentrations by a factor ranging from over one to over twenty seven. By
comparison with the average outdoor submicrometer particle number concentration in
Brisbane of 7.4103 particle cm-3 (Morawska et. al. 1999), it could be seen that the
median peak values of indoor concentrations were found to be fifteen times higher
during cooking, frying, grilling, toasting, cooking pizza and stove use. Another

12:16 PM 11/03/2011
14
conclusion from Table 1 is, that indoor particle number concentration levels were
elevated by about 180% due to opening the outside door.
Table 1 also provides estimates of particle number emission rates for the source types
investigated. It is difficult to compare this data with the literature, as there is very
limited information available on particle number emission rates. For example, a study
of particle number emission rates of a vacuum cleaner motor was conducted by Lioy
et. al. (1999) for particles in the size range from 0.3 to 0.5 m. The authors found that
the emission rates ranged from 0.079 to 2.83 108 particle minute-1, which is much
less than found in this study (970108 particle minute-1). The difference is not
surprising, taking that most particle emissions from the cleaner motor brushes during
routine operation are below 0.3 μm in diameter (Helsper et al., 1993), and were thus
not measured by Lioy et. al. (1999), while they were measured in this study.
3.1.3. Discussion
A number of conclusions can be drawn from analysis of the results presented in Table
1. One of them is that some activities result in higher emissions in terms of particle
number, but not in terms of mass, and vice versa, while some activities result in
higher emissions in both (e.g. frying and grilling). This means that each type activity
results of emission of particles in a specific size range. For example, a fan heater is a
strong emitter in terms of particle number but not in terms of mass, while sweeping
floors is a high contributing activity in terms of mass but not in terms of number. This
finding supports the theory and the conclusions presented in the literature. For
example, early studies by Lefcoe and Inculet (1975) found that household activities
such as cleaning or children playing have a pronounced effect on indoor
concentrations of particles with diameters greater than 1 m and a smaller effect on

12:16 PM 11/03/2011
15
particles with diameters less than 1 m. The same conclusion can be drawn from this
study, where PM2.5 ratio of peak to background values for dusting is 1.69, but the
number ratio is 1.00. Recently, Abt et. al., (2000) reported that oven cooking and
toasting contributed primarily to submicrometer particles, sautéing and cleaning to
supermicrometer particles and frying contributed to both.
Another conclusion is that contribution from the same types of activities could
significantly differ for different environments. An example of this is re-suspension of
particles during indoor activities, which has been shown to be an important factor
influencing the indoor particle concentration in occupied residential houses. For
example, Kamens et al., (1991) found that vacuuming, causes a significant increase in
the concentration of particles with diameters greater than 2.5 m. In this study a range
of different results were obtained in relation to vacuuming conducted in different
houses. For example, in House15 the PM2.5 concentration during vacuuming increased
from 15 to 31 g m-3
, while the concentration of particle number did not increase
significantly (from 2.06104 to 2.3810
4 (particle cm
-3)). However, for House16, the
PM2.5 concentration did not increase significantly (from 13 to 14 (g m-3
)), while the
concentration of particles number increased more significantly (from 5.3103 to
5.88104 (particle cm
-3)). One possible reason is that since different types of vacuum
cleaners were used in the two houses the emission rates of particle numbers by the
vacuum cleaner could have been different. Another possible reason is that the houses
differed in general cleanliness levels (eg one house vacuumed regularly, while the
other irregularly), which affects the reservoir of particles available for re-suspension.
Thirdly, the effect of outdoor air and the activities conducted outdoors on indoor
particles can vary significantly. For example, during the neighbour burning off

12:16 PM 11/03/2011
16
rubbish, both PM2.5 concentration and the concentration of particle number increased
significantly: from 13 to 90 g m-3
and from 14.3103 to 45.210
3 particle cm
-3,
respectively. However, opening the door after one of the houses was closed for
several hours when no strong outdoor source was identified, resulted in a decrease in
PM2.5 concentration from 32 to 25 g m-3
, but a sharp increase in the particle number
concentration from 6.4103 to 2.6210
4 particle cm
-3. The changes in mass and
number concentrations were rapid and occurred in nine and five minutes, respectively.
3.2 Cooking test
The APS, SMPS and DustTrak were employed for the cooking test, and the
measurements were conducted under both normal and minimum ventilation
conditions for each house. The ratios of peak to background concentrations for all the
houses as well as median values of the ratios are presented in Figure 1 and Figure 2;
summary of particle emission rates and particle median diameter is presented in Table
2.
Figure 1 and Figure 2 show that the impact of cooking on indoor particle
concentration levels varied from house to house, but it is clear that as a result of
cooking, indoor particle concentration levels were elevated for both ventilation
conditions (the ratio of the concentrations was always higher than one). From
comparison of the two figures, it can be seen, that generally the impact of cooking on
indoor particle number concentration levels are higher for minimum than that for
normal ventilation conditions.
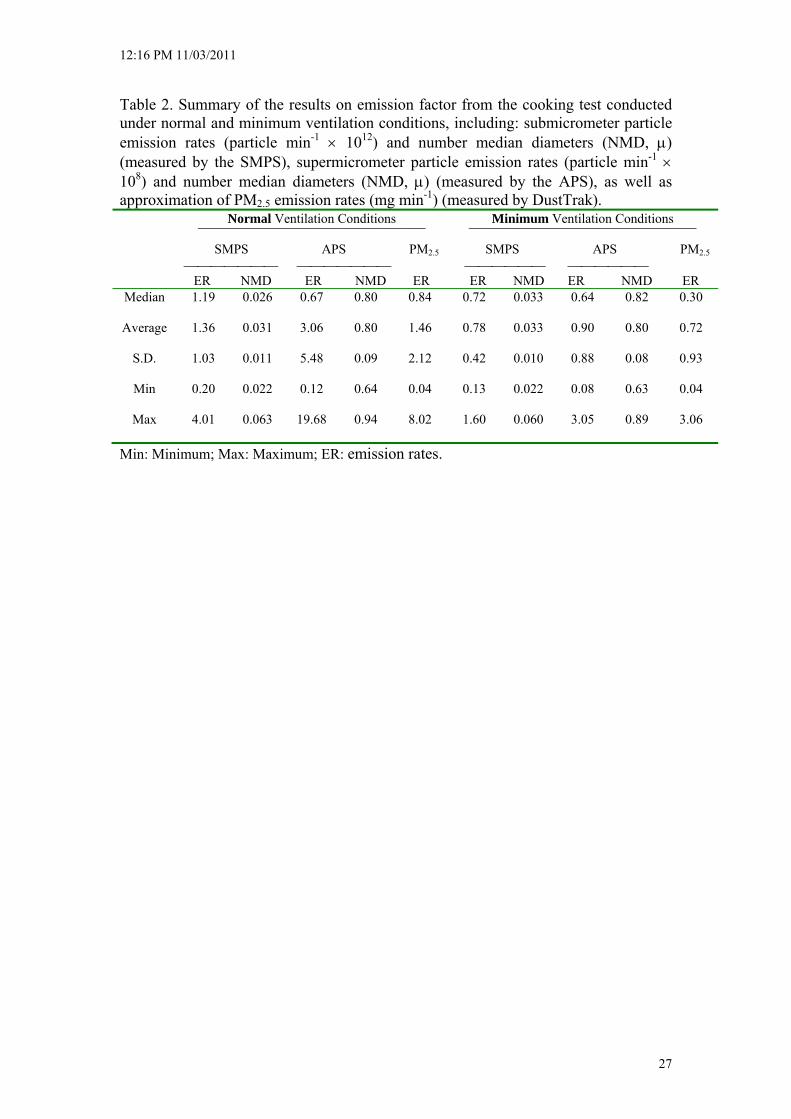
Inspection of the results presented in Table 2 indicates that even though the same
procedure of cooking was carried and the same cooking material was used, the
emission characterisations (emission rate and number median diameter) varied from

12:16 PM 11/03/2011
17
house to house. This proves the hypothesis that stove properties and factors such as
most likely stove temperature, affect characteristics of emissions resulting from
cooking. Particle number size distribution resulting from cooking was always
unimodal with the number median diameter ranging from 0.022 to 0.063 µm and from
0.64 to 0.94 µm for particles in the ranges 0.015 to 0.685 m and 0.5 to 20 m,
respectively.
Statistical analysis (t-test) of the data obtained from the cooking tests demonstrated
that indoor particle concentrations, including particle number and PM2.5, under
minimum or normal ventilation conditions, were significantly elevated as a result of
cooking (p < 0.05), with the exception of particle number concentration in the range
0.5 to 20 m under normal ventilation concentration. The K-S test results for cooking
test confirmed that emissions from cooking can have significant impacts on indoor
submicrometer size distributions, however, not on indoor supermicrometer size
distributions, for many houses.
Statistical analysis (t-test) also demonstrated that there were no significant (p = 0.05)
differences between the two ventilation conditions in any of the characteristics of
indoor particles generated by cooking (e.g. particle number and PM2.5 peak values,
emission rates and number median), with the exception of the ratios for
submicrometer particles (p = 0.018). This means that, as expected, the ventilation
condition did not affect the emission characterisation in any visible way. However,
ventilation conditions affect the decay behaviour of the generated aerosols by
cooking. Statistical analysis of the results indicates that the decay rates of particle
number and mass under normal ventilation conditions were significantly higher than
those under minimum ventilation conditions (p = 0.05).

12:16 PM 11/03/2011
18
Among all these houses, only two of them (House13 and House15) were equipped
with gas stoves, while all the other houses use electric stoves. It was expected that gas
combustion might result in generation of higher numbers of particles in the
submicrometer range. However, the results of statistical analysis (t-test) of all the
characteristics (peak values, ratios, emission rates and number median diameter under
both ventilation conditions) indicate that there were no significant (p=0.05)
differences between the two types of stove, which is likely due to a small number of
houses sampled.
Analysis of time series results for the cooking test indicates that in most cases there is
a time delay in the increase in PM2.5 and supermicrometer particle concentrations
compared with the increase in concentration of submicrometer particles. This is likely
to be due to coagulation of the aerosol, which results in the shift in particle size
distribution towards larger sizes with time. While this process alone does not change
the mass of airborne particles, however, larger particles are detected by the DustTrack
with higher efficiency, therefore there is an increase in the measured PM2.5 recorded.
Figure 3 and Figure 4 present typical examples of this phenomenon under minimum
and normal ventilation conditions, respectively. From these figures it is also evident
that the decay rate under minimum ventilation condition is clearly lower than that
under normal ventilation condition. The particle concentration levels decrease to
background levels about 15 minutes after conclusion of cooking under normal
ventilation condition (Figure 4), while they are still in high (two times higher than
background levels) after 45 minutes after conclusion of cooking under minimum
ventilation condition (Figure 3).
Literature review demonstrates that the peak values of particle concentration and
number median diameter (NMD) during cooking varied between studies. For

12:16 PM 11/03/2011
19
example, the NMD for submicometer particles generated by cooking was 60 nm, 54
nm, and 30 nm as reported by Stoute et.al. (1984), Tu and Knutson (1988) and Strong
(1988), respectively. Li et. al. (1993) investigated characteristics of submicrometer
and ultrafine particles (small than 0.1 m) resulting from cooking scrambled eggs and
frying chicken in a residential apartment. They found that the peak values ranged
from 1.12105 to 1.8010
5 particle cm
-3 with NMD ranging from 33 to 47 nm for
scrambled eggs. For frying chicken peak values ranged from 1.20105 to 2.6010
5
particle cm-3
with average NMD of 60 nm. The average peak values in this study of
1.65~1.77105 particle cm
-3 are comparable with the results of the above-mentioned
studies. However, in this study the ultrafine particles constituted about 95% of total
submicrometer particles, which is higher than the 80-85% contribution reported by Li
et. al. (1993).
4. CONCLUSIONS
In this study particle number and mass concentration levels were measured in 14
residential houses for a period of 48 hours and the residents of the houses kept diaries
of the activities conducted. Particle number concentration was measured in two size
ranges: from 0.007 to 0.808 m (called submicrometer particles for the purpose of
this study) and from 0.5 to 20 m (called supermicrometer particles). Particle mass
concentration was measured as an approximation of PM2.5 concentrations. In addition
a cooking test was conducted in each house according to an identical procedure, in
order to investigate the impact of stove and house ventilation conditions on the
emission and concentration characteristics of particles. It should be noted that

12:16 PM 11/03/2011
20
submicrometer particle number concentration measured during the cooking test was in
the size range from 0.015 to 0.685 m.
The most important achievement of this study is the quantification of the effect of
indoor sources on indoor particle concentration level and emission rates from twenty
types of indoor sources or activities. Such data in relation to particle number
emissions has so far been largely unavailable. The study showed that indoor activities
affect indoor particle concentration levels, with the degree of effect depending on the
type of the source and on house characteristics.
Among the indoor activities recorded in this study, cooking, frying, grilling, stove
use, toasting, making pizza, smoking, candle vaporising eucalyptus oil and fan heater
use were showed to elevate the indoor particle number concentrations in the range
from 1.5 to over 27 times. Indoor approximation of PM2.5 concentrations showed an
increase over the background by 3, 30 and 90 times during smoking, grilling and
frying respectively. The results of cooking tests give insight into the characterisations
of cooking as a source of particles and indicate that even though the same procedure
of cooking was carried and the same cooking material was used, the emission
characterisations (emission rate and number median diameter) varied from house to
house.
ACKNOWLEDGMENTS
This project was funded by the Built Environment Research Unit, Queensland
Department of Public Works, and Australian Research Council, through SPIRT grant
No. C69804416. The assistance of Ray Duplock, Keith Eigeland and Chris
Greenaway is gratefully acknowledged. Members of the ILAQH, QUT, in particular,

12:16 PM 11/03/2011
21
Milan Jamriska and Steve Thomas, are appreciated for their discussions and
assistance with this study. The authors would like to express their special gratitude to
the owners and occupants of the houses for their help and in assisting with this
project. Without their help and assistance, this project could not have been conducted
successfully.
REFERENCES
Abt E., Suh H.H., Allen G. Koutrakis P. 2000. Characterization of indoor particle
sources: A study conducted in the metropolitan Boston area. Environmental
Health Perspectives. 108(1), 35-44.
Abt. E., Suh, H.H., Catalano, P., Koutrakis, P. 2000a. Relative contribution of outdoor
and indoor particle sources to indoor concentrations. Environmental Science &
Technology 34(17), 3579-3587.
Brauer, M., Hirtle, R., Lang, B., Ott, W., 2000. Assessment of indoor fine aerosol
contributions from environmental tobacco smoke and cooking with a portable
nephelometer. Journal of Exposure Analysis & Environmental Epidemiology.
10(2), 136-144.
Chen, Y.C., Zhang, Y.H., Barber, E.M., 2000. A dynamic method to estimate indoor
dust sink and source. Building & Environment. 35(3), 215-221.
Dockery, D., Spengler, J., 1981. Indoor-outdoor relationships of respirable sulfates
and particles. Atmospheric Environment, 15, 335-343.
Fine, P.M., Cass, G.R., Simoneit, B.R.T., 1999. Characterization of fine particle
emissions from burning church candles. Environmental Science & Technology.
33(14), 2352-2362.

12:16 PM 11/03/2011
22
Helsper, C., Mölter, W., Löffler, F., Wadenpohl, C., Kaufmann, S., Wenninger, G.,
1993. Investigations of a new aerosol generator for the production of carbon
aggregate particles, Atmospheric Environment 27 (A): 1271-1275.
James, A.C., Stahlhofen, W., Rudolf, G., Egan, M.J., Nixon, W., Gehr, P., Briant,
J.K., 1991. The respiratory tract deposition model proposed by the ICRP task
group. Radiation Protection Dosimetry. 38, 159-165.
Kamens, R., Lee, C.T., Weiner, R., Leith, D., 1991. A study to characterize indoor
particles in three non-smoking homes. Atmospheric Research. 25A(5/6), 939-
948.
Kiss, G., Vargapuchony, Z., Rohrbacher, G., Hlavay, J., 1998. Distribution of
polycyclic aromatic hydrocarbons on atmospheric aerosol particles of different
sizes. Atmospheric Research. 46, (3-4 Special Issue SI), 253-261.
Klepeis, N.E., Ott, W.R., Repace, J.L., 1999. The effect of cigar smoking on indoor
levels and particles. Journal of Exposure Analysis & Environmental
Epidemiology. 9(6), 622-635.
Koutrakis, P., Briggs, S., Leaderer, B., 1992. Source apportionment of indoor aerosols
in Suffolk and Onondaga Counties, New York. Environmental Science &
Technology. 26, 521-527.
Lefcoe, N.M., Inculet, I.I., 1975. Particulates in domestic premises II. Ambient levels
and indoor-outdoor relationship. Archives of Environmental Health, 30, 565-
570.
Li, C.S., Lin, W.H., Jenq, F.T., 1993. Size distributions of submicrometer aerosols
from cooking. Environment International. 19, 147-154.

12:16 PM 11/03/2011
23
Lioy, P.J., Wainman, T., Zhang, J.F., Goldsmith, S., 1999. Typical household vacuum
cleaners: The collection efficiency and emissions characteristics for fine
particles. Journal of the Air & Waste Management Association. 49(2), 200-206.
Long, C.M., Suh, H.H., Catalano, P.J., Koutrakis, P., 2001. Using time- and size-
resolved particulate data to quantify indoor penetration and deposition behavior.
Environmental Science & Technology 35(10), 2089-2099.
Long, C.M., Suh, H.H. Koutrakis, P., 2000. Characterization of indoor particle
sources using continuous mass and size monitors. Journal of the Air & Waste
Management Association. 50(7), 1236-1250.
Monn, Ch., Fuchs, A., Kogelschatz, D., Wanner, H.U., 1995. Comparison of indoor
and outdoor concentrations of PM-10 and PM-2.5. Journal of Aerosol Science,
26, S515-S516
Morawska, L,, Thomas, S., Gilbert, D., Greenaway, C., Rijinders, E., 1999. A study
of the horizontal and vertical profile of submicrometer particles in relation to a
busy road. Atmospheric Environment 33, 1261-1274
Morawska, L., Zhang, J., 2002. Combustion sources of particles: Health relevance and
source signatures. Chemosphere. 49(9), 1045-1058.
Morawska, L., He, C., Hitchins, J., Gilbert, D., Parappukkaran, S., 2001. The
relationship between indoor and outdoor airborne particles in the residential
environment. Atmospheric Environment. 35, 3463-3473.
Nantka, M., 1990. Comparison of Different Methods for Airtightness and Air Change
Rate Determination. Air Change Rate and Airtightness in Buildings, ASTM
STP 1067, M.H. Sherman, Ed, American Society for Testing and Materials,
Philadelphia, 267-282.

12:16 PM 11/03/2011
24
Ott, W.R., 1999. Mathematical models for predicting indoor air quality from smoking
activity. Environmental Health Perspectives. 107(Suppl 2), 375-381.
Özkaynak, H., Xue, J., Spengler, J., Wallace, L., Pellizzari, E., Jenkins, P., 1996.
Personal Exposure to Airborne Particles and Metals - Results From The Particle
Team Study In Riverside, California. Journal of Exposure Analysis &
Environmental Epidemiology. 6(1), 57-78.
Penttinen, P., Timonen, K.L., Tiittanen, P., Mirme, A., Ruuskanen, J., Pekkanen, J.,
2001. Ultrafine particles in urban air and respiratory health among adult
asthmatics. European Respiratory Journal, 17 (3), 428-435
Rohr, A.C., Weschler, C.J., Koutrakis, P., Spengler, J.D., 2003. Generation and
quantification of ultrafine particles through terpene/ozone reaction in a chamber
setting. Aerosol Science And Technology, 37 (1), 65-78.
Stephenson, D., Seshadri, G., Veranth, J.M, 2003. Workplace exposure to submicron
particle mass and number concentrations from manual arc welding of carbon
steel. AIHA JOURNAL, 64 (4), 516-521.
Stoute, J.R.D, Groen, G.C.H., De Groot T.J.H., 1984. Characterization of indoor
atmospheres. Radiation protection dosimetry. 7, 159-163.
Strong, J.C., 1988. The size of attached and unattached radon daughters in room air.
Journal of Aerosol Sciences. 19: 1327-1330.
Thatcher, T.L., Layton, D.W., 1995. Deposition, resuspension, and penetration of
particles within a residence. Atmospheric Environment, 29(13), 1487-1497.
Tu, K.W., Knutson, E.O., 1988. Indoor outdoor aerosol measurements for two
residential buildings in New Jersey. Aerosol Science and Technology. 9, 71-82.
Tucker, W.G., 2000. An overview of PM2.5 sources and control strategies. Fuel
Processing Technology. 65, 379-392.

12:16 PM 11/03/2011
25
Tuckett, C.J., Holmes, P., Harrison, P.T., 1998. Airborne particles in the home.
Journal of Aerosol Science, 29. Suppl. 1, S293-S294.
Wallace, L., 1996. Indoor particles: A review. Journal of the Air & Waste
Management Association. 46, 98-126.
12:16 PM 11/03/2011
26
Table 1. Summary the results from the 48h measurements for PM2.5 and submicrometer particle numbers (measured by the Condensation Particle Counter): peak concentration values, the ratios of the peak to background concentration values and the emission rates. Activity N Peak values
(ug.m-3)
Median S.D
Ratio (mass)
Median S.D.
Emission rate
(mg min-1) Median S.D.
Peak values (particle. cm-3,
103) Median S.D.
Ratio (number)
Median S.D.
Emission rate (particle min-1
1011) Median S.D.
Food preparation
Cooking
Cooking Pizza*
Frying
Grilling
Kettle
Microwave
Oven
Stove
Toasting
Other activities (multiple events)
Open door
Smoking
Sweep floor
Vacuuming
Washing
Other activities (single event)
CVE oil*
Dusting*
Fan*
Fan Heater*
Hair Dryer*
Shower*
Washing M*
24
1
4
6
25
18
6
4
18
9
6
3
5
17
1
1
1
1
1
1
1
37 194
735
745 352
718 3427
13 20
16 18
24 6
57 264
35 32
21 9
79 29
35 4
16 8
18 12
132
22
20
15
45
20
43
2.89 12.6
73.5
33.6 28.3
90.1 312
1.13 0.67
1.12 0.42
1.76 0.53
2.4 19.7
2.08 8.31
1.23 0.37
4.03 1.76
2.04 1.3
1.46 0.32
1.25 0.57
13.2
1.69
1.67
1.50
1.36
1.08
2.05
0.11 0.99
1.59
2.68 2.18
2.78 17.8
0.03 0.31
0.03 0.11
0.03 0.03
0.24 1.29
0.11 0.37
0.99 0.81
0.05 0.01
0.07 0.04
0.04 0.04
0.91
0.09
0.05
0.04
0.04
0.12
126 177
137.3
154 21.3
161 69.9
15.6 14.0
16.3 28.6
61.5 31.9
179 287
114 160
22.0 14.6
26.6 13.6
34.9 5.86
41.3 17.6
30.9 18.5
74.6
14.1
11.0
87.1
9.5
10.7
11.1
10.3 19.3
9.81
10.0 6.1
8.69 5.27
1.08 0.6
1.12 1.55
2.96 0.78
12.5 10.5
6.34 7.44
2.89 1.21
1.54 0.96
1.05 0.01
1.51 1.17
1.30 0.83
8.29
1.00
1.00
27.2
1.06
1.37
1.18
5.67 8.61
1.65
4.75 2.45
7.34 5.06
0.35 1.76
0.55 1.94
1.27 2.10
7.33 51.4
6.75 16.7
1.91 1.92
0.12 0.02
0.97 1.57
0.96 2.60
5.52
4.07
0.11
0.78
0.15
Note: N: sample number; CVE oil: Candle Vapour Eucalypt oil; Washing M: washing machine; *: no S.D.
12:16 PM 11/03/2011
27
Table 2. Summary of the results on emission factor from the cooking test conducted under normal and minimum ventilation conditions, including: submicrometer particle emission rates (particle min-1 1012) and number median diameters (NMD, ) (measured by the SMPS), supermicrometer particle emission rates (particle min-1 108) and number median diameters (NMD, ) (measured by the APS), as well as approximation of PM2.5 emission rates (mg min-1) (measured by DustTrak). Normal Ventilation Conditions
¯¯¯¯¯¯¯¯¯¯¯¯¯¯¯¯¯¯¯¯¯¯¯¯¯¯¯¯¯¯¯ SMPS APS PM2.5 ER NMD ER NMD ER
Minimum Ventilation Conditions ¯¯¯¯¯¯¯¯¯¯¯¯¯¯¯¯¯¯¯¯¯¯¯¯¯¯¯¯¯¯¯
SMPS APS PM2.5
ER NMD ER NMD ER Median
Average
S.D.
Min
Max
1.19
1.36
1.03
0.20
4.01
0.026
0.031
0.011
0.022
0.063
0.67
3.06
5.48
0.12
19.68
0.80
0.80
0.09
0.64
0.94
0.84
1.46
2.12
0.04
8.02
0.72
0.78
0.42
0.13
1.60
0.033
0.033
0.010
0.022
0.060
0.64
0.90
0.88
0.08
3.05
0.82
0.80
0.08
0.63
0.89
0.30
0.72
0.93
0.04
3.06
Min: Minimum; Max: Maximum; ER: emission rates.

12:16 PM 11/03/2011
28
0
5
10
15
20
25
30
35
40
45
50
55
H01 H032 H04 H05 H06 H07 H08 H09 H12 H13 H15 H16 H17 H18
House ID
Rat
io
SMPS APS PM2.5
SMPS Median Ratio: 8.08
APS Median Ratio: 4.13
PM2.5 Median Ratio: 6.85
Figure 1. The ratios of peak to background values for submicrometer (SMPS) and supermicrometer (APS) particle number concentrations and PM2.5 concentrations during cooking test under normal ventilation conditions.
0
10
20
30
40
50
60
70
80
90
100
110
H01 H032 H04 H05 H06 H07 H08 H09 H12 H13 H15 H16 H17 H18
House ID
Rat
io
SMPS APS PM2.5
APS Median Ratio: 7.88
SMPS Median Ratio: 37.3
PM2.5 Median Ratio: 5.81
Figure 2. The ratios of peak to background values for submicrometer (SMPS) and supermicrometer (APS) particle number concentrations and PM2.5 concentrations during cooking test under minimum ventilation conditions

12:16 PM 11/03/2011
29
0.0E+00
1.0E+04
2.0E+04
3.0E+04
4.0E+04
5.0E+04
6.0E+04
7.0E+04
8.0E+04
9.0E+04
1.0E+05
12:4
4
12:4
7
12:5
0
12:5
3
12:5
6
12:5
9
13:0
1
13:0
4
13:0
7
13:1
0
13:1
3
13:1
6
13:1
9
13:2
2
13:2
4
13:2
7
13:3
0
13:3
3
13:3
6
13:3
9
13:4
2
13:4
5
13:4
8
13:5
0
13:5
3
13:5
6
13:5
9
Time
SM
PS
, Nu
mb
er C
on
ce
ntr
atio
n (
pa
rtic
les
.cm
-3)
-
10
20
30
40
50
60
70
80
90
100
AP
S, N
um
be
r C
on
cen
tra
tio
n (
pa
rtic
les
.cm
-3X
10
-1)
PM
2.5 C
on
cen
tra
tio
n (
µg
.cm
-3)
SMPSAPSDustTrak
Sta
rt c
ooki
ng Sto
p c
oo
king
Figure 3. A typical example of changes in submicrometer (SMPS) and supermicrometer (APS) particle number concentration, as well as PM2.5 concentration with time during the cooking test under minimum ventilation condition (House32, 9/07/1999)
0.00E+00
2.00E+04
4.00E+04
6.00E+04
8.00E+04
1.00E+05
1.20E+05
1.40E+05
1.60E+05
16
:33
16
:36
16
:39
16
:42
16
:45
16
:48
16
:50
16
:53
16
:56
16
:59
17
:02
17
:05
17
:08
17
:11
17
:13
17
:16
Time
SM
PS
, N
um
be
r C
on
ce
ntr
ati
on
(p
arti
cle
s.c
m-3
)
0
50
100
150
200
250
300
350
400
450A
PS
, N
um
be
r C
on
ce
ntr
ati
on
(p
art
icle
s.c
m-3
)
PM
2.5
Co
nc
en
tra
tio
n (
µg
.cm
-3)
SMPS
APS
DustTrak
Sta
rt c
oo
kin
g
Sto
p c
ook
ing
Figure 4. A typical example of submicrometer particles concentration (SMPS), supermicrometer particle concentration and PM2.5 concentration variations with time during the cooking test under normal ventilation condition (House12, 12/05/1999)