r investors attitude towards f trading … · mutual fund investors with respect to factors of ......
TRANSCRIPT
AIMA Journal of Management & Research, May 2013, Volume 7, Issue 2/4, ISSN 0974 – 497 Copy right© 2013 AJMR-AIMA
ARTICLE NO.4
RETAIL INVESTORS’ ATTITUDE TOWARDS
FUTURES TRADING: AN EMPIRICAL INVESTIGATION
Dr. Agha Nuruzzaman
Asst. Professor, Department of Business Administration, Aligarh Muslim University Malappuram Centre, Kerala
Abstract: Futures contracts were introduced just as a risk management tool in the financial market. However, they can be used for price risk as well as to speculate, thereby attracting hedgers and speculators towards the market. Around 56% of the participants of Indian futures market are Retail Investors and their behavior comprehension happens to be a complex thing. The present study tries to focus on retail investors’ attitude towards futures trading. A total number of 411 respondents were taken for this study. Chi-square test (χ2) has been used to examine the statistical significance of investors with respect to their demographic factors. The results show that retail investors are prone to self-attribution bias which causes a tendency among them to make wrong decisions. If the investors earn money in futures trading they consider themselves to be very knowledgeable and capable, similarly if the investors incur losses, they attribute it to bad luck. They tend to use purchase price as the reference point and make decisions based on it. It is also found that most of the retail investors’ trade in futures is mostly for speculative purpose. Key Words: Futures Trading, Retail Investors, Attitude, Hedging, Speculation 1. Background of the Study A futures contract is an agreement between two parties to buy or sell an asset at a certain time in future for a certain price. It is a part of derivatives. Futures contracts were introduced just as a risk management tool in the financial market. However, they can be used for price risk as well as to speculate thereby attracting hedgers and speculators towards the market. The participants of Indian futures market are Retail investor, Institutional investor, and Proprietary. In 2009-10 their participation was 54.86, 13.61% and 31.635 respectively in terms of traded volume. It was found that retail investors play a remarkable role in Indian futures market. As their numbers have exploded, it has become increasingly more important to understand the minds, motivations, and decision-making styles of retail investors.

AIMA Journal of Management & Research, May 2013, Volume 7, Issue 2/4, ISSN 0974 – 497 Copy right© 2013 AJMR-AIMA
Retail investors’ behavior comprehension happens to be a complex thing. Economists, sociologists and psychologists have all attempted to explain investor behavior in various ways. Economists’ enquiry in investor behavior have focused largely on the ‘rationality’ or ‘irrationality’ of investor decision making process. Sociologists explain investor behavior by focusing on investors’ social environments. They suggest that investors may be trying to enhance their stature within a group or society in general. Psychologists have largely focused on the investor’s behavior on the basis of their attitudes, perceptions, and personality. But of course, there is a lot of overlap between the disciplines. There is an inclination for behavioral biases among the Indian investors during their investment decision making process. The experts of behavioral finance believe that individuals in investment decisions do not always act as rational beings, or perhaps they can’t by laws of nature. Their investment decisions are guided by their desires, goals, emotions and prejudices. It is also found that globally NSE (National Stock Exchange of India) ranked in the fifth position in terms of futures and options traded in 2010. Among the top ten equity index futures and options, the Indian S&P CNX Nifty Index Options comes in fourth position whereas S&P CNX Nifty Index Futures score the ninth rank. 2. Literature Review The various motives for investing are capital appreciation, income at specific time intervals, liquidity when required, safety and security of life, hedging against inflation and tax implications. Out of these, some are short-term and some are long-term. Investors are specifically differentiated on various parameters, and depending on the various attributes. Their investment decisions are influenced by various factors like risk taking capability, time frame, knowledge and information, taxable income, safety, availability of funds, cash reversibility and required return (Shrotriya,2007). Investors are perceived and analyzed differently by different studies. Bielard, Biehl and Kaiser have given the Five-way Model (1986) which classifies investors into five categories such as Individualists, Adventurers, Celebrities, Guardians and Straight arrows. Barnwell (1987) classified investors as either ‘passive’ or ‘active’. Myers (1999) classified investors as either: Cautious, Emotional, Technical, Busy, Casual or Informed. Gupta & Chandra (2011) found a significant difference between retail and non-retail mutual fund investors with respect to factors of ‘advertisement & shows’ and ‘published returns’; while the former is more important for the retail investors, and the latter is more important for the non-retail investors. The purpose or interest of person can be different for investment. One can invest by keeping the same objectives in mind such as extra income, appreciation of capital, safety, liquidity, hedge against inflation, tax planning, future plans, etc. All investments are risky; it means risk is always attached to every investment, but the purpose or interest of person can be different in investment (Suryavanshi, 2011). Index futures are in a way, a

AIMA Journal of Management & Research, May 2013, Volume 7, Issue 2/4, ISSN 0974 – 497 Copy right© 2013 AJMR-AIMA
magical instrument which helps not only in risk management, but also in returns forecasting, portfolio optimization and asset allocation (Jose, 2007). The study of Ansari & Jana (2009) has proved that some of the rational trader’s decision process is also guided by all these biases. So rational traders also will not be able to predict the mental behavior of noise traders and effect of sentiment will be at Indian stock Market. Miller & Ross (1975) studied that self-attribution bias is often used to explain the overconfidence in individuals. It is a tendency among individuals to attribute successes or good outcomes to their abilities, while putting the blame for failures or unfavorable outcomes on circumstances beyond their control or plain bad luck. Pavabutr (2002) found a common and most documented behavior bias in his empirical studies as ‘overreaction’. Investors overreact because they put more weight on the recent news, as compared to past data. People tend to be optimistic when the market goes up and get pessimistic when it comes down. Investors may overreact because complete and accurate information is never available. Even if it is assumed that such a set of information is made available to the public, their ability to process information is limited. Wood (2004) mention that individuals usually attribute their success to their personal abilities, and their failure to bad luck or the actions of others, which is referred to as the ‘self attribution bias’. Bhandari & Deaves (2006) found that if the stocks picked up do well, the investors take it as confirmation of their investing ability, but if the stock price falls, they cite the general condition of the economy or market as the reason for decline. Kahneman & Riepe (1998) found that investors who invest substantial amounts in a share usually take its purchase price as the reference point. They take the decisions to continue with a particular stock, based upon the difference between the current price and purchase price. Their reaction to changes in the price is thus relative to the initial purchase price. Angle (2007) examined the six common errors (cognitive biases, overconfidence, pain of regret, cognitive dissonance, anchoring, representativeness and myopic risk aversion) of perception and judgment. Each trait has implications for investment decision- making and investor behavior. Usually investors are unwilling to admit their mistakes. This leads to investors avoiding harsh decisions or delaying them. The result is that investors hold on to losing stocks and sell off potentially good stocks too soon. Abhijeet and Ravinder (2011) criticized that individual investors’ behaviour is motivated by a variety of psychological heuristics and biases. They make investment decisions based on heuristics; they assume price as decision-anchor and are overconfident in their judgments. They also found that investors’ investment behaviour is highly influenced by representativeness and they do lot of mental accounting in the sense of grouping their gains and losses while making decisions. Biais and Weber (2009) research “Hindsight Bias, Risk Perception, and Investment Performance” finds that hindsight bias reduces volatility estimates and more biased agents have lower performance. Lyn and Zychowicz (2010) study “The Impact of Faith-Based Screens on Investment Performance” gives evidence that faith-based funds mostly

AIMA Journal of Management & Research, May 2013, Volume 7, Issue 2/4, ISSN 0974 – 497 Copy right© 2013 AJMR-AIMA
outperform the market. They found that faith-based funds do better than socially responsible investing funds in general. In Choe and Ecm’s (2009) research “The disposition effect and investment performance in the futures market”, one of their findings shows that there is a negative relationship between the disposition effect and investment performance. Vanjeko (2010) identified that the knowledge about derivatives among investors was very low. 3. Research Gap A research problem, in general, refers to some difficulty which a researcher experiences in the context of either a theoretical or practical situation and wants to obtain a solution for the same (Kothari, 2005). Going through various literatures it is found that most of the studies conducted so far have focused on some aspects of investor behavior to the neglect of others. Some of them were conducted in countries other than India while some of them were long time back. It is observed that none of the studies belong to north India, specially focused on retail investors’ attitude toward futures trading. So it is an attempt to fill the gap. 4: Methodology A questionnaire has been framed to collect primary data for the study. Before collecting the data, a pilot test with 65 respondents was done. The reliability also checked through Cronbach’s alpha, and all the values were found more than 0.7. Finally 411 questionnaires were taken for this study. The survey was carried out in Delhi, NOIDA, Gurgaon, Agra and Aligarh during March- November 2010. The questionnaire has been entertained by only those respondents who trade in derivatives. Objective of the Study: To study the variation in the various dimensions of futures trading with respect to traders demographic variables. To study the perception of traders towards futures trading. To infer suggestions on the basis of the findings of the study. Hypothesis: There are five main hypotheses framed for the present test. These hypotheses deal with investors’ attitude in futures trading and their demographic influences on it. Most of the following hypotheses are based on the study of Mittal & Vyas (2009). H01 There is no significant variation in self attribution bias of the investors based on
their demographic variables (gender, education, income, age, occupation and experience).
H02 There is no significant variation in over-reaction of the investors based on their demographic variables (gender, education, income, age, occupation and
AIMA Journal of Management & Research, May 2013, Volume 7, Issue 2/4, ISSN 0974 – 497 Copy right© 2013 AJMR-AIMA
experience). H03 There is no significant variation in purchase price perception of the investors
based on their demographic variables (gender, education, income, age, occupation and experience).
H04 There is no significant variation in regret/loss avoidance of the investors based on their demographic variables (gender, education, income, age, occupation and experience).
H05 There is no significant variation in futures trading motives of the investors based on their demographic variables (gender, education, income, age, occupation and experience).
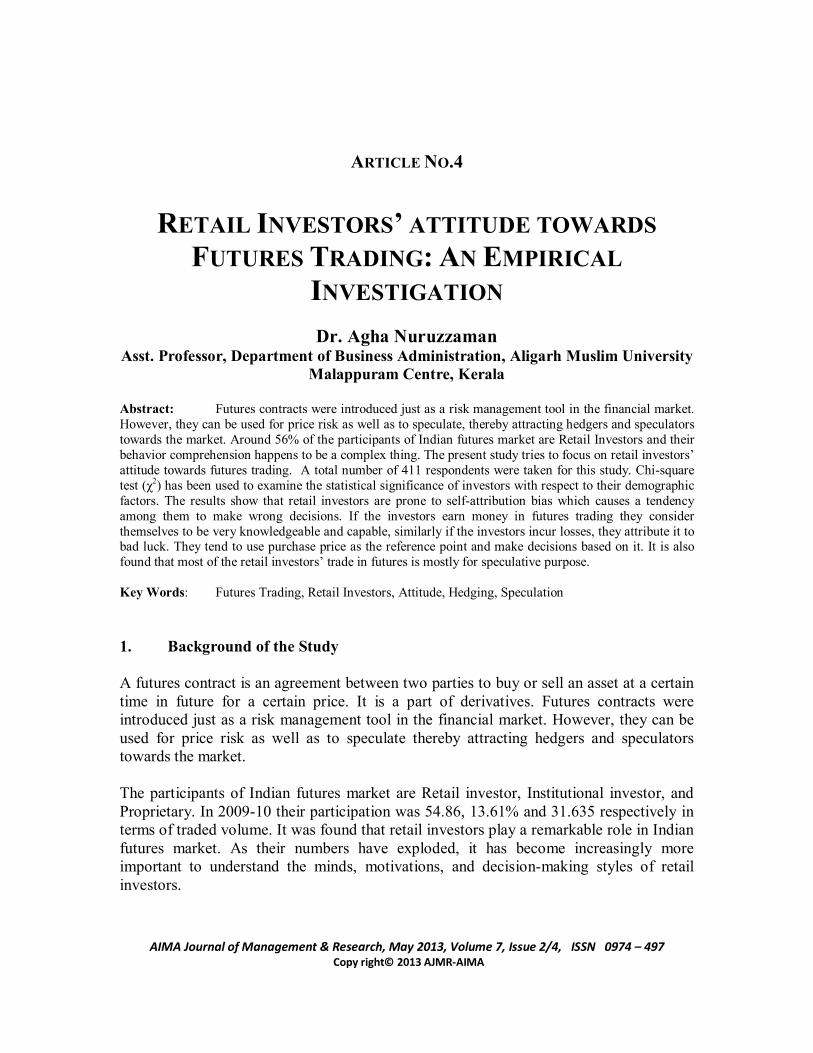
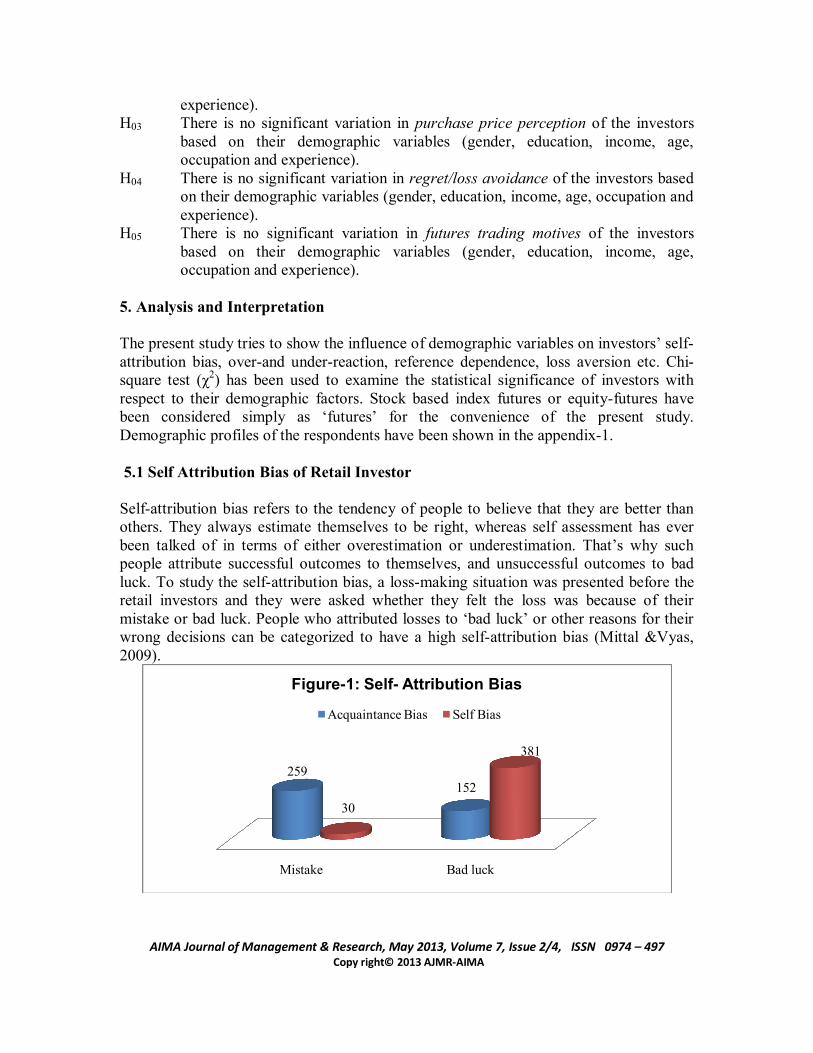
5. Analysis and Interpretation The present study tries to show the influence of demographic variables on investors’ self-attribution bias, over-and under-reaction, reference dependence, loss aversion etc. Chi-square test (χ2) has been used to examine the statistical significance of investors with respect to their demographic factors. Stock based index futures or equity-futures have been considered simply as ‘futures’ for the convenience of the present study. Demographic profiles of the respondents have been shown in the appendix-1. 5.1 Self Attribution Bias of Retail Investor Self-attribution bias refers to the tendency of people to believe that they are better than others. They always estimate themselves to be right, whereas self assessment has ever been talked of in terms of either overestimation or underestimation. That’s why such people attribute successful outcomes to themselves, and unsuccessful outcomes to bad luck. To study the self-attribution bias, a loss-making situation was presented before the retail investors and they were asked whether they felt the loss was because of their mistake or bad luck. People who attributed losses to ‘bad luck’ or other reasons for their wrong decisions can be categorized to have a high self-attribution bias (Mittal &Vyas, 2009).
Mistake Bad luck
259152
30
381
Figure-1: Self- Attribution Bias
Acquaintance Bias Self Bias

AIMA Journal of Management & Research, May 2013, Volume 7, Issue 2/4, ISSN 0974 – 497 Copy right© 2013 AJMR-AIMA
The results show that retail investors are prone to self-attribution bias (figure-1). When investors were asked about their acquaintances like friends, colleagues, etc. suffering from losses in futures market, around 63% of the respondents expressed belief that their acquaintance might have made a mistake in trading and only 37% blamed their acquaintances’ bad luck. When the same question was asked to the respondents, then only 7% of the investors admitted that they had made a mistake by choosing a wrong futures contract, while 93% of them blamed their bad luck for their wrong decision. It may be inferred that retail investors have a high self-attribution bias due to which they often make wrong decisions in futures trading. It could further be inferred that if self attribution bias is high then the investor would hardly try to locate the causes behind the losses and would simply blame it on bad luck. However if the self attribution bias is low then it may make the investor to take a personal responsibility for the losses and think about what probably went wrong. Thus, it may lead to the identification of factor(s) leading to the losses and one may refrain from committing similar mistakes in the future. To study whether the self-attribution bias varies significantly with investor’s demographic factors (Gender, Education, Income, Age, Occupation and Experience), the Chi-square test was applied (Table-1).
Table-1: Analysis of Self Attribution Bias with respect to Demographics SN Demographic
Factors Bias against their acquaintance
Self attribution bias
Chi-Square (χ2)
Df Sig. Chi-Square (χ2)
Df Sig.
1 Gender 26.506 1 .000* 7.943 1 .005* 2 Education 10.992 4 .027* 19.609 4 .001* 3 Income 44.672 3 .000* 30.041 3 .000* 4 Age 89.535 4 .000* 20.759 4 .000* 5 Occupation 39.057 4 .000* 40.840 4 .000* 6 Experience 38.069 4 .000* 79.936 4 .000*
From the results it is found that all the demographic factors show significant value, which is less than .05. Hence, it may be inferred that there exist significant differences in investors’ self attribution bias with respect to their demographic factors. Demographically different types of investors may have different levels of self attribution bias in futures trading. Based on the above results, H01 which states that there is no significant variation in self attribution bias of the investors based on their demographic variables (gender, education, income, age, occupation and experience) is not supported. 5.2 Retail Investor’s Overreaction in Futures Trading

AIMA Journal of Management & Research, May 2013, Volume 7, Issue 2/4, ISSN 0974 – 497 Copy right© 2013 AJMR-AIMA
The tendency of overreaction in the respondents was determined by asking them to indicate which of the sequence is more likely when a coin is tossed six times- HHHTTT or HTHTTH. One appeared systematic (HHHTTT), while the second appeared random (HTHTTH). Probability theory suggests that the probabilities of both the outcomes are equal, but most of the retail investors erroneously believe that the random sequence is more likely than the first. Most people are far too quick to perceive causal regularity in random sequence of events (Kahnemann & Riepe, 1998). Investors indicating HTHTTH are more likely to overreact (Mittal & Vyas 2009).
Figure-2 reveals that retail investors are prone to overreact by over-estimation. Around 66% of the respondents indicated the likelihood of the random sequence (HTHTTH) while only 34% appeared systematic (HHHTTT) on tossing of a coin. The level of sanity and balance represented by the regular HHHTTT symbol has few takers. Out of this test, it may be inferred that the respondents have a tendency of overreaction. The common tendency of investor’s overreaction may be due to the reason that they tend to put more weight on the recent news, as compared to past data. People tend to be optimistic when the market goes up and pessimistic, if the market comes down. Investors may overreact because complete and accurate information is never available (Mittal & Vyas, 2009). Even if it is assumed that such a set of information is made available to the public, their ability to process information is limited (Pavabutr, 2002), making them to settle for sub-optimal decisions.
Table-2: Analysis of Overreaction with respect to Demographics SN Demographic
Factors Investor’s Overreaction Chi-Square (χ2) Df Sig.
1 Gender .542 1 .462 2 Education 79.511 4 .000* 3 Income 86.154 3 .000* 4 Age 49.864 4 .000* 5 Occupation 37.165 4 .000* 6 Experience 72.172 4 .000*
HHHTTT(34%) HTHTTH(66%)
138273
Figure-2 Investor's Overreaction

AIMA Journal of Management & Research, May 2013, Volume 7, Issue 2/4, ISSN 0974 – 497 Copy right© 2013 AJMR-AIMA
The analyses of the statistical test of overreaction with demographic variables have been shown in table- 2. Investor’s overreaction is statistically almost similar with respect to their gender (χ2=.542, sig. =.462). It may be inferred that both males and females react in almost similar way to any financial news. While statistically significant differences are obtained for investor’s overreaction with respect to their education, income, age, occupation and experience. It may be inferred that investor’s education, income, age, occupation and experience influence in overreacting against any financial news. Based on the above results, H02 which states that there is no significant variation in over-reaction of the investors based on their demographic variables (education, income, age, occupation and experience) is not supported. However, this is supported across gender. 5.3 Purchase Price as Reference Point One of the major behavioral biases observed in the investors is that they tend to use purchase price as the reference point and make decisions based on it. They would sell only if the price of the investment is above the price at which they had made the purchase. To study this phenomenon, investors were asked as to who would be more upset if the price of the share fell immediately- A: one who had purchased the stock at a price lower than the current price? B: one who had purchased the same share at a higher price than the current price? People indicate that the investors who purchased the share at higher than the market price would be more upset and are more vulnerable to use purchase price as the reference point.
The results suggest that investors use purchase price as the reference point for investment decisions. Figure 3 shows that nearly 92% of the retail investors indicated that if the share price falls suddenly, the person who had purchased the share at a higher price would be more upset.
A(8%) B(92%)
32
379
Figure-3Purchase Price as Reference Point

AIMA Journal of Management & Research, May 2013, Volume 7, Issue 2/4, ISSN 0974 – 497 Copy right© 2013 AJMR-AIMA
Table-3: Analysis of Purchase price as Reference point with respect to
Demographics SN Demographic
Factors Purchase price as the reference point for investment decision
Chi-Square (χ2) Df Sig. 1 Gender 2.921 1 .087 2 Education 57.243 4 .000* 3 Income 43.204 3 .000* 4 Age 45.096 4 .000* 5 Occupation 21.622 4 .000* 6 Experience 45.369 4 .000*
The Chi-square (χ2) test was carried out to study whether the affinity to use purchase price as the reference point significantly varies with investors’ demographic variables like gender, education, income, age, occupation and experience and it is found (table-3) that ‘investor’s use purchase price as the reference point’ is statistically almost similar with respect to their gender. While statistically significant differences are obtained for investor’s ‘purchase price as the reference point’ with respect to the remaining demographic variables. The above results resemble greatly with the findings of the present study (H03) that investors who invest in a share usually use its purchase price as the reference point for holding on or selling their stocks. Their reaction to changes in price is thus relative to the initial purchase price. If the difference is high and positive, they contemplate selling it, but if the difference is negative, they continue to hold it in their portfolio in the hope of a price recovery in future. It could also imply that the investor tries to avoid the grief of loss by holding it for long, overlooking it or even forgetting it for some time. Based on the above results, H03 which states that there is no significant variation in purchase price perception of the investors based on their demographic variables (education, income, age, occupation and experience) is not supported. However, this is supported across gender. 5.4 Regret/Loss Avoidance among Investors Regret refers to investors’ emotional reaction on making a mistake. Investors do not want to admit that they have made a bad investment decision and feel regret. To avoid the feeling of regret, they often make wrong decisions like they tend to hang on to the bad investments. They sell shares that have increased in value quicker and refrain themselves from selling shares that have decreased in value. Investors were asked which share they would like to sell if they are in need of money- the one which has increased in value or the one that has shown a decrease in value. Respondents showing an indication to sell the shares which have increased in value can be thus termed as the regret avoiders (Mittal & Vyas, 2009).

AIMA Journal of Management & Research, May 2013, Volume 7, Issue 2/4, ISSN 0974 – 497 Copy right© 2013 AJMR-AIMA
Figure-4 confirms that retail investors are loss/regret avoiders. Around 86% of the investors indicated that, if they need funds, they would prefer selling a share that has shown an increase in value. To study whether the regret/loss avoidance among retail investors, significantly varies with demographic factors like gender, education, income, age, occupation and experience, chi-square test was carried out. The result of the test in table-4 showed that investor’s loss avoidance is statistically almost similar with respect to investor’s gender (χ2=1.425, sig. = .233). Investors avoid selling shares that have decreased in value. They keep hanging on to shares whose prices are falling, seeing the price falling further. If investors’ need funds, they prefer to sell those shares that have shown an increase in value. It may be inferred that the investors want to avoid the feeling of regret. By not selling the shares whose prices are falling, investors want to avoid admitting that they have made a mistake and feel regret.
Table-4: Analysis of Regret/Loss Avoidance with respect to Demographics SN Demographic Factors Selling for the Sake of Liquidity Chi-Square (χ2) Df Sig. 1 Gender 1.425 1 .233 2 Education 43.470 4 .000* 3 Income 88.856 3 .000* 4 Age 95.312 4 .000* 5 Occupation 41.970 4 .000* 6 Experience 57.127 4 .000*
Based on the above results, H04 which states that there is no significant variation in regret/loss avoidance of the investors based on their demographic variables (gender, education, income, age, occupation and experience) is not supported. However, this is supported across gender.
Increase in value(86%) Decreased in value(14%)
342
69
Figure-4Regret/Loss Avoidance among Investors'

AIMA Journal of Management & Research, May 2013, Volume 7, Issue 2/4, ISSN 0974 – 497 Copy right© 2013 AJMR-AIMA
5.5 Motives of Futures Trading Futures trading exist primarily for the purpose of hedging. The main aim of trading in futures was to protect risk against some underlying assets like commodities, equity shares etc. But the scenario has changed. Figure-5, shows that around 67% of the retail investors’ trade in futures only for speculative purpose, whereas 31% are trading for both speculation and hedging and only 2% of the retail investors trade in futures for hedging purpose.
The table 5 shows that investors’ ‘purpose for trade in futures’ is statistically almost similar with respect to investor’s gender (χ2=1.662, sig. =.436). While statistically significant differences are found for investor’s ‘purpose of trade in futures’ with respect to the demographic variables like education, income, age, occupation and experience.
Table-5: Analysis of Motives of Futures Trading with respect to Demographics SN Demographic
Factors Purpose to trade in Stock & Index Futures Chi-Square (χ2) Df Sig.
1 Gender 1.662 2 .436 2 Education 50.161 8 .000* 3 Income 128.900 6 .000* 4 Age 93.760 8 .000* 5 Occupation 55.601 8 .000* 6 Experience 83.121 8 .000*
It may be inferred that both males and females have similar kind of motives in futures trading. But variables like education, income, age, occupation and experience may make them different and rational in investment decision making. While the main aim (hedging) of introducing futures market is lost in the face of an overwhelming number of investors trading in futures for speculation instead of hedging. It may be one of the main causes of loss in futures trading for the retail investors.
Speculation(67%) Hedging(2%) Both(31%)
274
9
128
Figure-5 Motives of Futures Trading

AIMA Journal of Management & Research, May 2013, Volume 7, Issue 2/4, ISSN 0974 – 497 Copy right© 2013 AJMR-AIMA
Based on the above results, H05 which states that there is no significant variation in futures trading motives of the investors based on their demographic variables (education, income, age, occupation and experience) is not supported. However, this is supported across gender. 6. Implications of the Study The present study shows that investors have an attitude of self attribution in investment decisions. If the investors earn money in futures trading, they consider themselves to be very efficient and capable. However if the investors incur losses, they attribute it to bad luck. The study also shows that retail investors overreact to any information related to financial markets and often make wrong decisions. It should be the effort of investment advisors to educate their clients on these issues so that they may make more sound investment decisions. Investors should also consider factors like futures market volatility, its liquidity, economic growth, interest rates, inflation rate, political scenario, etc. of the country when they make financial decisions. Investors tend to use purchase price as the reference point and make decisions based on it. They would sell only if the price of the investment is above the price at which they had made the purchase. The study also shows that investors do not want to admit that they have made a bad investment decision and feel regret. To avoid the feeling of regret, they make wrong decisions like they tend to hang on to the bad investments. If investors need funds, they prefer to sell those shares that have shown an increase in value as they want to avoid the feeling of regret. The brokers and advisors can guide the investors about the nature of the market and appropriate decisions. Investors can benefit through this study in visualizing and realizing the repercussions of their investment decisions. The futures products are meant for hedging purpose while most of the investors trade in futures for speculation. It may be one of the main causes of incurring losses in futures trading for the retail investors. The present study humbly suggests that such small/ retail investors should not participate in futures trading for speculative purpose. 7. Conclusion The results show that retail investors are prone to self-attribution bias which causes a tendency among them to make wrong decisions. If the investors earn money in futures trading they consider themselves to be very knowledgeable and capable, similarly if the investors incur losses, they attribute it to bad luck. It is also found that there exist significant differences in investors’ self attribution bias with respect to their demographic factors. The study also shows that retail investors overreact to any information related to financial markets and make wrong decisions. One of the major findings of the study is that behavioral biases are observed in the investors trading behavior. They tend to use purchase price as the reference point and make decisions based on it. They would sell only if the price of the investment is above the price at which they had made the purchase.

AIMA Journal of Management & Research, May 2013, Volume 7, Issue 2/4, ISSN 0974 – 497 Copy right© 2013 AJMR-AIMA
Regret refers to investors’ emotional reaction at making a mistake. Present study found that investors do not want to admit that they have made a bad investment decision and feel regret. To avoid the feeling of regret, they take wrong decisions like they tend to hang on to the bad investments. They sell shares that have increased in value quicker and refrain themselves from selling shares that have decreased in value. Futures trading exist primarily for the purpose of hedging. The main aim of trading in futures was to protect risk against some underlying assets like commodities or equity shares etc. The present study found that most of the retail investors’ trade in futures only for speculative purpose, and only a few of them are trading in futures for hedging purpose. It is also found that all the demographic factors except gender have significant variation with the motive of futures trading. The present study also agrees with the findings of Miller & Ross (1975), Pavabutr (2002), Mittal & Vyas (2009), Kahneman & Riepe (1998), Deanlebaron (1999). References Abhijeet Chandra & Ravinder Kumar (2011) “Factors Influencing Indian Individual Investor Behaviour: Survey Evidence”, Decision, Vol. 39, No. 3, pp. 141-167, December 2012
Agha, N & Rehman, A (2012) “Investor’s Behavior in Perspective of Educational Qualification and Income in Futures Trading”, Al-Barkaat Journal of Finance & Management, Volume-4, Issue-1, pp. 76-91, ISSN: 0974-7281 (Print); ISSN: 2229-4503 (Online). Agha, N; Rehman, A & Akhtar, A. (2012), “Influence of Occupation and Experience of Retail Investors in Futures Trading: An Empirical Investigation”, IIM Journal, Vol. 1, No. 1, July- December (2012), pp. 23-33, ISSN 2277-4211. Angle, P. (2007). Behavioral Finance: An Approach to Understand Stock Market Irrationality. Portfolio Organizer, The Icfai University Press, December, 52-56 Ansari, A. A., & Jana, S. (2009). Stock Price Decision of Indian Investors. The Journal of Commerce, Vol. 62, No. 3, July-September, 23-31. Barnwell (1987). What Type of Investor are You? Retrieved from www.psychonomics.com /research/a&s/profiling.htm, accessed on November 22, 2006. Bhandari, W., & Deaves, R. (2006). The Demographics of Overconfidence. Journal of Behavioral Finance, Vol. 7, No. 1, 5-11. Bielard, T., Biehl, D., & Kaiser, R. (1986). Personal Money Management, 5th Ed. Chicago: Science Research Association.

AIMA Journal of Management & Research, May 2013, Volume 7, Issue 2/4, ISSN 0974 – 497 Copy right© 2013 AJMR-AIMA
Bradford Cornel, (2009), “Luck, Skill, and Investment Performance”, Journal of Portfolio Management, Vol.35, Iss.2, Pp.131-136 Bruno Biais, Martin Weber, (Jul.2009), “Hindsight Bias, Risk Perception, and Investment Performance”, Management Science, Vol. 55, Iss. 6, Pp.1018-1030 Esmeralda O Lyn, Edward J Zychowicz, (2010), “The Impact of Faith-Based on Investment Performance”, Journal of Investing, Vol.19, Iss.3, Pp.136-145 Gupta, M., & Chander, S. (2011). Consideration of Sources of Information as Selection Criteria in Mutual Fund Purchase: A Comparative Study of Retail and Non-Retail Investors. THE IUP JOURNAL OF APPLIED FINANCE, Vol. 17, No. 1, 27-42. Hyuk Choe, Yunsung Eom, (2009), “The disposition effect and investment performance in the futures market”, The Journal of Futures Markets, Vol.29, Iss.6, P.496 Jose, K. S. (2007). Stock Index Futures: A Global Experience. Treasury Management, The Icfai University Press, May, 35-40. Kahneman, D., & Riepe, M. W, (1998). Aspect of Investors Psychology. Journal of Portfolio Management, Vol. 24, No. 4. Kothari, C. R. (2005). Research Methodology, Methods & Techniques. New Age International (P) Ltd., Publishers. Miller, D. T., & Ross, M. (1975). Self-Serving Bias in Attribution of Causality: Fact or Fiction? Psychological Bulletin, Vol. 82, No. 2, 213-225. Mittal, M., & Vyas, R. K. (2009). Does Irrationality in Investment Decisions Vary with Income. The Icfai University Journal of Behavioral Finance, Vol. VI, No. 1, 26-42. Myers, J. (1999). Profit without Panic: Investment Psychology for Personal Wealth. Nicholas Brealey Publishing, London. Pavabutr, P. (2002). Investor Behavior and asset Prices. Sangvien Conference. Shrotriya, V. (2007). Insights into Personal Investment Management. Portfolio Organizer, The Icfai University Press, February, 46-52. Suryavanshi, A. G. (2011). Appraisal of Investment Avenues: An Empirical Study of Selected Investors in Kolhapur City. Global Journal of Finance and Management, Volume 3, Number 1 (2011), pp. 137-149 http://www.ripub lication.com/gjfm.htm, Retrieved on 21-05-11.

AIMA Journal of Management & Research, May 2013, Volume 7, Issue 2/4, ISSN 0974 – 497 Copy right© 2013 AJMR-AIMA
Wood, R. (2004). Attitudes and Trading Behavior of Stock Market Investors: A Segmentation Approach. Journal of Behavioral Finance, Vol. 5, No. 3, 170-179.
www.nseindiaonline.com www.bseindiaonline.com
Appendix-1

AIMA Journal of Management & Research, May 2013, Volume 7, Issue 2/4, ISSN 0974 – 497 Copy right© 2013 AJMR-AIMA
Demographic Profiles of the respondents Demographic Factors
Frequency
Percent Cumulative %
Gender Male 330 80.3 80.3 Female 81 19.7 100.0 Total 411 100.00
Age Group Upto 25 years 65 15.8 15.8 26 to 35 years 143 34.8 50.6 36 to 45 years 126 30.7 81.3 46 to 55 years 45 10.9 92.2 Above 55 years 32 7.8 100.0 Total 411 100.00
Educational Qualification
Below-graduation
29 7.1 7.1
Graduates 126 30.7 37.7 Post Graduates 132 32.1 69.8 Professionally Qualified
106 25.8 95.6
Others 18 4.4 100.0 Total 411 100.00
Occupation Government job holders
181 44.0 44.0
Business men 89 21.7 65.7 Private job holders
73 17.8 83.5
Housewives 30 7.3 90.8 Others 38 9.2 100.0 Total 411 100.00
Annual Income Bracket (in rupees)
Upto 300000 110 26.8 26.8 300001 to 600000
141 34.3 61.1
600001 to 900000
107 26.0 87.1
Above 900000 53 12.9 100.0 Total 411 100.00
Experience in Futures trading
≤ 2 years 98 23.8 23.8 >2 to ≤ 4 years 121 29.4 53.3 >4 to ≤ 6 years 92 22.4 75.7 >6 to ≤ 8 years 87 21.2 96.8 >8 years 13 3.2 100.0
Total 411 100.00