r20 programme: development of rock grouting design
TRANSCRIPT

P O S I V A O Y
Olk i luo to
F I -27160 EURAJOKI F INLAND
Te l +358-2-8372 31
Fax +358-2-8372 3709
Ursu la S ievaumlnen
February 2009
Work ing Repor t 2008 -45
R20 Programme Development ofRock Grouting Design
Techniques and Procedures for ONKALO
February 2009
Working Reports contain information on work in progress
or pending completion
The conclusions and viewpoints presented in the report
are those of author(s) and do not necessarily
coincide with those of Posiva
Ursu la S ievaumlnen
Saan io amp R iekko la Oy
Work ing Report 2008 -45
R20 Programme Development ofRock Grouting Design
Techniques and Procedures for ONKALO
ABSTRACT Posiva Oy constructs an underground research facility ONKALO at Olkiluoto in
Eurajoki ONKALO is planned to be a part of the deep repository for the high level
nuclear waste Posiva Oy set up R20-programme for the years 2006-2008 with the
target of having an acceptable grouting methodology in ONKALO The programme was
divided into three projects and the work and results of Technique ndashproject is presented
in this report The implementation of the results (grouting design and execution) was
outlined from the project That work is under the responsibility of construction of the
ONKALO-project
The Grouting Technique ndashproject (INKE) studied the grouting experiences obtained
from the first 2 km of the ONKALO access tunnel searched for suitable grouting design
approaches carried out two grouting tests and one pilot grouting test with colloidal
silica in ONKALO analysed the expected grouting conditions in deep rock from the
grouting point of view studied the feasibility of so called optimal design solution in the
expected grouting conditions Based on these studies recommendations concerning the
grouting design design solutions for different rock conditions grouting procedures
grouting stop criteria the characterisation methods for grouting purposes grouting
materials and grouting work performance are presented Swedish Time Stop Grouting
also named Grouting Time ndashMethod was selected to be studied and used in this project
and it was further developed
This work compiles the outcome of the project subtasks and presents the
recommendations for developing the grouting in ONKALOThe key conclusion of this
work are
Grouting Time ndashmethod (time stop grouting) alone is not enough to be used as a
grouting stop criterion due to the uncertainties related to the source parameters
(fracture characteristics rheological properties of grouts) These cause too high
uncertainties when proving the sealing result via the grouting time
Due to the uncertainties related to the key source data it is recommended that the
grout flow is involved as a part of grouting stop criteria It is possible to verify with
the grout flow if the source data and made assumptions were accurate enough
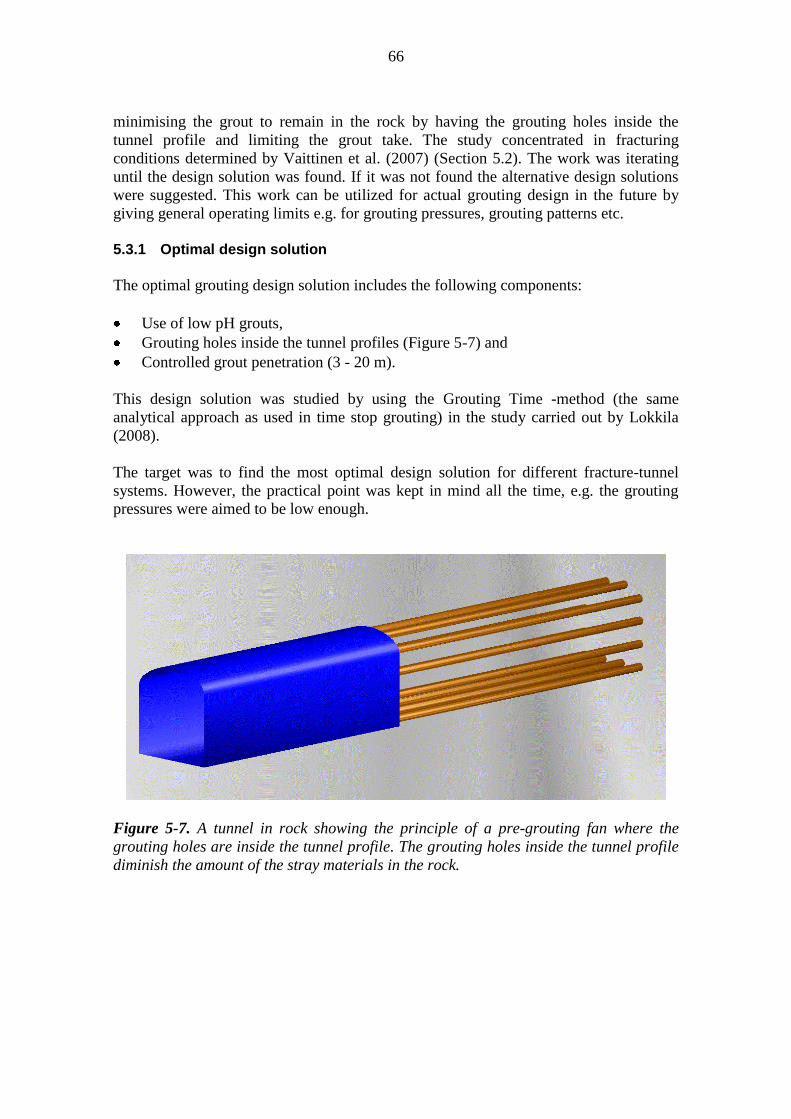
The ideal grouting design solution (in this project the use of low pH cementious
grouts grouting holes inside the tunnel profile limited grout take) from the long
term safety point of view and the feasibility of it in different rock conditions is
presented but it can can be used seldom because fractures are typically very small
The alternatives are to direct the grouting holes outside the tunnel profile to use
higher grouting pressures or to develop thicker and thinner grout mixes and take
colloidal silica in use The last alternative is recommended
Part of groutings can done with typical designs for different rock conditions The
exceptions of this are major regional hydrogeological structures shafts post-
groutings and fractures that intersects the tunnel drift Those should be designed
invidually
Besides these recommendations concerning the grouting design equipments grouting
work rock characterisation and implementation of the results of this project are
presented in this work
Keywords ONKALO disposal of high level nuclear waste grouting grouting
techniques grouting design grouting work Time Stop Grouting Grouting Time ndash
Method Grouting Time and Flow ndash Method
R20 Ohjelma Injektointisuunnittelun -tekniikan ja tyoumlmenetelmien kehittaumlminen ONKALOa varten
TIIVISTELMAuml
Posiva Oy rakentaa maanalaista tutkimustilaa ONKALOa Eurajoen Olkiluotoon
Tutkimustila toimii aikanaan mahdollisesti osana korkea-aktiivisen ydinjaumltteen
loppusijoitustilaa Posiva Oy kaumlynnisti vuonna 2006 R20-ohjelman jonka tavoitteena
oli saavuttaa hyvaumlksyttaumlvauml injektointimenettely ONKALOssa kaumlytettaumlvaumlksi Ohjelma
jakaantui kolmeen projektiin ja Tekniikka-projektin tyoumlt ja tulokset on esitetty taumlssauml
raportissa Projektista oli rajattu pois varsinainen suunnittelutyouml ja toteutustyouml joka on
osa ONKALOn rakennusprojektissa tehtaumlvaumlauml tyoumltauml
Tekniikkaprojektissa (INKE) tutkittiin mm ONKALOn ajotunnelin kahden ensim-
maumlisen kilometrin aikana saatuja kokemuksia injektoinneista etsittiin suunnittelu-
menetelmiauml mitoittaa injektointi suoritettiin kaksi injektointikoetta ja pilottikoe-
injektointi kolloidisella silikalla ONKALOssa analysoitiin odotettavissa olevat olo-
suhteet injektoinnin kannalta syvaumlkalliossa tutkittiin ns optimaalisen suunnittelu-
ratkaisun toteutettavuutta odotettavissa olevissa olosuhteissa Naumliden perusteella
esitetaumlaumln suosituksia koskien injektoinnin suunnittelumenetelmiauml suunnitteluratkaisuja
eri olosuhteissa suunnitteluprosessia injektoinnin lopetuskriteeriauml injektoitavan kallion
tutkimusmenetelmiauml injektointimateriaaleja ja injektointityoumln suoritusta Projektissa
valittiin tutkittavaksi ruotsalainen Time Stop Grouting ndasheli Grouting Time ndash menetelmauml
ja sitauml kehitettiin edelleen
Taumlssauml tyoumlssauml koottiin projektin osatehtaumlvien tulokset ja esitetaumlaumln suositukset injek-
toinnin kehittaumlmisen osalta jatkoon Taumlmaumln tyoumln keskeisiauml johtopaumlaumltoumlksiauml ovat
Grouting Time ndashmenetelmauml (time stop grouting) ei yksin riitauml injektoinnin
lopetuskriteeriksi koska menetelmaumlssauml kaumlytettaumlviin parametrien maumlaumlrittaumlmiseen
(rakojen ominaisuuksien ja injektointimassojen reologisten ominaisuuksien vaih-
telu) liittyy epaumlvarmuuksia jotka aiheuttavat liian suurta epaumlvarmuutta halutun
injektointituloksen varmistamisessa injektointiajan avulla
Laumlhtoumltietoihin liittyvaumln epaumlvarmuuden vuoksi suositellaan ettauml injektoinnin
lopetuskriteeriksi otetaan myoumls massavirtaama joiden avulla voidaan todentaa
injektoinnin suoritusvaiheessa ettauml laumlhtoumltiedot ja tehdyt oletukset ovat halutuissa
rajoissa
Loppusijoituksen pitkaumlaikaisturvallisuuden kannalta ns ideaalista suunnittelu-
ratkaisun (taumlssauml projektissa matalan pHn sementtipohjaisen injektointimassan
kaumlyttouml injektointireiaumlt tunneliprofiilin sisaumlpuolella ja rajoitettu injektointimassa-
menekki) soveltuvuusalueet on esitetty mutta sitauml voidaan kaumlyttaumlauml harvoin koska
raot ovat tyypillisesti hyvin pieniauml hydrauliselta avaumaltaan Vaihtoehtona esite-
taumlaumln reikien kaumlaumlntaumlmistauml tunneliprofiilin ulkopuolelle esitettyauml korkeampien
paineiden kaumlyttoumlauml tai olemassa olevan injektointimassavalikoiman laajentamista ja
kolloidisen silikan kaumlyttoumlauml Naumlistauml viimeistauml suositellaan
Osa injektoinneista on tehtaumlvissauml tyyppisuunnitelmaratkaisuiksi odotettavissa
oleviin olosuhteisiin Naumlistauml poikkeuksia ovat alueellisesti merkittaumlvaumlt rakenteet
kuilut jaumllki-injektoinnit ja tapaukset joissa rako leikkaa tunneliperaumln Naumlmauml pitaumlauml
suunnitella yksiloumlllisesti
Lisaumlksi tyoumlssauml on esitetty suosituksia koskien injektointisuunnittelua laitteita injek-
tointityoumltauml kalliotutkimuksia ja taumlmaumln projektin tulosten implementointia
Avainsanat ONKALO ydinjaumltteen loppusijoitus injektointi injektointitekniikka
injektointisuunnittelu injektointityouml Time Stop Grouting Grouting Time ndashmenetelmauml
Grouting Time and Flow ndash menetelmauml
PREFACE AND ACKNOWLEDGEMENTS
In 2006 Posiva launched a special RampD project called R20 programme which
completion is due early 2008 The programme had an objective to develop grouting
techniques and the use of grouting materials to meet the long term safety requirements
in ONKALO and in the deep repository The Grouting Technology project as a part of
the programme concentrated on developing grouting methods and techniques and that
was carried out with cooperation of several companies The project group consisted of
the author as a project manager Tapani Lyytinen (ELY Management Oy) who acted as
R20 programme manager as well Johanna Hansen and Kimmo Lehtola (Posiva Oy)
Kalle Hollmeacuten (Poumlyry Infra Oy) Seppo Mellanen (Genpro Solutions Oy) Petriikka
Karttunen Mari Lokkila and Antti Oumlhberg (Saanio amp Riekkola Oy) and Tiina Vaittinen
(Poumlyry Environment Oy) Thank you all The author wishes to express her greatest
gratitude to the following persons for their great contribution
For mentoring in the project management Tapani Lyytinen (ELY Management Oy)
For analysing the bedrock data Jannika Gylling (Poumlyry Infra Oy) Annika Hagros
(Saanio amp Riekkola Oy) Tiina Vaittinen (Poumlyry Environment Oy)
For the grouting field tests ndash research and design Kalle Hollmeacuten (Poumlyry Infra Oy) and
Antti Oumlhberg (Saanio amp Riekkola Oy) For the grouting field tests ndash practical
arrangements Seppo Mellanen (Genpro Solutions Oy) Aimo Hiironen Kimmo Lehtola
and the crew of SK-Kaivin Oy
For the input data of the grouting material properties Reeta Ranta-Korpi (Poumlyry Infra
Oy) Johanna Hansen (Posiva Oy) and Petriikka Karttunen And for the studies
concerning hydraulics Mari Lokkila (Saanio amp Riekkola Oy)
For the discussions related to grouting and long term safety Marja Vuorio and Kari
Koskinen (Posiva Oy)
For the favourable attitude in the development work and in sponsoring of it Timo
Aumlikaumls Jukka-Pekka Salo Erkki Palonen and Johanna Hansen (Posiva Oy)
The input of the author consisted of guidance of the work presented in Chapters 3 and
43-44 52-53 The original texts which are here shortened and referred to are
published as working reports master thesis or internal memorandums The rest is
written by the author Two master thesis by K Hollmeacuten and M Lokkila were carried
out during this project
1
TABLE OF CONTENTS ABSTRACT
TIIVISTELMAuml
PREFACE AND ACKNOLEDGEMENTS
LIST OF ABBREVIATIONS 3
NAMES AND COMPOSITIONS OF GROUTS 5
1 INTRODUCTION 7
2 CONTROL OF WATER INGRESS IN ONKALO IN REGARDS OF MULTI BARRIER CONCEPT IN THE REPOSITORY 11
3 EXPERIENCES FROM ONKALO AND THE REFERENCE SITES 13 31 Rock characterisation for grouting design 13 32 Experiences of the rock characterisation for grouting purposes 15 33 Experiences of groutings 20 34 Reference sites 26
4 ENHANCED UNDERSTANDING OF GROUTING DESIGN AND EXECUTION 29 41 General 29 42 Start criteria for grouting 29 43 Stop criteria for grouting 31 44 Experiences from the field tests 39
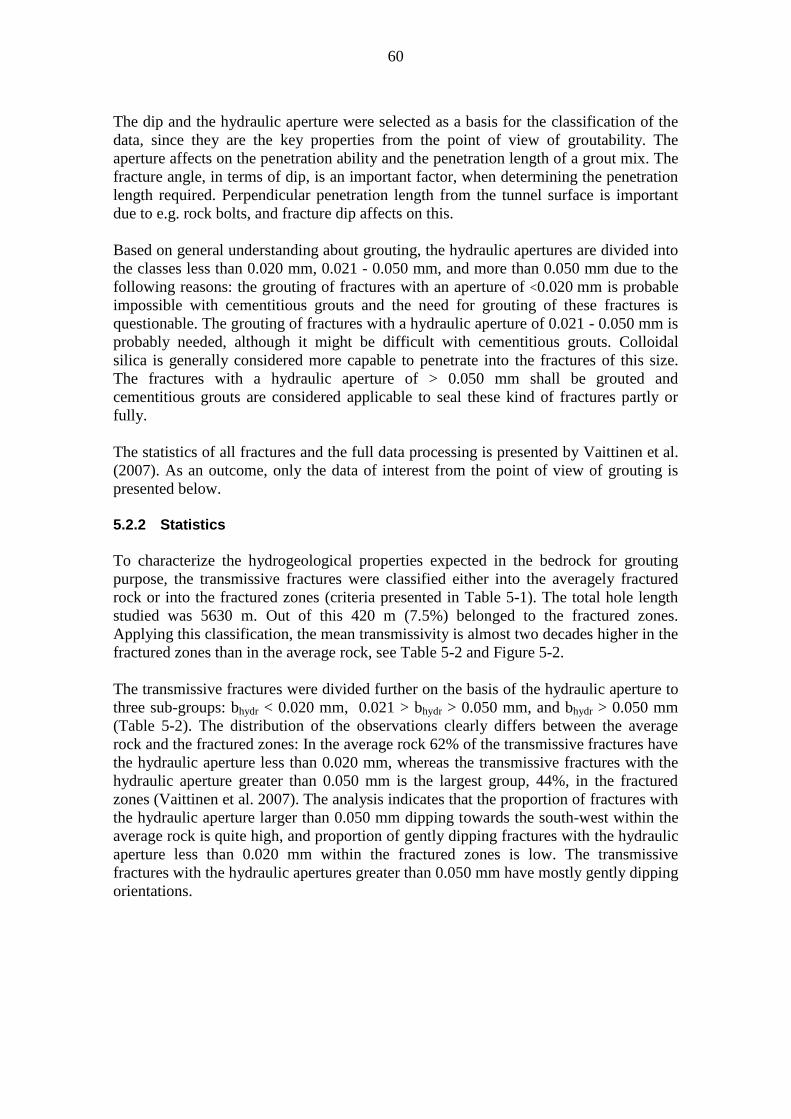
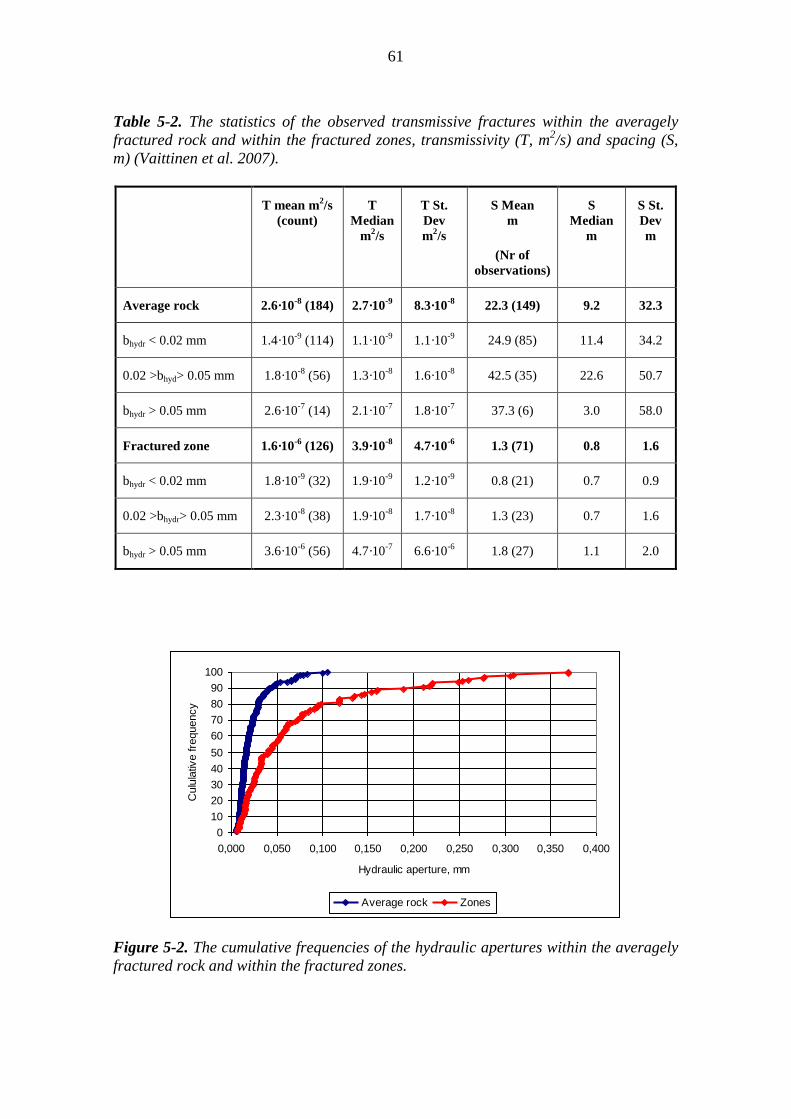
5 OPTIMISATION OF GROUTING FOR ONKALO 57 51 Objectives for grouting 57 52 The expected hydrological conditions from the grouting point of view 57
521 Collection and selecting of data and data processing 58 522 Statistics 60 523 Expected transmissive fractures within averagely fractured rock in
the tunnels 62 524 Expected transmissive fractures within fractured zones in the
tunnels 62 53 Feasibility of the design solutions 65
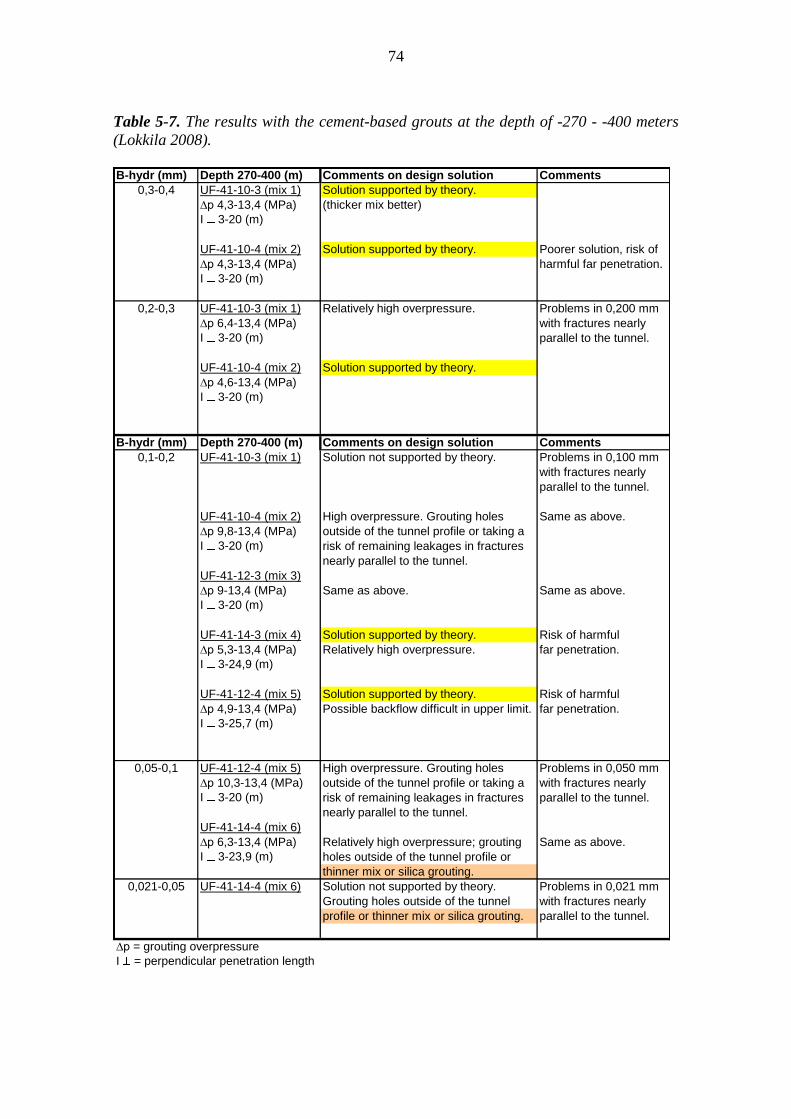
531 Optimal design solution 66 532 Calculation system and studied cases 67 533 Starting values 70 534 Calculation process 71 535 Summary of the results 71 536 Additional comments on the grouting of special cases etc 76
54 Start and stop criteria to be applied 77 541 Start criteria 77
55 Stop criteria 82
6 DISCUSSION AND SYNTHESIS 85 61 Grouting design 85 62 Grouting work 90
7 CONCLUSIONS AND RECOMMENDATIONS 93
REFERENCES 97
APPENDIX 1 101
APPENDIX 2 107
2
3
LIST OF ABBREVIATIONS
b = hydraulic aperture (m)
EBS = Engineering Barrier System
EDZ = Excavation Damaged Zone
FT = field test
GTF method = ldquoGrouting Time amp Flowrdquo -method
g = gravitational acceleration (ms2)
GIN method = Grouting Intensity Number -method
GT method = ldquoGrouting Timerdquo ndashmethod also so called time stop grouting
H = depth below ground surface or groundwater table (m)
I = penetration (m)
ID = relative penetration
Imax = maximum penetration (m)
IMA = project concerning the development of low pH cementitious
grouting materials
INKE = project concerning the development of grouting technology
IPA = project concerning the long term safety of grouting
K = hydraulic conductivity (ms)
L = length measuring length (m)
Lug = Lugeon value (dm3(MPa min m))
MWD = Measure While Drilling
OFW = outflow of water (method)
OL-KR = deep drill hole
PFL = Posiva flow log (method)
PH = pilot hole
pg = grouting pressure (Pa)
PL = chainage (m)
PR = bore hole
pw = groundwater pressure (Pa)
∆p = overpressure (Pa)
Q = flow rate (m3s)
R0 = radius of groundwater flow (m)
R = radius of a hole or a tunnel (m)
RampD = research and development
RH = hydrogeological structure such as RH19 or RH20 The names vary
in different hydrological or geological models (Eg R19 HZ19)
made for different purposes
S = spacing (m)
SKB = Svensk Kaumlrnbraumlnslehantering AB
SP = subproject
SPL = superplasticizer
t = time (s)
tD = relative grouting time (dimensioless)
tg = gel induction time (s)
tmax = maximum characteristic grouting time (s)
T = transmissivity (m2s)
4
UF = Ultrafin 16 cement
V(1D) = grout intake in 1D system (channel)
V(2D) = grout intake in 2D system (planar fracture)
w = width (of the channel) (m)
WDM = water to dry material ratio
WLMint = interpreted water loss (Lug)
WLMmax = maximum water loss (Lug)
ρ = density (kgm3)
ρb = density of rock (kgm3)
μ = viscosity of water (Pas)
μg = plastic viscosity of a grout (Pas)
τ0 = yield strength of a grout (Pa)
1D = 1-dimensional
2D = 2-dimensional
3D = 3-dimensional
5
NAMES AND COMPOSITIONS OF GROUTS
Following nomenclature has been applied to the injection grouts The mix name
consists of four parts XX-YY-ZZ-QQ in which the first part XX refers to the cement
(UF = Ultrafin 16) The second part YY refers to the dry silica to the total dry material
weight ratio The third part ZZ is the water to dry material ratio (WDM) multiplied by
10 and the fourth part QQ is the superplasticizer (SPL) content expressed as weight
out of the total dry material The accelerator if used is given as weight out of the
total dry material in bracklets Other mix compositions are named likewise Cement
UF16 GroutAid silica slurry SPL Mighty150 and accelerator Nedmaq has been used as
the materials
Name of the grout Old names
of the grouts
WDM SPL
SilCem Accelerator
UF-41-14-3 P308 14 3 069 0
UF-41-14-3 (5 ) 14 3 069 5
UF-41-14-4 P308B 14 4 069 0
UF-41-14-4 (2 ) 14 4 069 2
UF-41-14-4 (5 ) 14 4 069 5
UF-41-14-48 14 48 069 0
UF-41-14-51 14 51 068 0
UF-41-12-3 P307 12 3 069 0
UF-41-12-3 (2 ) 12 3 069 2
UF-41-12-3 (5 ) 12 3 069 5
UF-41-12-36 12 36 069 0
UF-41-12-37 12 37 069 0
UF-41-12-4 P307B 12 4 069 0
UF-41-12-4 (5 ) 12 4 069 5
UF-41-12-48 12 48 069 0
UF-41-12-51 12 51 069 0
UF-41-10-3 10 3 069 0
UF-41-10-3 (2 ) 10 3 069 2
UF-41-10-3 (5 ) 10 3 069 5
UF-41-10-4 10 4 068 0
UF-41-10-4 (2 ) 10 4 068 2
UF-41-10-4 (5 ) 10 4 068 5
UF-41-10-48 10 48 069 0
UF-15-10-28 5_5 10 28 018 0
UF-15-10-28 (2 ) 10 28 018 2
UF-15-10-28 (5 ) 10 28 018 5
UF-41-08-47 08 47 069 0
6
7
1 INTRODUCTION
The Finnish nuclear waste management company Posiva Oy owned by Teollisuuden
Voima Oy and Fortum Power and Heat Oy constructs an underground rock
characterisation facility called ONKALO (Figure 1-1) in Olkiluoto Eurajoki Finland
The construction commenced in 2004 and is to be completed by the end of the year
2010 In future ONKALO is supposed to be a part of the nuclear waste facility the
repository for spent nuclear fuel By the end of the year 2007 about 2500 m of the
ONKALO access tunnel has been excavated and the ventilation (intake and exhaust)
and the personnel shafts about 180 m each have been raise bored
The investigations and the hydrogeological models made from the bedrock around
ONKALO demonstrate that essential water bearing structures need to be sealed
Otherwise excessive leakages into the tunnel can be expected (Riekkola et al 2003
Sievaumlnen amp Riekkola 2003) and too many disturbances will be foreseen in the
hydrogeological and geochemical environment (Vieno et al 2003) It was decided
before the construction that grouting will be the primary measure to control the
groundwater inflow into the tunnels The achievements and the strategy of grouting was
evaluated earlier when the major water bearing structures called RH19 at the depth
level of about -100 m were intersected (Ahokas et al 2006) The suggestion was made
to develop grouting further for better control of water ingresses
Those recommendations resulted in Posiva Oys decision to set up the R20 programme
for the years 2006 - 2008 The programme is a RampD scheme with an objective to
enhance the control of water inflow by grouting The programme shall come up with a
feasible grouting methodology which can be applied after intersecting the group of
water bearing RH20 structures at the approximate depth of -70 m
Figure 1-1 Schematic picture of ONKALO (yellow) and the deep repository
(httpwwwposivafi)
8
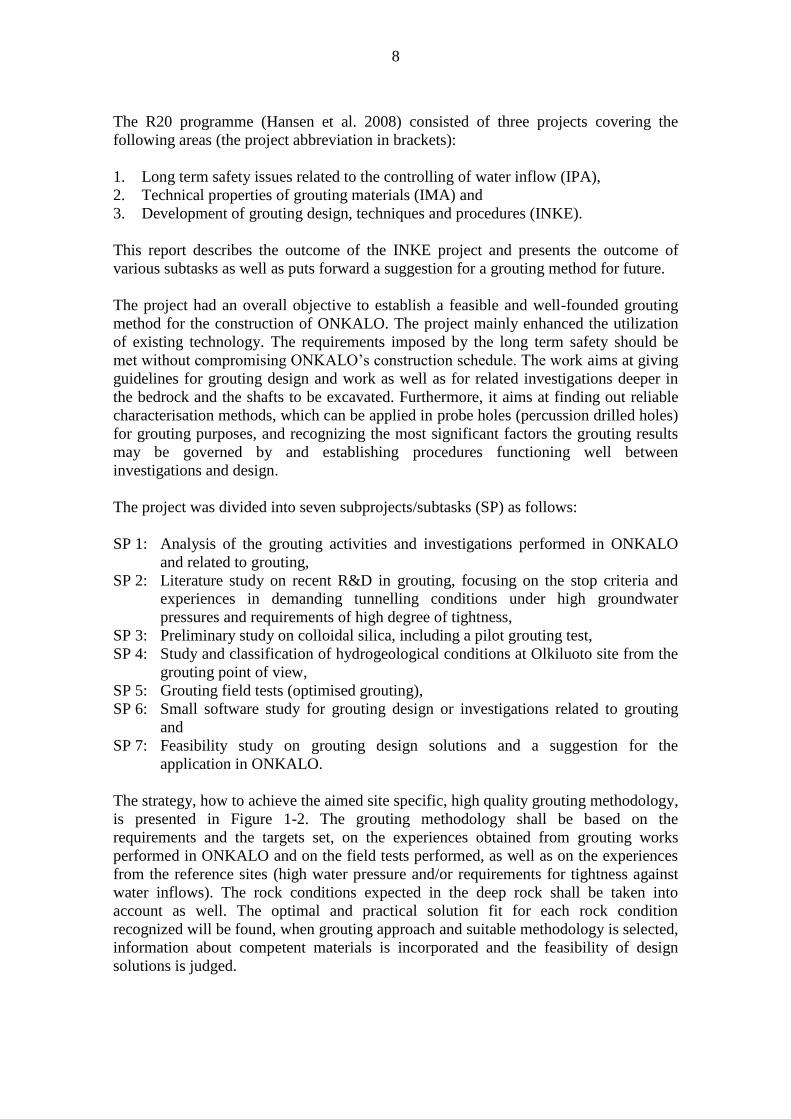
The R20 programme (Hansen et al 2008) consisted of three projects covering the
following areas (the project abbreviation in brackets)
1 Long term safety issues related to the controlling of water inflow (IPA)
2 Technical properties of grouting materials (IMA) and
3 Development of grouting design techniques and procedures (INKE)
This report describes the outcome of the INKE project and presents the outcome of
various subtasks as well as puts forward a suggestion for a grouting method for future
The project had an overall objective to establish a feasible and well-founded grouting
method for the construction of ONKALO The project mainly enhanced the utilization
of existing technology The requirements imposed by the long term safety should be
met without compromising ONKALOrsquos construction schedule The work aims at giving
guidelines for grouting design and work as well as for related investigations deeper in
the bedrock and the shafts to be excavated Furthermore it aims at finding out reliable
characterisation methods which can be applied in probe holes (percussion drilled holes)
for grouting purposes and recognizing the most significant factors the grouting results
may be governed by and establishing procedures functioning well between
investigations and design
The project was divided into seven subprojectssubtasks (SP) as follows
SP 1 Analysis of the grouting activities and investigations performed in ONKALO
and related to grouting
SP 2 Literature study on recent RampD in grouting focusing on the stop criteria and
experiences in demanding tunnelling conditions under high groundwater
pressures and requirements of high degree of tightness
SP 3 Preliminary study on colloidal silica including a pilot grouting test
SP 4 Study and classification of hydrogeological conditions at Olkiluoto site from the
grouting point of view
SP 5 Grouting field tests (optimised grouting)
SP 6 Small software study for grouting design or investigations related to grouting
and
SP 7 Feasibility study on grouting design solutions and a suggestion for the
application in ONKALO
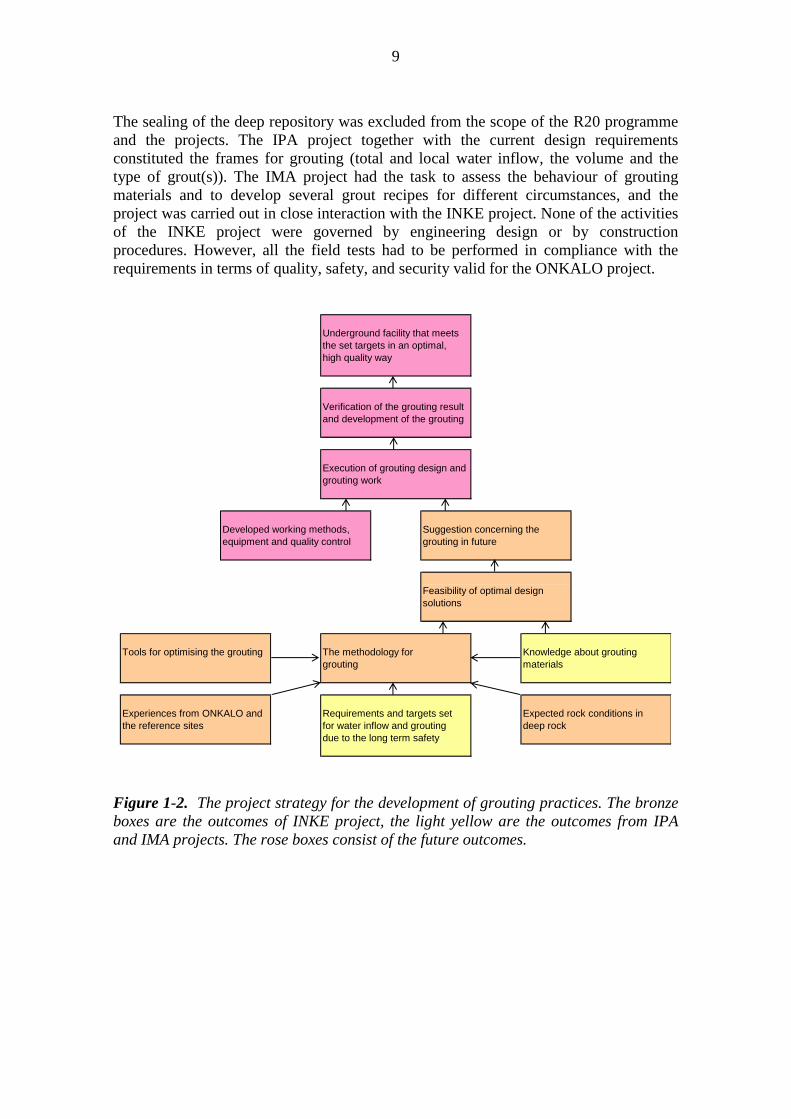
The strategy how to achieve the aimed site specific high quality grouting methodology
is presented in Figure 1-2 The grouting methodology shall be based on the
requirements and the targets set on the experiences obtained from grouting works
performed in ONKALO and on the field tests performed as well as on the experiences
from the reference sites (high water pressure andor requirements for tightness against
water inflows) The rock conditions expected in the deep rock shall be taken into
account as well The optimal and practical solution fit for each rock condition
recognized will be found when grouting approach and suitable methodology is selected
information about competent materials is incorporated and the feasibility of design
solutions is judged
9
The sealing of the deep repository was excluded from the scope of the R20 programme
and the projects The IPA project together with the current design requirements
constituted the frames for grouting (total and local water inflow the volume and the
type of grout(s)) The IMA project had the task to assess the behaviour of grouting
materials and to develop several grout recipes for different circumstances and the
project was carried out in close interaction with the INKE project None of the activities
of the INKE project were governed by engineering design or by construction
procedures However all the field tests had to be performed in compliance with the
requirements in terms of quality safety and security valid for the ONKALO project
Underground facility that meets
the set targets in an optimal
high quality way
Verification of the grouting result
and development of the grouting
Execution of grouting design and
grouting work
Developed working methods Suggestion concerning the
equipment and quality control grouting in future
Feasibility of optimal design
solutions
Tools for optimising the grouting The methodology for Knowledge about grouting
grouting materials
Experiences from ONKALO and Requirements and targets set Expected rock conditions in
the reference sites for water inflow and grouting deep rock
due to the long term safety
Figure 1-2 The project strategy for the development of grouting practices The bronze
boxes are the outcomes of INKE project the light yellow are the outcomes from IPA
and IMA projects The rose boxes consist of the future outcomes
10
11
2 CONTROL OF WATER INGRESS IN ONKALO IN REGARDS OF MULTI BARRIER CONCEPT IN THE REPOSITORY
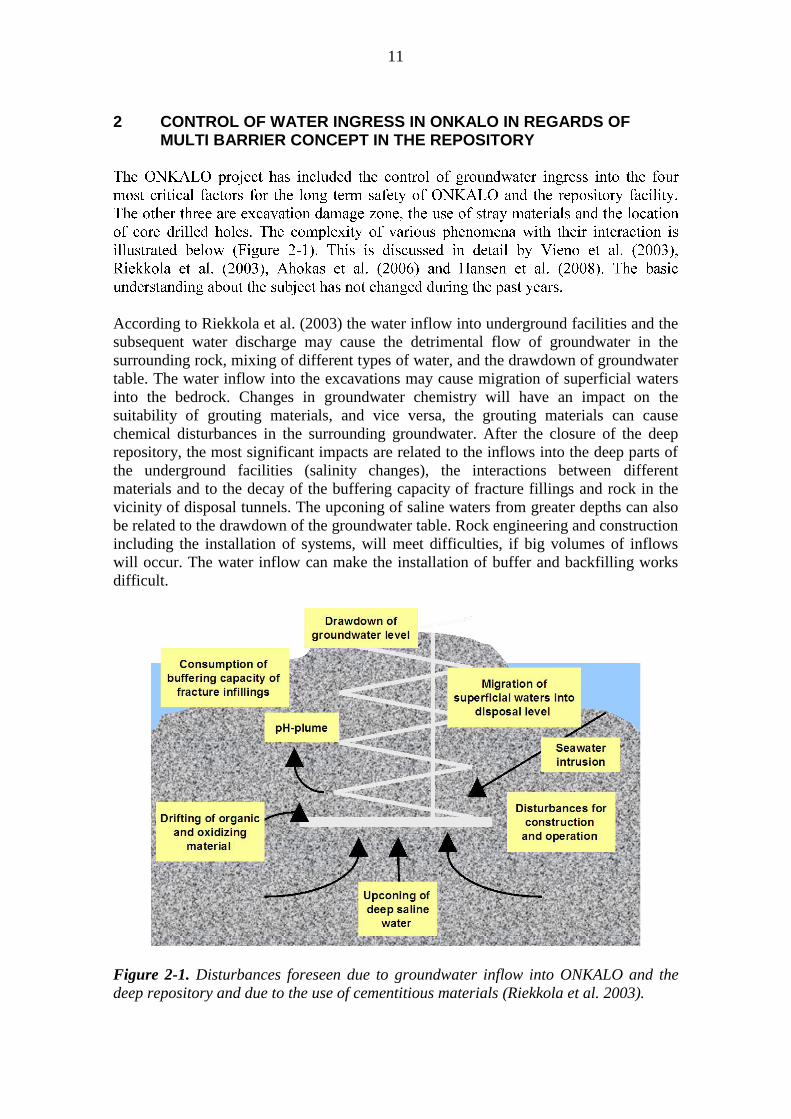
According to Riekkola et al (2003) the water inflow into underground facilities and the
subsequent water discharge may cause the detrimental flow of groundwater in the
surrounding rock mixing of different types of water and the drawdown of groundwater
table The water inflow into the excavations may cause migration of superficial waters
into the bedrock Changes in groundwater chemistry will have an impact on the
suitability of grouting materials and vice versa the grouting materials can cause
chemical disturbances in the surrounding groundwater After the closure of the deep
repository the most significant impacts are related to the inflows into the deep parts of
the underground facilities (salinity changes) the interactions between different
materials and to the decay of the buffering capacity of fracture fillings and rock in the
vicinity of disposal tunnels The upconing of saline waters from greater depths can also
be related to the drawdown of the groundwater table Rock engineering and construction
including the installation of systems will meet difficulties if big volumes of inflows
will occur The water inflow can make the installation of buffer and backfilling works
difficult
Figure 2-1 Disturbances foreseen due to groundwater inflow into ONKALO and the
deep repository and due to the use of cementitious materials (Riekkola et al 2003)
12
13
3 EXPERIENCES FROM ONKALO AND THE REFERENCE SITES
31 Rock characterisation for grouting design
About 25 of the access tunnel length is investigated with pilot holes (core drilled
holes) (Figure 3-1) Four probe holes (percussion drilled holes) are drilled
systematically about every 20 m as the tunnelling proceeds The pilot holes are typically
100 - 200 m long core drilled holes and the hole specific characterization reports are
produced in all details The characterization data is used to give a preliminary picture
eg of the need for grouting The final decision of the grouting need is done based on
information gathered from the probe holes In a few cases the design has been changed
due to the observations made in the probe holes
The characterisation methods in the probe holes
Water loss measurement (Lugeon test)
Posiva flow log and
Measurement of water out flow
The methods in the pilot holes
The water loss measurement (Lugeon test)
Posiva flow log and measurement of water out flow
Core sample loggings and
Different geophysical methods
The first stage of geological rock mass mapping can serve grouting designs interest as
well (location and orientation of leaking fractures) Eg when the hydrogeological
structure RH19 was intersected the drilling fans were designed according to the
fracturing
Lokkila (2008) has gathered information about the methods The Lugeon test is done by
sealing of the opening to a drilling hole with a packer and pumping water under a
constant pressure for a predetermined time and then measuring the volume pumped The
sequence length of the hole tested can vary In ONKALO mostly the whole length of
the probe holes has been tested and occasionally a split to shorter sections has been
done Applying altering pressures (raising and descending) the hydraulic circumstances
in the surroundings of the hole can be evaluated (Houlsby 1990)
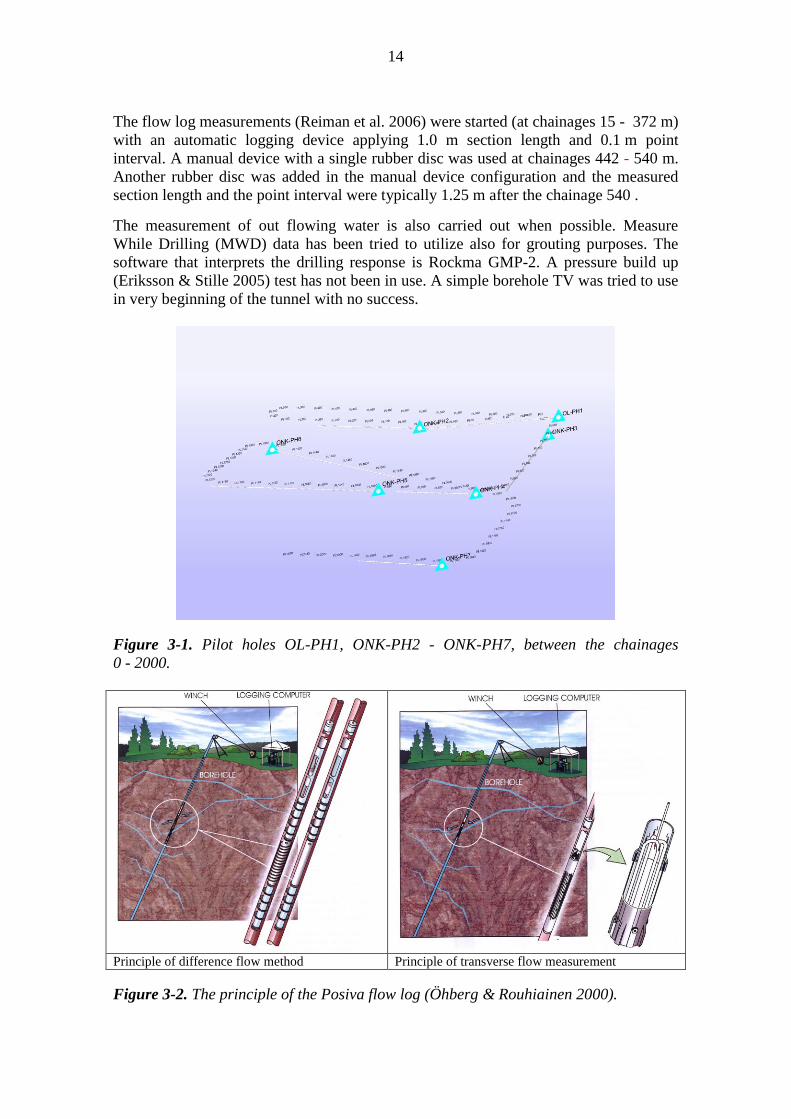
The Posiva flow log device (Figure 3-2) has instrumentation for measuring both
difference and transverse flows (Oumlhberg amp Rouhiainen 2000 Lokkila 2008) In
difference flow measurement the differences of flow rates ie flows into or out from an
investigation hole are measured For the difference flow measurement there are two
optional modes available normal and detailed flow logging With the normal mode
hydraulic conductivities and hydraulic heads of the tested section are obtained The
detailed flow logging mode enables a rapid way to locate the leaky fractures or zones
The transverse flow equipment is used for in-situ measurements of flow rate and its
direction across a test section
14
The flow log measurements (Reiman et al 2006) were started (at chainages 15 - 372 m)
with an automatic logging device applying 10 m section length and 01 m point
interval A manual device with a single rubber disc was used at chainages 442 - 540 m
Another rubber disc was added in the manual device configuration and the measured
section length and the point interval were typically 125 m after the chainage 540
The measurement of out flowing water is also carried out when possible Measure
While Drilling (MWD) data has been tried to utilize also for grouting purposes The
software that interprets the drilling response is Rockma GMP-2 A pressure build up
(Eriksson amp Stille 2005) test has not been in use A simple borehole TV was tried to use
in very beginning of the tunnel with no success
Figure 3-1 Pilot holes OL-PH1 ONK-PH2 - ONK-PH7 between the chainages
0 - 2000
Principle of difference flow method Principle of transverse flow measurement
Figure 3-2 The principle of the Posiva flow log (Oumlhberg amp Rouhiainen 2000)
15
32 Experiences of the rock characterisation for grouting purposes
The data available for the analysis of grouting experiences was obtained from
Pilot holes OL-PH1 ONK-PH2 - 4
Probe hole data between tunnel chainages 0 - 1850 and
Grouting data between tunnel chainages 0 - 1850
Only one part of the personnel shaft was grouted and raise bored at the time the analysis
were made and thus the experiences obtained from the shafts were excluded from the
analysis
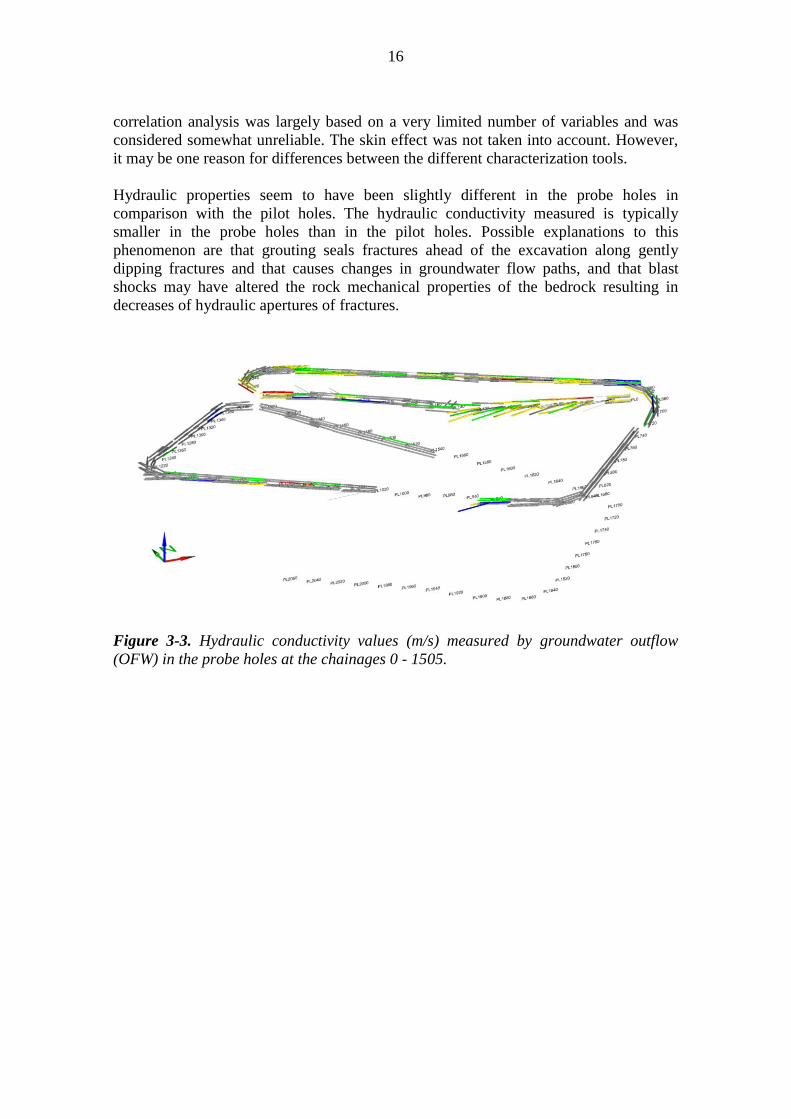
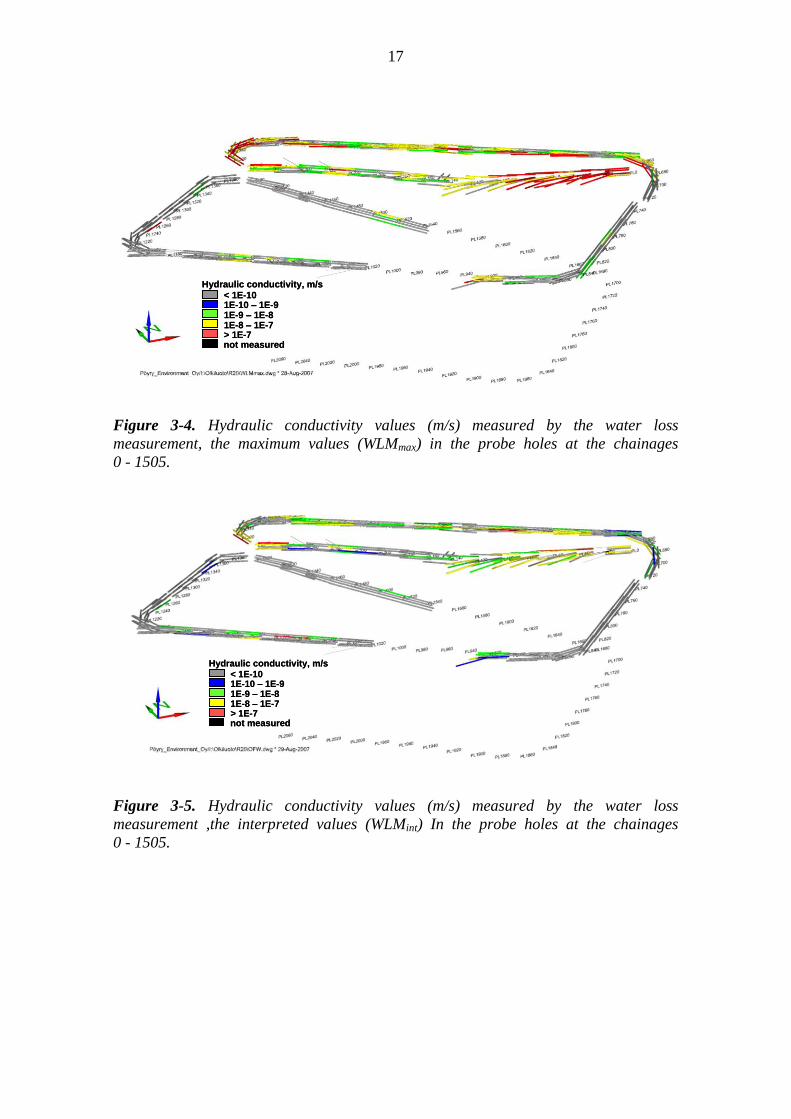
Observations on hydraulic properties in the probe holes (chainages 0 - 1505) are
presented in Figures 3-3 3-4 3-5 and 3-6 Hydraulic conductivities are based on water
outflow from the probe holes (Figure 3-3) maximum measured water losses (Figure 3-
4) interpreted water losses (Figure 3-5) and flow loggings (Figure 3-6) It can be seen
that as the excavation has advanced deeper the hydraulic conductivities determined in
the probe holes have significantly decreased ie the occurrences of the transmissive
fractures have diminished and the transmissivities of water conductive fractures have
decreased
The measurements of outflows and water losses have covered one probe hole at time
Recently occasionally the water loss is also measured with 2-packer device with 1 m
measuring section if the water loss in a probe hole has exceeded a predetermined limit
The flow log measurement can be used to distinct hydraulic fractures along a probe
hole The flow logging method was shifted from the automatic to the manual
measurement at the chainage 372 At the same point the trigger value of the outflow for
starting the measurement was changed from 30 mlmin to 500 mlmin in the holes that
are inclined upwards However that did not cause changes to probe hole measurements
since they are inside the tunnel profile and thus typically inclined downwards The holes
with the outflow less than the trigger level were considered dry for the flow logging
purposes (Reiman et al 2006)
About 13 of the probe holes have been flow logged The testing was abandoned in the
rest of the holes due to various technical difficulties andor due to dry holes The
diameter of most of the probe holes was 56 mm and the holes were typically more
bended than those of 64 mm In principle the water loss measurement can be carried out
in any probe hole However the measuring accuracy of the flow meters of water loss
measurement device tend not to meet the requirements for the start criteria of grouting
in ONKALO and the smallest transmissive fractures are difficult or impossible to
detect with the current devices
Comparisons of the results gathered with different hydraulic characterisation tools (the
data from chainages 0 - 1505) showed quite good correlations between the maximum
water loss in any probe hole of a fan (WLMmax) and the interpreted water loss (WLMint)
(correlation coefficient r = 088 or 072) and poor to moderate correlation with the flow
log (r = 043 and 028 correspondingly) The out flowing water measured at different
times correlated very variably with other observations The result obtained in the
16
correlation analysis was largely based on a very limited number of variables and was
considered somewhat unreliable The skin effect was not taken into account However
it may be one reason for differences between the different characterization tools
Hydraulic properties seem to have been slightly different in the probe holes in
comparison with the pilot holes The hydraulic conductivity measured is typically
smaller in the probe holes than in the pilot holes Possible explanations to this
phenomenon are that grouting seals fractures ahead of the excavation along gently
dipping fractures and that causes changes in groundwater flow paths and that blast
shocks may have altered the rock mechanical properties of the bedrock resulting in
decreases of hydraulic apertures of fractures
Figure 3-3 Hydraulic conductivity values (ms) measured by groundwater outflow
(OFW) in the probe holes at the chainages 0 - 1505
17
Hydraulic conductivity mslt 1E-101E-10 ndash 1E-91E-9 ndash 1E-81E-8 ndash 1E-7gt 1E-7not measured
Hydraulic conductivity mslt 1E-101E-10 ndash 1E-91E-9 ndash 1E-81E-8 ndash 1E-7gt 1E-7not measured
Hydraulic conductivity mslt 1E-101E-10 ndash 1E-91E-9 ndash 1E-81E-8 ndash 1E-7gt 1E-7not measured
Hydraulic conductivity mslt 1E-101E-10 ndash 1E-91E-9 ndash 1E-81E-8 ndash 1E-7gt 1E-7not measured
Hydraulic conductivity mslt 1E-101E-10 ndash 1E-91E-9 ndash 1E-81E-8 ndash 1E-7gt 1E-7not measured
Hydraulic conductivity mslt 1E-101E-10 ndash 1E-91E-9 ndash 1E-81E-8 ndash 1E-7gt 1E-7not measured
Figure 3-4 Hydraulic conductivity values (ms) measured by the water loss
measurement the maximum values (WLMmax) in the probe holes at the chainages
0 - 1505
Figure 3-5 Hydraulic conductivity values (ms) measured by the water loss
measurement the interpreted values (WLMint) In the probe holes at the chainages
0 - 1505
18
Hydraulic conductivity mslt 1E-101E-10 ndash 1E-91E-9 ndash 1E-81E-8 ndash 1E-7gt 1E-7not measured
Hydraulic conductivity mslt 1E-101E-10 ndash 1E-91E-9 ndash 1E-81E-8 ndash 1E-7gt 1E-7not measured
Hydraulic conductivity mslt 1E-101E-10 ndash 1E-91E-9 ndash 1E-81E-8 ndash 1E-7gt 1E-7not measured
Figure 3-6 Hydraulic conductivity values (ms) measured with the Posiva flow log
(PFL) in the probe holes at the chainages 0 - 1505
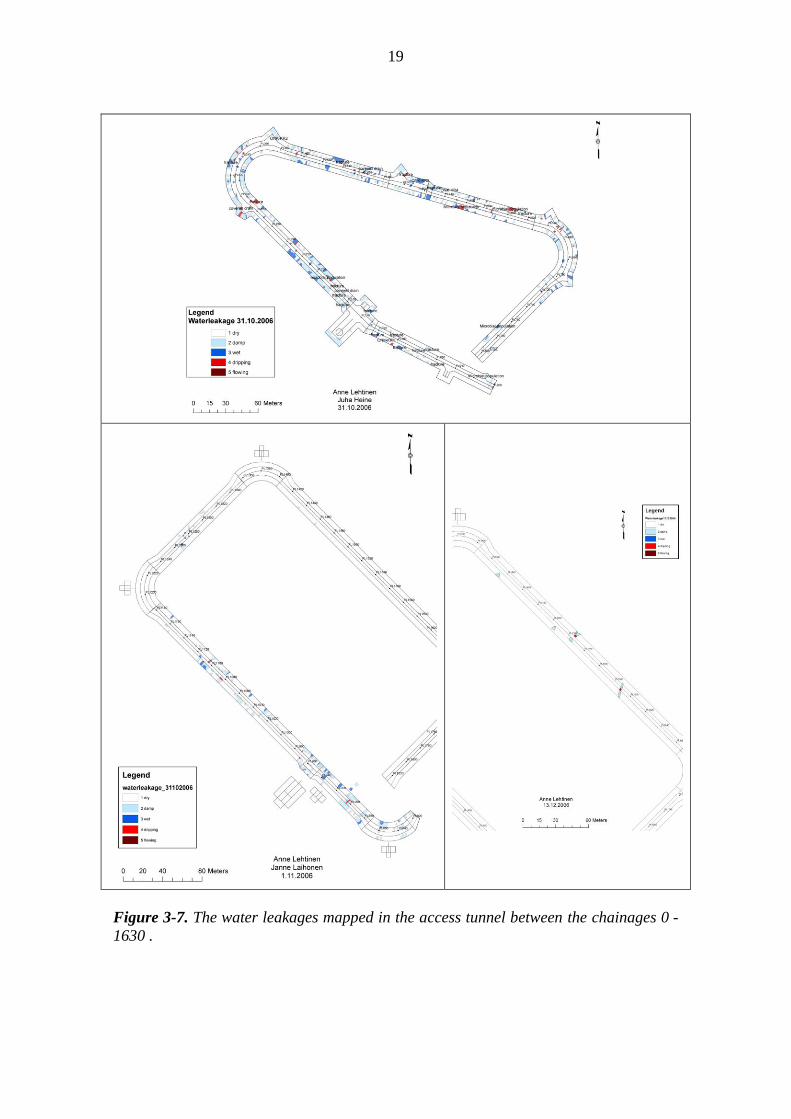
The visible leakages have been mapped four times per year (Figure 3-7) The measuring
weirs have been put in place for measuring the total inflow rate (Hansen et al 2008
Lehtinen amp Hirvonen 2007) The results have varied as the construction has proceeded
but recently a stabilising trend has been seen High occasional peaks have been caused
eg by open leaky grouting holes Major drips are concentrated at the locations of rock
bolts At the chainage 208 the average inflow has been 30 lmin at the chainage 580
106 lmin at the chainage 1255 184 lmin and at the pump station at the chainage 2285
~ 176 lmin The measured leakages have been smaller than expected However as
predicted before the construction started the inflow has significantly decreased below
the depth level -100 m (Riekkola et al 2003)
19
Figure 3-7 The water leakages mapped in the access tunnel between the chainages 0 -
1630
20
33 Experiences of groutings
The decision of grouting has been based on the amount of out flowing water the water
loss measurement and the leakage from single fractures (determined by flow log)
About 70 of the first 1000 m of the access tunnel has been grouted After intersecting
the hydrogeological structures RH19A and B the need for grouting has diminished
significantly Between the tunnel chainages 1000 - 2000 about 25 of the tunnel length
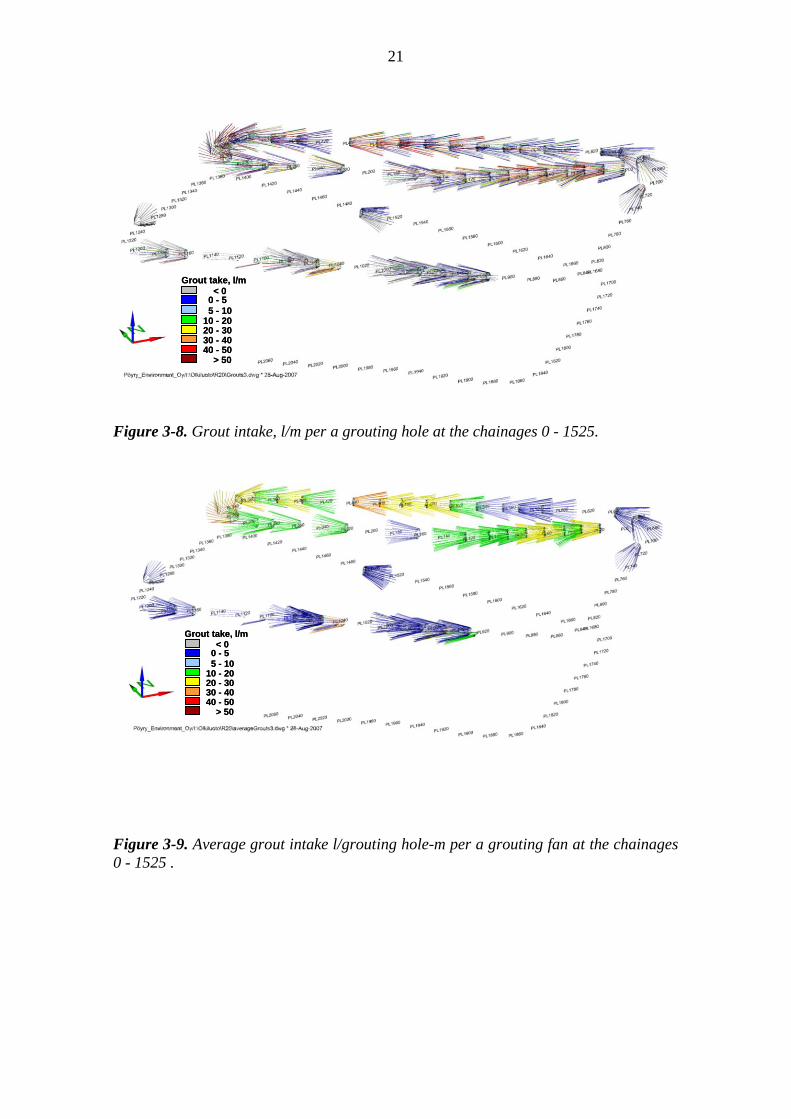
has been grouted The pre-grouting areas and the grout intakes per a hole-m and per a
fan are visualised in Figures 3-8 and 3-9
Grouting holes have been drilled outside the tunnel profile with the exception of the
shafts and one test grouting at the chainage 1880 Various drill patterns have been
applied (Table 3-1) The length of the grouting holes has been from 22 to 26 m A dense
(34 holesfan) pattern was used in the beginning The number of grouting holes was
however soon reduced first to 27 and then to 22 That turned out to be adequate to
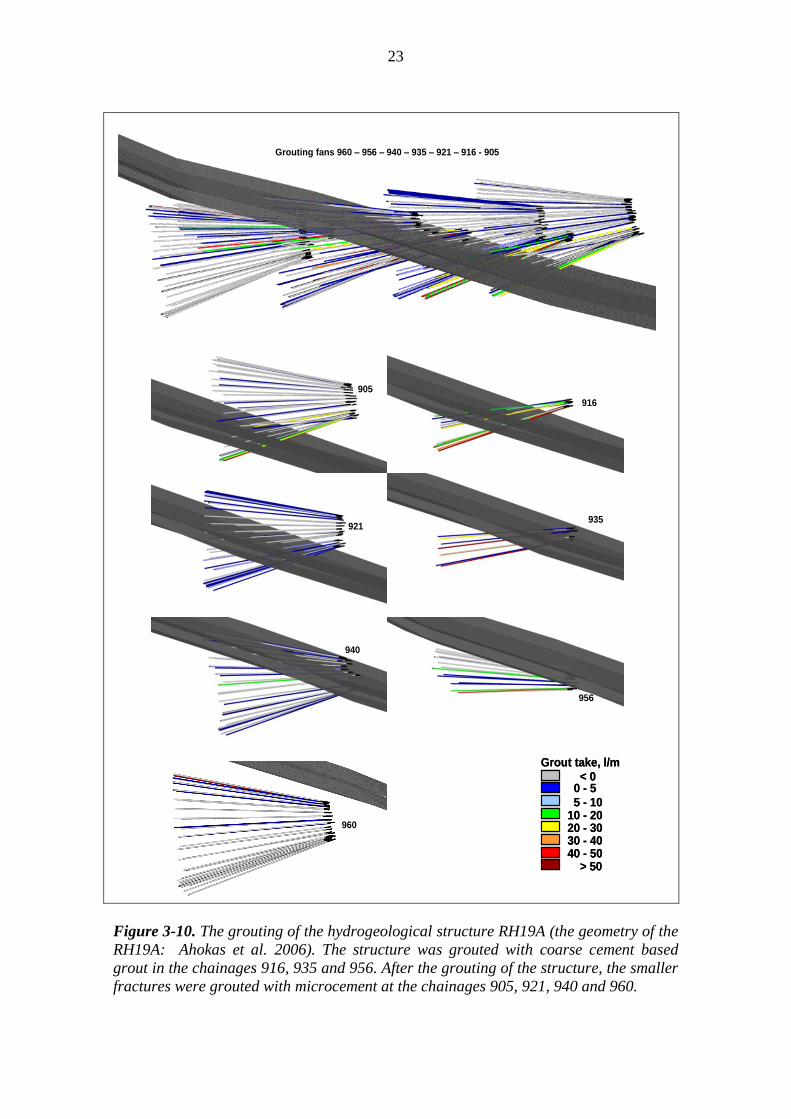
achieve the sealing result as planned Special drilling patterns were used through the
hydrogeological structure RH19A (Ahokas et al 2006) between the chainages 916 and
980 to achieve the results wanted (Figure 3-10) The drilling pattern was changed back
to 34 holes after the chainage 1400 in order to enhance the probability to intersect water
conductive channels with grouting holes Post-grouting has been done in very few
places in order to rectify defects in pre-grouting Post-groutings have been designed on
a case by case basis
Grout mixes are based on sulphate resistant micro cement Ultrafin 16 (by Cementa AB)
except in the hydrogeological structure RH19A where also coarser Portland cement
(SR-cement by Finnsementti Oy) was used for better sealing effect Micro silica slurry
(GroutAid by Elkem) and mainly naphthalene sulphonated super plasticizer have been
used as admixtures Water to dry material ratio (in weight) has varied between 10 ndash 13
for early mixes and the ratio was reduced to 05 in the case of high grout intake Silica
to cement ratio has varied between 000 and 018 The content of superplasticizer has
typically varied between 1 and 2 in the weight of dry materials mainly depending on
the type of admixture The low pH grouts have been used in grouting tests with water
to dry material ratio 12 - 14 silica to cement ratio 069 and superplasticizer content of
4 in the weight of dry materials The total grout intake in the first 1000 m of the
access tunnel was ~ 422 m3 and between the tunnel chainages 1000 - 2000 m ~ 35 m
3
see Figure 3-11 All in all grout intake has not been very high and as the rock got less
fractured at the chainage about 550 m the grout intake and the need for grouting
diminished remarkably
The stop criteria used in grouting has been conventional Grout was pumped into the
bedrock as long as the stopping pressure was reached and the pressure was held for
5 min If the termination pressure was not reached and the grout intake had exceeded
the given limit the thicker grout mix was prepared by lowering water content in the
mix The grouting pressure during the first 2000 m has varied between 2 and 9 MPa
with a tendency to increase as the tunnel advanced deeper The grout intake limit for the
thinnest grout mix has typically been 30 lm of a grouting hole The grout intake limit
for the next thicker grout mix was 20 lm and for the last grout mix 20 lm In the
hydrogeological structures RH19A and B the grout intake was also limited Alternative
stop criteria have been studied and used in grouting tests
21
Grout take lmlt 0
0 - 55 - 10
10 - 2020 - 3030 - 4040 - 50
gt 50
Grout take lmlt 0
0 - 55 - 10
10 - 2020 - 3030 - 4040 - 50
gt 50
Grout take lmlt 0
0 - 55 - 10
10 - 2020 - 3030 - 4040 - 50
gt 50
Grout take lmlt 0
0 - 55 - 10
10 - 2020 - 3030 - 4040 - 50
gt 50
Grout take lmlt 0
0 - 55 - 10
10 - 2020 - 3030 - 4040 - 50
gt 50
Grout take lmlt 0
0 - 55 - 10
10 - 2020 - 3030 - 4040 - 50
gt 50
Figure 3-8 Grout intake lm per a grouting hole at the chainages 0 - 1525
Figure 3-9 Average grout intake lgrouting hole-m per a grouting fan at the chainages
0 - 1525
22
Table 3-1 Drilling patterns (for the usual tunnel profile) for the chainages 0 - 2000 in
the ONKALO access tunnel
Chainage Distance between holes (m) No of grouting holes fan
0 - 100 15 34
100 - 155 20 27
155 - 916 25 22
916 - 980 Customized drill patterns
980 - 1405 25 22
1405 - 1880 15 34
1880 15 17
1900 - 2000 15 34 Distance measured between the endpoints of the holes
Grouting holes inside the tunnel profile a grouting experiment
The leakage water inflow and the leakage mapping were the control measures of the
grouting results Occasionally the grouting result were controlled with control holes
which are drilled after grouting In the beginning the control holes were drilled
systematically but they were given up at the chainage ~ 120 m Currently they are
drilled eg for the shafts or grouting experiments
Grouting experiences have been analysed visually and by correlations The first 1000 m
of the access tunnel has been studied in detail A supplementary study in order to verify
the results and study the weird observations in more details covered also the data at the
chainages 1000 - 1850
The assessments of the first 1000 m of the access tunnel showed that the remained water
leakage after grouting is not as much correlated to geological features as to singular
fractures and rock bolts The major leaks seem to match fairly well with fan beginnings
and ends The bolts that extend beyond the grout curtain probably cause the leaks
Minor leaks remaining indicated also that leakages were distributed quite evenly along
the first 1000 m although geological and hydrological circumstances have varied a lot
This indicates that the remaining leakages are due to the used grouting material
(cement-based grouts) and technique (stop criterion) The sealing efficiency determined
by using control holes (thus calculated only for a few fans) was typically good out of
12 areas 9 showed a sealing efficiency of over 99 Only one place gave a poor result
with a sealing efficiency of 60 The sealing efficiency is the initial transmissivity
(probe hole result) minus the end transmissivity (from control holes) divided with the
initial transmissivity and it is usually given in percentage The sealing efficiency is not
used as an acceptance criterion in ONKALO
23
Grouting fans 960 ndash 956 ndash 940 ndash 935 ndash 921 ndash 916 - 905
935
916
905
921
940
956
960
Grouting fans 960 ndash 956 ndash 940 ndash 935 ndash 921 ndash 916 - 905
935
916
905
921
940
956
960
Grout take lmlt 0
0 - 55 - 10
10 - 2020 - 3030 - 4040 - 50
gt 50
Grout take lmlt 0
0 - 55 - 10
10 - 2020 - 3030 - 4040 - 50
gt 50
Figure 3-10 The grouting of the hydrogeological structure RH19A (the geometry of the
RH19A Ahokas et al 2006) The structure was grouted with coarse cement based
grout in the chainages 916 935 and 956 After the grouting of the structure the smaller
fractures were grouted with microcement at the chainages 905 921 940 and 960
24
Grout take (dm3) in ONKALO access tunnel 0-2000 m
0
5000
10000
15000
20000
25000
0 71 145
253
342
446
540
580
644
730
855
915
956
1025
1076
1162
1232
1340
1466
1586
1701
1815
1920
Tunnel chainage (m)
Gro
ut
take (
dm
3)
Pre-grouting
Post-grouting
Figure 3-11 Grout intake per a fan (dm3) both pre- and post-grouting for the first
2000 m of the ONKALO access tunnel
In the first 1000 m three areas of the largest grout intake coincide with the brittle fault
intersections around the chainages 330 and 500 (450 l penetrated into a drill hole) and
with a ductile shear intersection approximately at the chainage 450 There seemed to
have been a poor correlation between the grout intake and rock mass quality The three
areas with a poor or a very poor Q index showed moderate grout intake and the areas
with high grout intake were situated in good quality rock The number of fractures
seemed not to be connected to the grout intake One possible explanation to this is that
grouting seals fractures ahead of the excavation along gently dipping fractures another
reason for these may have been that in densely fractured rock the fractures were more
likely clogged by joint fillings and thus hinder grout penetration The third possible
explanation is that in densely fractured rock the fractures are shorter and narrower than
in sparsely fractured rock Based on the ONKALO fracture mapping data the
orientation of visible fractures with grout mass infilling was compared with all fracture
observations There is clear difference in the dip values between the fracture groups
The fractures with grouting mass infilling are more often gently dipping whereas all the
fractures are more often steeply dipping
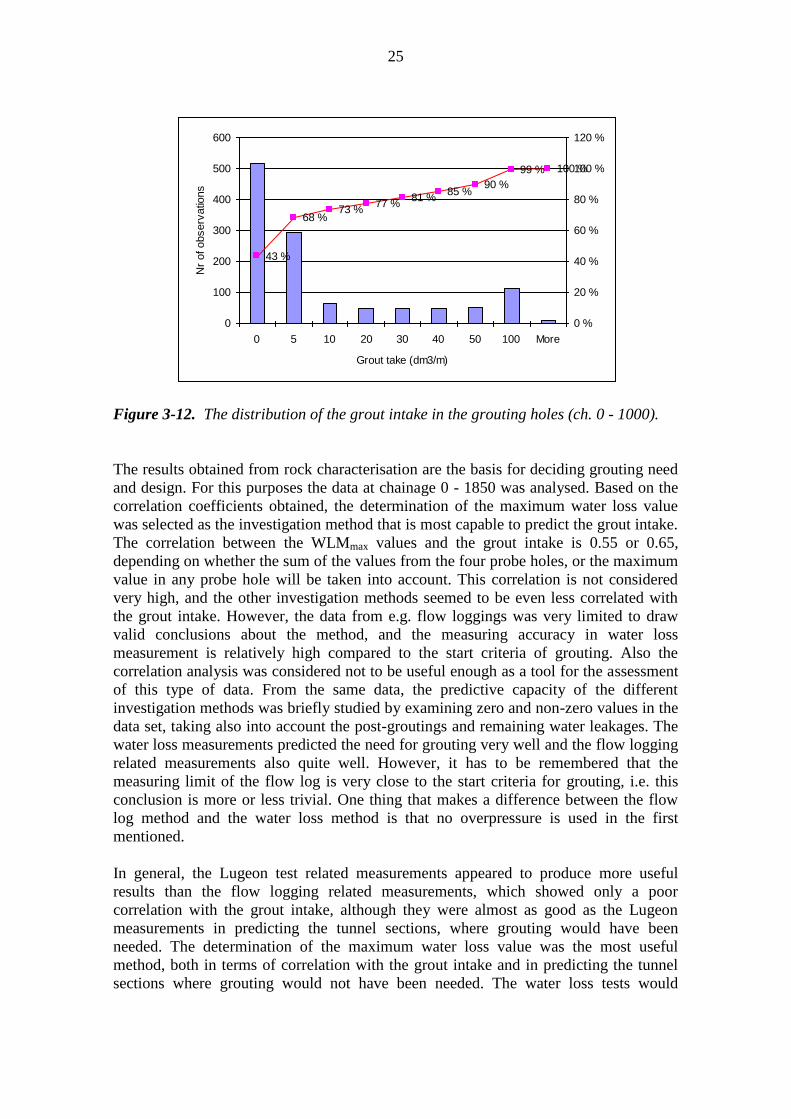
Within the first 1000 m of the tunnel it was observed that in 13 of the grouting holes
the grout intake was high and in 43 of the holes the grout intake was less or as much
as the hole volume (Figure 3-12) As the tunnel has gone deeper less and less of
groutable holes have been encountered That indicates either invalid stop criteria that
ignored the existence of tight holes andor the water conducting channels are far apart
and therefore difficult to hit
25
43
68 73
77 81
85 90
99 100
0
100
200
300
400
500
600
0 5 10 20 30 40 50 100 More
Grout take (dm3m)
Nr
of observ
atio
ns
0
20
40
60
80
100
120
Figure 3-12 The distribution of the grout intake in the grouting holes (ch 0 - 1000)
The results obtained from rock characterisation are the basis for deciding grouting need
and design For this purposes the data at chainage 0 - 1850 was analysed Based on the
correlation coefficients obtained the determination of the maximum water loss value
was selected as the investigation method that is most capable to predict the grout intake
The correlation between the WLMmax values and the grout intake is 055 or 065
depending on whether the sum of the values from the four probe holes or the maximum
value in any probe hole will be taken into account This correlation is not considered
very high and the other investigation methods seemed to be even less correlated with
the grout intake However the data from eg flow loggings was very limited to draw
valid conclusions about the method and the measuring accuracy in water loss
measurement is relatively high compared to the start criteria of grouting Also the
correlation analysis was considered not to be useful enough as a tool for the assessment
of this type of data From the same data the predictive capacity of the different
investigation methods was briefly studied by examining zero and non-zero values in the
data set taking also into account the post-groutings and remaining water leakages The
water loss measurements predicted the need for grouting very well and the flow logging
related measurements also quite well However it has to be remembered that the
measuring limit of the flow log is very close to the start criteria for grouting ie this
conclusion is more or less trivial One thing that makes a difference between the flow
log method and the water loss method is that no overpressure is used in the first
mentioned
In general the Lugeon test related measurements appeared to produce more useful
results than the flow logging related measurements which showed only a poor
correlation with the grout intake although they were almost as good as the Lugeon
measurements in predicting the tunnel sections where grouting would have been
needed The determination of the maximum water loss value was the most useful
method both in terms of correlation with the grout intake and in predicting the tunnel
sections where grouting would not have been needed The water loss tests would
26
become more useful if a higher pressure was applied The pressure should be in the
same order of magnitude with the grouting pressure used in pre-grouting and the test
device should measure very small water flows
The comparisons were run between reliable flow logging data sets and corresponding
MWD (measure while drilling) data sets gathered No correlation was found The
algorithms in Rockma software should have been at least calibrated However it is still
uncertain whether the MWD data can be used for purposes of grouting design and
planning in ONKALO where high hydraulic head and tight fractures prevail
34 Reference sites
The experiences from reference sites were gathered by Hollmeacuten (2007) and the key
information has been compiled in the Tables 3-2 and 3-3 below More detailed
information can be found in Hollmeacuten (2007) The reference sites were selected to
represent either deep rock conditions or strict requirements for water inflows The
grouting experiences under high groundwater pressure exist but the problem was a poor
reporting of the experiences gained
In an addition to the reference sites presented in Tables 3-2 and 3-3 Hollmeacuten (2007)
found brief information form three other Norwegian tunnels including the Aringkrafjord
tunnel with the overburden of 600 m At a time of the commencement of systematic
post-grouting was started the water pressure was about 46 MPa and total amount of the
ingress was in a range of 3 - 5 m3min per a geological zone In that tunnel the final
leakage was 10 dm3min100 m which was regarded satisfactory The Eiksund traffic
tunnel is the worldrsquos deepest sub sea tunnel (the completion due in February 2008) The
tunnel is nearly 8 km long and dives to almost 300 m beneath the fjord surface The
acceptable water inflow into the tunnel was set less than 30 dm3min100 m The
decision of grouting is based on systematically drilled probe holes Grouting pressures
up to 10 MPa are used In the shallow located Bekkestua tunnel the limit of water
ingress into the tunnel was set as a maximum 2 dm3min100 m of tunnel The used
cement (Portland cement or micro grained Portland cement) was selected according to
the observed leakage from holes Large volumes of grout were used The leakage was
reduced to about 07 dm3min100 m of tunnel Portland cement based grout was used
only within the most leaking areas where the rates got up to 17 dm3min100 m of
tunnel
Essential new hints or ideas that could be used in ONKALO were not found in this
literatury study However the study confirmed that water leakages can be handled The
challenge in the case of ONKALO is the design requirements which are somewhat
contradictory
27
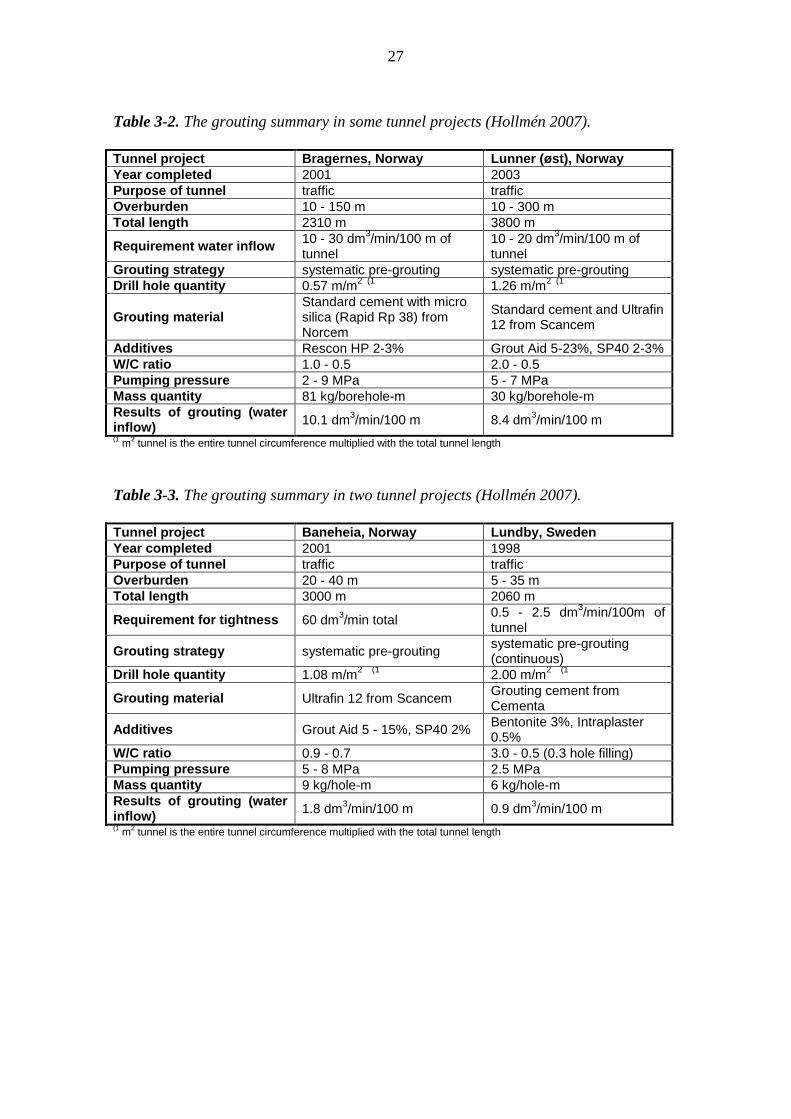
Table 3-2 The grouting summary in some tunnel projects (Hollmeacuten 2007)
Tunnel project Bragernes Norway Lunner (oslashst) Norway
Year completed 2001 2003
Purpose of tunnel traffic traffic
Overburden 10 - 150 m 10 - 300 m
Total length 2310 m 3800 m
Requirement water inflow 10 - 30 dm
3min100 m of
tunnel 10 - 20 dm
3min100 m of
tunnel
Grouting strategy systematic pre-grouting systematic pre-grouting
Drill hole quantity 057 mm2 (1
126 mm2 (1
Grouting material Standard cement with micro silica (Rapid Rp 38) from Norcem
Standard cement and Ultrafin 12 from Scancem
Additives Rescon HP 2-3 Grout Aid 5-23 SP40 2-3
WC ratio 10 - 05 20 - 05
Pumping pressure 2 - 9 MPa 5 - 7 MPa
Mass quantity 81 kgborehole-m 30 kgborehole-m
Results of grouting (water inflow)
101 dm3min100 m 84 dm
3min100 m
(1 m
2 tunnel is the entire tunnel circumference multiplied with the total tunnel length
Table 3-3 The grouting summary in two tunnel projects (Hollmeacuten 2007)
Tunnel project Baneheia Norway Lundby Sweden
Year completed 2001 1998
Purpose of tunnel traffic traffic
Overburden 20 - 40 m 5 - 35 m
Total length 3000 m 2060 m
Requirement for tightness 60 dm3min total
05 - 25 dm3min100m of
tunnel
Grouting strategy systematic pre-grouting systematic pre-grouting (continuous)
Drill hole quantity 108 mm2 (1
200 mm2 (1
Grouting material Ultrafin 12 from Scancem Grouting cement from Cementa
Additives Grout Aid 5 - 15 SP40 2 Bentonite 3 Intraplaster 05
WC ratio 09 - 07 30 - 05 (03 hole filling)
Pumping pressure 5 - 8 MPa 25 MPa
Mass quantity 9 kghole-m 6 kghole-m
Results of grouting (water inflow)
18 dm3min100 m 09 dm
3min100 m
(1 m
2 tunnel is the entire tunnel circumference multiplied with the total tunnel length
28
29
4 ENHANCED UNDERSTANDING OF GROUTING DESIGN AND EXECUTION
41 General
Common steps in grouting design are
1 Set the functional requirements targets for a tunnel
2 Analyse the data available of water conductive geological features
3 Set the limit for maximum water inflow
4 Establish the start criteria for grouting
5 Engineer the drilling patterns grout mixes and the stop criteria for grouting
6 Specify the other requirements for work including the verification of the grouting
result and quality control and
7 Specify the requirements for documentation and document control
Some of the above mentioned points are emphasised more than the others in this work
Posiva sets targets for water inflow and the grouting (grout type and grout quantity) and
thus they are not evaluated further The available information from drill holes in
ONKALO area was studied from the grouting point of view The start and stop criteria
are paid much attention to since they are important but poorly understood parts of the
grouting design The design of drilling patterns grout mixes and work specifications are
customary design work but they should not be treated separately from the start and stop
criteria
The national and international standards and norms do not guide the optimisation work
sufficiently The national norm (Concrete Association of Finland 2006) does not give
the guidelines for eg
1 Setting the grouting start criteria for the different characterisation methods
2 The quality control tests needed for determination of the mix properties required in
the design
3 Selectingdesigning the mixes for the different rock conditions
4 Grouting in the deep rock (including the guidelines for the water loss measurement
and the grouting pressures) and
5 The design work (to involve the pumping time to other design parameters)
These subjects are paid an attention to in this work
Some items mentioned above are discussed here from the theoretical point of view The
suggestion of application in ONKALO is presented later in this work (Chapters 5-7)
42 Start criteria for grouting
The criteria when grouting is started are important part of controlling groundwater Low
trigger value for grouting means low water leakages but possibly results in much of
grouting and grouting holes which is not always desirable On the other hand high
trigger level may be desirable from the point of view of grout intake or number of
30
grouting holes but not from the remaining water leakages (long term safety aspects)
Practically the start criteria mean a selection of a suitable characterisation method or a
combination of those and derived quantitative trigger levels It is important that the
start criterion is based on the information that can be accurately measured
The flow log measurement water loss measurement and measuring out flowing water
are complementary methods to characterize the probe holes in ONKALO In order to
select one or several methods both the suitability and reliability of the method(s) and the
priority of the grouting objectives should be taken into account while making a choice
between the characterization methods or a combination of them However those
methods tell nothing about fracture orientation or eg the channelling of the flow
If having several methods in use for example due to the reasons of a) complement the
picture of rock and b) verify the availability of the result the start criterion set for
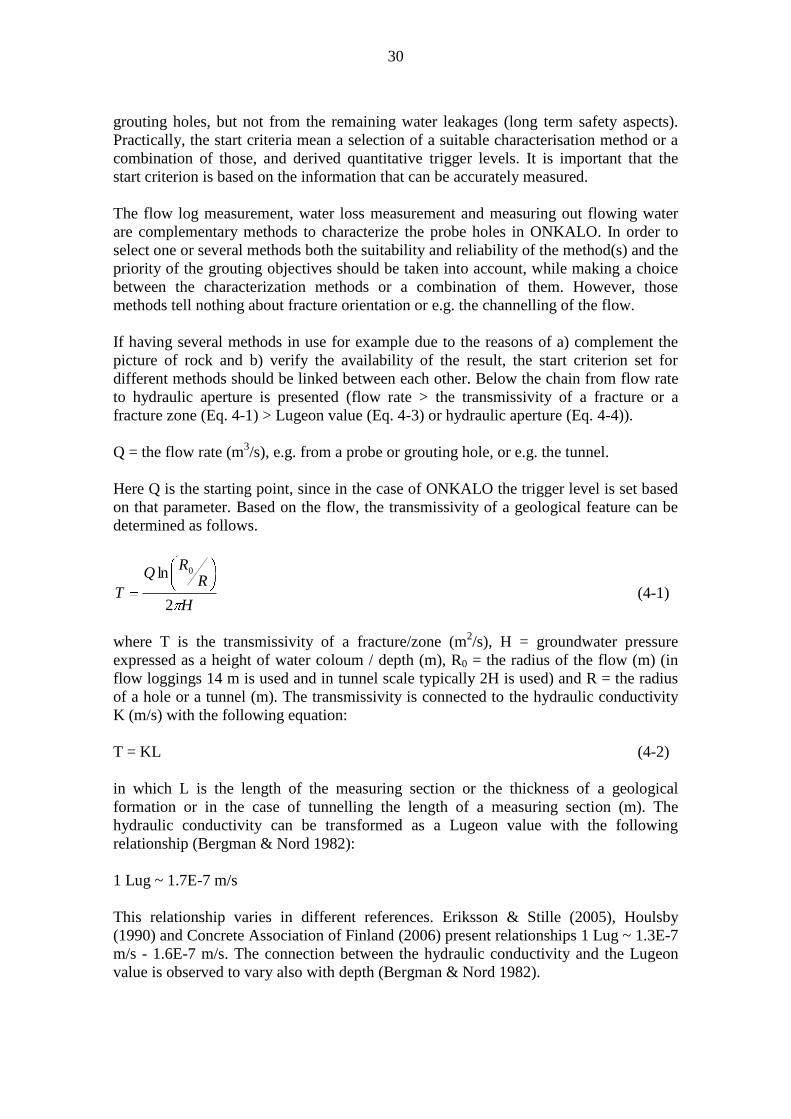
different methods should be linked between each other Below the chain from flow rate
to hydraulic aperture is presented (flow rate gt the transmissivity of a fracture or a
fracture zone (Eq 4-1) gt Lugeon value (Eq 4-3) or hydraulic aperture (Eq 4-4))
Q = the flow rate (m3s) eg from a probe or grouting hole or eg the tunnel
Here Q is the starting point since in the case of ONKALO the trigger level is set based
on that parameter Based on the flow the transmissivity of a geological feature can be
determined as follows
H
RR
Q
T2
ln 0
(4-1)
where T is the transmissivity of a fracturezone (m2s) H = groundwater pressure
expressed as a height of water coloum depth (m) R0 = the radius of the flow (m) (in
flow loggings 14 m is used and in tunnel scale typically 2H is used) and R = the radius
of a hole or a tunnel (m) The transmissivity is connected to the hydraulic conductivity
K (ms) with the following equation
T = KL (4-2)
in which L is the length of the measuring section or the thickness of a geological
formation or in the case of tunnelling the length of a measuring section (m) The
hydraulic conductivity can be transformed as a Lugeon value with the following
relationship (Bergman amp Nord 1982)
1 Lug ~ 17E-7 ms
This relationship varies in different references Eriksson amp Stille (2005) Houlsby
(1990) and Concrete Association of Finland (2006) present relationships 1 Lug ~ 13E-7
ms - 16E-7 ms The connection between the hydraulic conductivity and the Lugeon
value is observed to vary also with depth (Bergman amp Nord 1982)
31
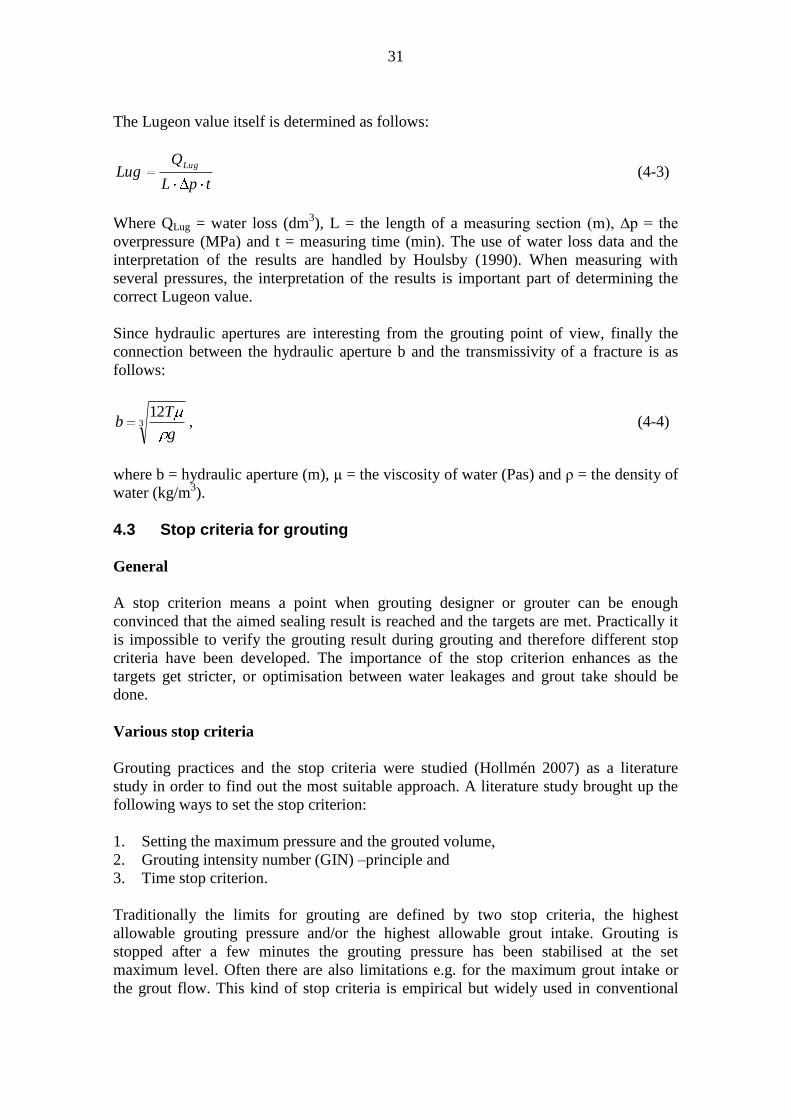
The Lugeon value itself is determined as follows
tpL
QLug
Lug (4-3)
Where QLug = water loss (dm3) L = the length of a measuring section (m) ∆p = the
overpressure (MPa) and t = measuring time (min) The use of water loss data and the
interpretation of the results are handled by Houlsby (1990) When measuring with
several pressures the interpretation of the results is important part of determining the
correct Lugeon value
Since hydraulic apertures are interesting from the grouting point of view finally the
connection between the hydraulic aperture b and the transmissivity of a fracture is as
follows
312
g
Tb (4-4)
where b = hydraulic aperture (m) μ = the viscosity of water (Pas) and ρ = the density of
water (kgm3)
43 Stop criteria for grouting
General
A stop criterion means a point when grouting designer or grouter can be enough
convinced that the aimed sealing result is reached and the targets are met Practically it
is impossible to verify the grouting result during grouting and therefore different stop
criteria have been developed The importance of the stop criterion enhances as the
targets get stricter or optimisation between water leakages and grout take should be
done
Various stop criteria
Grouting practices and the stop criteria were studied (Hollmeacuten 2007) as a literature
study in order to find out the most suitable approach A literature study brought up the
following ways to set the stop criterion
1 Setting the maximum pressure and the grouted volume
2 Grouting intensity number (GIN) ndashprinciple and
3 Time stop criterion
Traditionally the limits for grouting are defined by two stop criteria the highest
allowable grouting pressure andor the highest allowable grout intake Grouting is
stopped after a few minutes the grouting pressure has been stabilised at the set
maximum level Often there are also limitations eg for the maximum grout intake or
the grout flow This kind of stop criteria is empirical but widely used in conventional
32
tunnelling This approach which complies with the national norm (Concrete
Association of Finland 2006) has been used in ONKALO where adequate limits for
the grouting pressure is set based on the rules for grouting pressures (the smallest
fracture to be grouted and the aimed penetration length determined according to
Concrete Association of Finland (2006) and the limits for grout intake based on the
experiences obtained during tunnelling
Another stop criteria typically used in dam grouting is developed by Lombardi and
Deere (1993) and Lombardi (1997) and further studied for tunnelling purposes eg by
Brantberger (2000) The short overview is done and presented by Hollmeacuten (2007) This
so called Grouting Intensity Number (GIN method) defines the limiting curve by three
parameters the maximum pressure the maximum grouted volume and the empirically
selected GIN value The idea of the method is to reduce the risk of hydro fracturing In
practice when the volume of injected grout is low higher pressures can be used And
when the volume of grout injected is high the pressure should be lower Any
combination of the grout pressure and the grout intake can be used as long as their
product falls under the selected GIN curve Grouting is to be stopped when the pressure
rises above the selected maximum limit the grout intake rises above the selected
maximum limit or the product of the grout intake and the pressure rises above the
selected GIN value According to Hollmeacuten (2007) the problem of the GIN value is that
it cannot be explicitly solved Based on the literature study (Hollmeacuten 2007) the GIN
method has been used only once in tunnelling in the Goumlta Tunnel in Sweden Even
though the GIN value was very low most of the performed groutings were stopped to
the maximum pressure or to the maximum volume
The third way to set the stop criteria Hollmeacuten (2007) found is an analytical approach
also called the time stop grouting The model is developed by Chalmers University of
Technology (CTH) and Royal University of Technology (KTH) in Sweden (Gustafson
amp Stille 2005) In this approach the distance between grouting holes the grouting
pressure the fracture openings and the rheological properties of grout are linked with
each other A desired penetration length from the grouting hole in the smallest fracture
to be sealed is to be determined Then the time the grout (with certain rheological
properties) is to be pumped into the rock under the predetermined pressure can be
calculated Or another way around the desired grouting time can be set and the required
grout and the grouting pressure will be adjusted The approach has a complicated
physical background and the implementation requires simplifications and
approximations
In principle this is the only method to link the fracture and the grout properties to the
pumping pressure and the time and thus the design can be continuously presented As
the drawbacks there is very limited practical experience the method is sensitive to eg
the fracture characteristics available (fracture apertures) and to the rheological
properties of the grout Also it is an advantage to know whether the grout flow is one-
dimensional (channel-like) or two-dimensional (a planar fracture or a fracture with a
varying aperture) According to Hollmeacuten (2007) the stop criteria based on the analysis
of the grout penetration is not easy one to use when fracture system is complicated but
may be usable when fracture system is simple The criterion is also difficult to use if
the information about fracture characteristics is unreliable Therefore further
33
development of the time stop criterion is needed since exact characterization at the site
is very difficult
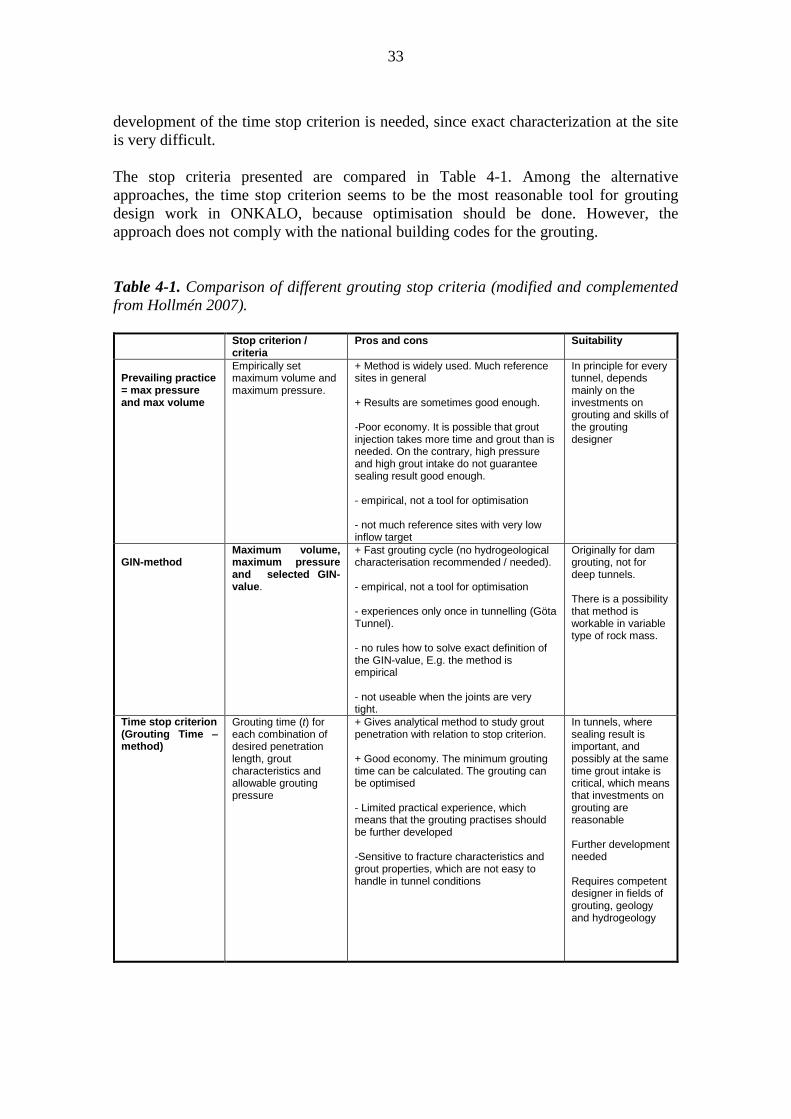
The stop criteria presented are compared in Table 4-1 Among the alternative
approaches the time stop criterion seems to be the most reasonable tool for grouting
design work in ONKALO because optimisation should be done However the
approach does not comply with the national building codes for the grouting
Table 4-1 Comparison of different grouting stop criteria (modified and complemented
from Hollmeacuten 2007)
Stop criterion
criteria Pros and cons Suitability
Prevailing practice = max pressure and max volume
Empirically set maximum volume and maximum pressure
+ Method is widely used Much reference sites in general + Results are sometimes good enough -Poor economy It is possible that grout injection takes more time and grout than is needed On the contrary high pressure and high grout intake do not guarantee sealing result good enough - empirical not a tool for optimisation - not much reference sites with very low inflow target
In principle for every tunnel depends mainly on the investments on grouting and skills of the grouting designer
GIN-method
Maximum volume maximum pressure and selected GIN-value
+ Fast grouting cycle (no hydrogeological characterisation recommended needed) - empirical not a tool for optimisation - experiences only once in tunnelling (Goumlta Tunnel) - no rules how to solve exact definition of the GIN-value Eg the method is empirical - not useable when the joints are very tight
Originally for dam grouting not for deep tunnels There is a possibility that method is workable in variable type of rock mass
Time stop criterion (Grouting Time ndashmethod)
Grouting time (t) for each combination of desired penetration length grout characteristics and allowable grouting pressure
+ Gives analytical method to study grout penetration with relation to stop criterion + Good economy The minimum grouting time can be calculated The grouting can be optimised - Limited practical experience which means that the grouting practises should be further developed -Sensitive to fracture characteristics and grout properties which are not easy to handle in tunnel conditions
In tunnels where sealing result is important and possibly at the same time grout intake is critical which means that investments on grouting are reasonable Further development needed Requires competent designer in fields of grouting geology and hydrogeology
34
Time stop criterion
The relationship between grout properties grouting pressure grout penetration length
and grouting time with cement based grouts
The approach is presented by Gustafson amp Stille (1995) and in the literatury study by
Hollmeacuten (2007)
For a certain grout there is a maximum penetration distance (Imax) at steady state into a
fracture (Haumlssler 1991 Gustafson amp Stille 1996)
0
max2
)( bppI
wg (4-5)
where pg = grouting pressure (Pa) wb pgH 23 (Gustafson 2005 Concrete
Association of Finland 2006) pw = groundwater pressure (Pa) b = the hydraulic
aperture of fracture (m) τ0 = the yield strength of grout (Pa) ρb = the density of rock
(kgm3) g = gravitational acceleration (ms
2 ) and H = depth below ground surface (m)
The equation for the maximum grout penetration (Haumlssler 1991) forms the basis for
analytical approximations for the grout penetration
Correspondingly there is a timescale given as the characteristic grouting time
(Gustafson amp Claesson 2004)
2
0
0
6 gpt (4-6)
Where t0= characteristic grouting time (s) μg= the plastic viscosity of grout (Pas) ∆pg =
grouting overpressure = pg ndash pw (Pa) and τ0 = the yield strength of grout (Pa)
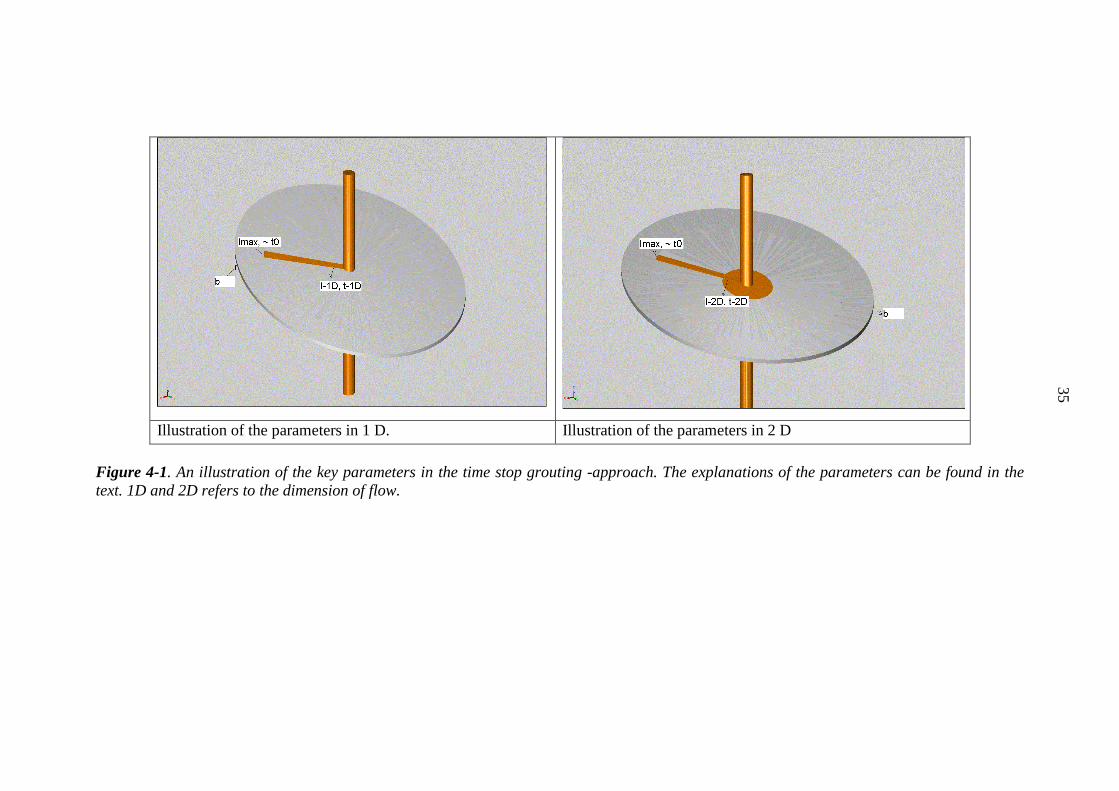
The maximum penetration length and the characteristic grouting time are thought to be
linked together (see Figure 4-1) even though they do not describe exactly the same
point of time However based on this starting point the time t (s) needed for pumping
grout (μg τ0) into a fracture with hydraulic aperture b (m) can be determined as the
desired penetration length I (m) according to the theories presented by Gustafson amp
Stille (2005) Gustafson amp Claesson (2004) In order to determine t relative penetration
length ID and relative penetration time tD are to be determined The key parameters used
in time stop criterion -approach are illustrated in Figure 4-1
Illustration of the parameters in 1 D Illustration of the parameters in 2 D
Figure 4-1 An illustration of the key parameters in the time stop grouting -approach The explanations of the parameters can be found in the
text 1D and 2D refers to the dimension of flow
35
36
The relative penetration ID (s) is calculated with the help of the desired and the
maximum penetration lengths The relative penetration length is the same in all
fractures cut by a borehole (Gustafson amp Stille 2005)
maxI
II D (4-7)
The corresponding relative grouting time (tD) is presented for one-dimensional (1D)
case which presents a flow channel and for two-dimensional (2D) case which presents
a planar fracture The determination of the relative grouting time and the
approximations for the relative time for the 1D and 2D cases are (developed by
Gustafson amp Stille 2005 a typing error corrected by Hollmen 2007)
0t
ttD (4-8)
21
21)1( DDt (4-9)
21
6)2( DDt (4-10)
Where t = the grouting time (s) to reach the point I and
D
D
I
I
24
2
(-) (4-11)
By selecting the dimensionality of the case the time for a certain grout to reach the
desired penetration in a fracture can be calculated
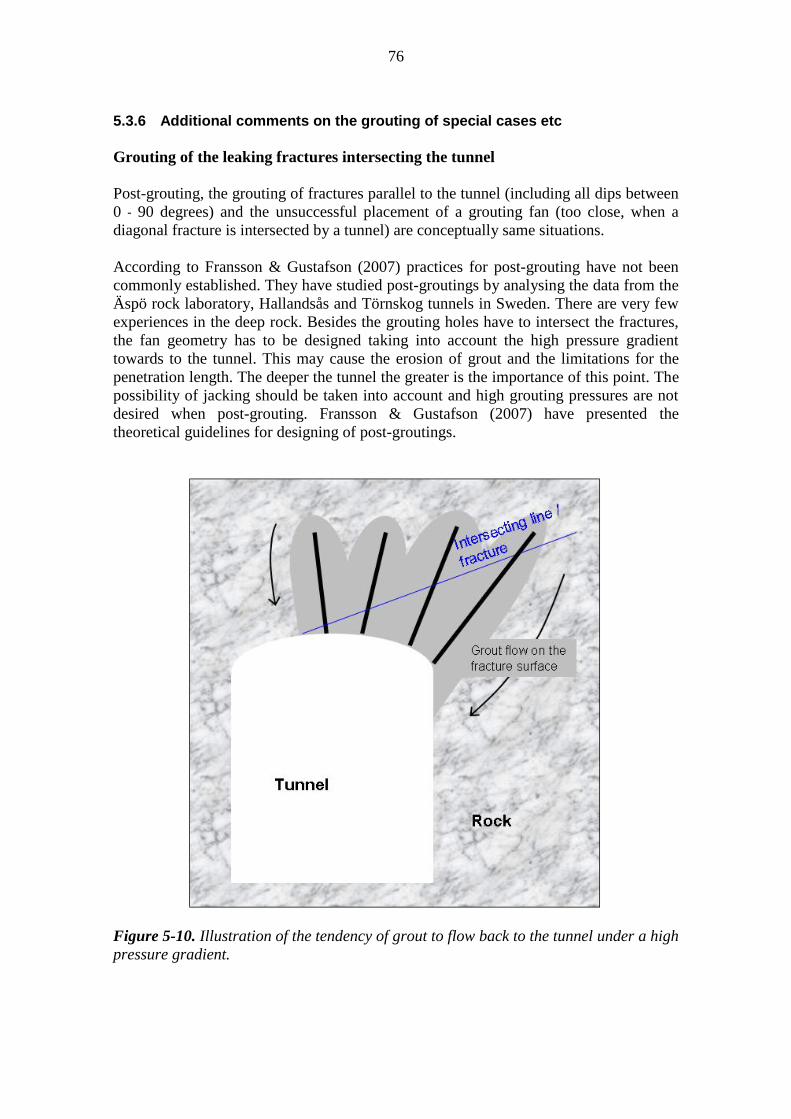
In order to prevent a possible backflow the ratio of water pressure (pw) and the excess
pressure (Δp) should be smaller than the relative penetration length (ID) (Fransson amp
Gustafson 2007 Axelsson 2006)
By varying the grout (its penetration ability and rheological properties) the grouting
pressure and the drilling pattern the optimal grouting for different rock conditions can
be designed According to this principle the stopping of the grouting can be controlled
via the pumping time
Relationship between grout properties grouting pressure grout penetration length and
grouting time with colloidal silica
Colloidal silica (also silica sol) is a Newtonian fluid and in order to control the spread of
it it is important to link the desired penetration length with the gelling time that is
controlled by the dosage of an accelerator in a mix The theory of the grouting with
37
colloidal silica is presented by Funehag (2007) A short overview is collected also by
Lokkila (2008)
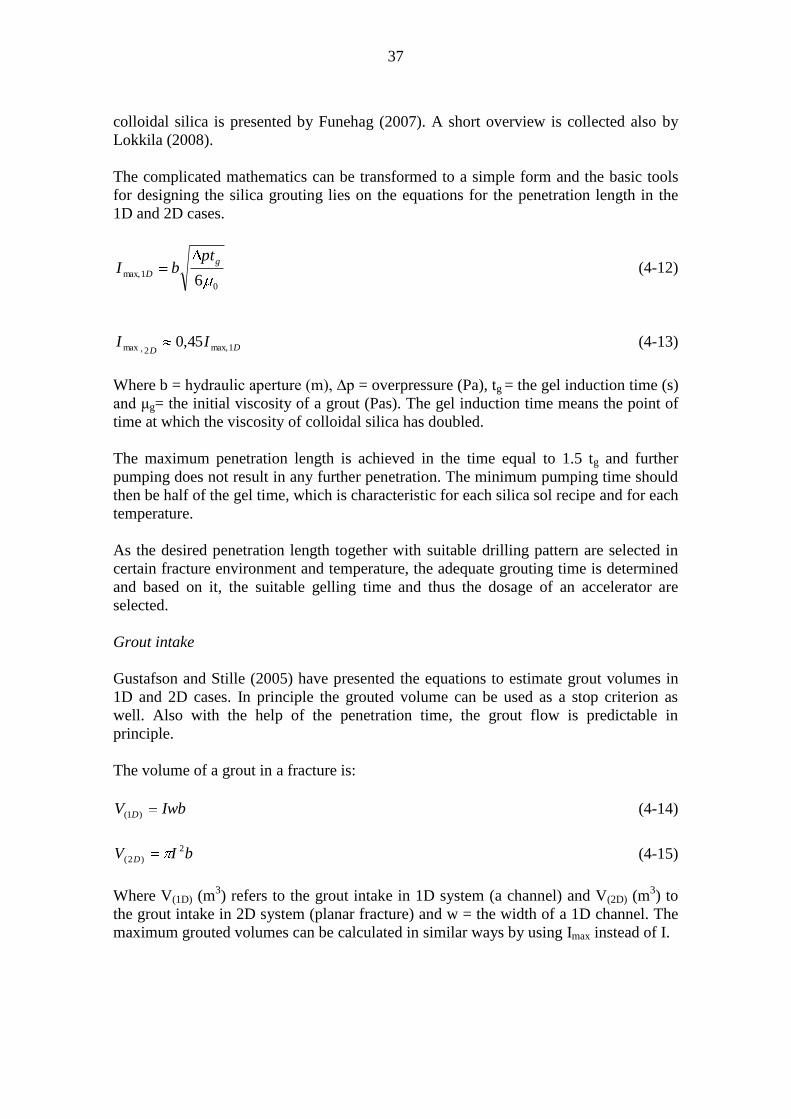
The complicated mathematics can be transformed to a simple form and the basic tools
for designing the silica grouting lies on the equations for the penetration length in the
1D and 2D cases
0
1max6
g
D
ptbI (4-12)
DDII 1max2max 450 (4-13)
Where b = hydraulic aperture (m) ∆p = overpressure (Pa) tg = the gel induction time (s)
and μg= the initial viscosity of a grout (Pas) The gel induction time means the point of
time at which the viscosity of colloidal silica has doubled
The maximum penetration length is achieved in the time equal to 15 tg and further
pumping does not result in any further penetration The minimum pumping time should
then be half of the gel time which is characteristic for each silica sol recipe and for each
temperature
As the desired penetration length together with suitable drilling pattern are selected in
certain fracture environment and temperature the adequate grouting time is determined
and based on it the suitable gelling time and thus the dosage of an accelerator are
selected
Grout intake
Gustafson and Stille (2005) have presented the equations to estimate grout volumes in
1D and 2D cases In principle the grouted volume can be used as a stop criterion as
well Also with the help of the penetration time the grout flow is predictable in
principle
The volume of a grout in a fracture is
IwbV D)1( (4-14)
bIV D
2
)2( (4-15)
Where V(1D) (m3) refers to the grout intake in 1D system (a channel) and V(2D) (m
3) to
the grout intake in 2D system (planar fracture) and w = the width of a 1D channel The
maximum grouted volumes can be calculated in similar ways by using Imax instead of I
38
If having a multiple fracture system the grouted volume in each of the fractures and
thus in the whole fracture system can be calculated by using relative grouted volumes
VD (-)
)1()1( DD DD IV (4-16)
2
)2()2( DD DD IV (4-17)
For the number of fractures the theoretical total volume is then
)1()1()1( max DDDVVV Dtot
(4-18)
)2()2()2( max DDDVVV Dtot
(4-19)
Uncertainties in time stop criterion
Like any other method the time stop criterion is sensible to a certain source data and
this causes uncertainties The aperture varies a lot in a single fracture even though the
transmissivity (hydraulic aperture) is studied to be able to describe the groutable
aperture well (Fransson 2001) However it is practically impossible to find a
representative hydraulic aperture with a few boreholes Discussion on the conceptual
understanding of fracture characteristics ndash especially the nature of the fracture aperture
ndash and its role as an uncertain factor are available in the reports by Hakami (1995)
Sievaumlnen (2002) and Lokkila (2008) The rheological properties of a grout have natural
variation due to the variation of cement qualities the measuring methods and also the
reological parameters yield strength and viscosity are interpreted with a models with
more or less confidence The rheological properties of grouts also vary with the time
Also the prevailing overpressure in a fracture always differs more or less from that one
readable at the grouting equipment
In order to understand the most important factors affecting the penetration length of a
grout a sensitivity analysis was done by Lokkila (2008) The analysis was carried out
by selecting the start values for each parameter and varying them one by one The
values for the parameters were selected among the observed properties and the expected
conditions
According to the results of Lokkila (2008) the factor that has the most significant effect
on the penetration length is the hydraulic aperture of a fracture The yield value and the
viscosity of a grout as well as the grouting overpressure also have a notable effect The
system is very sensible to these factors and due to this reason the focus should be
concentrated in the supply of accurate characterisation data the quality control of grout
mixes and careful follow up of the design during the grouting work On the contrary the
system is not that sensible to the pumping time of the grout ndash especially as the grouting
proceeds This should be understood so that relatively high increase in pumping time is
needed in order to increase the penetration length quite a little especially in small
fractures
39
44 Experiences from the field tests
Three grouting tests were performed in ONKALO during the year 2007 The first
grouting test was performed in the ONKALO access tunnel with cement-based low pH
grout The second grouting test was carried out in the personnel shaft 1 This test was
divided into three stages and the low pH grouts were used The third grouting test was a
pilot test with colloidal silica
From now on the method presented by Gustafson amp Stille (2005) is also called
Grouting Time ndashmethod as it was named during the grouting tests
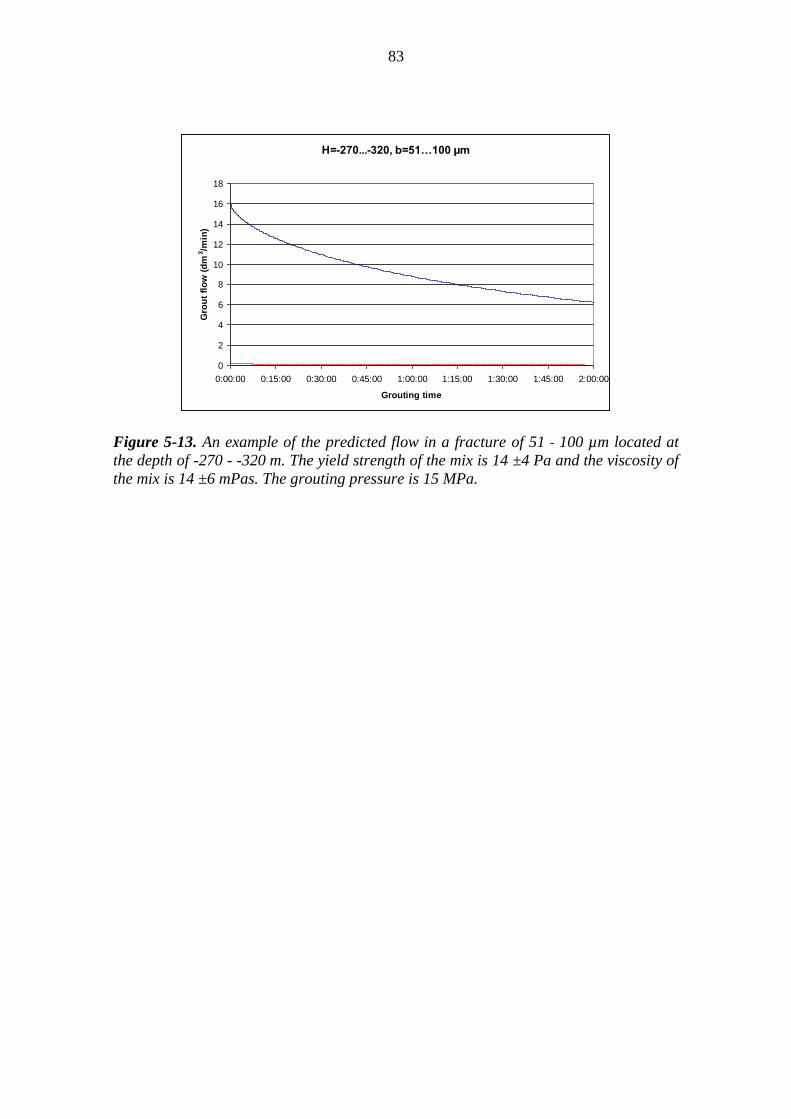
Test grouting in the access tunnel at the chainage 1880
The intention of the first grouting test was to practice the use of the time stop criterion
together with the grouting holes inside the tunnel profile The used grout was cement-
based low pH grout UF-41-14-4 The progress of the field test is reported in detail by
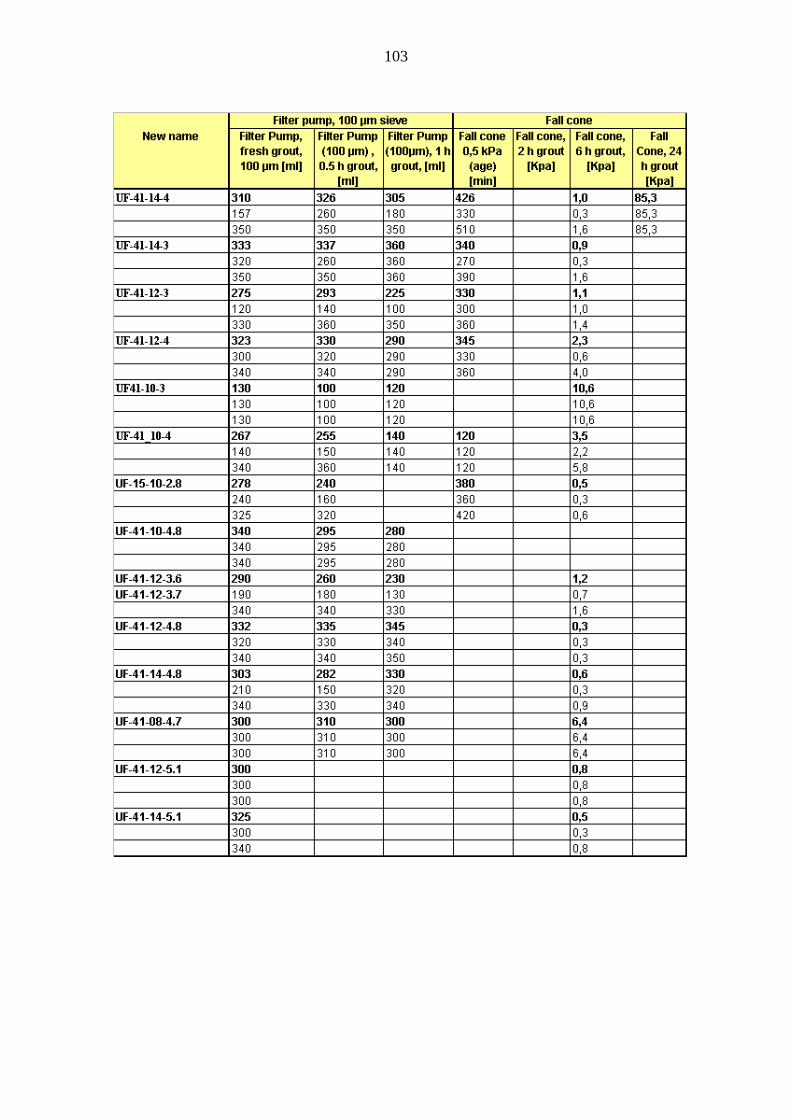
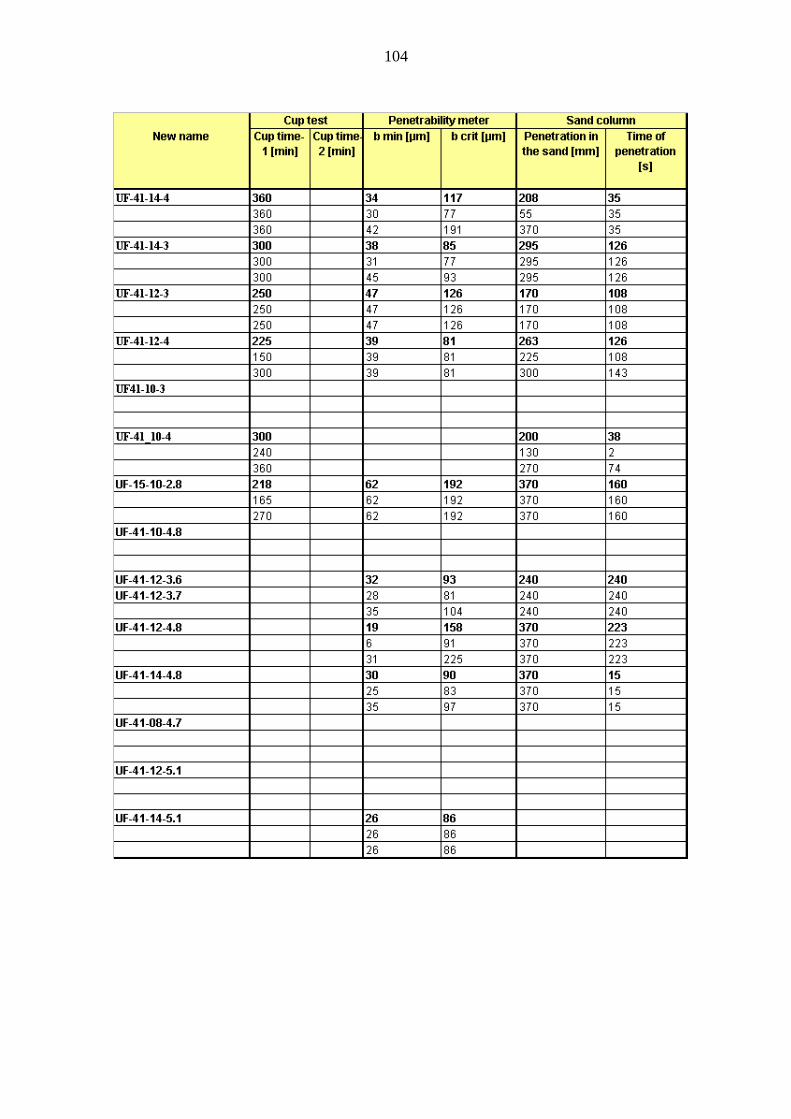
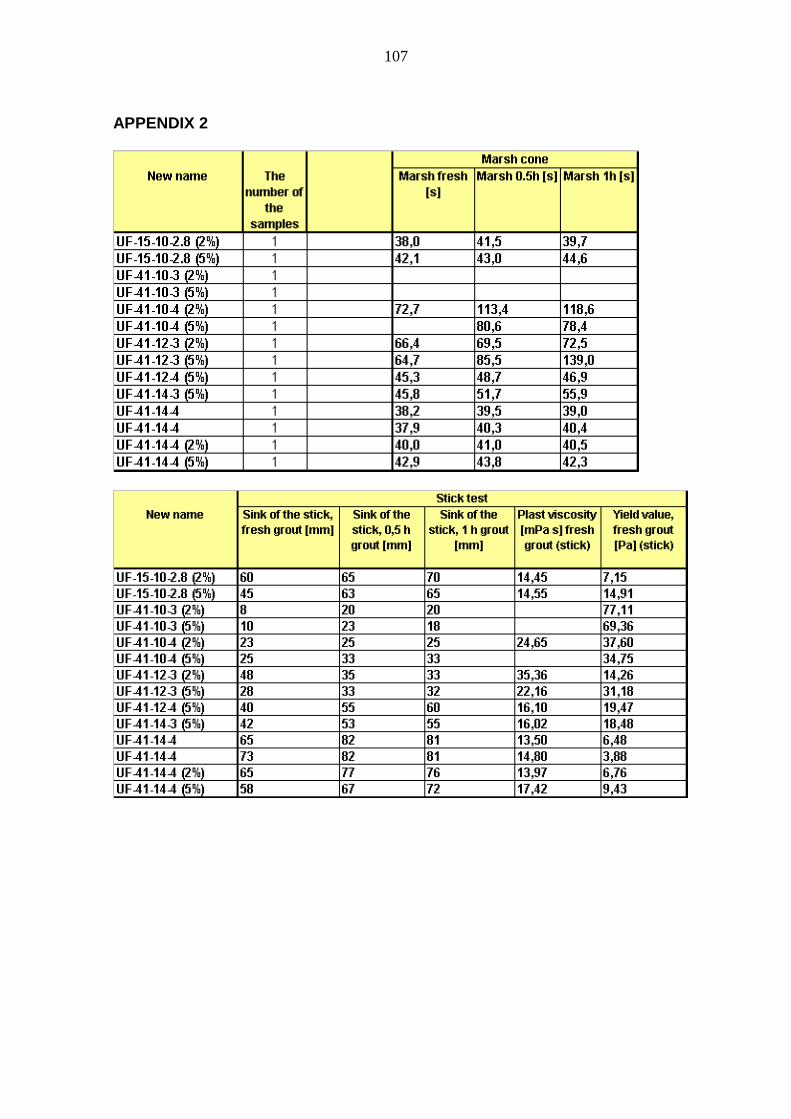
Hollmeacuten (2007) and the grout related tests by Ranta-Korpi et al (2007) The mix
properties are collected to the Appendices 1 and 2 The mix compositions are presented
in ldquoNames and compositions of groutsrdquo
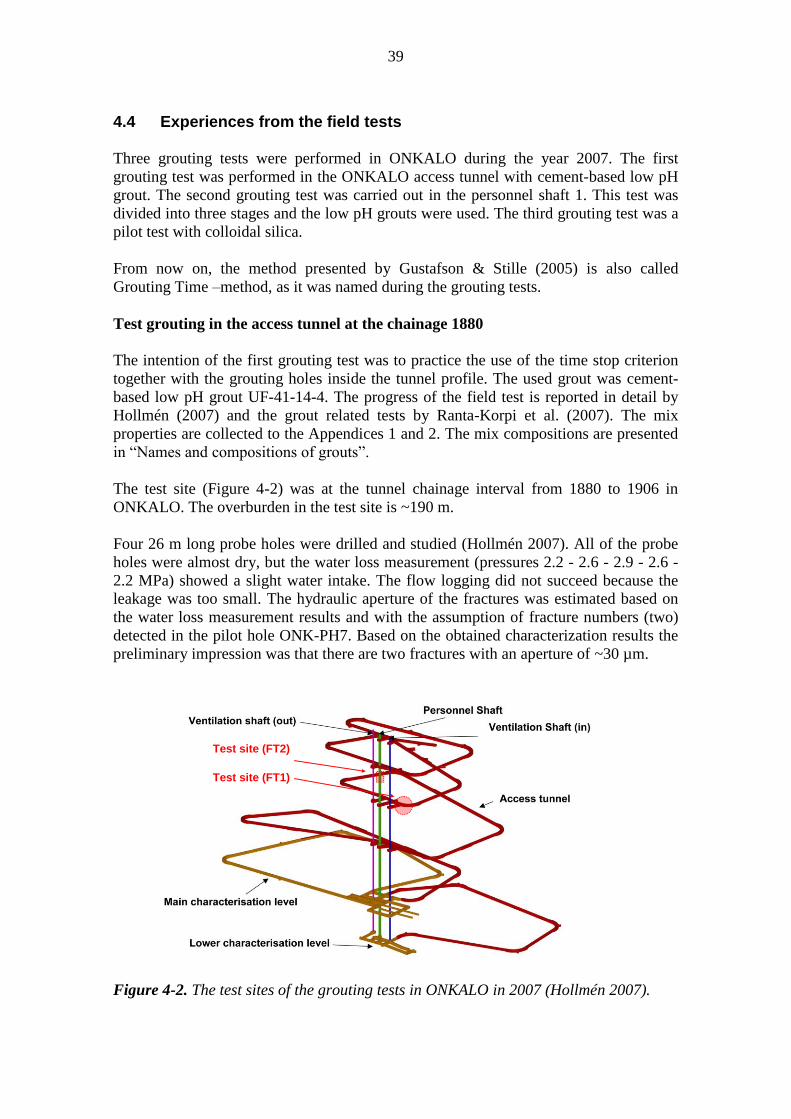
The test site (Figure 4-2) was at the tunnel chainage interval from 1880 to 1906 in
ONKALO The overburden in the test site is ~190 m
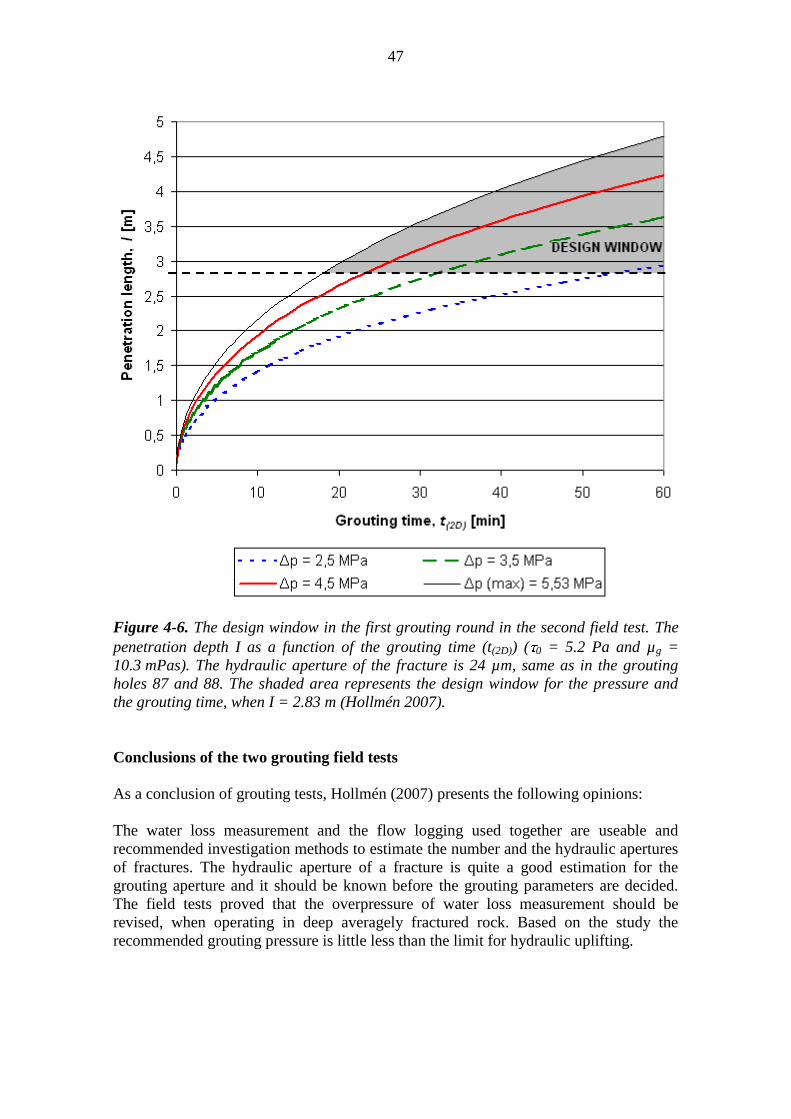
Four 26 m long probe holes were drilled and studied (Hollmeacuten 2007) All of the probe
holes were almost dry but the water loss measurement (pressures 22 - 26 - 29 - 26 -
22 MPa) showed a slight water intake The flow logging did not succeed because the
leakage was too small The hydraulic aperture of the fractures was estimated based on
the water loss measurement results and with the assumption of fracture numbers (two)
detected in the pilot hole ONK-PH7 Based on the obtained characterization results the
preliminary impression was that there are two fractures with an aperture of ~30 microm
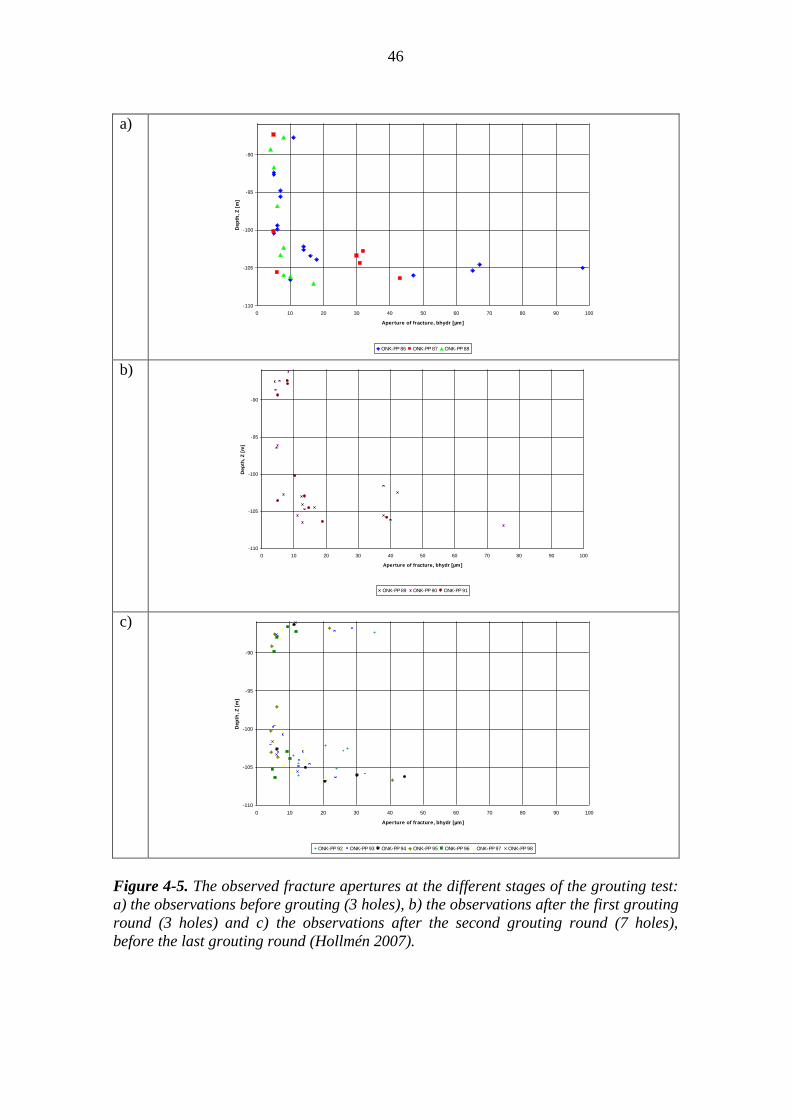
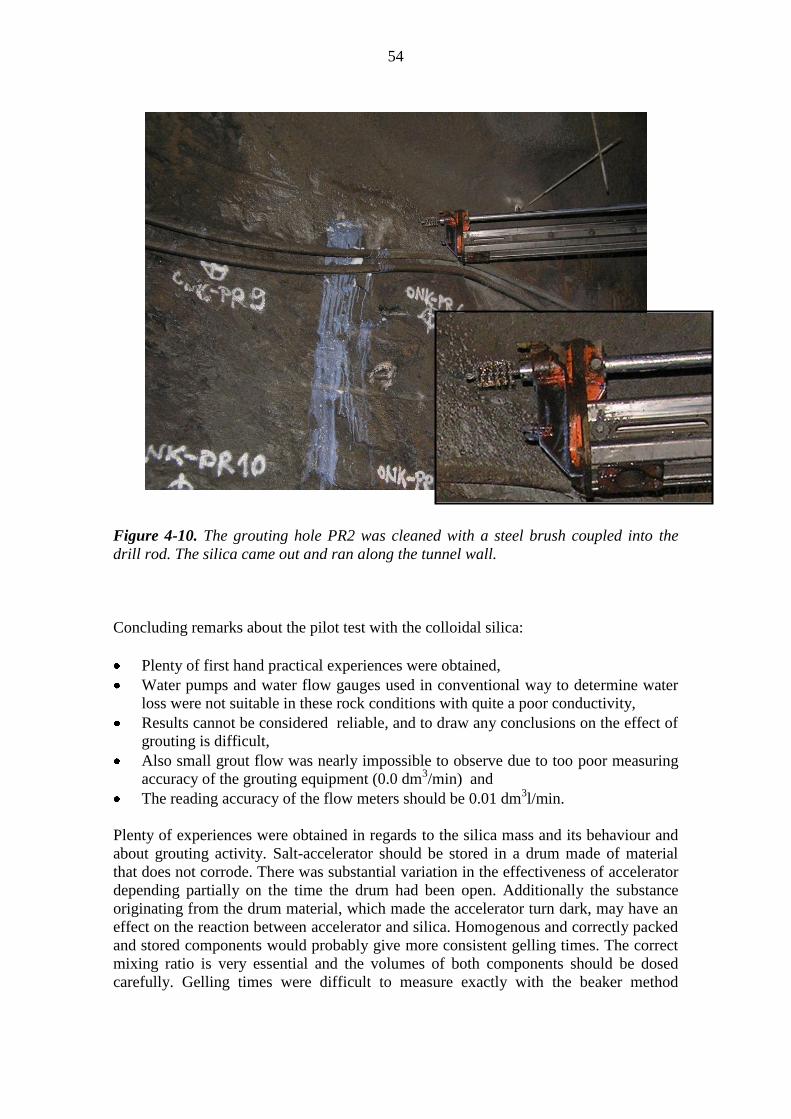
Figure 4-2 The test sites of the grouting tests in ONKALO in 2007 (Hollmeacuten 2007)
Test site (FT2)
Test site (FT1)
40
In order to study the GT method (time stop criterion) the intention was to design the
grouting to be fully optimised without any safety factors The grouting holes were
located inside the tunnel profile because it is one way to diminish the grout remaining
in rock after excavation
The grouting fan included 17 grouting holes (Oslash 54 mm) and every hole was about 26 m
long (Hollmeacuten 2007) The distance between them was 15 m and all were parallel with
the tunnel and inside the theoretical tunnel profile The flow logging and the water loss
measurement were done in all grouting holes The latter showed connections between a
few grouting holes Because the flow logging didnrsquot give any results the hydraulic
apertures of the fractures were again estimated from the water losses Again the number
of fractures (2 fractures) was estimated with the supposition from the pilot hole ONK-
PH7 and the calculated hydraulic apertures were similar varying between 12 - 30
microns
The test was carried out with Posivarsquos new grouting equipment of which the
components are made by Haumlny Figure 4-3 The equipment was in use in the tunnel for
the first time
There were no results of the mix UF-41-14-4 from the field using Posivaacutes new grouting
equipment Thus the material parameters of the grout were based on the rheology
measurements done in the laboratory
The intended grout penetration was 30 m outside the tunnel profile which means that
the penetrations of 32 - 38 m were needed (Hollmeacuten 2007) The grouting pressure of 8
MPa was the lowest to reach the desired penetration in reasonable grouting time
Because the fractures were very small and channelling like flow was assumed the
fracture system was assumed to be 1D and the grouting times for all single holes were
calculated using the GT method Against the theory the maximum grouting time (tmax)
was limited to 25 min even though the maximum calculated grouting times in some
holes were 40 min Also the stop criterion based on the minimum flow (0 l per 2 min)
was set ndash against the theory
41
Figure 4-3 Posivarsquos new grouting equipment (the mixers agitators and pumps made by
Haumlny) was used in the test (photograph by Kalle Hollmeacuten)
Unexpectedly the grout leaked from nearly all of the roof holes and finally from the
drift The total grout intake in the fan was 1402 dm3 out of which 744 were pumped
into three holes The total grout intake is almost the same than the volume of the
grouting holes and the pilot hole which was assumed to be fully or partly filled During
the grouting there were more connections between the holes than the water loss
measurement indicated There could be several reasons for the grout leaking but the
main reason is probably that on blasting round 1876 - 1880 the excavation damaged
zone (EDZ) extended longer to the rock mass than the packers (10 m) extended due to
the repair blasting Another reason for the grout leakage could be that the rock andor
the grout properties were inaccurate (Hollmeacuten 2007)
The grout properties used in the design were reviewed based on the field measurements
after the field test 1 and the results showed that the values (Ranta-korpi et al 2007
appendices 1 and 2) used in the design were more or less invalid The back calculation
was done by calculating the real viscosity of the grout with the help of the Marsh-funnel
results the stick results and the diagram by Haringkansson (1993) The quick outflow from
nearby grouting holes supported the idea obtained from the observed mix results These
observations showed that it is necessary to check the grout parameters at the site with
real grout mixer not only in the laboratory
Eight control holes were drilled in order to study the grouting result All of the control
holes (extended about 3 m out of the tunnel profile) were dry and one hole showed
42
water loss However the exact penetration length of the grout remains unknown since
the actual orientation of the fracture(s) was unknown Based on the leakage water
mapping the tunnel section was dry and the grouting seemed successful
Test grouting in the personnel shaft 1
The field test 2 was arranged in the ONKALOrsquos personnel shaft 1 from the depth level
-80 m to the level -110 m (Figure 4-2) The grouted area in the shaft was ca -86 -
-110 m (24 m long) and the radius of the shaft was 2 m The progress of the field test is
reported in detail by Hollmeacuten (2007) and the grout related tests by Ranta-Korpi et al
(2007) As more knowledge about the grouting material characteristics was available
they were taken into account in the calculations The mix properties are collected to the
Appendices 1 and 2
Again in order to study the GT method the intention was to design the grouting to be
fully optimised without any safety factors The grouting was done using Posivarsquos
grouting equipment (Figure 4-3)
The grouting was done in three stages in the first and the second rounds three grouting
holes per round were grouted and six holes were grouted in the third round (Hollmeacuten
2007) The second roundrsquos grouting holes were the control holes for the first round and
the grouting holes of the third round were the control holes for the second round
All grouting holes were vertical and they were inside the shaft profile because the
grouting holes outside the shaft profile are not accepted in ONKALO The holes were
core drilled The rock mass was characterized using the water loss test (single packer
and double packer with separation of 1 m) and the flow logging ndashtool Also deviation
measurements were done for the grouting holes
The low pH grouts were used and the recipes were selected separately for every
grouting in order to find an optimal solution (Hollmeacuten 2007) The design approach was
the time stop criterion and it was expected that the dimension of the flow would be 2D
The grouting pressures were set less than the limits possibly leading to the uplifting
which means that the maximum pressures should be less than 65 MPa The target grout
penetrations were 28 m 35 m and 40 m depending on the stage and the hole location
(Figure 4-4) The penetration lengths were selected in a way that a minimum coverage
of the grouting was aimed and no safety factors were used This was done due to
practicing the optimization and testing the method
43
Figure 4-4 The grouting hole locations and the grouting sequencing Sequence 1 the
holes no 86 - 88 Seq 2 the holes no 89 - 91 Seq 3 the holes no 92 - 98 The shaft
radius R is 2 m and the hole spacing is ~ 1 m In total 12 grouting holes were designed
and grouted (Hollmeacuten 2007)
The aim of the grouting in the first stage was to seal the largest fractures (Figure 4-5 a)
(Hollmeacuten 2007) In the hole no 86 the aim was to seal the fractures with apertures of
47 microm or larger and in the holes no 87 and 88 the fractures with the apertures of 24 microm
or larger Because all the holes were grouted at the same time the idea was to find the
same grouting time and the pressure in every hole by using different mixes if needed It
was designed that the grout UF-41-12-51 (τ0 asymp 888 Pa microg asymp 146 mPas) will be used to
the hole no 86 and the grout UF-41-14-51 (τ0 asymp 52 Pa microg asymp 103 mPas) to the holes no
87 and 88 The design window in this grouting stage is presented in Figure 4-6 After
the calculations the grouting time (2D model) was set to be 30 min and the grouting
pressure 45 MPa which means the overpressure of ca 35 MPa The calculated times
and pressures were the same in all holes
The hydraulic packers were set to the depth of 6 meters from the beginning of the holes
First the holes were filled with the grout (20 - 30 min) After that the pressure was
raised to the target level at the same time in every hole
The quality control tests for the first grout mix (UF-41-12-51) showed too low Marsh-
values therefore that mix was rejected and a new grout batch was mixed Because the
Marsh value was again too low the grout recipe was changed to the grout UF-41-12-36
44
(τ0 asymp 157 Pa microg asymp 251 mPas) which passed the quality control tests No changes to the
grouting times were done
The total grout intake was 1172 l out of which the proportion of the grouting holes was
328 l According to the dimensionality analysis the grout flow was one- two- and three-
dimensional during the grouting
After the grouting of the first stage the grouting holes of the second stage were drilled
and via them the result of the earlier grouting was studied The results of the flow
logging showed numerous fractures in the holes and the largest fracture aperture was
75 microm However the proportion of the larger fractures (gt 40 - 50 microm) was decreased
(Figure 4-5 b)
The grouting of the next rounds was designed and executed with the similar principle
(Hollmeacuten 2007) The grout for the next grouting round was UF-41-12-48 (τ0 asymp 888 Pa
microg asymp 1447 mPas) which was used in every hole (Ranta-korpi et al 2007) The aim of
the grouting in the second stage was to seal all the fractures down to 20 microm of an
aperture After the calculations for all holes the grouting time (t(2D)) was set to be
100 min and the grouting pressure 60 MPa which means the overpressure of ca
50 MPa
After all the holes were filled in the grouting pressures were raised to the target level
(60 MPa) in all holes at the same time After 10 minutes old and new grout came out
from one grouting hole and the grouting was interrupted It means that there were
connections between the grouting holes of the first and the second stages Shortly after
the grouting was continued the grout flow was very low in every hole ~ 00 dm3min
until the end of the grouting The total grout intake was 924 l out of which the
proportion of the grouting holes was about 13
The result of the second grouting was studied via the grouting holes of the third stage
(see Figure 4-5 c) The results of the flow logging still showed numerous fractures in all
holes and the largest fracture aperture was 45 microm The need for grouting was evident
even though the larger fractures had been sealed earlier
The third stage was grouted with the grout UF-41-14-4 (τ0 asymp 840 Pa microg asymp 104 mPas)
which was to be used in every hole The planned penetration length was 4 meters in
every hole and the aim was to seal all the fractures with apertures larger than 20 microm
The grouting time (t(2D)) was set to be 110 min and the grouting pressure 60 MPa All
holes were first filled and then grouted at the same time and due to this pipe branches
were used to connect the holes
During the grouting the pressures were less than the target level and the grout flows
were much higher than expected based on the results from the water loss measurement
and the flow logging The fracture system was very complicated and there were more
and larger fractures than expected After 90 minutes the grout leaked to the tunnel at the
chainage 960 (about 30 m away) When the grouting time 110 min was reached grout
flows were still very high (asymp 10 dm3min) in every hole Therefore the grout recipe was
changed for a thicker grout UF 41-10-4 (τ0 asymp 27 Pa microg asymp 278 mPas) and grouting was
45
continued with that grout about 50 min The grout flow and the total grout intakes were
still high in every hole which confirms the arguments that the results of the pre-
measurements were invalid Another possible explanation is that the fractures opened
during the grouting or that fracture infillings moved and new connections formed The
grout flow was two- and three-dimensional during the grouting and there was a large
fracture zone which skewed the dimension-analyses After the third grouting stage a
24 m long extra control hole was drilled The results showed still relatively high water
loss
All in all in this field test the fractures were slightly sealed after the first and the second
round especially the largest fractures but the effect was not so great than expected
(Hollmeacuten 2007) However there remained a question if the results of the measurements
were not reliable Therefore the real results of the grouting can be evaluated from the
possible water leakages after full-face boring Even though the 2D flow model was
used the total grout intake was much higher than expected after the tests in the grouting
holes Especially on the third round the total grout intake was very high in proportion
to the measured Lugeon values and the hydraulic apertures
46
a)
-110
-105
-100
-95
-90
0 10 20 30 40 50 60 70 80 90 100
Aperture of fracture bhydr [microm]
Dep
th Z
[m
]
ONK-PP 86 ONK-PP 87 ONK-PP 88
b)
-110
-105
-100
-95
-90
0 10 20 30 40 50 60 70 80 90 100
Aperture of fracture bhydr [microm]
Dep
th Z
[m
]
ONK-PP 89 ONK-PP 90 ONK-PP 91
c)
-110
-105
-100
-95
-90
0 10 20 30 40 50 60 70 80 90 100
Aperture of fracture bhydr [microm]
Dep
th Z
[m
]
ONK-PP 92 ONK-PP 93 ONK-PP 94 ONK-PP 95 ONK-PP 96 ONK-PP 97 ONK-PP 98
Figure 4-5 The observed fracture apertures at the different stages of the grouting test
a) the observations before grouting (3 holes) b) the observations after the first grouting
round (3 holes) and c) the observations after the second grouting round (7 holes)
before the last grouting round (Hollmeacuten 2007)
47
Figure 4-6 The design window in the first grouting round in the second field test The
penetration depth I as a function of the grouting time (t(2D)) ( 0 = 52 Pa and microg =
103 mPas) The hydraulic aperture of the fracture is 24 microm same as in the grouting
holes 87 and 88 The shaded area represents the design window for the pressure and
the grouting time when I = 283 m (Hollmeacuten 2007)
Conclusions of the two grouting field tests
As a conclusion of grouting tests Hollmeacuten (2007) presents the following opinions
The water loss measurement and the flow logging used together are useable and
recommended investigation methods to estimate the number and the hydraulic apertures
of fractures The hydraulic aperture of a fracture is quite a good estimation for the
grouting aperture and it should be known before the grouting parameters are decided
The field tests proved that the overpressure of water loss measurement should be
revised when operating in deep averagely fractured rock Based on the study the
recommended grouting pressure is little less than the limit for hydraulic uplifting
48
Concerning the stop criteria the main conclusion about the field test was that the stop
criteria based on the analysis of grout penetration is not easy to use when a fracture
system is complicated but may be usable when it is simple (Hollmeacuten 2007) The theory
takes into account only the fractures that are intersected by a bore hole The criterion is
also difficult to use if the fracture characteristics are unreliable Therefore Hollmeacuten
(2007) suggested further development of the time stop criterion (grouting time ndash
method) is needed since the exact characterization at the site is very difficult However
the theory behind the time stop criterion is a useful tool for the optimisation
The following conclusions from the experiences of the field tests were also expressed
by Hollmeacuten (2007)
- The grout properties used in the design calculations should be results from the field
using a real grouting equipment not from the laboratory
- The rock characterization methods (the water loss measurement and flow logging)
give only estimations about the fracture density and their apertures Real fracture
network to where the grout penetrates can be much different
- If the required inflow target is strict the grouting holes inside the tunnel profile can
risk the grouting result
- The total number of grouting holes in a fan should not be minimized because there
is always a risk that the grouting hole doesnrsquot cut the fracture sufficiently
- A safety factor for the penetration length is recommended
- Packers must extend longer to the rock mass than the excavation damaged zone
- It is important that before grouting the contractor informs all the differences and
disturbances from the excavation to the grouting designer and
- Grouting equipment the accuracy of the flow meter should be at least
001 dm3min
If the packers are released too early the grout flows out from the borehole and at the
same time the grout may flow from the fractures to the borehole If that happened the
grouting would be unsuccessful The beaker test to illustrate packersrsquo removing time
was used in the field tests The results of the test were invalid because in two cases the
grout flowed out from the borehole when the packers were released Therefore the
methods to indicate packerrsquos removing time need further developing
Pilot field test with colloidal silica
A preliminary study of grouting with colloidal silica was done in the year 2007 This
study included also a pilot test grouting with the colloidal silica which is described
below The test is fully reported in project memorandum
The objectives of the silica test from the grouting technology point of view were to
1 obtain experiences of the material (colloidal silica) under the prevailing conditions
at ONKALO and with Posivaacutes grouting equipment
2 test and collect practical experiences about post-grouting with colloidal silica and
3 collect experiences on removing colloidal silica from the drill holes
49
The test site was located in the ONKALO access tunnel at about the chainage 1815 at
the depth level of about -180 m (Figure 4-7) The location of the grouting and the
control holes is depicted in Figures 4-7 and 4-8 The boreholes PR2 - PR5 are the
grouting holes and the holes PR6 - PR15 are the control holes A vertical geological
structure including water conductive fractures was assigned as the test site location
A commercial Meyco MP 320 colloidal silica and its NaCl accelerator (Meyco MP320
accelerator) were used in the pilot test
Before the first grouting trial the grouting holes PR2 - PR5 were characterized by the
water loss measurement the flow logging and the out flowing water The results
obtained from different measurements were not fully compatible but they gave a clear
indication that the holes intersect a water conductive fracture and its hydraulic aperture
was estimated to be ~15 microm (calculated from the flow log results) No hydraulic
connections between the holes or between the holes and the tunnel were detected The
temperature in the beginning of the holes was ~12 oC eg close to that prevailing in the
tunnel However it varied along the holes The water pressure was 16 MPa The
temperatures of the colloidal silica and the accelerator were 122 oC and 123
oC
respectively
Prior to the grouting test the beaker tests were conducted in order to determine the
gelling times and the dosing of the accelerator The target gelling time was 45 min and
thus the pumping time 23 min was set Five mixing ratios (colloidal silicaaccelerator)
were tested in tunnel conditions and the mixing ratio 5125 met the target value for
gelling time
The grouting design was calculated with the 1D model for penetration The target
penetration length was 15 m The stop criterion was grouting time
Before the grouting was started the agitator and the grouting hose were washed with
water in order to remove the alkaline water from the equipment The grouting mass with
the silicaaccelerator ratio 5125 was mixed in the agitator for 60 seconds
The four grouting holes were equipped with short packers and the valves were in open
position Air and water were removed from the grouting hose The pressure was
increased to the planned grouting overpressure (04 MPa) immediately thereafter and
the pressure was kept constant The grouting was started from the drill hole PR2 It
became evident that the mass intake will be very small within the planned grouting time
(23 min) In fact during the grouting there was water in grouting holes that was injected
into the fractures instead of colloidal silica The grouting overpressure was raised to 09
MPa without any conceivable effect on the rate of mass intake The observations were
made at the pressure gauge grout movement may have happened but it was not possible
to detect
50
Figure 4-7 The silica grouting test The job site in the ONKALO access tunnel (top
view PL refers to the chainage) and the location of the grouting holes ONK-PR2 ndash
ONK-PR5 (A = the length of the grouting holes B = the distance from the tunnel) The
brown element is a vertical geological structure and the blue lines shows the water
leaking fractures observed in the tunnel roof and the walls The control holes were
drilled later to the same direction and inclination with the grouting holes
Figure 4-8 The location of the grouting holes (front view) ONK-PR2 ndash ONK-PR5 and
the control holes ONK-PR6 ndash ONK-PR15 The drill holes ONK-PR2 ndash ONK-PR15 are
7 m long and declined 5 o
PR10
PR3
PR4
PR5
PR7
PR8
PR6
PR9
PR11
PR15
PR14
PR13
PR12
30 m
13 m
15 m
m
075 m
x
y
asymp 40deg
B
A
x
y
x
y
asymp 40deg
B
A
PR2
51
The gelling time determined with the beaker method gave the value of 35 min after the
mixing This value was 10 min shorter than the value (45 min) from the test a few hours
before with the same method One possible explanation could be that in spite of
cleaning the agitator and the hose before the grouting test there has been some alkaline
water left somewhere in the equipment accelerating the gelling reaction In the
following batch the result of the beaker tests was in line with the earlier test results
The most conductive drill hole PR5 was grouted next The longer gelling time (57 min)
was applied with the mixing ratio 511 The grouting overpressure was also raised to
15 MPa The silica intake was about the same as in the previous hole (1 - 2 l) regardless
of longer grouting time (30 min) and higher grouting pressure The gelling time of
55 min was quite close to the value determined earlier with this mixing ratio The
cleaning of the holes was not done
In total two holes were tried to be grouted and then the test was interrupted The first
grouting trial failed because the grout flow was too slow with regard to the gelling time
and the grouting was interrupted A new test was designed The principle was the same
but the following key modifications were made
1 In the calculation the 2D model is to be used instead of applying the 1D model
2 Longer gelling times are preferred because of very small fracture apertures and
3 The grouting holes are to be filled with colloidal silica before grouting
The target was to grout 2 h In order to reach suitable gelling time new mixing ratios
(silicaaccelerator) for the beaker tests were determined One ratio was the same as in
the first trial The air temperature was T = 13 oC during the test In these beaker tests
the silica sol did not gel if the ratio was lt 506 - 504 The optimal ratio seemed to
have been from 508 to 510
When the gelling time of the mix 510 was compared with the earlier result the gelling
time in the second test was 15 min more (79 min) than in the first test (65 min) The
gelling time is an important part of accurate design and grouting Because of the
significant difference in gelling times it was decided to study briefly whether there
would be any potential differences in a) using fresh accelator from the container intact
and option b) aged accelerator from the container been in use earlier The mixing ratio
was set to be 517 The point was to ensure that the accelerator that was to be used for
the grouting test was not defected by aging A small difference was observed (3 min in
gelling time) and the fresh accelerator was quicker It was decided to make the
additional tests with both accelerators just before the grouting test to be more confident
about the behaviour of the accelerator and the suitable mixing ratio
The accelerator from both drums (the difference being in the dates the drums were
opened) with the different mixing ratios was subjected to the additional tests The
colour of the accelerator in the newly opened drum (opened on the previous day) had
turned dark gray overnight The colour was similar to the accelerator in the earlier
opened drum The inner surface of the container looked rusty as well
52
Unexpectedly these tests indicated that the accelerator from the barrel opened earlier
was more effective The only accurate gelling time was from the measurement with
ratio 508 where the accelerator reacted even 2 h faster (2 h 44 min vs 4 h 47 min)
The mixes with ratios 510 gelled in less than 1 h 53 min The results with the aged
accelerator were more in line with the previous test results and it was decided to use that
in the grouting test On the basis of the results the mixing ratio 509 was chosen with an
aim of 2 h gelling time
The grouting design was done with the following assumptions the fracture aperture was
15 microm the grouting pressure was 25 MPa and the gelling time was 2 h The penetration
distance of 16 m was targeted
All four holes were to be grouted The task to fill the holes after mixing the silica mass
(t = 0 which initiated the time available for grouting) was started with a newly
constructed filling device (Figure 4-9) That was used to remove the water from the
grouting hole and the hole was filled with the silica mix The filling proceeded as the
filling hose was inserted through the duct in the packer to the bottom of the hole The
holes were filled one by one There was a short delay because of the grout mix shortage
and a new batch had to be mixed Thats why the start of the grouting was postponed
In the beginning the grouting pressure was raised to the target value (the designed
pressure) about 25 MPa No mass flow was detected in the flow meter Then the
pressure was raised to the values 38 - 42 MPa and eventually to 46 - 47 MPa Due to
the measuring accuracy (00 dm3min) the flow meter did not show any grout flow but
the pistons in the pumps were moving and it was concluded that the flow occured
During the whole grouting three holes (PR2 PR3 and PR5) took in grout each of those
took about 1 l and the total grout intake was 3 - 4 l The grouting was stopped after 86
min counted from the first mixing The sample from the first batch had already started
to gel Out of the total duration 42 min was used for filling the holes and 44 min for the
grouting During the grouting the pressures close to the grouting holes were quite
similar with the gauge readings at the grouting equipment
When comparing the water leakage results (PR2dry PR3125 mlmin PR430 mlmin
and PR5100 mlmin) conducted in the holes before the grouting and the silica intake
during the grouting it can be concluded that the results are not unambiguous
In the beaker including silica from the first batch from the agitator the mix gelled in 1 h
33 min The corresponding sample taken from the end of the hose remained fluid The
gelling times with constants mix ratios differed from the test to another The target
gelling time of 2 hours was not reached in this test
The grouting was considered successful since the grout intake was 3 - 4 l more than the
total volume of the grouting holes and the test continued with controlling of the result
and cleaning of the holes
53
Figure 4-9 The filling device to replace the hole water with silica
Some leakages (1 - 190 mlmin) were observed in five control holes Unexpectedly the
highest leakage was in PR8 and the next highest in PR6-7 These control holes were the
closest to the grouting holes The only measurable water loss was in the drill hole PR8
(50 mlmin under 03 MPa)
The holes PR2 and PR3 were cleaned by removing silica mass using a steel brush A
drill rig was employed for the job Before cleaning the packers were removed from the
holes The packer was removed from one hole and the silica mass in liquid form was
found inside the packer after six days even though the gelling times observed in cups
were about 15 - 2 h Removal of the packers after two weeks setting time resulted in
the out flow of unhardened silica from the holes (see Figure 4-10) A sample was
collected from the surface into a plastic bag and it started to gel within a few hours
Anyhow the cleaning trial was done as follows A steel brush was attached with the rod
(Figure 4-10) As planned brushing was started without flushing (air or water) in the
drill hole PR2 The drill rod and the couplings became hot and decoupling failed Later
the coupling between the brush and the rod had loosened during the previous activity
when trying to open the coupling between the rods Eventually the hole was washed
with the water hose Silica residual was observed on the hole wall (PR2) after brushing
and spooling The trial in this hole failed to remove all the liquid silica In the hole PR3
instead of brushing the drill rod with an old drill bit was inserted into the hole and air
flushing followed by water flushing was used Liquid silica spurted from the hole quite
soon
54
Figure 4-10 The grouting hole PR2 was cleaned with a steel brush coupled into the
drill rod The silica came out and ran along the tunnel wall
Concluding remarks about the pilot test with the colloidal silica
Plenty of first hand practical experiences were obtained
Water pumps and water flow gauges used in conventional way to determine water
loss were not suitable in these rock conditions with quite a poor conductivity
Results cannot be considered reliable and to draw any conclusions on the effect of
grouting is difficult
Also small grout flow was nearly impossible to observe due to too poor measuring
accuracy of the grouting equipment (00 dm3min) and
The reading accuracy of the flow meters should be 001 dm3lmin
Plenty of experiences were obtained in regards to the silica mass and its behaviour and
about grouting activity Salt-accelerator should be stored in a drum made of material
that does not corrode There was substantial variation in the effectiveness of accelerator
depending partially on the time the drum had been open Additionally the substance
originating from the drum material which made the accelerator turn dark may have an
effect on the reaction between accelerator and silica Homogenous and correctly packed
and stored components would probably give more consistent gelling times The correct
mixing ratio is very essential and the volumes of both components should be dosed
carefully Gelling times were difficult to measure exactly with the beaker method
55
especially when the amount of accelerator was small The gelling time should be
defined more exactly and so that there is a method to observe it Mixing ratios with
accelerator less than 04 - 06 units (per 5 units of silica) will not result in gelling which
means that long (over ~15 h) gelling times cannot be applied
The first trial had to be discontinued before the holes were full because the small
apertures and short gelling time resulted in a slow flow rate that was not measurable
with the equipment in use In the second trial a separate filling device was used to fill
the holes with silica prior to grouting That saved time for the actual grouting and that is
a practice recommended at least in the case of tight fractures The filling of three holes
took about 3 x 5 minutes (+ time required for dosing and mixing) and this time
consumes the effective grouting time available Several holes can be filled
simultaneously
The time required for the filling of holes should be taken into account when designing
the grouting with colloidal silica The gelling time should be long enough to allow both
the filling of holes and the actual grouting phase before gelling takes place Detailed
planning of the work phases is important and the work phases should be performed
without significant delays
Long gelling times are not always suitable but in some cases they are preferable
because eg unexpected delays do not cause that significant error in design (open time
shorter than expected in the design) In principle very short gelling times are possible
with colloidal silica but each working stage requires a certain time The work stages
should be taken into account already in the design The inaccuracy in gelling time
particularly by using long gelling times caused by a disturbance (dirty equipment
inexact dosage etc) however can be worse with respect to stop criteria than by short
gelling times Because mass intake can be high in large fractures the gelling times
should be short and that can be difficult to control technically The use of colloidal
silica in larger fractures under high groundwater pressures seems also a little bit
challenging how to get colloidal silica to gel subjected to strong water flows
Silica (at least in a liquid form) cannot be totally removed from holes with brushing and
flushing The steel brush should be welded to the rod if brushing is desired It is
difficult to insert the rod into a hole without direction marks behind the boom Should
monitoring of silica in holes andor cleanliness of holes be considered necessary the
working practices should be developed further
56
57
5 OPTIMISATION OF GROUTING FOR ONKALO 51 Objectives for grouting
The design requirements of the water inflow set for ONKALO are in place to prevent
the disturbances foreseen as described earlier (Chapter 2) Those requirements are
presumed to be met by taking the measures below
ONKALO shall not be built close to heavily water conductive rock or drill holes
Seawater should not intrude into the repository host rock and groundwater table
should not be drawn significantly below sea level
Surface waters should not migrate towards the disposal level
Significant upconing of deep saline groundwater should not take place
ONKALO should not create significant permanent hydraulic connections
Inflow rate of groundwater should be as low as possible and
Seawater should not intrude into the repository host rock
The principals above will result in a respect distance to major water conductive zones
and to investigation holes Furthermore the maximum limit values for the groundwater
inflow have been determined The allowable flow rate is lt140 lmin The latter values
were set by interpreting the ldquoinflow rate of groundwater as low as possiblerdquo to be about
1 - 2 lmin100 m At the time the construction started this inflow was generally
considered the lowest achievable inflow rate
As the understanding has enhanced the interaction between alkalis released from
cements and bentonite as a part of Engineering Barrier System (EBS) and backfill
material in the repository has been raised to be one key issue The phenomena are not
fully understood and absolutely right limit values eg for the use of cement cannot be
given Even though exact values are not possible to determine with models the
guidelines for the use of cement are given grouts below the RH20 structure should be
of low pH (eg the pH in the leachant lt 11) and the amount of cementitious materials
should be minimised The practices to fulfil the latter include limiting the grout take
using as thick grouts as possible and directing the grouting holes inside the tunnel
profile
The design requirements set for the total inflow and the local inflow rates were not
changed due to the R20 programme
52 The expected hydrological conditions from the grouting point of view
The expected hydrological conditions below the depth of -300 m were determined for
grouting design purposes The main aim was to foreseen the conditions that are likely to
prevail for grouting in the future
The data processing and its results are reported fully by Vaittinen et al (2007)
58
521 Collection and selecting of data and data processing
Because the rock volumes about 20 m x 20 m x 20 m are of interest from the grouting
point of view the below presented approach is not connected to any current bedrock
model or hydrological model The design solutions are aimed to be free from any
particular tunnel layout or geological or hydrological model since those may change
and thus the grouting design solutions would become invalid
The criteria for fracture zones in the data processing were the same as in the bedrock
model 20031 (Vaittinen et al 2003) (Table 5-1) This study however is not related in
any other respect to that version of the model The same approach which was used in
that bedrock model that took into account both the hydraulic properties of fractures and
the rock fracturing was selected for the data processing as well The criteria used
comply with the Finnish Engineering Geological Classification system (Gardemeister et
al 1976) and it is complemented with other elements The data used here was the one
available from the deep drill holes (OL-KR-holes) by February 2007
The description of hydrogeological conditions is based on the properties of
hydraulically conductive fractures ie transmissive fractures at the depth range of -300
- -600 m see Figure 5-1 The lowest measured transmissivity is 1110-10
m2s but due
to the measuring method the transmissivity values below 110-9
m2s cannot be
systematically measured The properties are processed statistically and the probable
occurrence density in horizontal tunnels was assessed The combined length of the drill
holes down to the levels between -300 m and -600 m is about 5630 m The
transmissivity of the fractures is measured with the Posiva Flow Logging Device
(Oumlhberg amp Rouhiainen 2000)
Table 5-1 The simplified description of the criteria of fracture zones used in the data
processing (same as in Vaittinen et al 2003) The rest of the rock is treated as
averagely fractured rock
PROPERTY CRITERION
Fracture frequency
The primary fracture frequency criterion ge 10 fractures 2 m
Intersection boundaries lt 10 fractures 2 m
Type of structure intersection
RiIII A fracture zone
RiIV-RiV Crushed zone
Hydraulic zone
Measuredcalculated K-2m 5E-7 ms
59
Figure 5-1 The transmissive fractures observed in the deep drill holes (Vaittinen et al
2007) The red box stands the depth range of -300 - -600 m and those are the
observations used here
The orientation of the transmissive fractures was detected from the drill hole samples
OL-KR1 - 5 7 - 15 19 - 20 and 22 (Hellauml et al 2004 amp 2006) The orientation for the
area represented by the drill holes OL-KR24 - 25 27 and 38 - 42 has been determined
combining flow anomalies with the conductive fractures based on core sample mapping
The processing of transmissive fractures from the original data into the form of
expected hydrological conditions in horizontal tunnels was performed in the following
steps
1 All transmissive fractures were assessed together
2 Transmissive fractures were classified by dip 0 - 30deg 30 - 60deg and 60 - 90deg
3 Order of magnitude correction coefficient was approximated for biased fracture
observations The coefficient was based on the ONKALO fracture mapping data
4 Transmissive fractures were classified by hydraulic aperture below 0020 mm
0020 - 0050 mm and above 0050 mm
5 Transmissive fractures were classified either to occur as a distinct fracture in the
averagely fractured rock or to belong to a fractured zone (criteria as in Vaittinen et
al 2003)
6 In order to evaluate the distance between the transmissive fractures in tunnels the
observations (oriented transmissive fractures) made in drill holes were projected to
the horizontal plane
7 Distinct transmissive fractures were classified by dip as in the stage 2) and by
hydraulic aperture as in the stage 4) and
8 Transmissive fractures in fractured zones (criteria as in Vaittinen et al 2003) were
assessed zone by zone
60
The dip and the hydraulic aperture were selected as a basis for the classification of the
data since they are the key properties from the point of view of groutability The
aperture affects on the penetration ability and the penetration length of a grout mix The
fracture angle in terms of dip is an important factor when determining the penetration
length required Perpendicular penetration length from the tunnel surface is important
due to eg rock bolts and fracture dip affects on this
Based on general understanding about grouting the hydraulic apertures are divided into
the classes less than 0020 mm 0021 - 0050 mm and more than 0050 mm due to the
following reasons the grouting of fractures with an aperture of lt0020 mm is probable
impossible with cementitious grouts and the need for grouting of these fractures is
questionable The grouting of fractures with a hydraulic aperture of 0021 - 0050 mm is
probably needed although it might be difficult with cementitious grouts Colloidal
silica is generally considered more capable to penetrate into the fractures of this size
The fractures with a hydraulic aperture of gt 0050 mm shall be grouted and
cementitious grouts are considered applicable to seal these kind of fractures partly or
fully
The statistics of all fractures and the full data processing is presented by Vaittinen et al
(2007) As an outcome only the data of interest from the point of view of grouting is
presented below
522 Statistics
To characterize the hydrogeological properties expected in the bedrock for grouting
purpose the transmissive fractures were classified either into the averagely fractured
rock or into the fractured zones (criteria presented in Table 5-1) The total hole length
studied was 5630 m Out of this 420 m (75) belonged to the fractured zones
Applying this classification the mean transmissivity is almost two decades higher in the
fractured zones than in the average rock see Table 5-2 and Figure 5-2
The transmissive fractures were divided further on the basis of the hydraulic aperture to
three sub-groups bhydr lt 0020 mm 0021 gt bhydr gt 0050 mm and bhydr gt 0050 mm
(Table 5-2) The distribution of the observations clearly differs between the average
rock and the fractured zones In the average rock 62 of the transmissive fractures have
the hydraulic aperture less than 0020 mm whereas the transmissive fractures with the
hydraulic aperture greater than 0050 mm is the largest group 44 in the fractured
zones (Vaittinen et al 2007) The analysis indicates that the proportion of fractures with
the hydraulic aperture larger than 0050 mm dipping towards the south-west within the
average rock is quite high and proportion of gently dipping fractures with the hydraulic
aperture less than 0020 mm within the fractured zones is low The transmissive
fractures with the hydraulic apertures greater than 0050 mm have mostly gently dipping
orientations
61
Table 5-2 The statistics of the observed transmissive fractures within the averagely
fractured rock and within the fractured zones transmissivity (T m2s) and spacing (S
m) (Vaittinen et al 2007)
T mean m2s
(count)
T
Median
m2s
T St
Dev
m2s
S Mean
m
(Nr of
observations)
S
Median
m
S St
Dev
m
Average rock 26middot10-8
(184) 27middot10-9
83middot10-8
223 (149) 92 323
bhydr lt 002 mm 14middot10-9
(114) 11middot10-9
11middot10-9
249 (85) 114 342
002 gtbhydgt 005 mm 18middot10-8
(56) 13middot10-8
16middot10-8
425 (35) 226 507
bhydr gt 005 mm 26middot10-7
(14) 21middot10-7
18middot10-7
373 (6) 30 580
Fractured zone 16middot10-6
(126) 39middot10-8
47middot10-6
13 (71) 08 16
bhydr lt 002 mm 18middot10-9
(32) 19middot10-9
12middot10-9
08 (21) 07 09
002 gtbhydrgt 005 mm 23middot10-8
(38) 19middot10-8
17middot10-8
13 (23) 07 16
bhydr gt 005 mm 36middot10-6
(56) 47middot10-7
66middot10-6
18 (27) 11 20
0
10
20
30
40
50
60
70
80
90
100
0000 0050 0100 0150 0200 0250 0300 0350 0400
Hydraulic aperture mm
Culu
lativ
e fre
quency
Average rock Zones
Figure 5-2 The cumulative frequencies of the hydraulic apertures within the averagely
fractured rock and within the fractured zones
62
523 Expected transmissive fractures within averagely fractured rock in the
tunnels
The occurrence of the transmissive fractures expected in the tunnels classified
according to the dip and the hydraulic aperture is presented in Table 5-3 The number
of observations with the hydraulic apertures larger than 0050 mm is so low that the
results are only indicative The statistics of spacing and the orientation of the expected
fractures (corrected orientation and occurrence) within the averagely fractured rock are
given in Figure 5-3
524 Expected transmissive fractures within fractured zones in the tunnels
The statistical analysis of the fractured and hydraulic structures based on the bedrock model version 20031 has been done in 2004 (Hellauml et al 2004) Vaittinen et al (2007) further treated this data and defined eight data sets Each of these data sets was used to generate several realizations (Hellauml et al 2004) of the structures
Based on the mean number of the intersections it was estimated that the tunnel would intersect approximately 20 fractured or crushed zones along 3000 m of the tunnel below the level of -300 m Order of magnitude frequency for these structures would be one structure per 150 m After the criteria applied for the fractured zones (Table 5-1) they may contain no transmissive fractures
The histograms of the transmissivity and the corresponding hydraulic aperture and the dip direction and the dip are shown in Figure 5-4 Compared to the fractures in the averagely fractured rock the transmissivity is clearly higher within the fractured zones The orientation histograms are quite similar with the other data sets Vaittinen et al (2007)
The illustrations of the fracture sets expected are presented in Figures 5-5 and 5-6
Table 5-3 The determined spacing of the classified transmissive fractures within the
averagely fractured rock
Hydraulic apertureDip
Dip lt 30 dgr Dip 31 - 60 dgr Dip gt 60 dgr
bhydr =lt 0020 mm 112 m (30) 146 m (23) 146 m (23)
0020 gt bhydr gt 0050 mm 372 m (9) 239 m (14) 419 m (8)
bhydr =gt 0050 mm 1117 m (3) 3350 m (1) 1117 m (3)
0
38
48
22
6
0 0
0
33
75
95 100 100 100
0
5
10
15
20
25
30
35
40
45
50
1E-10 1E-09 1E-08 1E-07 1E-06 1E-05 1E-04
Fracture T m2s
Fre
quency
0
20
40
60
80
100
120
97
47 47
4
8 14
55
96 100
0
5
10
15
20
25
30
35
40
45
50
01 1 10 100 1000
Spacing m
Fre
quency
0
20
40
60
80
100
120
26
47
2219
23
64
83
100
0
5
10
15
20
25
30
35
40
45
50
90 180 270 360
Dip direction
Fre
quency
0
20
40
60
80
100
120
42
38
34
37
70
100
0
5
10
15
20
25
30
35
40
45
50
30 60 90
DipF
requency
0
20
40
60
80
100
120
Figure 5-3 The histograms of the transmissivity the spacing the dip direction and the dip of the transmissive fractures with the
corrected proportion of gently moderately and steeply dipping fractures within the averagely fractured rock
63
0
11
3234
28
14
7
0
9
34
61
83
94 100
0
5
10
15
20
25
30
35
40
1E-10 1E-09 1E-08 1E-07 1E-06 1E-05 1E-04
Fracture T m2s
Fre
quency
0
20
40
60
80
100
120
22
46
26 25
18
57
79
100
0
10
20
30
40
50
60
90 180 270 360
Dip direction
Fre
quency
0
20
40
60
80
100
120
52
46
2144
82
100
0
10
20
30
40
50
60
30 60 90
Dip
Fre
quency
0
20
40
60
80
100
120
Figure 5-4 The frequency of the water conductive fractures within the fracture or crushed zones in terms of the transmissivity and the
histograms of the dip direction and the dip for the fractures within the fracture zones
64
65
Figure 5-5 Examples of water conductive 2- and 3-fracture systems observed in the
deep rock in Olkiluoto
Figure 5-6 Examples of water conductive complicated systems with multiple fractures
observed in the deep rock in Olkiluoto
The information above has been used when selecting the fracture systems studied in the
feasibility study of grouting design solutions (Section 53) The data will be useful also
when preparing for the future groutings beforehand
53 Feasibility of the design solutions
The theoretical study was carried out by Lokkila (2008) in order to assess the feasibility
of the design solutions
The aim was to start with ideal design solution focusing the grouting in places
determined based on the rules for local leakages the grouting with low pH grouts
66
minimising the grout to remain in the rock by having the grouting holes inside the
tunnel profile and limiting the grout take The study concentrated in fracturing
conditions determined by Vaittinen et al (2007) (Section 52) The work was iterating
until the design solution was found If it was not found the alternative design solutions
were suggested This work can be utilized for actual grouting design in the future by
giving general operating limits eg for grouting pressures grouting patterns etc
531 Optimal design solution
The optimal grouting design solution includes the following components
Use of low pH grouts
Grouting holes inside the tunnel profiles (Figure 5-7) and
Controlled grout penetration (3 - 20 m)
This design solution was studied by using the Grouting Time -method (the same
analytical approach as used in time stop grouting) in the study carried out by Lokkila
(2008)
The target was to find the most optimal design solution for different fracture-tunnel
systems However the practical point was kept in mind all the time eg the grouting
pressures were aimed to be low enough
Figure 5-7 A tunnel in rock showing the principle of a pre-grouting fan where the
grouting holes are inside the tunnel profile The grouting holes inside the tunnel profile
diminish the amount of the stray materials in the rock
67
532 Calculation system and studied cases
The study proceeded as presented in Figure 5-8 and the aim of systematic approach was
to
Identify the cases that can be handled with typical design solutions and find feasible
design solutions and
Identify the cases that cannot be handled with typical design solutions
The calculations were made for 1D and 2D cases The 1D case means the flow in a
canal (fast flow) the 2D means radial flow (slower flow) The 2D flow was selected due
to conservativeness of the study It is hard to detect which kind of flow occurs in the
fracture for real The 3D flow is also possible especially in complicated fracture zones
like RH19 and RH20 but it was ruled out in this study since there are no practical
calculation tools available yet
The cases were first determined on the basis of hydrological conditions at the Olkiluoto
site and one additional component ndashtunnel direction ndash was added (Table 5-4) In order
to limit the number of the cases in the study the tunnel directions 000 045 090 and 135
degrees and the dip directions 00000 00015 00030 00045 00060 00075 and
00090 degrees were selected The cases were numbered for identification
In the very beginning it turned out that the range -270 - -520 m has to be divided into
Two parts and the fracture group 50 - 400 microm has to be split into several
parts
Figure 5-8 The study flow chart (Lokkila 2008)
Basic design solution feasible
5-10 optimal solutions for pressure and
time space grouting fan and mass mixes
Succeeded
OK
Succeeded
Other designsolution
Define suitable design
areas for special cases
Special grouting cases
inc pre-injection
R20- structure
shafts
Not Succeeded
Variations
1 Varying mass recipes
2 Changing minimum penetration of grout maximum volume injected
3 Changing fans to outside of the profile
Not succeeded
Starting values
Grouting pressure minimum and maximum penetration length and minimum aperture
About 2-3 basic masses with different properties
Fans to inside of the profile (distance 1m) bevare of the backflow
68
69
Table 5-4 The fracture-tunnel systems studied (Lokkila 2008) CS = colloidal silica
Aperture bhydr (mm)Dip direction Dip 30deg (0 15 and 30) Dip 30-60deg (30 45 and 60) Dip gt 60deg (60 75 and 90)
lt0020 Restricted penetration tunnel dir vs dip dir tunnel dir vs dip dir tunnel dir vs dip dir
of any grouts 000 045 090 and 135 deg 000 045 090 and 135 deg 000 045 090 and 135 deg
0021-0050 Cement grouting tunnel dir vs dip dir tunnel dir vs dip dir tunnel dir vs dip dir
difficult unrestricted 000 045 090 and 135 deg 000 045 090 and 135 deg 000 045 090 and 135 deg
penetration of CS
assumed
0051-0400 Unrestricted penetration tunnel dir vs dip dir tunnel dir vs dip dir tunnel dir vs dip dir
of cement grouts 000 045 090 and 135 deg 000 045 090 and 135 deg 000 045 090 and 135 deg
assumed
Only case with a single fracture was calculated since the same logic can be used in
multiple fracture cases When applying optimized grouting to the multiple fracture cases
two or several grouting rounds are probably needed This is traditionally called the split
spacing technique
Some cases can be theoretically grouted using the ideal drilling fan because the grouting
holes intersect the fracture (example in Figure 5-9) Some cases turned out to be
impossible to handle with the optimal design solution because the grouting holes do not
intersect the parallel fracture (see Figure 5-8) Those cases in terms of the tunnel
direction and the fracture orientation are 000-00000 045-00000 090-00000 090-
00015 090-00030 090-00045 090-00060 090-00075 090-00090 and 135-00000
In deep rock conditions the groundwater flow pattern and pressure is practically the
same around the tunnel Only the tunnel roof is a little bit different since rock bolts are
located there In many cases the tunnel direction and the fracture orientation were
practically same ie their relative angle turned out to be the same and the calculation
and results are valid for a few occasions Those cases in terms of the tunnel direction
and the fracture orientation are 000-000015 045-00015 and 135-000015 000-
00030) 045-00030135-00030 000-00045 045-00045135-00045 000-00060
045-00060 135-00060 000-00075 045-00075 135-00075 000-00090 045-00090
and 135-00090
70
a) b)
Figure 5-9 Illustrations of fractures that a) can be handled with symmetrical drilling
pattern and b) requires a modified drilling pattern (Lokkila 2008)
533 Starting values
There are six different types of low pH grouts available (Ranta-Korpi et al (2007)
Appendices 1 amp 2) grout 1 (G1) = UF-41-10-3 grout 2 (G2) = UF-41-10-4 grout 3
(G3) = UF-41-12-3 grout 4 (G4) = UF-41-14-3 grout 5 (G5) = UF 41-12-4 and grout 6
(G6) = UF-41-14-4 see Table 5-5 The values measured at 0 min were used in the
calculations
In order to control the grout take the thickest grout (the highest yield value) was
preferred Groundwater pressure increases with depth about 1 MPa per 100 m The
depths used in the study were 270 400 and 520 meters and the groundwater pressures
were 27 MPa 40 MPa and 52 MPa respectively
Because the fracture orientation cannot be observed but the penetration length aimed at
should be determined the perpendicular distance from the tunnel wall was used as a
penetration length instead of the actual penetration length The perpendicular
penetration length is limited between 3 and 20 meters The lowest value is the most
important one because that confirms that grouting seals well The upper limit is used
due the need to limit the grout take
Even though the long pumping time is not desired the maximum pumping time may be
up to 2 hours with the cement-based grouts The gelling time for a silica grout is
determined in advance by changing the silicaaccelerator ratio
The maximum pressure capacity of Posivarsquos grouting pumps is 20 MPa Theoretically
in the depth range -270 - -520 the grouting overpressure can vary between
148 - 173 MPa In the feasibility study the maximum grouting overpressure was
selected to be 15 MPa at most (with the prevailing water pressure of ~5 MPa) The
minimum grouting pressure must be higher than the groundwater pressure The
maximum grouting pressure was calculated with formula by Gustafson (2005)
71
The risk for the backflow was considered as well In practice the risk for the backflow
is not imminent because the grout has set to a certain extent before the removal of the
packers
534 Calculation process
The calculation was made in stages (Lokkila 2008) as briefly described below in Table
5-6
535 Summary of the results
The calculation results are summarised in Tables 5-7 and 5-8 The whole calculation
process and the results are described by Lokkila (2008)
It can be seen from the results that between the depth range of -270 - -400 m the optimal
design solution ie the use of the low pH grouts the predetermined grout take and the
grouting holes inside the tunnel profile is supported by the theory in the hydraulic
apertures of 100 microm In the smaller apertures there is a risk that the grout penetration
length as targeted is not obtained within the reasonable time frame and the alternative
design solutions should be considered if the water leakages are the priority criteria of
the acceptance The problems may occur mainly in the fractures nearly parallel to the
tunnel as the grout has to penetrate very long way to reach the perpendicular distance
required The alternative design solutions are eg the use of the thinner grouts (the
colloidal silica or the thinner cementitious grouts) the addition in the grouting pressures
andor to direct the grouting holes outside the tunnel profile In the depth range of -400 -
-520 m the aperture limit for the feasibility of the optimal design solution is at around
200 microm
Together with the expected rock conditions from the grouting point of view the results
indicate that for the most of the cases alternative solutions rather than the optimal
design solution shall apply
Table 5-5 The grout mixes and their properties used in the feasibility study (modified from Ranta-Korpi et al 2007)
Mix The nr of samples Marsh fresh [s] Marsh 05h [s] Marsh 1h [s] Plast Visc fresh
[mPas]
Plast Visc 30min
[mPas]
Plast Visc 60min
[mPas]
Yield value fresh
[Nm2]
Yield value 30 min
[Nm2]
Yield value 60min
[Nm2]
UF-41-14-4 25 41 41 41 104 166 174 84 93 94
UF-41-14-3 3 54 53 52 220 161
UF-41-12-3 5 114 113 113 366 567 497 312 283 271
UF-41-12-4 4 56 51 49 154 252 263 156 155 163
UF41-10-3 1 612 1087 492 563
UF-41_10-4 4 131 123 95 279 342 366 250
UF-15-10-28 4 39 41 38
UF-41-10-48 1 52 46 47 111 196 213 145 133 143
UF-41-12-36 3+1 61 62 66 272 334 420 199 220 236
UF-41-12-48 10 42 41 41 131 141 162 93 83 90
UF-41-14-48 6 36 36 36 80 100 105 52 48 47
UF-41-08-47 1 130 96 101
UF-41-12-51 1 42
UF-41-14-51 3 37
Mix Filter Pump fresh
100 microm [ml]
Filter Pump (100
microm) 05 h [ml]
Filter Pump
(100microm) 1 h [ml]
b min [microm] b crit [microm] Fall cone 05
kPa [min]
Fall cone 2 h [Kpa] Fall cone 6 h
[Kpa]
Fall Cone 24 h
[Kpa]
UF-41-14-4 310 326 305 34 117 426 10 853
UF-41-14-3 333 337 360 38 85 340 09
UF-41-12-3 275 293 225 47 126 330 11
UF-41-12-4 323 330 290 39 81 345 23
UF41-10-3 130 100 120 106
UF-41_10-4 267 255 140 120 35
UF-15-10-28 278 240 62 192 380 05
UF-41-10-48 340 295 280
UF-41-12-36 290 260 230 32 93 12
UF-41-12-48 332 335 345 19 158 03
UF-41-14-48 303 282 330 30 90 06
UF-41-08-47 300 310 300 64
UF-41-12-51 300 08
UF-41-14-51 325 26 86 05
Filter pump 100 microm sieve Penetrability meter Fall cone
Marsh cone Rheometry measurements
72
73
Table 5-6 The calculation process in the feasibility study The solution refers to the
ideal design solution solved means that the design was analytically solved (Lokkila
2008)
STAGE DESCRIPTION SOLUTION
1 Apertures 50 - 400 microm divided into smaller groups testing with UF-41-14-4 (thinnest) and calculating with UF-41-10-3 (thickest grout)
Apertures down to 200 microm solved fracture dips 15 and 90 turned out to be significant Apertures 50 - 200 microm not solved even with the thinnest grout
2 Apertures 100 - 200 microm calculated with UF-41-10-4 apertures 50 - 100 microm studied
Solution found in group 100 - 200 microm but the grouting overpressures are relatively high Group 50-100 microm not solved
3 Apertures 100 - 200 microm recalculated with UF-41-12-3
Solution found but the grouting overpressures are relatively high
4 Apertures 100 - 200 microm recalculated with UF-41-14-3
Solution found theoretically backflow a little risk and extension of upper limit of penetration length was required
5 Aperture 50 - 200 mm studied with UF-41-12-4
Solutions found drawbacks with backflow and thus extended upper limit of penetration length in group 100 - 200 microm and relatively high grouting pressure in group 50 - 100 microm
6 Aperture 100 microm with UF-41-14-4 (50 microm already tested in Step 1)
Range 50 - 100 microm drawbacks with backflow and thus extended upper limit of penetration length and relatively high grouting pressure in deep rock
7 Aperture 300 - 400 microm recalculated with UF-41-10-4
Solution found theoretically backflow a little risk and required extension of upper limit of penetration length
8 Aperture 200 - 300 microm recalculated with UF-41-10-4
Solution found theoretically backflow a little risk in deep rock and required extension of upper limit of penetration length
9 Summary of the results of the calculations
74
Table 5-7 The results with the cement-based grouts at the depth of -270 - -400 meters
(Lokkila 2008)
B-hydr (mm) Depth 270-400 (m) Comments on design solution Comments
03-04 UF-41-10-3 (mix 1) Solution supported by theory
∆p 43-134 (MPa) (thicker mix better)
I 3-20 (m)
UF-41-10-4 (mix 2) Solution supported by theory Poorer solution risk of
∆p 43-134 (MPa) harmful far penetration
I 3-20 (m)
02-03 UF-41-10-3 (mix 1) Relatively high overpressure Problems in 0200 mm
∆p 64-134 (MPa) with fractures nearly
I 3-20 (m) parallel to the tunnel
UF-41-10-4 (mix 2) Solution supported by theory
∆p 46-134 (MPa)
I 3-20 (m)
B-hydr (mm) Depth 270-400 (m) Comments on design solution Comments
01-02 UF-41-10-3 (mix 1) Solution not supported by theory Problems in 0100 mm
with fractures nearly
parallel to the tunnel
UF-41-10-4 (mix 2) High overpressure Grouting holes Same as above
∆p 98-134 (MPa) outside of the tunnel profile or taking a
I 3-20 (m) risk of remaining leakages in fractures
nearly parallel to the tunnel
UF-41-12-3 (mix 3)
∆p 9-134 (MPa) Same as above Same as above
I 3-20 (m)
UF-41-14-3 (mix 4) Solution supported by theory Risk of harmful
∆p 53-134 (MPa) Relatively high overpressure far penetration
I 3-249 (m)
UF-41-12-4 (mix 5) Solution supported by theory Risk of harmful
∆p 49-134 (MPa) Possible backflow difficult in upper limit far penetration
I 3-257 (m)
005-01 UF-41-12-4 (mix 5) High overpressure Grouting holes Problems in 0050 mm
∆p 103-134 (MPa) outside of the tunnel profile or taking a with fractures nearly
I 3-20 (m) risk of remaining leakages in fractures parallel to the tunnel
nearly parallel to the tunnel
UF-41-14-4 (mix 6)
∆p 63-134 (MPa) Relatively high overpressure grouting Same as above
I 3-239 (m) holes outside of the tunnel profile or
thinner mix or silica grouting
0021-005 UF-41-14-4 (mix 6) Solution not supported by theory Problems in 0021 mm
Grouting holes outside of the tunnel with fractures nearly
profile or thinner mix or silica grouting parallel to the tunnel
∆p = grouting overpressure
I = perpendicular penetration length
75
Table 5-8The results with the cement-based grouts at the depth of -400 - -520 meters
(Lokkila 2008)
B-hydr (mm) Depth 400-520 (m) Comments on design solution Comments
03-04 UF-41-10-3 (mix 1) Solution supported by theory
∆p 58-15 (MPa) Relatively high overpressure
I 32-212 (m)
UF-41-10-4 (mix 2) Poorer solution risk of Problems in 0400 mm
∆p 57-15 (MPa) harmful far penetration with fractures nearly
I 42-285 (m) perpendicular to the tunnel
02-03 UF-41-10-3 (mix 1) Solution supported by theory Problems in 0200 mm
∆p 64-15 (MPa) Relatively high overpressure with fractures nearly
I 3-20 (m) parallel to the tunnel
UF-41-10-4 (mix 2) Solution supported by theory
∆p 57-15 (MPa) Relatively high overpressure
I 3-214 (m)
B-hydr (mm) Depth 400-520 (m) Comments on design solution Comments
01-02 UF-41-10-3 (mix 1) Solution not supported by theory Problems in 0100 mm
∆p 144-15 (MPa) Grouting holes outside of the tunnel with fractures nearly
I 3-20 (m) profile parallel to the tunnel
UF-41-10-4 (mix 2) High overpressure Grouting holes Same as above
∆p 98-15 (MPa) outside of the tunnel profile or taking a
I 3-20 (m) risk of remaining leakages in fractures
nearly parallel to the tunnel
UF-41-12-3 (mix 3)
∆p 9-15 (MPa) Same as above Same as above
I 3-20 (m)
UF-41-14-3 (mix 4) Relatively high overpressure
∆p 73-15 (MPa) Grouting holes outside of the tunnel
I 32-323 (m) profile
UF-41-12-4 (mix 5) Relatively high overpressure or
∆p 67-15 (MPa) thinner mix (backflow)
I 33-334 (m)
005-01 UF-41-12-4 (mix 5) High overpressure grouting holes Problems in 0050 mm
∆p 103-15 (MPa) outside of the tunnel profile with fractures nearly
I 3-20 (m) parallel to the tunnel
UF-41-14-4 (mix 6)
∆p 92-15 (MPa) Relatively high overpressure grouting
I 31-31 (m) holes outside of the tunnel profile or
thinner mix or silica grouting
0021-005 UF-41-14-4 (mix 6) Solution not supported by theory Problems in 0021 mm
Grouting holes outside of the tunnel with fractures nearly
profile or thinner mix or silica grouting parallel to the tunnel
∆p = grouting overpressure
I = perpendicular penetration length
76
536 Additional comments on the grouting of special cases etc
Grouting of the leaking fractures intersecting the tunnel
Post-grouting the grouting of fractures parallel to the tunnel (including all dips between
0 - 90 degrees) and the unsuccessful placement of a grouting fan (too close when a
diagonal fracture is intersected by a tunnel) are conceptually same situations
According to Fransson amp Gustafson (2007) practices for post-grouting have not been
commonly established They have studied post-groutings by analysing the data from the
Aumlspouml rock laboratory Hallandsarings and Toumlrnskog tunnels in Sweden There are very few
experiences in the deep rock Besides the grouting holes have to intersect the fractures
the fan geometry has to be designed taking into account the high pressure gradient
towards to the tunnel This may cause the erosion of grout and the limitations for the
penetration length The deeper the tunnel the greater is the importance of this point The
possibility of jacking should be taken into account and high grouting pressures are not
desired when post-grouting Fransson amp Gustafson (2007) have presented the
theoretical guidelines for designing of post-groutings
Figure 5-10 Illustration of the tendency of grout to flow back to the tunnel under a high
pressure gradient
77
Grouting of major hydrogeological structures compared to small fractures
The nature of major hydrogeological structures differs significantly from that of small
single fractures Major zones consist of complicated fracturing with the wide range of
apertures and fractures are in connection with each other when small single fractures
are typically hard to reach for characterisation
In grouting it is essential to understand that in major hydrogeological structures all the
fractures cannot be successfully sealed at the same time if aiming at somewhat limited
grout take ndash the largest fractures take the grout until they are filled enough and the
pressure starts to rise and the grout is forced to the smaller ones
The hydraulic aperture determines the volume of a fluid in a fracture and follows the
cubic law in relation to water flow This means that as the water flow (and the
transmissivity) from a fracture is doubled the possible grout volume in a fracture will
be 8 fold If comparing the grout take with a certain penetration length in a fracture with
an inflow of 01 lmin to an other fracture with an inflow of 1 lmin the grout take is
1000 times higher in the latter one Vice versa if grouting a fracture with an inflow of
20 lmin instead of a fracture with an inflow of 150 lmin the same penetration length is
reached with 02 of the grout volume in the first mentioned fracture Extremely small
grout takes are expected in the environments of small fractures and it should be
understood that a small grout take ndash even only some litres in addition to the bore hole
volume ndash could be significant and do not necessarily mean grouting in vain
54 Start and stop criteria to be applied 541 Start criteria
When selecting the grouting start criteria for a site one should take into account the
target of the total water inflow and the local leakages the priorities set for the grouting
and the characterisation methods available In the case of ONKALO the targets for the
water inflow and grouting differs significantly from those in most of the tunnelling
projects and the related aspects should be carefully considered Figure 5-11 presents
how the targets can be processed as the start criteria and which are the foreseen
drawbacksrisks in each case The grouting start criterion is based on the approach
where the remaining leakage low enough is prioritized to the grout take
78
Selection of the priorities and
start criteria for grouting
Priorities Priorities
1) Minimised water leakage 1) Minimised grout take and hole position
2) Grout take and hole position 2) Minimised water leakage
Conclusion Conclusion
Overdone grouting Frugal grouting
Slight indication of grouting need Reliable indication of grouting
and low trigger level need and relatively high trigger
level
Drawback Drawback
Unnecessary holes and amount Possibility of too high water leakages
of grout and need for post-grouting
Figure 5-11 A chart for the priorities conclusions and drawbacks for processing a
grouting start criteria
The following properties of a leaking fracturezone are to be observed
1 The leakage from the probe hole or a grouting hole (by measuring the out flowing
water)
2 The water take in a certain measuring section (by 1- and 2-packer water loss
measurement) and
3 The water flow from even a single fracture or a fracture zone (the Posiva flow log
measuring section alterable) ndash may need a hole with water infilling
The fracture orientation (the dip direction and the dip) cannot be detected with the
characterisation methods available However for the full optimisation it is an important
part With the help of oriented drill core samples the dip directions and the dips are
possible to obtain
The start criterioncriteria should be dependent on the fracture properties that are
available and independent on the fracture properties that cannot be observed
The measurements above may give different picture from the rock By measuring the
out flowing water and by the flow logging the real water inflow and the connections in
a larger scale can be observed but the result still represents only a very local point in a
complicated water channel network Furthermore the flow logging uses very sensible
equipment and problems with that in percussion-drilled holes have been encountered
The water loss measurement gives a better picture of the existing connections in smaller
area but does not necessary tell about a) the properties of single fractures and b) the
larger scale connections ndash or it is difficult to interpret from the results However the
measurement can be carried out systematically
79
With a limited number of probe or grouting holes we get only a coincidental hit on the
fracture network and the apertures of fractures Also the fully optimised grouting
should be dependent on the fracture orientation which cannot be observed ndash in the pilot
holes the orientations can be observed
It is suggested that the need for grouting should be based mainly on the water loss
measurement in the probe holes due to the nature of the measurement The method
tends to overestimate rather than underestimate the need for grouting Normally the
water loss measurement in ONKALO is done as 1-packer method Occasionally
2-packer method (1 m measuring section) is carried out if the water loss in a whole hole
has indicated the existence of the water conductive fractures The latter approach seems
to be practical in future The accuracy of the device should be adjusted to the prevailing
grouting start criteria Also the used overpressures should be revised closer to the
grouting overpressures when operating in deep sound rock The measurement of out
flowing water can serve as a complementary method to evaluate the larger connections
Although the Posiva flow log is quite sensitive method it should be utilised as a
complementary and more detailed means of getting more information of the water
conductive fracturing eg the number of fractures and their proportion of the leakages
More reliable and useful results can be obtained if using systematically unbending rods
in drilling When the information of the pilot holes is available that should be taken an
advantage of as well In core drilled pilot holes the flow logging has been accurate and
that can be used even as a main characterisation method
The trigger levels based on the current local limits for the inflowing water are presented
in Table 5-9 These trigger levels are directly applicable for Posivarsquos flow logging
method The trigger levels for other characterisation methods can be calculated from
this value The trigger levels are determined in the same way nowadays but here
presented also for the deeper sections The value 50 mlmin is transformed into the
Lugeon values for the lengths of 1 m and 20 m at different depths in Figure 5-12 The
Lugeon limit for 20 m refers to the measurement of the whole probe hole and the 1 m
Lugeon limit is given for the measurement with the two-seal packer The Lugeon limit
set for 20 m measuring length should be used in order to decide whether to do the two-
seal packer test or not The results of the two-seal packer test should be used when
deciding the need for grouting and selecting the drilling pattern and the grouting
parameters The measurement itself is simple but the water flow expected is too small
for the measurements accurate and reliable enough The principle of the test seems to be
appropriate and the test should be developed further The trigger level transformed into
a form of hydraulic aperture of a single fracture is presented in Figure 5-12
80
Table 5-9 The trigger levels in use in ONKALO
Area hole Trigger level 1 Trigger level 2 Trigger level 3
Depth level between R19 and R20
Pilot holes
Single leakage
Leakage from the hole
Probe holes
Single leakage
Leakage from the hole
Other holes
Single leakage
Leakage from the hole
-
-
-
50 mlmin
-
50 mll
50 mlmin
5 lmin
50 mlmin
-
-
100 mlmin
150 mlmin-
15 lmin
-
15 lmin
-
15 lmin
Below R20
Pilot holes
Single leakage
Leakage from the hole
Probe holes
Single leakage
Leakage from the hole
Other holes
Single leakage
Leakage from the hole
-
-
-
50 mlmin
-
50 mll
50 mlmin
5 lmin
50 mlmin
-
-
100 mlmin
100 mlmin-
10 lmin
-
10 lmin
-
10 lmin
1) Trigger level for detailed measurements
2) Trigger level for actions to control the leakage eg pre-grouting
3) Trigger level for effective actions to control the leakages
0000
0001
0002
0003
0004
0005
0006
0007
0008
0009
0010
0011
0012
0013
0014
0015
0016
0017
0018
0019
0020
240 260 280 300 320 340 360 380 400 420 440 460 480 500 520
Depth (m)
Lu
ge
on
valu
e (
Lu
g)
Lug-20 m
Lug-1m
0
2
4
6
8
10
12
14
16
18
20
240 260 280 300 320 340 360 380 400 420 440 460 480 500 520
Depth (m)
Hydra
ulic
ap
ert
ure
(micro
m)
The trigger level 50 mlmin transformed into 1 m and 20 m
Lugeon values as a function of the depth
The trigger level 50 mlmin transformed into hydraulic aperture of
one fracture as a function of the depth
Figure 5-12 The trigger level 50 mlmin transformed into 1 m and 20 m Lugeon values and into a hydraulic aperture (one fracture) as a
function of the depth
81
82
55 Stop criteria
Originally based on a few decades work Gustafson amp Stille (2005) have presented that
the time can be used as a stop criterion in grouting This statement is based on the
analytical approach developed by Swedish Chalmers University of Technology and
Royal University of Technology in close cooperation of SKB Here this analytical
approach and the related stop criteria are also called Grouting Time ndashmethod (GT)
Both the experiences from the construction of ONKALO and the grouting field tests
made within the project revealed a challenge with grouting time -method The time as
such is an insufficient factor to guarantee the successful grouting result with all the
targets set for ONKALO because of the ambiguity of the input data (fracture
characteristics and grout properties) and the sensitiveness of the model
Even a relatively small error in eg interpretation of the fracture characteristics or the
mix properties may deteriorate the design and consequently the time cannot be used as
a stop criterion alone The aim at optimising the sealing result and the grout take will
require a way to verify during the grouting that the design will remain valid for the
prevailing fracture conditions
Therefore it is suggested that in addition to the calculation of the ideal design
parameters (the grout mix the grouting pressure and the pumping time) according to the
GT method the grout flow is included in the system The prognosis of grout take can be
easily calculated When this is linked to the time the prognosis of grout flow can be
done Since there is always a potential risk to have an excessive inaccuracy in the source
data (the hydraulic aperture the grout properties etc) the grout flow should be used to
verify that the design andor the assumptions are accurate enough
By linking all the five parameters together and monitoring the flow rate and the grouting
time we can either verify that the assumptions were correct and the design is valid (and
continue grouting as designed) or conclude that the assumptions were not correct and
the design is not valid (and abandon the design and change to another) From now on in
this document this application is called the GTF -method referring to the words
ldquoGrouting Time amp Flowrdquo However the time has to be kept with in the stop criteria
since the flow rate may be under the measuring accuracy of the grouting equipment and
the time is then the only way to control the grouting
Due to the variation in the source data and the fact that the fluctuation of the grouting
pressure is unavoidable and that has a significant effect on the flow rate the tolerances
should be wide enough not to lead to the unworkable situations too easily
Figure 5-12 presents an illustration of a predicted flow rate with the tolerances
according to which the grout flow should take place if assumptions in the design were
accurate enough
83
H=-270-320 b=51hellip100 microm
0
2
4
6
8
10
12
14
16
18
00000 01500 03000 04500 10000 11500 13000 14500 20000
Grouting time
Gro
ut
flo
w (
dm
3m
in)
Figure 5-13 An example of the predicted flow in a fracture of 51 - 100 microm located at
the depth of -270 - -320 m The yield strength of the mix is 14 plusmn4 Pa and the viscosity of
the mix is 14 plusmn6 mPas The grouting pressure is 15 MPa
84
85
6 DISCUSSION AND SYNTHESIS
61 Grouting design
The studies made within the project and the suggestions for the future are strictly based
on the current design requirements and the existing trigger levels for the controlling of
the water inflow Some of them were analysed further in the R20 programme but the
significant changes to the design requirements were no made due to the R20
programme The design requirements which originate from the long term safety of the
repository include demanding targets for the water inflow and eg the amount of the
cement That will impose challenges for the working methods the procedures and the
equipment Some design requirements are contradictory which means that the
optimisations are needed The existing targets require that very small fractures should
be sealed The major water conductive fracture zones in the access tunnel and the shafts
have to be sealed as well The high water pressures will be an additional challenge
The data of the transmissive fractures observed in the deep drill holes was studied in
order to recognize the conditions specific to the Olkiluoto site This data was then
studied with the targets for the water inflow and the grouting set for ONKALO and used
in the study of the grouting design solutions It was observed that the averagely
fractured rock differs significantly from the fractured zones in terms of transmissivity
and fracturing The fractures with the hydraulic aperture of over 50 - 100 microm are very
sparse The fractures with the significant hydraulic importance are predominantly gently
dipping
The literature study to find a suitable way to handle the stop criterion for the grouting
which is a key issue in the optimisation was performed The study revealed an
approach which has been developed in Sweden in the cooperation with SKB CTH and
KTH and that turned out to be better tool for the optimisation than the other
alternatives The theory is presented in the context of the time stop criterion and is here
also called the ldquoGrouting Timerdquo -method (the GT method) The method applied is
analytical and very simple The approach does not conform with the Finnish norms for
the grouting but it is however the only one so far that connects all the design
parameters together (the mix properties the grouting pressure the fracture
characteristics the desired penetration length and the pumping time ndash and in some cases
also the grouting hole density) As a comment on the model is that the link between the
parameters characteristic grouting time and the theoretical maximum penetration length
is not fully clear The experiences of the method are limited but the deviations from the
national norms are quite small the only new source parameter is the viscosity of the
grout and the only new parameters in the grouting design will be the use of the pumping
time (under maximum pressure) It is assumed that the method ndash and the approach to the
grouting presented ndash is in the beginning of its evolution and more developed versions
will be available in the future As an additional comment on the design parameters
practically because we are operating in the very deep and sparsely fractured rock the
grouting hole density cannot be linked to the design parameters as presented by
Gustafson amp Stille (2005) ndash the design of the grouting hole drilling pattern is more a
matter of probabilities This will be discussed more in details later
86
The penetration length of a grout is highly dependable on the hydraulic aperture of
fractures and considerably to the yield strength and the viscosity of the grout as well as
to the grouting overpressure The accurate determination of these parameters is
important and full compliance with the grouting design is essential during the grouting
work The model and some investigation methods take into account only the fractures
and the transmissivitiesapertures that are intersected by a probe or a grouting hole
There surely are additional fractures and connections that are not detected in the holes
Also the pressure fall in the fractures is one uncertainty and poorly understood One
way to take this into account is to use safety factors in the design (for the penetration
length) The safety factor to suite in all the instances cannot be established
The GT method and the Olkiluoto site data were used in the feasibility study of the
design solutions In order to reach the set targets for the grouting it was decided that the
optimal design solution that meets the target shall include the following components
The grouted areas are targeted as currently stated in the design requirements and
other ONKALO specific instructions
The use of the available low pH grouts (cementitious used in this study) and
The grouting holes inside the tunnel profile and the limited grout penetration
length in order to minimise the risks to the disturbances due to the cement
The study was done only for 1-fracture systems since the similar approach is applicable
for multi-fracture systems The 1D and 2D models were used in calculations but the 2D
was used for drawing the conclusions In certain conditions the grout flow can be
3-dimensional as probably happened in the second grouting test The only way to get
enough good picture of the dimension of the grout flow in is to analyse the
dimensionality of the flow observed in the real grouting operations That feedback could
be a basis for optimising the grouting design further
Those calculations resulted in the support of the optimal design solution by the theory
for the fracture apertures of 100 microm in the tunnel in the depth level range -270 - -400 m
Below the depth level of -400 m the fracture limit found in this project was 200 microm
Below those aperture limits the designer could consider the following divert the
grouting holes outside the tunnel profile raise the grouting pressure relatively high
(which may be compensated partially by using longer pumping times) or use even
thinner mix (colloidal silica or cementitious grout) than currently available The last
meets the set targets best The strength development of the thin mixes may be slower as
observed in eg the grouting tests On the other hand even thicker grouts are
recommended in the environment of large fractures and high groundwater pressures
However the fractures with the hydraulic aperture of more than 50 - 100 microm are very
sparse and thus the optimal design solutions can be used seldom
The field tests revealed problems in using only the grouting time as the stop criteria If
there is any uncertainty in the source data or the made assumptions the time is set in
wrong basis and that cannot be observed during the grouting The accuracy of the
available fracture and the mix properties is not enough to use the grouting time solely as
a stop criteria The grout flow should be incorporated to the system and it is
recommended that it is used as a part of the stop criteria The grout flow is simple to
87
predict via the expected grouted volume at the certain moment of time Analytical
expressions presented in the literature are available to make these predictions Because
the system is sensible to the fracture aperture and the rheological properties of the
mixes and the grouting pressure cannot be kept constant all the time the tolerances for
the grout flow should be accepted as well
The current trigger levels for the starting the means a need for the use of colloidal silica
in the deep rock There is no practical experiences to prove that very small fractures can
be sealed with cementitious grouts
Pre-grouting is proposed as a primary measure as done this far Some of the grouting
can be handled with typical designs adjusted to the site-specific conditions and that will
disrupt the tunnel drifting the least That is supposed to apply for the most of the access
tunnel The exceptions in the access tunnel might be a) the situations when a leaking
fracture or a fracture zone is parallel to the tunnel or that intersects the drift in a way
that it will lead to redirect the grout hole pattern to intersect with the fracture(s) or
b) the situation of unexpected condition that has not been prepared beforehand for
In a multi-fracture system the way to optimise the grout take is to have two or more
grouting rounds This well-known technique which is strongly recommended in multi-
fracture systems is also called as split spacing ie the wider fractures are sealed first
with thick grout and new grouting holes are then done to seal the smaller apertures with
thinner mix This is essential to understand in order a) to diminish the grout take and b)
to accelerate the strength development of the grout
The grouting of the hydrogeological structures RH19 and RH20 should be designed
separately ndash when met in the access tunnel andor the shafts since the structures have
structure specific features in the hydrogeological environment in the ONKALO area and
due to their orientation However the design principles presented in this work are more
or less applicable to all the structures with the same kind of characteristics The RH20
structure is gently dipping which will be an extra challenge in the access tunnel
The design principles in the tunnel will not apply for the shafts as such since the
grouting should be done in very long sections ndash nearly 100 m Operating too close to the
shaft cross cuts or the tunnel may impose a need to grout with lower pressures to avoid
undesired by-pass connection into the tunnel or hydraulic jacking
The post-groutings should be designed also individually Its worth to realize that when
operating close to the tunnel walls the water gradient and consequently the grout flow
is strongly towards the tunnel Practically this means that eg the post-grouting holes
shuold be taken relatively far away from the tunnel walls In the case of post-grouting
the wider the leaking fracture is the denser the grouting holes should be and the further
away from the tunnel walls they should be located
88
Briefly the grouting design in the future should include the following parts
1 Design basic data and the calculations
2 Start criteria for grouting expressed in the terms of used characterisation methods
3 Design for the criteria to select suitable drilling patterns among a selection of them
for different purposes and determination of the cases when the typical drawings
cannot be used
4 Design for the criteria to select a grout mix (among many) the criteria to accept the
mix in use and the corresponding stop criteria which includes the grouting pressure
the pumping time the grout take and the predicted grout flow with reasonable
tolerances The grout flow should be used to verify if the design is valid or not
None of the parameters should be used alone
5 Design for the actions if the grout take and the flow during a predetermined
pumping time do not correspond with the predicted ones (considering the
tolerances)
6 Design for controlling the grouting result before the excavation (not applicable for
post-groutings) and the actions if the result is not obtained and
7 Design for the details such as determining a hole totally tight or eg filling of the
grouting holes in the environment of small fractures before the actual pumping
under the high pressure is started or for example the removal time of packers
There are some characterisation methods that can be used to estimate the groutability of
the rock The water loss measurement proved to be unfailing in various conditions and it
can be done systematically The more detailed picture of the rock can be obtained if
using 2-seal packers instead of 1-seal packer system The interpretation of the water loss
measurement results is important in order to understand the nature of the hydrological
environment ndash in certain cases the maximum Lugeon value does not indicate the need
for grouting As a complementary method the Posiva flow log is recommended since it
makes it possible to observe the properties and the number of single fractures The start
criteria for the grouting should take both of these into account and the set criteria for the
different methods should be mathematically in line with each other In order to get a
better picture of the rock to be grouted the pressures used in the water loss
measurement should be raised closer to those applied in the grouting Straight holes free
of the drilling cuttings and other debris are essential to assure high quality flow log data
In principle two basic drilling patterns in the access tunnel should be sufficient one
with the holes outside the tunnel profile and one with the holes inside the tunnel profile
In practice more drilling patterns will be needed since the excavation profile varies and
there are the shafts and other rooms that require special drilling considerations The
optimal grouting hole density cannot be set A suitable density shall be found with
practical iteration Even in the case of an extremely dense drilling pattern there is a good
chance to miss the water channel and not to detect it A denser drilling pattern will be a
remedy to reduce this risk In the second grouting field test it was observed that even 1
m grouting hole density did not give the picture of the rock reliable enough
The location of grouting holes turned out to be more complicated thing than expected If
the intention of turning the grouting holes inside the tunnel profile is to diminish the
grout remaining in the rock after excavation the following things are to be happened in
89
principle we can ldquowasterdquo with the number of holes in order to find the water channels
But at the same time we will need higher grouting overpressures and pumping times to
reach the same penetration length of grout Also if the grouting holes are parallel to
each other certain fracture directions are not hit Besides this room for the grouting
holes in possible next grouting rounds and for blasting holes should be saved This
means that there is a limit for the highest grouting hole density and thus eg two
grouting rounds with the holes inside the tunnel profile should be the maximum If the
grouting holes will be diverted outside the tunnel profile every hole increases
significantly the amount of the grout remaining in rock after excavation ndash especially in
the case of small fractures If the grouting hole density is too high there is a risk that the
grout squeezes out from the next grouting holes This can be a problem if operating
with the leaking hole cannot be started soon ndash the grout starts to set and the grouting
hole could be wasted
A collection of cementitious recipes studied (non-accelerated and accelerated) exists
The pH rate of cementitious grouts is not of importance from the point of view of the
grouting techniques The rheology the penetration ability and the strength development
are the key factors leading to successful grouting Since the penetration length is very
sensible to the rheological properties of the grout the quality control in the work site is
important Besides the penetration ability is a key issue especially in small fractures
and should be controlled carefully before the grouting Also it should be emphasized
that when designing the grouting the observations of the mix properties from the field
conditions should be used instead of those from the laboratory The beaker test did not
work as a method to follow the early age strength development of cementitious grouts
because the conditions prevailing in rock differs significantly from those in a tunnel
The grouting of small fractures differs from the grouting of the larger ones In order to
reach the same penetration length for the grout the grout take is high in large fractures
whereas it is extremely small while grouting very small fractures Only a few litres of
grout will be enough to seal the small fractures Thicker mixes than available for the
moment are recommended for grouting of large fractures eg in the environment of the
hydrogeological structure RH20 The selection of the mixes should be wider The
grouting of very small fractures will probably require more mixes than currently proven
by the tests The field tests were done with the non-accelerated low pH grouts Recently
the also accelerated mixes has been used This does not void the studies presented in
this report ndash the basic concept do not suffer essentially
Many practical hints for operating with colloidal silica were obtained in the pilot field
These apply to eg its sensitivity to impurities in the mixers the accelerator quality and
the dosing the practical range of the operating time the operating time considerations
when designing the grouting and the work phases the storage of the components etc It
was hard to remove all the silica from the grouting holes (in order to fill them with the
cement paste later) Because the content of the accelerator has a great impact to
behaviour of the colloidal silica and the practical operation times the question how to
seal relatively large fractures under high water pressures with this material aroused In
order to get the material to gel fast enough the accelerator content should be relatively
high which means that the practical operation time for the grouter will be very short
The beaker test did not work as a method to follow the early age strength development
90
of colloidal silica because the conditions prevailing in rock differs significantly from
those in a tunnel
It was also observed that the lack of understanding in the meaning of the pumping time
under the maximum design pressure leads to following mistakes the smallest fractures
will not be sealed and some holes that actually intersect water leaking fractures are
wrongly interpreted as tight holes and they remain only partially filled with grout This
kind of misconception has probably been the main reason for the relatively high
proportion of unfilled grouting holes between the tunnel chainages 0 - 1850 The filling
of the grouting hole prior to pressurizing proved to be a useful and practical solution
avoid this misinterpretation The filling save time for the pumping and this is important
to do when the mix properties do not change significantly
The recommendations for grouting pressures vary a lot in the literature Based on the
field tests the recommended grouting pressure is a below the limit for hydraulic
uplifting However this results in relatively high grouting pressures at the great depths
What happens to the grouting pressure in rock and in the boundary of water and grout is
not understood and could not be studied in this project However these are phenomena
which affect the grouting result for sure The rock mechanical effects of the high
grouting pressures are poorly understood area
It is clear that the full solution for the optimised grouting is not done in the office and
with the recommendations given above It is necessary that besides the designer the
grouting crew understand the contents of the design and can ldquoreadrdquo the rock response
obtained during the grouting and react to it if the grouting is not proceeding as planned
due eg the uncertainties related to the bedrock data Even though an important step in
the grouting design can be taken the grouting work itself should involve a semi-
activerdquo design during the work However the rules for this semi-active grouting design
during grouting should be determined beforehand and expressed in the design
The grout flow in the small fractures will be so slow that the current flow meter in
Posivarsquos grouting equipment cannot record it anymore This may result in difficult
situations for the grouting crew because they should verify the grout movement by
making the indirect observations eg from the piston movements The flow meters
should be able to detect flows in the accuracy of 001 lmin if willing to observe the
progress of the grouting of the smallest fractures By the same token it should be
possible to record the high grout flow rates as well
62 Grouting work
The accuracy of the flow meters of the water loss measurement device and the grouting
equipment were insufficient when grouting small fractures as targeted in ONKALO
All possible efforts to improve the accuracies should be made
In order to reach the penetration length of the grout as designed the transmissivities and
hydraulic apertures of the fractures should be able to be determined as accurately as
possible Besides the development of the water loss measurement the use of unbending
rods in drilling should be considered in order to enhance the possibility to get the
91
reliable results The holes will be straighter and thus more investigations (the Posiva
flow log) can be carried out and more detailed source data can be obtained Also the
grouting result will be better because the holes are located as planned
The datasets between reliable flow loggings and corresponding sets of the MWD data
gathered for interpretation with the Rockma software were compared No correlation
was found The algorithms in the Rockma software should be at least calibrated
However it is possible that the MWD data cannot be used in deep and tight conditions
like in ONKALO
In the first grouting test the importance of the excavation damage zone (EDZ) was
experienced in the grouting work The EDZ cannot be avoided and thus it should be
managed The practical solutions for this are eg to inform the grouting designer about
possible deviations from the extent of the EDZ normally experienced (eg due to
reblastings) and selecting the packers long enough for water loss measurements and
grouting That will prevent the EDZ from disturbing the successful grouting
It is good to start the grouting far enough (several metres) from the fracture targeted
since we cannot observe its orientation However no definite basis to specify the
distance was obtained
The following investigations aiming at selecting a suitable design or designing the
grouting should be carried out observing the leaking fractures on the rock surfaces and
measuring the water out flow and the water losses in probe holes or in grouting holes
and to carry out the flow logging if possible In order to avoid unnecessary time losses
on the water loss measurements it is recommended that first the hole is measured in the
full length and if the trigger level is exceeded (indicates the possibility that the local
trigger levels may be exceeded) then to measure the water losses in 1 m sections along
the hole The first measurement could be carried out applying several over pressures to
observe the nature of the hydraulics around and the latter measurement could be done
with a uniform pressure
Based on the design approach presented in the previous Section the progress of the
grouting work should happen by as follows
1 Obtain the characterisation results (the water losses the flow logging the water
outflow) from the probe holes and the fracturing
2 A geologisthydrogeologist to interpret the results (in terms of transmissivities and
hydraulic apertures)
3 Selecting the drilling pattern based on the set criteria ndash if the leaking fracture
intersects the drift then change the orientation of the grouting holes
4 Investigate the grouting holes (the water losses the flow logging the water out
flow)
5 Read the results got from the grouting holes and select the suitable design
according to the largest fracture group that determines the actions in the first
grouting round if several rounds are needed
6 Fill the holes in the ldquotightrdquo rock
92
7 Start the grouting according to the instructions taking into account also the quality
criteria set for grout mixes the grouting of holes should start by filling them
8 Measure the grout take time and flow
9 If grouting progresses as planned (observed by the grout flow and its tolerances)
continue up to the end if not then change to the other typical design having a
different mix and the new design parameters
10 Follow the early age strength development of the grout and release the packers
according to the design
11 When grout is set enough verify the grouting result with the control holes the
acceptance criteria is similar to the starting criteria and
12 If the result is within the acceptance criteria then continue the excavation if not
then the control holes are used as new probe holes and the process goes back to the
step 1 until the target is reached
Both the fracture properties and the mix properties are the input data for the grouting
design In order to reach correct adaptation of the design the mix properties should be
controlled before grouting
Even though the objective in this work was to define reasonable low grouting pressures
the increase of the grouting pressures will probably be needed This should be taken into
account when selecting the packers When grouting small fractures custom made
packers that can be used for the filling of holes first and then continuing the grouting
pumping directly should be taken into use
It would be a benefit if several grouting holes could be grouted at the same time with
no significant pressure differences in nearby grouting holes If considering the
connection of the grouting holes to the same grouting line the pressure increase and the
grout flow should be followed and controlled separately for every hole because the
grout flows to the easiest way (the law of the smallest resistance)
The grouting with accelerated mixes and especially with colloidal silica should be
trained more because there are limitations concerning the time frame the material
properties remain within workable limits
The prevailing circumstances together with the strict requirements lead to the fact that
measuring accuracy of the flow meters (the water loss test and the grout flow) are not
sufficient The flow meters should be able to detect the flows in accuracy of 001 lmin
The automatization of the grouting should be considered since it facilitates the work
As stated earlier even thought carefully designed the grouting work is partly empirical
and requires the design-as-you-go ndashthinking The grouting crew should be competent
enough to understand the content of the design and also to change the design according
to the predetermined guidelines when necessary Thats why the crew should be trained
for all the actions presented above
93
7 CONCLUSIONS AND RECOMMENDATIONS
The water inflow target have been obtained in the first two km of the access tunnel of
ONKALO The grout take in the first km has been relatively high and a significant part
of the grouting holes has been unfilled The rock characterisation for the grouting
purposes has been difficult in deep and tight bedrock and more challenges will be met
when going deeper The traditional water loss measurement appeared to be the most
practical method even though the measurement accuracy should be improved the
overpressures should be revised and interpretation of the results should be trained more
The flow logging and the water loss measurements with 2-seal packer are recommended
to search for single fractureszones The geological mapping of the tunnel drift could be
utilized better in the grouting design
Due to the long term safety reasons the new grouting materials (low pH grouts and
colloidal silica) should be taken into use and further optimisations of the grout take
should be done The norms and standards do not give enough guidelines for the
optimisation and new tools were searched for Fortunately this kind of research and
development has been done and the Swedish Grouting Time -method proved to be the
most developed approach to study the grouting parameters the grout properties the
grouting pressure the penetration length aimed and the pumping time The approach
was further developed and so called Grouting Time amp Flow -method with the inclusion
of the grout flow monitoring to overcome uncertainties in the bedrock data is
recommended for ONKALO The original suggestion ndash to use the time solely as a stop
criterion ndash do take into account the uncertainties and the variations related to the source
fracture data and thus the grout flow is necessary to prove With it we can indirectly
observe if the used assumptions in the design were sufficiently close to the real ones
Hopefully the model will be developed further in the future and the design and the
grouting work could then be iteratively developed as more experiences are gained
The re-evaluation of the current trigger levels for starting the grouting are
recommended since the levels have a remarkable effect on the construction and the
every days practices Pre-grouting is recommended to be the main way to seal the rock
In order to enable fluent and cost efficient tunnel driving the use of typical designs for
the expected rock conditions is recommended The major structures like the RH19 and
the RH20 the shafts the post-groutings the cases where a leaking fracture intersects the
tunnel drift should be designed individually According to the study performed the
fractures down to the hydraulic apertures of 100 - 200 microm can be sealed with the
cementitious low pH grouts and having the grouting holes inside the tunnel profile (to
minimise the grout remaining in rock) However these fractures occur very sparcely in
the ONKALO bedrock and usually the alternative design solutions have to be searched
Those are the use of colloidal silica instead of cementitious grouts the grouting holes
outside the tunnel profile or having high grouting pressures Out of these choices the
use of colloidal silica and the grouting holes outside the tunnel profile are
recommended The development of thicker cementitious grouts for intersection of the
major hydrogeological structures is recommended
94
The implementation of the development work requires the following actions
Design basis investigation and design procedure should be revised
Design contents and form should be revised
Grouting procedure and certain details should be revised
Accuracy of the flow meters is recommended to be improved
Water loss measurement should be developed further
Education for designers and grouters should be organised
Systematic data gathering would enable further development of grouting and
Grouting experiences should be evaluated as an every days part of grouting design
work and the increased know-how should be taken in use fluently
The following details are emphasized in this Chapter and more detailed
recommendations can be found in Chapter 6
The penetration length and penetration ability of the grout is sensible to the
hydraulic aperture of the fractures the rheological properties of the grout and the
grouting overpressure The focus in the rock characterisation the grout quality
control and the execution of the grouting should lay on these factors
The follow of the grout flow is recommended to be the most important part to
verify the applicability of the grouting design
The model to measure the groutings does not take into account the fractures that do
not intersect a probe hole or a investigation hole The water loss measurement
should be developed further and the understanding and the utilization of the results
obtained from the results should be increased
The grouting overpressure prevailing and the fall of the pressure in the rock is
poorly understood The rock mechanical effects caused by the grouting pressure are
not understood enough and should be studied further
In the case of multi-fracture systems the grouting should start by sealing of the
largest fractures with relatively thick mixes As the sealing occurs the grouts
should be thinned in the possible next grouting rounds The expected grout take
varies a lot depending on the rock conditions Very small grout takes do not
indicate grouting in vain
The determination of the location and the density of grouting holes are and will be
empirical and the optimum should be iteratively found until better characterisation
methods will be in place Some holes intersect the fractures and some do not The
unnecessary drillings cannot be avoided fully The use of the grouting holes inside
the tunnel profile appeared to be more complicated that expected Only the most
largest fractures can be grouted with that kind of drilling patterns
It is recommended to extend the current selection of the grout mixes to cover
thinner cementitious mixes and colloidal silica for the smallest fractures and thicker
mixes for the largest fractures The quality control in the field should be organised
to keep the uncertainties related to the mix properties under control
Because very small fractures should be sealed and relatively high grouting
overpressures will be needed the packers should be adjusted to the new suite
The occupational safety should be taken into account (the length of packers the
distance to the fracture to be grouted)
95
The better accuracy of the flow meters is recommended since the requirements
concerning the water inflows are so tight and
In principle the working cycles would be the same when grouting small and large
fractures When grouting small fractures the filling of the grouting holes before the
actual grouting (raising the pressure) should be a common practice This should be
taken into account when selecting the packers
Colloidal silica should be studied and tested more The removal of the silica from
the grouting holes should be developed further
In order to go further in optimising of the grouting the development of the probe
hole characterisation methods and the accuracy of the measurement devices is
recommended The geophysics and geostatistics may give the new possibilities in
addition to the existing ones If the variation of the fracture apertures and the
fracture orientation can be observed some day a new significant step for the more
optimised grouting can be taken
96
97
REFERENCES
Ahokas H Hellauml P Ahokas T Hansen J Koskinen K Lehtinen A Koskinen L
Loumlfman J Meacuteszaacuteros F Partamies S Pitkaumlnen P Sievaumlnen U Marcos N
Snellman M amp Vieno T 2006 Control of Water Inflow and Use of Cement in
ONKALO after Penetration of Fracture Zone R19 Posiva Oy Olkiluoto Finland
Working Report 2006-45
Axelsson M 2006 Strength Criteria on Grouting Agents for Hard Rock - Laboratory
studies performed on gelling liquid and cementitious grout Licentiate Thesis Chalmers
University of technology Goumlteborg Sweden
Bergman S amp Nord G 1982 On adequate tightening of tunnels Swedish Rock
Engineering Research Foundation ndash BeFo Stockholm Sweden (In Swedish)
Brantberger M 2000 Metodik vid foumlrinjektering I uppsprucket haringrt berg Licentiate
Thesis Royal Institute of Technology Stockholm Sweden
Concrete Association of Finland 2006 Grouting of Rock Facilities Helsinki Finland
Working Instruction BY53 (In Finnish)
Fransson Aring 2001 Characterisation of Fractured Rock for Grouting Using
Hydrogeological Methods Chalmers University Of Technology Department of
Geology Goumlteborg Sweden
Fransson Aring amp Gustafson G 2007 Efterinjektering Inlaumlckageprognos och design ndash
foumlrslag till analys Swedish Rock Engineering Research Stockholm Sweden SveBeFo
Rapport 75 (In Swedish)
Funehag J 2007 Grouting of Fractured Rock with Silica Sol Grouting design based on
penetration length Chalmers University of Technology Department of Civil and
Environmental Engineering Goumlteborg Sweden
Gardemeister R Johansson S Korhonen P Patrikainen P Tuisku T amp Vaumlhaumlsarja
P 1976 The application of Finnish engineering geological bedrock classification
Techical Research Centre of Finland Geotechnical laboratory Espoo Finland
Research note 25
Gustafson G 2005 Tn 050928 Rev 051003 Considerations on grouting pressure
(Non-checked reference from Concrete Assosiation of Finland 2006)
Gustafson G amp Claesson J 2004 Steering parameters for rock groutingSubmitted to
the International Journal of Rock Mechanics and Mining Sciences In prep
Gustafson G amp Stille H 1996 Prediction of groutability from grout properties and
hydrogeological data Tunnelling and Underground Space Technology Vol 11 No 3
pp 325-332
98
Gustafson G amp Stille H 2005 Stop Criteria for Cement Grouting Felsbau Zeitschrift
fuumlr Geomechanik und Ingenieurgeologie im Bauwesen und Bergbau Vol 23 No 3 pp
62-68
Hakami E 1995 Aperture Distribution of Rock Fractures Division of Engineering
Geology Department of Civil and Environmental Engineering Royal Institute of
Technology Stockholm Sweden Doctoral Thesis p 22
Hansen J Vuorio M Koskinen K Juhola P Vuorinen U Sievaumlnen U Raivio P
amp Karttunen P 2008 Groundwater Inflow Management in ONKALO ndash The Future
Stategy Posiva Oy Eurajoki Finland Working Report 2008-44 (to be published)
Hellauml P Vaittinen T Saksa P amp Nummela J 2004 Statistical analysis and
modelling of Olkiluoto structures Posiva Oy Olkiluoto Finland Working Report
2004-58
Hellauml P Ahokas H Palmeacuten J amp Tammisto E 2006 Analysis of geohydrological
data for design of KBS-3H repository layout Posiva Oy Olkiluoto Finland Working
Report 2006-16
Hollmeacuten K 2007 R20 programme The development of grouting technique ndash Stop
Criteria and Field Tests Posiva Oy Olkiluoto Finland Working Report 2007-101
Houlsby A 1990 Construction and Design of Cement Grouting John Wiley and Sons
New York The United States of America
Haringkansson U 1993 Rheology of Fresh Cement-Based Grouts Royal Institute of
Technology Stockholm Sweden Doctoral Thesis
Haumlssler L 1991 Grouting of Rock ndash simulation and classification Doctoral Thesis
Royal Institute of Technology Stockholm Sweden
Lehtinen amp Hirvonen 2007 Monitoring Waterleakages and Results of Watersampling
from the Leaking Structures and Fractures after Grouting in ONKALO 2005-2006
Posiva Oy Olkiluoto Finland Working Report 2006-28
Lokkila M 2008 Flow of Bingham and Newtonian fluids in hard rock- application for
ONKALO University of Helsinki Department of Physics Helsinki Finland Masters
thesis
Lombardi G 1997 GIN principle revisited Water Power amp Dam Construction
October 1997 pp 33-36
Lombardi G amp Deere D 1993 Grouting Design and Control Using the GIN principle
Water and Power and Dam Constructions June 1993 pp 15-22
Posiva picture archives httpwwwposivafi
99
Ranta-Korpi R Karttunen P amp Sievaumlnen U 2007 R20 programme Field testing of
grouting materials Posiva Oy Olkiluoto Finland Working Report 2007-102
Reiman M Poumlllaumlnen J amp Vaumlisaumlsvaara J 2006 Flow measurements in ONKALO at
Olkiluoto Probe holes and ONK-KR1 ndash ONK-KR4 ONK-PVA1 and ONK-YPPL18
Posiva Oy Olkiluoto Finland Working Report 2006-65
Riekkola R Sievaumlnen U amp Vieno T 2003 Controlling of Disturbances due to
Groundwater Inflow into ONKALO and the Deep Repository Posiva Oy Olkiluoto
Finland Working Report 2003-46
Sievaumlnen U 2002 Groundwater inflow and grouting conditions at the Olkiluoto site
Eurajoki western Finland Licenciate Thesis University of Helsinki Helsinki Finland
Sievaumlnen U amp Riekkola R 2003 Controlling of Groundwater Inflow into ONKALO
and the Deep Repository at Olkiluoto Summary Report Posiva Oy Olkiluoto Finland
Working Report 2003-51
Vaittinen T Ahokas H Heikkinen E Hellauml P Nummela J Saksa P Tammisto
E Paulamaumlki S Paananen M Front K amp Kaumlrki A 2003 Bedrock model of the
Olkiluoto site version 20031 Posiva Oy Olkiluoto Finland Working Report 2003-43
Vaittinen T Nummela J amp Tammisto E 2007 Expected occurence of the
transmissive fractures at the repository level for grouting design purposes Posiva Oy
Olkiluoto Finland Working Report 2007-87
Vieno T Lehikoinen J Loumlfman J Nordman H Meacuteszaacuteros F 2003 Assessment of
Disturbances Caused by Construction and Operation of ONKALO Posiva Oy
Olkiluoto Finland Posiva Report 2003-06 ISBN 951-652-120-7
Oumlhberg A Rouhiainen P 2000 Posiva groundwater flow measuring techniques
Posiva Oy Olkiluoto Finland Working Report 2000-12
100
101
APPENDIX 1
102
103
104
105
106
107
APPENDIX 2
108

February 2009
Working Reports contain information on work in progress
or pending completion
The conclusions and viewpoints presented in the report
are those of author(s) and do not necessarily
coincide with those of Posiva
Ursu la S ievaumlnen
Saan io amp R iekko la Oy
Work ing Report 2008 -45
R20 Programme Development ofRock Grouting Design
Techniques and Procedures for ONKALO
ABSTRACT Posiva Oy constructs an underground research facility ONKALO at Olkiluoto in
Eurajoki ONKALO is planned to be a part of the deep repository for the high level
nuclear waste Posiva Oy set up R20-programme for the years 2006-2008 with the
target of having an acceptable grouting methodology in ONKALO The programme was
divided into three projects and the work and results of Technique ndashproject is presented
in this report The implementation of the results (grouting design and execution) was
outlined from the project That work is under the responsibility of construction of the
ONKALO-project
The Grouting Technique ndashproject (INKE) studied the grouting experiences obtained
from the first 2 km of the ONKALO access tunnel searched for suitable grouting design
approaches carried out two grouting tests and one pilot grouting test with colloidal
silica in ONKALO analysed the expected grouting conditions in deep rock from the
grouting point of view studied the feasibility of so called optimal design solution in the
expected grouting conditions Based on these studies recommendations concerning the
grouting design design solutions for different rock conditions grouting procedures
grouting stop criteria the characterisation methods for grouting purposes grouting
materials and grouting work performance are presented Swedish Time Stop Grouting
also named Grouting Time ndashMethod was selected to be studied and used in this project
and it was further developed
This work compiles the outcome of the project subtasks and presents the
recommendations for developing the grouting in ONKALOThe key conclusion of this
work are
Grouting Time ndashmethod (time stop grouting) alone is not enough to be used as a
grouting stop criterion due to the uncertainties related to the source parameters
(fracture characteristics rheological properties of grouts) These cause too high
uncertainties when proving the sealing result via the grouting time
Due to the uncertainties related to the key source data it is recommended that the
grout flow is involved as a part of grouting stop criteria It is possible to verify with
the grout flow if the source data and made assumptions were accurate enough
The ideal grouting design solution (in this project the use of low pH cementious
grouts grouting holes inside the tunnel profile limited grout take) from the long
term safety point of view and the feasibility of it in different rock conditions is
presented but it can can be used seldom because fractures are typically very small
The alternatives are to direct the grouting holes outside the tunnel profile to use
higher grouting pressures or to develop thicker and thinner grout mixes and take
colloidal silica in use The last alternative is recommended
Part of groutings can done with typical designs for different rock conditions The
exceptions of this are major regional hydrogeological structures shafts post-
groutings and fractures that intersects the tunnel drift Those should be designed
invidually
Besides these recommendations concerning the grouting design equipments grouting
work rock characterisation and implementation of the results of this project are
presented in this work
Keywords ONKALO disposal of high level nuclear waste grouting grouting
techniques grouting design grouting work Time Stop Grouting Grouting Time ndash
Method Grouting Time and Flow ndash Method
R20 Ohjelma Injektointisuunnittelun -tekniikan ja tyoumlmenetelmien kehittaumlminen ONKALOa varten
TIIVISTELMAuml
Posiva Oy rakentaa maanalaista tutkimustilaa ONKALOa Eurajoen Olkiluotoon
Tutkimustila toimii aikanaan mahdollisesti osana korkea-aktiivisen ydinjaumltteen
loppusijoitustilaa Posiva Oy kaumlynnisti vuonna 2006 R20-ohjelman jonka tavoitteena
oli saavuttaa hyvaumlksyttaumlvauml injektointimenettely ONKALOssa kaumlytettaumlvaumlksi Ohjelma
jakaantui kolmeen projektiin ja Tekniikka-projektin tyoumlt ja tulokset on esitetty taumlssauml
raportissa Projektista oli rajattu pois varsinainen suunnittelutyouml ja toteutustyouml joka on
osa ONKALOn rakennusprojektissa tehtaumlvaumlauml tyoumltauml
Tekniikkaprojektissa (INKE) tutkittiin mm ONKALOn ajotunnelin kahden ensim-
maumlisen kilometrin aikana saatuja kokemuksia injektoinneista etsittiin suunnittelu-
menetelmiauml mitoittaa injektointi suoritettiin kaksi injektointikoetta ja pilottikoe-
injektointi kolloidisella silikalla ONKALOssa analysoitiin odotettavissa olevat olo-
suhteet injektoinnin kannalta syvaumlkalliossa tutkittiin ns optimaalisen suunnittelu-
ratkaisun toteutettavuutta odotettavissa olevissa olosuhteissa Naumliden perusteella
esitetaumlaumln suosituksia koskien injektoinnin suunnittelumenetelmiauml suunnitteluratkaisuja
eri olosuhteissa suunnitteluprosessia injektoinnin lopetuskriteeriauml injektoitavan kallion
tutkimusmenetelmiauml injektointimateriaaleja ja injektointityoumln suoritusta Projektissa
valittiin tutkittavaksi ruotsalainen Time Stop Grouting ndasheli Grouting Time ndash menetelmauml
ja sitauml kehitettiin edelleen
Taumlssauml tyoumlssauml koottiin projektin osatehtaumlvien tulokset ja esitetaumlaumln suositukset injek-
toinnin kehittaumlmisen osalta jatkoon Taumlmaumln tyoumln keskeisiauml johtopaumlaumltoumlksiauml ovat
Grouting Time ndashmenetelmauml (time stop grouting) ei yksin riitauml injektoinnin
lopetuskriteeriksi koska menetelmaumlssauml kaumlytettaumlviin parametrien maumlaumlrittaumlmiseen
(rakojen ominaisuuksien ja injektointimassojen reologisten ominaisuuksien vaih-
telu) liittyy epaumlvarmuuksia jotka aiheuttavat liian suurta epaumlvarmuutta halutun
injektointituloksen varmistamisessa injektointiajan avulla
Laumlhtoumltietoihin liittyvaumln epaumlvarmuuden vuoksi suositellaan ettauml injektoinnin
lopetuskriteeriksi otetaan myoumls massavirtaama joiden avulla voidaan todentaa
injektoinnin suoritusvaiheessa ettauml laumlhtoumltiedot ja tehdyt oletukset ovat halutuissa
rajoissa
Loppusijoituksen pitkaumlaikaisturvallisuuden kannalta ns ideaalista suunnittelu-
ratkaisun (taumlssauml projektissa matalan pHn sementtipohjaisen injektointimassan
kaumlyttouml injektointireiaumlt tunneliprofiilin sisaumlpuolella ja rajoitettu injektointimassa-
menekki) soveltuvuusalueet on esitetty mutta sitauml voidaan kaumlyttaumlauml harvoin koska
raot ovat tyypillisesti hyvin pieniauml hydrauliselta avaumaltaan Vaihtoehtona esite-
taumlaumln reikien kaumlaumlntaumlmistauml tunneliprofiilin ulkopuolelle esitettyauml korkeampien
paineiden kaumlyttoumlauml tai olemassa olevan injektointimassavalikoiman laajentamista ja
kolloidisen silikan kaumlyttoumlauml Naumlistauml viimeistauml suositellaan
Osa injektoinneista on tehtaumlvissauml tyyppisuunnitelmaratkaisuiksi odotettavissa
oleviin olosuhteisiin Naumlistauml poikkeuksia ovat alueellisesti merkittaumlvaumlt rakenteet
kuilut jaumllki-injektoinnit ja tapaukset joissa rako leikkaa tunneliperaumln Naumlmauml pitaumlauml
suunnitella yksiloumlllisesti
Lisaumlksi tyoumlssauml on esitetty suosituksia koskien injektointisuunnittelua laitteita injek-
tointityoumltauml kalliotutkimuksia ja taumlmaumln projektin tulosten implementointia
Avainsanat ONKALO ydinjaumltteen loppusijoitus injektointi injektointitekniikka
injektointisuunnittelu injektointityouml Time Stop Grouting Grouting Time ndashmenetelmauml
Grouting Time and Flow ndash menetelmauml
PREFACE AND ACKNOWLEDGEMENTS
In 2006 Posiva launched a special RampD project called R20 programme which
completion is due early 2008 The programme had an objective to develop grouting
techniques and the use of grouting materials to meet the long term safety requirements
in ONKALO and in the deep repository The Grouting Technology project as a part of
the programme concentrated on developing grouting methods and techniques and that
was carried out with cooperation of several companies The project group consisted of
the author as a project manager Tapani Lyytinen (ELY Management Oy) who acted as
R20 programme manager as well Johanna Hansen and Kimmo Lehtola (Posiva Oy)
Kalle Hollmeacuten (Poumlyry Infra Oy) Seppo Mellanen (Genpro Solutions Oy) Petriikka
Karttunen Mari Lokkila and Antti Oumlhberg (Saanio amp Riekkola Oy) and Tiina Vaittinen
(Poumlyry Environment Oy) Thank you all The author wishes to express her greatest
gratitude to the following persons for their great contribution
For mentoring in the project management Tapani Lyytinen (ELY Management Oy)
For analysing the bedrock data Jannika Gylling (Poumlyry Infra Oy) Annika Hagros
(Saanio amp Riekkola Oy) Tiina Vaittinen (Poumlyry Environment Oy)
For the grouting field tests ndash research and design Kalle Hollmeacuten (Poumlyry Infra Oy) and
Antti Oumlhberg (Saanio amp Riekkola Oy) For the grouting field tests ndash practical
arrangements Seppo Mellanen (Genpro Solutions Oy) Aimo Hiironen Kimmo Lehtola
and the crew of SK-Kaivin Oy
For the input data of the grouting material properties Reeta Ranta-Korpi (Poumlyry Infra
Oy) Johanna Hansen (Posiva Oy) and Petriikka Karttunen And for the studies
concerning hydraulics Mari Lokkila (Saanio amp Riekkola Oy)
For the discussions related to grouting and long term safety Marja Vuorio and Kari
Koskinen (Posiva Oy)
For the favourable attitude in the development work and in sponsoring of it Timo
Aumlikaumls Jukka-Pekka Salo Erkki Palonen and Johanna Hansen (Posiva Oy)
The input of the author consisted of guidance of the work presented in Chapters 3 and
43-44 52-53 The original texts which are here shortened and referred to are
published as working reports master thesis or internal memorandums The rest is
written by the author Two master thesis by K Hollmeacuten and M Lokkila were carried
out during this project
1
TABLE OF CONTENTS ABSTRACT
TIIVISTELMAuml
PREFACE AND ACKNOLEDGEMENTS
LIST OF ABBREVIATIONS 3
NAMES AND COMPOSITIONS OF GROUTS 5
1 INTRODUCTION 7
2 CONTROL OF WATER INGRESS IN ONKALO IN REGARDS OF MULTI BARRIER CONCEPT IN THE REPOSITORY 11
3 EXPERIENCES FROM ONKALO AND THE REFERENCE SITES 13 31 Rock characterisation for grouting design 13 32 Experiences of the rock characterisation for grouting purposes 15 33 Experiences of groutings 20 34 Reference sites 26
4 ENHANCED UNDERSTANDING OF GROUTING DESIGN AND EXECUTION 29 41 General 29 42 Start criteria for grouting 29 43 Stop criteria for grouting 31 44 Experiences from the field tests 39
5 OPTIMISATION OF GROUTING FOR ONKALO 57 51 Objectives for grouting 57 52 The expected hydrological conditions from the grouting point of view 57
521 Collection and selecting of data and data processing 58 522 Statistics 60 523 Expected transmissive fractures within averagely fractured rock in
the tunnels 62 524 Expected transmissive fractures within fractured zones in the
tunnels 62 53 Feasibility of the design solutions 65
531 Optimal design solution 66 532 Calculation system and studied cases 67 533 Starting values 70 534 Calculation process 71 535 Summary of the results 71 536 Additional comments on the grouting of special cases etc 76
54 Start and stop criteria to be applied 77 541 Start criteria 77
55 Stop criteria 82
6 DISCUSSION AND SYNTHESIS 85 61 Grouting design 85 62 Grouting work 90
7 CONCLUSIONS AND RECOMMENDATIONS 93
REFERENCES 97
APPENDIX 1 101
APPENDIX 2 107
2
3
LIST OF ABBREVIATIONS
b = hydraulic aperture (m)
EBS = Engineering Barrier System
EDZ = Excavation Damaged Zone
FT = field test
GTF method = ldquoGrouting Time amp Flowrdquo -method
g = gravitational acceleration (ms2)
GIN method = Grouting Intensity Number -method
GT method = ldquoGrouting Timerdquo ndashmethod also so called time stop grouting
H = depth below ground surface or groundwater table (m)
I = penetration (m)
ID = relative penetration
Imax = maximum penetration (m)
IMA = project concerning the development of low pH cementitious
grouting materials
INKE = project concerning the development of grouting technology
IPA = project concerning the long term safety of grouting
K = hydraulic conductivity (ms)
L = length measuring length (m)
Lug = Lugeon value (dm3(MPa min m))
MWD = Measure While Drilling
OFW = outflow of water (method)
OL-KR = deep drill hole
PFL = Posiva flow log (method)
PH = pilot hole
pg = grouting pressure (Pa)
PL = chainage (m)
PR = bore hole
pw = groundwater pressure (Pa)
∆p = overpressure (Pa)
Q = flow rate (m3s)
R0 = radius of groundwater flow (m)
R = radius of a hole or a tunnel (m)
RampD = research and development
RH = hydrogeological structure such as RH19 or RH20 The names vary
in different hydrological or geological models (Eg R19 HZ19)
made for different purposes
S = spacing (m)
SKB = Svensk Kaumlrnbraumlnslehantering AB
SP = subproject
SPL = superplasticizer
t = time (s)
tD = relative grouting time (dimensioless)
tg = gel induction time (s)
tmax = maximum characteristic grouting time (s)
T = transmissivity (m2s)
4
UF = Ultrafin 16 cement
V(1D) = grout intake in 1D system (channel)
V(2D) = grout intake in 2D system (planar fracture)
w = width (of the channel) (m)
WDM = water to dry material ratio
WLMint = interpreted water loss (Lug)
WLMmax = maximum water loss (Lug)
ρ = density (kgm3)
ρb = density of rock (kgm3)
μ = viscosity of water (Pas)
μg = plastic viscosity of a grout (Pas)
τ0 = yield strength of a grout (Pa)
1D = 1-dimensional
2D = 2-dimensional
3D = 3-dimensional
5
NAMES AND COMPOSITIONS OF GROUTS
Following nomenclature has been applied to the injection grouts The mix name
consists of four parts XX-YY-ZZ-QQ in which the first part XX refers to the cement
(UF = Ultrafin 16) The second part YY refers to the dry silica to the total dry material
weight ratio The third part ZZ is the water to dry material ratio (WDM) multiplied by
10 and the fourth part QQ is the superplasticizer (SPL) content expressed as weight
out of the total dry material The accelerator if used is given as weight out of the
total dry material in bracklets Other mix compositions are named likewise Cement
UF16 GroutAid silica slurry SPL Mighty150 and accelerator Nedmaq has been used as
the materials
Name of the grout Old names
of the grouts
WDM SPL
SilCem Accelerator
UF-41-14-3 P308 14 3 069 0
UF-41-14-3 (5 ) 14 3 069 5
UF-41-14-4 P308B 14 4 069 0
UF-41-14-4 (2 ) 14 4 069 2
UF-41-14-4 (5 ) 14 4 069 5
UF-41-14-48 14 48 069 0
UF-41-14-51 14 51 068 0
UF-41-12-3 P307 12 3 069 0
UF-41-12-3 (2 ) 12 3 069 2
UF-41-12-3 (5 ) 12 3 069 5
UF-41-12-36 12 36 069 0
UF-41-12-37 12 37 069 0
UF-41-12-4 P307B 12 4 069 0
UF-41-12-4 (5 ) 12 4 069 5
UF-41-12-48 12 48 069 0
UF-41-12-51 12 51 069 0
UF-41-10-3 10 3 069 0
UF-41-10-3 (2 ) 10 3 069 2
UF-41-10-3 (5 ) 10 3 069 5
UF-41-10-4 10 4 068 0
UF-41-10-4 (2 ) 10 4 068 2
UF-41-10-4 (5 ) 10 4 068 5
UF-41-10-48 10 48 069 0
UF-15-10-28 5_5 10 28 018 0
UF-15-10-28 (2 ) 10 28 018 2
UF-15-10-28 (5 ) 10 28 018 5
UF-41-08-47 08 47 069 0
6
7
1 INTRODUCTION
The Finnish nuclear waste management company Posiva Oy owned by Teollisuuden
Voima Oy and Fortum Power and Heat Oy constructs an underground rock
characterisation facility called ONKALO (Figure 1-1) in Olkiluoto Eurajoki Finland
The construction commenced in 2004 and is to be completed by the end of the year
2010 In future ONKALO is supposed to be a part of the nuclear waste facility the
repository for spent nuclear fuel By the end of the year 2007 about 2500 m of the
ONKALO access tunnel has been excavated and the ventilation (intake and exhaust)
and the personnel shafts about 180 m each have been raise bored
The investigations and the hydrogeological models made from the bedrock around
ONKALO demonstrate that essential water bearing structures need to be sealed
Otherwise excessive leakages into the tunnel can be expected (Riekkola et al 2003
Sievaumlnen amp Riekkola 2003) and too many disturbances will be foreseen in the
hydrogeological and geochemical environment (Vieno et al 2003) It was decided
before the construction that grouting will be the primary measure to control the
groundwater inflow into the tunnels The achievements and the strategy of grouting was
evaluated earlier when the major water bearing structures called RH19 at the depth
level of about -100 m were intersected (Ahokas et al 2006) The suggestion was made
to develop grouting further for better control of water ingresses
Those recommendations resulted in Posiva Oys decision to set up the R20 programme
for the years 2006 - 2008 The programme is a RampD scheme with an objective to
enhance the control of water inflow by grouting The programme shall come up with a
feasible grouting methodology which can be applied after intersecting the group of
water bearing RH20 structures at the approximate depth of -70 m
Figure 1-1 Schematic picture of ONKALO (yellow) and the deep repository
(httpwwwposivafi)
8
The R20 programme (Hansen et al 2008) consisted of three projects covering the
following areas (the project abbreviation in brackets)
1 Long term safety issues related to the controlling of water inflow (IPA)
2 Technical properties of grouting materials (IMA) and
3 Development of grouting design techniques and procedures (INKE)
This report describes the outcome of the INKE project and presents the outcome of
various subtasks as well as puts forward a suggestion for a grouting method for future
The project had an overall objective to establish a feasible and well-founded grouting
method for the construction of ONKALO The project mainly enhanced the utilization
of existing technology The requirements imposed by the long term safety should be
met without compromising ONKALOrsquos construction schedule The work aims at giving
guidelines for grouting design and work as well as for related investigations deeper in
the bedrock and the shafts to be excavated Furthermore it aims at finding out reliable
characterisation methods which can be applied in probe holes (percussion drilled holes)
for grouting purposes and recognizing the most significant factors the grouting results
may be governed by and establishing procedures functioning well between
investigations and design
The project was divided into seven subprojectssubtasks (SP) as follows
SP 1 Analysis of the grouting activities and investigations performed in ONKALO
and related to grouting
SP 2 Literature study on recent RampD in grouting focusing on the stop criteria and
experiences in demanding tunnelling conditions under high groundwater
pressures and requirements of high degree of tightness
SP 3 Preliminary study on colloidal silica including a pilot grouting test
SP 4 Study and classification of hydrogeological conditions at Olkiluoto site from the
grouting point of view
SP 5 Grouting field tests (optimised grouting)
SP 6 Small software study for grouting design or investigations related to grouting
and
SP 7 Feasibility study on grouting design solutions and a suggestion for the
application in ONKALO
The strategy how to achieve the aimed site specific high quality grouting methodology
is presented in Figure 1-2 The grouting methodology shall be based on the
requirements and the targets set on the experiences obtained from grouting works
performed in ONKALO and on the field tests performed as well as on the experiences
from the reference sites (high water pressure andor requirements for tightness against
water inflows) The rock conditions expected in the deep rock shall be taken into
account as well The optimal and practical solution fit for each rock condition
recognized will be found when grouting approach and suitable methodology is selected
information about competent materials is incorporated and the feasibility of design
solutions is judged
9
The sealing of the deep repository was excluded from the scope of the R20 programme
and the projects The IPA project together with the current design requirements
constituted the frames for grouting (total and local water inflow the volume and the
type of grout(s)) The IMA project had the task to assess the behaviour of grouting
materials and to develop several grout recipes for different circumstances and the
project was carried out in close interaction with the INKE project None of the activities
of the INKE project were governed by engineering design or by construction
procedures However all the field tests had to be performed in compliance with the
requirements in terms of quality safety and security valid for the ONKALO project
Underground facility that meets
the set targets in an optimal
high quality way
Verification of the grouting result
and development of the grouting
Execution of grouting design and
grouting work
Developed working methods Suggestion concerning the
equipment and quality control grouting in future
Feasibility of optimal design
solutions
Tools for optimising the grouting The methodology for Knowledge about grouting
grouting materials
Experiences from ONKALO and Requirements and targets set Expected rock conditions in
the reference sites for water inflow and grouting deep rock
due to the long term safety
Figure 1-2 The project strategy for the development of grouting practices The bronze
boxes are the outcomes of INKE project the light yellow are the outcomes from IPA
and IMA projects The rose boxes consist of the future outcomes
10
11
2 CONTROL OF WATER INGRESS IN ONKALO IN REGARDS OF MULTI BARRIER CONCEPT IN THE REPOSITORY
According to Riekkola et al (2003) the water inflow into underground facilities and the
subsequent water discharge may cause the detrimental flow of groundwater in the
surrounding rock mixing of different types of water and the drawdown of groundwater
table The water inflow into the excavations may cause migration of superficial waters
into the bedrock Changes in groundwater chemistry will have an impact on the
suitability of grouting materials and vice versa the grouting materials can cause
chemical disturbances in the surrounding groundwater After the closure of the deep
repository the most significant impacts are related to the inflows into the deep parts of
the underground facilities (salinity changes) the interactions between different
materials and to the decay of the buffering capacity of fracture fillings and rock in the
vicinity of disposal tunnels The upconing of saline waters from greater depths can also
be related to the drawdown of the groundwater table Rock engineering and construction
including the installation of systems will meet difficulties if big volumes of inflows
will occur The water inflow can make the installation of buffer and backfilling works
difficult
Figure 2-1 Disturbances foreseen due to groundwater inflow into ONKALO and the
deep repository and due to the use of cementitious materials (Riekkola et al 2003)
12
13
3 EXPERIENCES FROM ONKALO AND THE REFERENCE SITES
31 Rock characterisation for grouting design
About 25 of the access tunnel length is investigated with pilot holes (core drilled
holes) (Figure 3-1) Four probe holes (percussion drilled holes) are drilled
systematically about every 20 m as the tunnelling proceeds The pilot holes are typically
100 - 200 m long core drilled holes and the hole specific characterization reports are
produced in all details The characterization data is used to give a preliminary picture
eg of the need for grouting The final decision of the grouting need is done based on
information gathered from the probe holes In a few cases the design has been changed
due to the observations made in the probe holes
The characterisation methods in the probe holes
Water loss measurement (Lugeon test)
Posiva flow log and
Measurement of water out flow
The methods in the pilot holes
The water loss measurement (Lugeon test)
Posiva flow log and measurement of water out flow
Core sample loggings and
Different geophysical methods
The first stage of geological rock mass mapping can serve grouting designs interest as
well (location and orientation of leaking fractures) Eg when the hydrogeological
structure RH19 was intersected the drilling fans were designed according to the
fracturing
Lokkila (2008) has gathered information about the methods The Lugeon test is done by
sealing of the opening to a drilling hole with a packer and pumping water under a
constant pressure for a predetermined time and then measuring the volume pumped The
sequence length of the hole tested can vary In ONKALO mostly the whole length of
the probe holes has been tested and occasionally a split to shorter sections has been
done Applying altering pressures (raising and descending) the hydraulic circumstances
in the surroundings of the hole can be evaluated (Houlsby 1990)
The Posiva flow log device (Figure 3-2) has instrumentation for measuring both
difference and transverse flows (Oumlhberg amp Rouhiainen 2000 Lokkila 2008) In
difference flow measurement the differences of flow rates ie flows into or out from an
investigation hole are measured For the difference flow measurement there are two
optional modes available normal and detailed flow logging With the normal mode
hydraulic conductivities and hydraulic heads of the tested section are obtained The
detailed flow logging mode enables a rapid way to locate the leaky fractures or zones
The transverse flow equipment is used for in-situ measurements of flow rate and its
direction across a test section
14
The flow log measurements (Reiman et al 2006) were started (at chainages 15 - 372 m)
with an automatic logging device applying 10 m section length and 01 m point
interval A manual device with a single rubber disc was used at chainages 442 - 540 m
Another rubber disc was added in the manual device configuration and the measured
section length and the point interval were typically 125 m after the chainage 540
The measurement of out flowing water is also carried out when possible Measure
While Drilling (MWD) data has been tried to utilize also for grouting purposes The
software that interprets the drilling response is Rockma GMP-2 A pressure build up
(Eriksson amp Stille 2005) test has not been in use A simple borehole TV was tried to use
in very beginning of the tunnel with no success
Figure 3-1 Pilot holes OL-PH1 ONK-PH2 - ONK-PH7 between the chainages
0 - 2000
Principle of difference flow method Principle of transverse flow measurement
Figure 3-2 The principle of the Posiva flow log (Oumlhberg amp Rouhiainen 2000)
15
32 Experiences of the rock characterisation for grouting purposes
The data available for the analysis of grouting experiences was obtained from
Pilot holes OL-PH1 ONK-PH2 - 4
Probe hole data between tunnel chainages 0 - 1850 and
Grouting data between tunnel chainages 0 - 1850
Only one part of the personnel shaft was grouted and raise bored at the time the analysis
were made and thus the experiences obtained from the shafts were excluded from the
analysis
Observations on hydraulic properties in the probe holes (chainages 0 - 1505) are
presented in Figures 3-3 3-4 3-5 and 3-6 Hydraulic conductivities are based on water
outflow from the probe holes (Figure 3-3) maximum measured water losses (Figure 3-
4) interpreted water losses (Figure 3-5) and flow loggings (Figure 3-6) It can be seen
that as the excavation has advanced deeper the hydraulic conductivities determined in
the probe holes have significantly decreased ie the occurrences of the transmissive
fractures have diminished and the transmissivities of water conductive fractures have
decreased
The measurements of outflows and water losses have covered one probe hole at time
Recently occasionally the water loss is also measured with 2-packer device with 1 m
measuring section if the water loss in a probe hole has exceeded a predetermined limit
The flow log measurement can be used to distinct hydraulic fractures along a probe
hole The flow logging method was shifted from the automatic to the manual
measurement at the chainage 372 At the same point the trigger value of the outflow for
starting the measurement was changed from 30 mlmin to 500 mlmin in the holes that
are inclined upwards However that did not cause changes to probe hole measurements
since they are inside the tunnel profile and thus typically inclined downwards The holes
with the outflow less than the trigger level were considered dry for the flow logging
purposes (Reiman et al 2006)
About 13 of the probe holes have been flow logged The testing was abandoned in the
rest of the holes due to various technical difficulties andor due to dry holes The
diameter of most of the probe holes was 56 mm and the holes were typically more
bended than those of 64 mm In principle the water loss measurement can be carried out
in any probe hole However the measuring accuracy of the flow meters of water loss
measurement device tend not to meet the requirements for the start criteria of grouting
in ONKALO and the smallest transmissive fractures are difficult or impossible to
detect with the current devices
Comparisons of the results gathered with different hydraulic characterisation tools (the
data from chainages 0 - 1505) showed quite good correlations between the maximum
water loss in any probe hole of a fan (WLMmax) and the interpreted water loss (WLMint)
(correlation coefficient r = 088 or 072) and poor to moderate correlation with the flow
log (r = 043 and 028 correspondingly) The out flowing water measured at different
times correlated very variably with other observations The result obtained in the
16
correlation analysis was largely based on a very limited number of variables and was
considered somewhat unreliable The skin effect was not taken into account However
it may be one reason for differences between the different characterization tools
Hydraulic properties seem to have been slightly different in the probe holes in
comparison with the pilot holes The hydraulic conductivity measured is typically
smaller in the probe holes than in the pilot holes Possible explanations to this
phenomenon are that grouting seals fractures ahead of the excavation along gently
dipping fractures and that causes changes in groundwater flow paths and that blast
shocks may have altered the rock mechanical properties of the bedrock resulting in
decreases of hydraulic apertures of fractures
Figure 3-3 Hydraulic conductivity values (ms) measured by groundwater outflow
(OFW) in the probe holes at the chainages 0 - 1505
17
Hydraulic conductivity mslt 1E-101E-10 ndash 1E-91E-9 ndash 1E-81E-8 ndash 1E-7gt 1E-7not measured
Hydraulic conductivity mslt 1E-101E-10 ndash 1E-91E-9 ndash 1E-81E-8 ndash 1E-7gt 1E-7not measured
Hydraulic conductivity mslt 1E-101E-10 ndash 1E-91E-9 ndash 1E-81E-8 ndash 1E-7gt 1E-7not measured
Hydraulic conductivity mslt 1E-101E-10 ndash 1E-91E-9 ndash 1E-81E-8 ndash 1E-7gt 1E-7not measured
Hydraulic conductivity mslt 1E-101E-10 ndash 1E-91E-9 ndash 1E-81E-8 ndash 1E-7gt 1E-7not measured
Hydraulic conductivity mslt 1E-101E-10 ndash 1E-91E-9 ndash 1E-81E-8 ndash 1E-7gt 1E-7not measured
Figure 3-4 Hydraulic conductivity values (ms) measured by the water loss
measurement the maximum values (WLMmax) in the probe holes at the chainages
0 - 1505
Figure 3-5 Hydraulic conductivity values (ms) measured by the water loss
measurement the interpreted values (WLMint) In the probe holes at the chainages
0 - 1505
18
Hydraulic conductivity mslt 1E-101E-10 ndash 1E-91E-9 ndash 1E-81E-8 ndash 1E-7gt 1E-7not measured
Hydraulic conductivity mslt 1E-101E-10 ndash 1E-91E-9 ndash 1E-81E-8 ndash 1E-7gt 1E-7not measured
Hydraulic conductivity mslt 1E-101E-10 ndash 1E-91E-9 ndash 1E-81E-8 ndash 1E-7gt 1E-7not measured
Figure 3-6 Hydraulic conductivity values (ms) measured with the Posiva flow log
(PFL) in the probe holes at the chainages 0 - 1505
The visible leakages have been mapped four times per year (Figure 3-7) The measuring
weirs have been put in place for measuring the total inflow rate (Hansen et al 2008
Lehtinen amp Hirvonen 2007) The results have varied as the construction has proceeded
but recently a stabilising trend has been seen High occasional peaks have been caused
eg by open leaky grouting holes Major drips are concentrated at the locations of rock
bolts At the chainage 208 the average inflow has been 30 lmin at the chainage 580
106 lmin at the chainage 1255 184 lmin and at the pump station at the chainage 2285
~ 176 lmin The measured leakages have been smaller than expected However as
predicted before the construction started the inflow has significantly decreased below
the depth level -100 m (Riekkola et al 2003)
19
Figure 3-7 The water leakages mapped in the access tunnel between the chainages 0 -
1630
20
33 Experiences of groutings
The decision of grouting has been based on the amount of out flowing water the water
loss measurement and the leakage from single fractures (determined by flow log)
About 70 of the first 1000 m of the access tunnel has been grouted After intersecting
the hydrogeological structures RH19A and B the need for grouting has diminished
significantly Between the tunnel chainages 1000 - 2000 about 25 of the tunnel length
has been grouted The pre-grouting areas and the grout intakes per a hole-m and per a
fan are visualised in Figures 3-8 and 3-9
Grouting holes have been drilled outside the tunnel profile with the exception of the
shafts and one test grouting at the chainage 1880 Various drill patterns have been
applied (Table 3-1) The length of the grouting holes has been from 22 to 26 m A dense
(34 holesfan) pattern was used in the beginning The number of grouting holes was
however soon reduced first to 27 and then to 22 That turned out to be adequate to
achieve the sealing result as planned Special drilling patterns were used through the
hydrogeological structure RH19A (Ahokas et al 2006) between the chainages 916 and
980 to achieve the results wanted (Figure 3-10) The drilling pattern was changed back
to 34 holes after the chainage 1400 in order to enhance the probability to intersect water
conductive channels with grouting holes Post-grouting has been done in very few
places in order to rectify defects in pre-grouting Post-groutings have been designed on
a case by case basis
Grout mixes are based on sulphate resistant micro cement Ultrafin 16 (by Cementa AB)
except in the hydrogeological structure RH19A where also coarser Portland cement
(SR-cement by Finnsementti Oy) was used for better sealing effect Micro silica slurry
(GroutAid by Elkem) and mainly naphthalene sulphonated super plasticizer have been
used as admixtures Water to dry material ratio (in weight) has varied between 10 ndash 13
for early mixes and the ratio was reduced to 05 in the case of high grout intake Silica
to cement ratio has varied between 000 and 018 The content of superplasticizer has
typically varied between 1 and 2 in the weight of dry materials mainly depending on
the type of admixture The low pH grouts have been used in grouting tests with water
to dry material ratio 12 - 14 silica to cement ratio 069 and superplasticizer content of
4 in the weight of dry materials The total grout intake in the first 1000 m of the
access tunnel was ~ 422 m3 and between the tunnel chainages 1000 - 2000 m ~ 35 m
3
see Figure 3-11 All in all grout intake has not been very high and as the rock got less
fractured at the chainage about 550 m the grout intake and the need for grouting
diminished remarkably
The stop criteria used in grouting has been conventional Grout was pumped into the
bedrock as long as the stopping pressure was reached and the pressure was held for
5 min If the termination pressure was not reached and the grout intake had exceeded
the given limit the thicker grout mix was prepared by lowering water content in the
mix The grouting pressure during the first 2000 m has varied between 2 and 9 MPa
with a tendency to increase as the tunnel advanced deeper The grout intake limit for the
thinnest grout mix has typically been 30 lm of a grouting hole The grout intake limit
for the next thicker grout mix was 20 lm and for the last grout mix 20 lm In the
hydrogeological structures RH19A and B the grout intake was also limited Alternative
stop criteria have been studied and used in grouting tests
21
Grout take lmlt 0
0 - 55 - 10
10 - 2020 - 3030 - 4040 - 50
gt 50
Grout take lmlt 0
0 - 55 - 10
10 - 2020 - 3030 - 4040 - 50
gt 50
Grout take lmlt 0
0 - 55 - 10
10 - 2020 - 3030 - 4040 - 50
gt 50
Grout take lmlt 0
0 - 55 - 10
10 - 2020 - 3030 - 4040 - 50
gt 50
Grout take lmlt 0
0 - 55 - 10
10 - 2020 - 3030 - 4040 - 50
gt 50
Grout take lmlt 0
0 - 55 - 10
10 - 2020 - 3030 - 4040 - 50
gt 50
Figure 3-8 Grout intake lm per a grouting hole at the chainages 0 - 1525
Figure 3-9 Average grout intake lgrouting hole-m per a grouting fan at the chainages
0 - 1525
22
Table 3-1 Drilling patterns (for the usual tunnel profile) for the chainages 0 - 2000 in
the ONKALO access tunnel
Chainage Distance between holes (m) No of grouting holes fan
0 - 100 15 34
100 - 155 20 27
155 - 916 25 22
916 - 980 Customized drill patterns
980 - 1405 25 22
1405 - 1880 15 34
1880 15 17
1900 - 2000 15 34 Distance measured between the endpoints of the holes
Grouting holes inside the tunnel profile a grouting experiment
The leakage water inflow and the leakage mapping were the control measures of the
grouting results Occasionally the grouting result were controlled with control holes
which are drilled after grouting In the beginning the control holes were drilled
systematically but they were given up at the chainage ~ 120 m Currently they are
drilled eg for the shafts or grouting experiments
Grouting experiences have been analysed visually and by correlations The first 1000 m
of the access tunnel has been studied in detail A supplementary study in order to verify
the results and study the weird observations in more details covered also the data at the
chainages 1000 - 1850
The assessments of the first 1000 m of the access tunnel showed that the remained water
leakage after grouting is not as much correlated to geological features as to singular
fractures and rock bolts The major leaks seem to match fairly well with fan beginnings
and ends The bolts that extend beyond the grout curtain probably cause the leaks
Minor leaks remaining indicated also that leakages were distributed quite evenly along
the first 1000 m although geological and hydrological circumstances have varied a lot
This indicates that the remaining leakages are due to the used grouting material
(cement-based grouts) and technique (stop criterion) The sealing efficiency determined
by using control holes (thus calculated only for a few fans) was typically good out of
12 areas 9 showed a sealing efficiency of over 99 Only one place gave a poor result
with a sealing efficiency of 60 The sealing efficiency is the initial transmissivity
(probe hole result) minus the end transmissivity (from control holes) divided with the
initial transmissivity and it is usually given in percentage The sealing efficiency is not
used as an acceptance criterion in ONKALO
23
Grouting fans 960 ndash 956 ndash 940 ndash 935 ndash 921 ndash 916 - 905
935
916
905
921
940
956
960
Grouting fans 960 ndash 956 ndash 940 ndash 935 ndash 921 ndash 916 - 905
935
916
905
921
940
956
960
Grout take lmlt 0
0 - 55 - 10
10 - 2020 - 3030 - 4040 - 50
gt 50
Grout take lmlt 0
0 - 55 - 10
10 - 2020 - 3030 - 4040 - 50
gt 50
Figure 3-10 The grouting of the hydrogeological structure RH19A (the geometry of the
RH19A Ahokas et al 2006) The structure was grouted with coarse cement based
grout in the chainages 916 935 and 956 After the grouting of the structure the smaller
fractures were grouted with microcement at the chainages 905 921 940 and 960
24
Grout take (dm3) in ONKALO access tunnel 0-2000 m
0
5000
10000
15000
20000
25000
0 71 145
253
342
446
540
580
644
730
855
915
956
1025
1076
1162
1232
1340
1466
1586
1701
1815
1920
Tunnel chainage (m)
Gro
ut
take (
dm
3)
Pre-grouting
Post-grouting
Figure 3-11 Grout intake per a fan (dm3) both pre- and post-grouting for the first
2000 m of the ONKALO access tunnel
In the first 1000 m three areas of the largest grout intake coincide with the brittle fault
intersections around the chainages 330 and 500 (450 l penetrated into a drill hole) and
with a ductile shear intersection approximately at the chainage 450 There seemed to
have been a poor correlation between the grout intake and rock mass quality The three
areas with a poor or a very poor Q index showed moderate grout intake and the areas
with high grout intake were situated in good quality rock The number of fractures
seemed not to be connected to the grout intake One possible explanation to this is that
grouting seals fractures ahead of the excavation along gently dipping fractures another
reason for these may have been that in densely fractured rock the fractures were more
likely clogged by joint fillings and thus hinder grout penetration The third possible
explanation is that in densely fractured rock the fractures are shorter and narrower than
in sparsely fractured rock Based on the ONKALO fracture mapping data the
orientation of visible fractures with grout mass infilling was compared with all fracture
observations There is clear difference in the dip values between the fracture groups
The fractures with grouting mass infilling are more often gently dipping whereas all the
fractures are more often steeply dipping
Within the first 1000 m of the tunnel it was observed that in 13 of the grouting holes
the grout intake was high and in 43 of the holes the grout intake was less or as much
as the hole volume (Figure 3-12) As the tunnel has gone deeper less and less of
groutable holes have been encountered That indicates either invalid stop criteria that
ignored the existence of tight holes andor the water conducting channels are far apart
and therefore difficult to hit
25
43
68 73
77 81
85 90
99 100
0
100
200
300
400
500
600
0 5 10 20 30 40 50 100 More
Grout take (dm3m)
Nr
of observ
atio
ns
0
20
40
60
80
100
120
Figure 3-12 The distribution of the grout intake in the grouting holes (ch 0 - 1000)
The results obtained from rock characterisation are the basis for deciding grouting need
and design For this purposes the data at chainage 0 - 1850 was analysed Based on the
correlation coefficients obtained the determination of the maximum water loss value
was selected as the investigation method that is most capable to predict the grout intake
The correlation between the WLMmax values and the grout intake is 055 or 065
depending on whether the sum of the values from the four probe holes or the maximum
value in any probe hole will be taken into account This correlation is not considered
very high and the other investigation methods seemed to be even less correlated with
the grout intake However the data from eg flow loggings was very limited to draw
valid conclusions about the method and the measuring accuracy in water loss
measurement is relatively high compared to the start criteria of grouting Also the
correlation analysis was considered not to be useful enough as a tool for the assessment
of this type of data From the same data the predictive capacity of the different
investigation methods was briefly studied by examining zero and non-zero values in the
data set taking also into account the post-groutings and remaining water leakages The
water loss measurements predicted the need for grouting very well and the flow logging
related measurements also quite well However it has to be remembered that the
measuring limit of the flow log is very close to the start criteria for grouting ie this
conclusion is more or less trivial One thing that makes a difference between the flow
log method and the water loss method is that no overpressure is used in the first
mentioned
In general the Lugeon test related measurements appeared to produce more useful
results than the flow logging related measurements which showed only a poor
correlation with the grout intake although they were almost as good as the Lugeon
measurements in predicting the tunnel sections where grouting would have been
needed The determination of the maximum water loss value was the most useful
method both in terms of correlation with the grout intake and in predicting the tunnel
sections where grouting would not have been needed The water loss tests would
26
become more useful if a higher pressure was applied The pressure should be in the
same order of magnitude with the grouting pressure used in pre-grouting and the test
device should measure very small water flows
The comparisons were run between reliable flow logging data sets and corresponding
MWD (measure while drilling) data sets gathered No correlation was found The
algorithms in Rockma software should have been at least calibrated However it is still
uncertain whether the MWD data can be used for purposes of grouting design and
planning in ONKALO where high hydraulic head and tight fractures prevail
34 Reference sites
The experiences from reference sites were gathered by Hollmeacuten (2007) and the key
information has been compiled in the Tables 3-2 and 3-3 below More detailed
information can be found in Hollmeacuten (2007) The reference sites were selected to
represent either deep rock conditions or strict requirements for water inflows The
grouting experiences under high groundwater pressure exist but the problem was a poor
reporting of the experiences gained
In an addition to the reference sites presented in Tables 3-2 and 3-3 Hollmeacuten (2007)
found brief information form three other Norwegian tunnels including the Aringkrafjord
tunnel with the overburden of 600 m At a time of the commencement of systematic
post-grouting was started the water pressure was about 46 MPa and total amount of the
ingress was in a range of 3 - 5 m3min per a geological zone In that tunnel the final
leakage was 10 dm3min100 m which was regarded satisfactory The Eiksund traffic
tunnel is the worldrsquos deepest sub sea tunnel (the completion due in February 2008) The
tunnel is nearly 8 km long and dives to almost 300 m beneath the fjord surface The
acceptable water inflow into the tunnel was set less than 30 dm3min100 m The
decision of grouting is based on systematically drilled probe holes Grouting pressures
up to 10 MPa are used In the shallow located Bekkestua tunnel the limit of water
ingress into the tunnel was set as a maximum 2 dm3min100 m of tunnel The used
cement (Portland cement or micro grained Portland cement) was selected according to
the observed leakage from holes Large volumes of grout were used The leakage was
reduced to about 07 dm3min100 m of tunnel Portland cement based grout was used
only within the most leaking areas where the rates got up to 17 dm3min100 m of
tunnel
Essential new hints or ideas that could be used in ONKALO were not found in this
literatury study However the study confirmed that water leakages can be handled The
challenge in the case of ONKALO is the design requirements which are somewhat
contradictory
27
Table 3-2 The grouting summary in some tunnel projects (Hollmeacuten 2007)
Tunnel project Bragernes Norway Lunner (oslashst) Norway
Year completed 2001 2003
Purpose of tunnel traffic traffic
Overburden 10 - 150 m 10 - 300 m
Total length 2310 m 3800 m
Requirement water inflow 10 - 30 dm
3min100 m of
tunnel 10 - 20 dm
3min100 m of
tunnel
Grouting strategy systematic pre-grouting systematic pre-grouting
Drill hole quantity 057 mm2 (1
126 mm2 (1
Grouting material Standard cement with micro silica (Rapid Rp 38) from Norcem
Standard cement and Ultrafin 12 from Scancem
Additives Rescon HP 2-3 Grout Aid 5-23 SP40 2-3
WC ratio 10 - 05 20 - 05
Pumping pressure 2 - 9 MPa 5 - 7 MPa
Mass quantity 81 kgborehole-m 30 kgborehole-m
Results of grouting (water inflow)
101 dm3min100 m 84 dm
3min100 m
(1 m
2 tunnel is the entire tunnel circumference multiplied with the total tunnel length
Table 3-3 The grouting summary in two tunnel projects (Hollmeacuten 2007)
Tunnel project Baneheia Norway Lundby Sweden
Year completed 2001 1998
Purpose of tunnel traffic traffic
Overburden 20 - 40 m 5 - 35 m
Total length 3000 m 2060 m
Requirement for tightness 60 dm3min total
05 - 25 dm3min100m of
tunnel
Grouting strategy systematic pre-grouting systematic pre-grouting (continuous)
Drill hole quantity 108 mm2 (1
200 mm2 (1
Grouting material Ultrafin 12 from Scancem Grouting cement from Cementa
Additives Grout Aid 5 - 15 SP40 2 Bentonite 3 Intraplaster 05
WC ratio 09 - 07 30 - 05 (03 hole filling)
Pumping pressure 5 - 8 MPa 25 MPa
Mass quantity 9 kghole-m 6 kghole-m
Results of grouting (water inflow)
18 dm3min100 m 09 dm
3min100 m
(1 m
2 tunnel is the entire tunnel circumference multiplied with the total tunnel length
28
29
4 ENHANCED UNDERSTANDING OF GROUTING DESIGN AND EXECUTION
41 General
Common steps in grouting design are
1 Set the functional requirements targets for a tunnel
2 Analyse the data available of water conductive geological features
3 Set the limit for maximum water inflow
4 Establish the start criteria for grouting
5 Engineer the drilling patterns grout mixes and the stop criteria for grouting
6 Specify the other requirements for work including the verification of the grouting
result and quality control and
7 Specify the requirements for documentation and document control
Some of the above mentioned points are emphasised more than the others in this work
Posiva sets targets for water inflow and the grouting (grout type and grout quantity) and
thus they are not evaluated further The available information from drill holes in
ONKALO area was studied from the grouting point of view The start and stop criteria
are paid much attention to since they are important but poorly understood parts of the
grouting design The design of drilling patterns grout mixes and work specifications are
customary design work but they should not be treated separately from the start and stop
criteria
The national and international standards and norms do not guide the optimisation work
sufficiently The national norm (Concrete Association of Finland 2006) does not give
the guidelines for eg
1 Setting the grouting start criteria for the different characterisation methods
2 The quality control tests needed for determination of the mix properties required in
the design
3 Selectingdesigning the mixes for the different rock conditions
4 Grouting in the deep rock (including the guidelines for the water loss measurement
and the grouting pressures) and
5 The design work (to involve the pumping time to other design parameters)
These subjects are paid an attention to in this work
Some items mentioned above are discussed here from the theoretical point of view The
suggestion of application in ONKALO is presented later in this work (Chapters 5-7)
42 Start criteria for grouting
The criteria when grouting is started are important part of controlling groundwater Low
trigger value for grouting means low water leakages but possibly results in much of
grouting and grouting holes which is not always desirable On the other hand high
trigger level may be desirable from the point of view of grout intake or number of
30
grouting holes but not from the remaining water leakages (long term safety aspects)
Practically the start criteria mean a selection of a suitable characterisation method or a
combination of those and derived quantitative trigger levels It is important that the
start criterion is based on the information that can be accurately measured
The flow log measurement water loss measurement and measuring out flowing water
are complementary methods to characterize the probe holes in ONKALO In order to
select one or several methods both the suitability and reliability of the method(s) and the
priority of the grouting objectives should be taken into account while making a choice
between the characterization methods or a combination of them However those
methods tell nothing about fracture orientation or eg the channelling of the flow
If having several methods in use for example due to the reasons of a) complement the
picture of rock and b) verify the availability of the result the start criterion set for
different methods should be linked between each other Below the chain from flow rate
to hydraulic aperture is presented (flow rate gt the transmissivity of a fracture or a
fracture zone (Eq 4-1) gt Lugeon value (Eq 4-3) or hydraulic aperture (Eq 4-4))
Q = the flow rate (m3s) eg from a probe or grouting hole or eg the tunnel
Here Q is the starting point since in the case of ONKALO the trigger level is set based
on that parameter Based on the flow the transmissivity of a geological feature can be
determined as follows
H
RR
Q
T2
ln 0
(4-1)
where T is the transmissivity of a fracturezone (m2s) H = groundwater pressure
expressed as a height of water coloum depth (m) R0 = the radius of the flow (m) (in
flow loggings 14 m is used and in tunnel scale typically 2H is used) and R = the radius
of a hole or a tunnel (m) The transmissivity is connected to the hydraulic conductivity
K (ms) with the following equation
T = KL (4-2)
in which L is the length of the measuring section or the thickness of a geological
formation or in the case of tunnelling the length of a measuring section (m) The
hydraulic conductivity can be transformed as a Lugeon value with the following
relationship (Bergman amp Nord 1982)
1 Lug ~ 17E-7 ms
This relationship varies in different references Eriksson amp Stille (2005) Houlsby
(1990) and Concrete Association of Finland (2006) present relationships 1 Lug ~ 13E-7
ms - 16E-7 ms The connection between the hydraulic conductivity and the Lugeon
value is observed to vary also with depth (Bergman amp Nord 1982)
31
The Lugeon value itself is determined as follows
tpL
QLug
Lug (4-3)
Where QLug = water loss (dm3) L = the length of a measuring section (m) ∆p = the
overpressure (MPa) and t = measuring time (min) The use of water loss data and the
interpretation of the results are handled by Houlsby (1990) When measuring with
several pressures the interpretation of the results is important part of determining the
correct Lugeon value
Since hydraulic apertures are interesting from the grouting point of view finally the
connection between the hydraulic aperture b and the transmissivity of a fracture is as
follows
312
g
Tb (4-4)
where b = hydraulic aperture (m) μ = the viscosity of water (Pas) and ρ = the density of
water (kgm3)
43 Stop criteria for grouting
General
A stop criterion means a point when grouting designer or grouter can be enough
convinced that the aimed sealing result is reached and the targets are met Practically it
is impossible to verify the grouting result during grouting and therefore different stop
criteria have been developed The importance of the stop criterion enhances as the
targets get stricter or optimisation between water leakages and grout take should be
done
Various stop criteria
Grouting practices and the stop criteria were studied (Hollmeacuten 2007) as a literature
study in order to find out the most suitable approach A literature study brought up the
following ways to set the stop criterion
1 Setting the maximum pressure and the grouted volume
2 Grouting intensity number (GIN) ndashprinciple and
3 Time stop criterion
Traditionally the limits for grouting are defined by two stop criteria the highest
allowable grouting pressure andor the highest allowable grout intake Grouting is
stopped after a few minutes the grouting pressure has been stabilised at the set
maximum level Often there are also limitations eg for the maximum grout intake or
the grout flow This kind of stop criteria is empirical but widely used in conventional
32
tunnelling This approach which complies with the national norm (Concrete
Association of Finland 2006) has been used in ONKALO where adequate limits for
the grouting pressure is set based on the rules for grouting pressures (the smallest
fracture to be grouted and the aimed penetration length determined according to
Concrete Association of Finland (2006) and the limits for grout intake based on the
experiences obtained during tunnelling
Another stop criteria typically used in dam grouting is developed by Lombardi and
Deere (1993) and Lombardi (1997) and further studied for tunnelling purposes eg by
Brantberger (2000) The short overview is done and presented by Hollmeacuten (2007) This
so called Grouting Intensity Number (GIN method) defines the limiting curve by three
parameters the maximum pressure the maximum grouted volume and the empirically
selected GIN value The idea of the method is to reduce the risk of hydro fracturing In
practice when the volume of injected grout is low higher pressures can be used And
when the volume of grout injected is high the pressure should be lower Any
combination of the grout pressure and the grout intake can be used as long as their
product falls under the selected GIN curve Grouting is to be stopped when the pressure
rises above the selected maximum limit the grout intake rises above the selected
maximum limit or the product of the grout intake and the pressure rises above the
selected GIN value According to Hollmeacuten (2007) the problem of the GIN value is that
it cannot be explicitly solved Based on the literature study (Hollmeacuten 2007) the GIN
method has been used only once in tunnelling in the Goumlta Tunnel in Sweden Even
though the GIN value was very low most of the performed groutings were stopped to
the maximum pressure or to the maximum volume
The third way to set the stop criteria Hollmeacuten (2007) found is an analytical approach
also called the time stop grouting The model is developed by Chalmers University of
Technology (CTH) and Royal University of Technology (KTH) in Sweden (Gustafson
amp Stille 2005) In this approach the distance between grouting holes the grouting
pressure the fracture openings and the rheological properties of grout are linked with
each other A desired penetration length from the grouting hole in the smallest fracture
to be sealed is to be determined Then the time the grout (with certain rheological
properties) is to be pumped into the rock under the predetermined pressure can be
calculated Or another way around the desired grouting time can be set and the required
grout and the grouting pressure will be adjusted The approach has a complicated
physical background and the implementation requires simplifications and
approximations
In principle this is the only method to link the fracture and the grout properties to the
pumping pressure and the time and thus the design can be continuously presented As
the drawbacks there is very limited practical experience the method is sensitive to eg
the fracture characteristics available (fracture apertures) and to the rheological
properties of the grout Also it is an advantage to know whether the grout flow is one-
dimensional (channel-like) or two-dimensional (a planar fracture or a fracture with a
varying aperture) According to Hollmeacuten (2007) the stop criteria based on the analysis
of the grout penetration is not easy one to use when fracture system is complicated but
may be usable when fracture system is simple The criterion is also difficult to use if
the information about fracture characteristics is unreliable Therefore further
33
development of the time stop criterion is needed since exact characterization at the site
is very difficult
The stop criteria presented are compared in Table 4-1 Among the alternative
approaches the time stop criterion seems to be the most reasonable tool for grouting
design work in ONKALO because optimisation should be done However the
approach does not comply with the national building codes for the grouting
Table 4-1 Comparison of different grouting stop criteria (modified and complemented
from Hollmeacuten 2007)
Stop criterion
criteria Pros and cons Suitability
Prevailing practice = max pressure and max volume
Empirically set maximum volume and maximum pressure
+ Method is widely used Much reference sites in general + Results are sometimes good enough -Poor economy It is possible that grout injection takes more time and grout than is needed On the contrary high pressure and high grout intake do not guarantee sealing result good enough - empirical not a tool for optimisation - not much reference sites with very low inflow target
In principle for every tunnel depends mainly on the investments on grouting and skills of the grouting designer
GIN-method
Maximum volume maximum pressure and selected GIN-value
+ Fast grouting cycle (no hydrogeological characterisation recommended needed) - empirical not a tool for optimisation - experiences only once in tunnelling (Goumlta Tunnel) - no rules how to solve exact definition of the GIN-value Eg the method is empirical - not useable when the joints are very tight
Originally for dam grouting not for deep tunnels There is a possibility that method is workable in variable type of rock mass
Time stop criterion (Grouting Time ndashmethod)
Grouting time (t) for each combination of desired penetration length grout characteristics and allowable grouting pressure
+ Gives analytical method to study grout penetration with relation to stop criterion + Good economy The minimum grouting time can be calculated The grouting can be optimised - Limited practical experience which means that the grouting practises should be further developed -Sensitive to fracture characteristics and grout properties which are not easy to handle in tunnel conditions
In tunnels where sealing result is important and possibly at the same time grout intake is critical which means that investments on grouting are reasonable Further development needed Requires competent designer in fields of grouting geology and hydrogeology
34
Time stop criterion
The relationship between grout properties grouting pressure grout penetration length
and grouting time with cement based grouts
The approach is presented by Gustafson amp Stille (1995) and in the literatury study by
Hollmeacuten (2007)
For a certain grout there is a maximum penetration distance (Imax) at steady state into a
fracture (Haumlssler 1991 Gustafson amp Stille 1996)
0
max2
)( bppI
wg (4-5)
where pg = grouting pressure (Pa) wb pgH 23 (Gustafson 2005 Concrete
Association of Finland 2006) pw = groundwater pressure (Pa) b = the hydraulic
aperture of fracture (m) τ0 = the yield strength of grout (Pa) ρb = the density of rock
(kgm3) g = gravitational acceleration (ms
2 ) and H = depth below ground surface (m)
The equation for the maximum grout penetration (Haumlssler 1991) forms the basis for
analytical approximations for the grout penetration
Correspondingly there is a timescale given as the characteristic grouting time
(Gustafson amp Claesson 2004)
2
0
0
6 gpt (4-6)
Where t0= characteristic grouting time (s) μg= the plastic viscosity of grout (Pas) ∆pg =
grouting overpressure = pg ndash pw (Pa) and τ0 = the yield strength of grout (Pa)
The maximum penetration length and the characteristic grouting time are thought to be
linked together (see Figure 4-1) even though they do not describe exactly the same
point of time However based on this starting point the time t (s) needed for pumping
grout (μg τ0) into a fracture with hydraulic aperture b (m) can be determined as the
desired penetration length I (m) according to the theories presented by Gustafson amp
Stille (2005) Gustafson amp Claesson (2004) In order to determine t relative penetration
length ID and relative penetration time tD are to be determined The key parameters used
in time stop criterion -approach are illustrated in Figure 4-1
Illustration of the parameters in 1 D Illustration of the parameters in 2 D
Figure 4-1 An illustration of the key parameters in the time stop grouting -approach The explanations of the parameters can be found in the
text 1D and 2D refers to the dimension of flow
35
36
The relative penetration ID (s) is calculated with the help of the desired and the
maximum penetration lengths The relative penetration length is the same in all
fractures cut by a borehole (Gustafson amp Stille 2005)
maxI
II D (4-7)
The corresponding relative grouting time (tD) is presented for one-dimensional (1D)
case which presents a flow channel and for two-dimensional (2D) case which presents
a planar fracture The determination of the relative grouting time and the
approximations for the relative time for the 1D and 2D cases are (developed by
Gustafson amp Stille 2005 a typing error corrected by Hollmen 2007)
0t
ttD (4-8)
21
21)1( DDt (4-9)
21
6)2( DDt (4-10)
Where t = the grouting time (s) to reach the point I and
D
D
I
I
24
2
(-) (4-11)
By selecting the dimensionality of the case the time for a certain grout to reach the
desired penetration in a fracture can be calculated
In order to prevent a possible backflow the ratio of water pressure (pw) and the excess
pressure (Δp) should be smaller than the relative penetration length (ID) (Fransson amp
Gustafson 2007 Axelsson 2006)
By varying the grout (its penetration ability and rheological properties) the grouting
pressure and the drilling pattern the optimal grouting for different rock conditions can
be designed According to this principle the stopping of the grouting can be controlled
via the pumping time
Relationship between grout properties grouting pressure grout penetration length and
grouting time with colloidal silica
Colloidal silica (also silica sol) is a Newtonian fluid and in order to control the spread of
it it is important to link the desired penetration length with the gelling time that is
controlled by the dosage of an accelerator in a mix The theory of the grouting with
37
colloidal silica is presented by Funehag (2007) A short overview is collected also by
Lokkila (2008)
The complicated mathematics can be transformed to a simple form and the basic tools
for designing the silica grouting lies on the equations for the penetration length in the
1D and 2D cases
0
1max6
g
D
ptbI (4-12)
DDII 1max2max 450 (4-13)
Where b = hydraulic aperture (m) ∆p = overpressure (Pa) tg = the gel induction time (s)
and μg= the initial viscosity of a grout (Pas) The gel induction time means the point of
time at which the viscosity of colloidal silica has doubled
The maximum penetration length is achieved in the time equal to 15 tg and further
pumping does not result in any further penetration The minimum pumping time should
then be half of the gel time which is characteristic for each silica sol recipe and for each
temperature
As the desired penetration length together with suitable drilling pattern are selected in
certain fracture environment and temperature the adequate grouting time is determined
and based on it the suitable gelling time and thus the dosage of an accelerator are
selected
Grout intake
Gustafson and Stille (2005) have presented the equations to estimate grout volumes in
1D and 2D cases In principle the grouted volume can be used as a stop criterion as
well Also with the help of the penetration time the grout flow is predictable in
principle
The volume of a grout in a fracture is
IwbV D)1( (4-14)
bIV D
2
)2( (4-15)
Where V(1D) (m3) refers to the grout intake in 1D system (a channel) and V(2D) (m
3) to
the grout intake in 2D system (planar fracture) and w = the width of a 1D channel The
maximum grouted volumes can be calculated in similar ways by using Imax instead of I
38
If having a multiple fracture system the grouted volume in each of the fractures and
thus in the whole fracture system can be calculated by using relative grouted volumes
VD (-)
)1()1( DD DD IV (4-16)
2
)2()2( DD DD IV (4-17)
For the number of fractures the theoretical total volume is then
)1()1()1( max DDDVVV Dtot
(4-18)
)2()2()2( max DDDVVV Dtot
(4-19)
Uncertainties in time stop criterion
Like any other method the time stop criterion is sensible to a certain source data and
this causes uncertainties The aperture varies a lot in a single fracture even though the
transmissivity (hydraulic aperture) is studied to be able to describe the groutable
aperture well (Fransson 2001) However it is practically impossible to find a
representative hydraulic aperture with a few boreholes Discussion on the conceptual
understanding of fracture characteristics ndash especially the nature of the fracture aperture
ndash and its role as an uncertain factor are available in the reports by Hakami (1995)
Sievaumlnen (2002) and Lokkila (2008) The rheological properties of a grout have natural
variation due to the variation of cement qualities the measuring methods and also the
reological parameters yield strength and viscosity are interpreted with a models with
more or less confidence The rheological properties of grouts also vary with the time
Also the prevailing overpressure in a fracture always differs more or less from that one
readable at the grouting equipment
In order to understand the most important factors affecting the penetration length of a
grout a sensitivity analysis was done by Lokkila (2008) The analysis was carried out
by selecting the start values for each parameter and varying them one by one The
values for the parameters were selected among the observed properties and the expected
conditions
According to the results of Lokkila (2008) the factor that has the most significant effect
on the penetration length is the hydraulic aperture of a fracture The yield value and the
viscosity of a grout as well as the grouting overpressure also have a notable effect The
system is very sensible to these factors and due to this reason the focus should be
concentrated in the supply of accurate characterisation data the quality control of grout
mixes and careful follow up of the design during the grouting work On the contrary the
system is not that sensible to the pumping time of the grout ndash especially as the grouting
proceeds This should be understood so that relatively high increase in pumping time is
needed in order to increase the penetration length quite a little especially in small
fractures
39
44 Experiences from the field tests
Three grouting tests were performed in ONKALO during the year 2007 The first
grouting test was performed in the ONKALO access tunnel with cement-based low pH
grout The second grouting test was carried out in the personnel shaft 1 This test was
divided into three stages and the low pH grouts were used The third grouting test was a
pilot test with colloidal silica
From now on the method presented by Gustafson amp Stille (2005) is also called
Grouting Time ndashmethod as it was named during the grouting tests
Test grouting in the access tunnel at the chainage 1880
The intention of the first grouting test was to practice the use of the time stop criterion
together with the grouting holes inside the tunnel profile The used grout was cement-
based low pH grout UF-41-14-4 The progress of the field test is reported in detail by
Hollmeacuten (2007) and the grout related tests by Ranta-Korpi et al (2007) The mix
properties are collected to the Appendices 1 and 2 The mix compositions are presented
in ldquoNames and compositions of groutsrdquo
The test site (Figure 4-2) was at the tunnel chainage interval from 1880 to 1906 in
ONKALO The overburden in the test site is ~190 m
Four 26 m long probe holes were drilled and studied (Hollmeacuten 2007) All of the probe
holes were almost dry but the water loss measurement (pressures 22 - 26 - 29 - 26 -
22 MPa) showed a slight water intake The flow logging did not succeed because the
leakage was too small The hydraulic aperture of the fractures was estimated based on
the water loss measurement results and with the assumption of fracture numbers (two)
detected in the pilot hole ONK-PH7 Based on the obtained characterization results the
preliminary impression was that there are two fractures with an aperture of ~30 microm
Figure 4-2 The test sites of the grouting tests in ONKALO in 2007 (Hollmeacuten 2007)
Test site (FT2)
Test site (FT1)
40
In order to study the GT method (time stop criterion) the intention was to design the
grouting to be fully optimised without any safety factors The grouting holes were
located inside the tunnel profile because it is one way to diminish the grout remaining
in rock after excavation
The grouting fan included 17 grouting holes (Oslash 54 mm) and every hole was about 26 m
long (Hollmeacuten 2007) The distance between them was 15 m and all were parallel with
the tunnel and inside the theoretical tunnel profile The flow logging and the water loss
measurement were done in all grouting holes The latter showed connections between a
few grouting holes Because the flow logging didnrsquot give any results the hydraulic
apertures of the fractures were again estimated from the water losses Again the number
of fractures (2 fractures) was estimated with the supposition from the pilot hole ONK-
PH7 and the calculated hydraulic apertures were similar varying between 12 - 30
microns
The test was carried out with Posivarsquos new grouting equipment of which the
components are made by Haumlny Figure 4-3 The equipment was in use in the tunnel for
the first time
There were no results of the mix UF-41-14-4 from the field using Posivaacutes new grouting
equipment Thus the material parameters of the grout were based on the rheology
measurements done in the laboratory
The intended grout penetration was 30 m outside the tunnel profile which means that
the penetrations of 32 - 38 m were needed (Hollmeacuten 2007) The grouting pressure of 8
MPa was the lowest to reach the desired penetration in reasonable grouting time
Because the fractures were very small and channelling like flow was assumed the
fracture system was assumed to be 1D and the grouting times for all single holes were
calculated using the GT method Against the theory the maximum grouting time (tmax)
was limited to 25 min even though the maximum calculated grouting times in some
holes were 40 min Also the stop criterion based on the minimum flow (0 l per 2 min)
was set ndash against the theory
41
Figure 4-3 Posivarsquos new grouting equipment (the mixers agitators and pumps made by
Haumlny) was used in the test (photograph by Kalle Hollmeacuten)
Unexpectedly the grout leaked from nearly all of the roof holes and finally from the
drift The total grout intake in the fan was 1402 dm3 out of which 744 were pumped
into three holes The total grout intake is almost the same than the volume of the
grouting holes and the pilot hole which was assumed to be fully or partly filled During
the grouting there were more connections between the holes than the water loss
measurement indicated There could be several reasons for the grout leaking but the
main reason is probably that on blasting round 1876 - 1880 the excavation damaged
zone (EDZ) extended longer to the rock mass than the packers (10 m) extended due to
the repair blasting Another reason for the grout leakage could be that the rock andor
the grout properties were inaccurate (Hollmeacuten 2007)
The grout properties used in the design were reviewed based on the field measurements
after the field test 1 and the results showed that the values (Ranta-korpi et al 2007
appendices 1 and 2) used in the design were more or less invalid The back calculation
was done by calculating the real viscosity of the grout with the help of the Marsh-funnel
results the stick results and the diagram by Haringkansson (1993) The quick outflow from
nearby grouting holes supported the idea obtained from the observed mix results These
observations showed that it is necessary to check the grout parameters at the site with
real grout mixer not only in the laboratory
Eight control holes were drilled in order to study the grouting result All of the control
holes (extended about 3 m out of the tunnel profile) were dry and one hole showed
42
water loss However the exact penetration length of the grout remains unknown since
the actual orientation of the fracture(s) was unknown Based on the leakage water
mapping the tunnel section was dry and the grouting seemed successful
Test grouting in the personnel shaft 1
The field test 2 was arranged in the ONKALOrsquos personnel shaft 1 from the depth level
-80 m to the level -110 m (Figure 4-2) The grouted area in the shaft was ca -86 -
-110 m (24 m long) and the radius of the shaft was 2 m The progress of the field test is
reported in detail by Hollmeacuten (2007) and the grout related tests by Ranta-Korpi et al
(2007) As more knowledge about the grouting material characteristics was available
they were taken into account in the calculations The mix properties are collected to the
Appendices 1 and 2
Again in order to study the GT method the intention was to design the grouting to be
fully optimised without any safety factors The grouting was done using Posivarsquos
grouting equipment (Figure 4-3)
The grouting was done in three stages in the first and the second rounds three grouting
holes per round were grouted and six holes were grouted in the third round (Hollmeacuten
2007) The second roundrsquos grouting holes were the control holes for the first round and
the grouting holes of the third round were the control holes for the second round
All grouting holes were vertical and they were inside the shaft profile because the
grouting holes outside the shaft profile are not accepted in ONKALO The holes were
core drilled The rock mass was characterized using the water loss test (single packer
and double packer with separation of 1 m) and the flow logging ndashtool Also deviation
measurements were done for the grouting holes
The low pH grouts were used and the recipes were selected separately for every
grouting in order to find an optimal solution (Hollmeacuten 2007) The design approach was
the time stop criterion and it was expected that the dimension of the flow would be 2D
The grouting pressures were set less than the limits possibly leading to the uplifting
which means that the maximum pressures should be less than 65 MPa The target grout
penetrations were 28 m 35 m and 40 m depending on the stage and the hole location
(Figure 4-4) The penetration lengths were selected in a way that a minimum coverage
of the grouting was aimed and no safety factors were used This was done due to
practicing the optimization and testing the method
43
Figure 4-4 The grouting hole locations and the grouting sequencing Sequence 1 the
holes no 86 - 88 Seq 2 the holes no 89 - 91 Seq 3 the holes no 92 - 98 The shaft
radius R is 2 m and the hole spacing is ~ 1 m In total 12 grouting holes were designed
and grouted (Hollmeacuten 2007)
The aim of the grouting in the first stage was to seal the largest fractures (Figure 4-5 a)
(Hollmeacuten 2007) In the hole no 86 the aim was to seal the fractures with apertures of
47 microm or larger and in the holes no 87 and 88 the fractures with the apertures of 24 microm
or larger Because all the holes were grouted at the same time the idea was to find the
same grouting time and the pressure in every hole by using different mixes if needed It
was designed that the grout UF-41-12-51 (τ0 asymp 888 Pa microg asymp 146 mPas) will be used to
the hole no 86 and the grout UF-41-14-51 (τ0 asymp 52 Pa microg asymp 103 mPas) to the holes no
87 and 88 The design window in this grouting stage is presented in Figure 4-6 After
the calculations the grouting time (2D model) was set to be 30 min and the grouting
pressure 45 MPa which means the overpressure of ca 35 MPa The calculated times
and pressures were the same in all holes
The hydraulic packers were set to the depth of 6 meters from the beginning of the holes
First the holes were filled with the grout (20 - 30 min) After that the pressure was
raised to the target level at the same time in every hole
The quality control tests for the first grout mix (UF-41-12-51) showed too low Marsh-
values therefore that mix was rejected and a new grout batch was mixed Because the
Marsh value was again too low the grout recipe was changed to the grout UF-41-12-36
44
(τ0 asymp 157 Pa microg asymp 251 mPas) which passed the quality control tests No changes to the
grouting times were done
The total grout intake was 1172 l out of which the proportion of the grouting holes was
328 l According to the dimensionality analysis the grout flow was one- two- and three-
dimensional during the grouting
After the grouting of the first stage the grouting holes of the second stage were drilled
and via them the result of the earlier grouting was studied The results of the flow
logging showed numerous fractures in the holes and the largest fracture aperture was
75 microm However the proportion of the larger fractures (gt 40 - 50 microm) was decreased
(Figure 4-5 b)
The grouting of the next rounds was designed and executed with the similar principle
(Hollmeacuten 2007) The grout for the next grouting round was UF-41-12-48 (τ0 asymp 888 Pa
microg asymp 1447 mPas) which was used in every hole (Ranta-korpi et al 2007) The aim of
the grouting in the second stage was to seal all the fractures down to 20 microm of an
aperture After the calculations for all holes the grouting time (t(2D)) was set to be
100 min and the grouting pressure 60 MPa which means the overpressure of ca
50 MPa
After all the holes were filled in the grouting pressures were raised to the target level
(60 MPa) in all holes at the same time After 10 minutes old and new grout came out
from one grouting hole and the grouting was interrupted It means that there were
connections between the grouting holes of the first and the second stages Shortly after
the grouting was continued the grout flow was very low in every hole ~ 00 dm3min
until the end of the grouting The total grout intake was 924 l out of which the
proportion of the grouting holes was about 13
The result of the second grouting was studied via the grouting holes of the third stage
(see Figure 4-5 c) The results of the flow logging still showed numerous fractures in all
holes and the largest fracture aperture was 45 microm The need for grouting was evident
even though the larger fractures had been sealed earlier
The third stage was grouted with the grout UF-41-14-4 (τ0 asymp 840 Pa microg asymp 104 mPas)
which was to be used in every hole The planned penetration length was 4 meters in
every hole and the aim was to seal all the fractures with apertures larger than 20 microm
The grouting time (t(2D)) was set to be 110 min and the grouting pressure 60 MPa All
holes were first filled and then grouted at the same time and due to this pipe branches
were used to connect the holes
During the grouting the pressures were less than the target level and the grout flows
were much higher than expected based on the results from the water loss measurement
and the flow logging The fracture system was very complicated and there were more
and larger fractures than expected After 90 minutes the grout leaked to the tunnel at the
chainage 960 (about 30 m away) When the grouting time 110 min was reached grout
flows were still very high (asymp 10 dm3min) in every hole Therefore the grout recipe was
changed for a thicker grout UF 41-10-4 (τ0 asymp 27 Pa microg asymp 278 mPas) and grouting was
45
continued with that grout about 50 min The grout flow and the total grout intakes were
still high in every hole which confirms the arguments that the results of the pre-
measurements were invalid Another possible explanation is that the fractures opened
during the grouting or that fracture infillings moved and new connections formed The
grout flow was two- and three-dimensional during the grouting and there was a large
fracture zone which skewed the dimension-analyses After the third grouting stage a
24 m long extra control hole was drilled The results showed still relatively high water
loss
All in all in this field test the fractures were slightly sealed after the first and the second
round especially the largest fractures but the effect was not so great than expected
(Hollmeacuten 2007) However there remained a question if the results of the measurements
were not reliable Therefore the real results of the grouting can be evaluated from the
possible water leakages after full-face boring Even though the 2D flow model was
used the total grout intake was much higher than expected after the tests in the grouting
holes Especially on the third round the total grout intake was very high in proportion
to the measured Lugeon values and the hydraulic apertures
46
a)
-110
-105
-100
-95
-90
0 10 20 30 40 50 60 70 80 90 100
Aperture of fracture bhydr [microm]
Dep
th Z
[m
]
ONK-PP 86 ONK-PP 87 ONK-PP 88
b)
-110
-105
-100
-95
-90
0 10 20 30 40 50 60 70 80 90 100
Aperture of fracture bhydr [microm]
Dep
th Z
[m
]
ONK-PP 89 ONK-PP 90 ONK-PP 91
c)
-110
-105
-100
-95
-90
0 10 20 30 40 50 60 70 80 90 100
Aperture of fracture bhydr [microm]
Dep
th Z
[m
]
ONK-PP 92 ONK-PP 93 ONK-PP 94 ONK-PP 95 ONK-PP 96 ONK-PP 97 ONK-PP 98
Figure 4-5 The observed fracture apertures at the different stages of the grouting test
a) the observations before grouting (3 holes) b) the observations after the first grouting
round (3 holes) and c) the observations after the second grouting round (7 holes)
before the last grouting round (Hollmeacuten 2007)
47
Figure 4-6 The design window in the first grouting round in the second field test The
penetration depth I as a function of the grouting time (t(2D)) ( 0 = 52 Pa and microg =
103 mPas) The hydraulic aperture of the fracture is 24 microm same as in the grouting
holes 87 and 88 The shaded area represents the design window for the pressure and
the grouting time when I = 283 m (Hollmeacuten 2007)
Conclusions of the two grouting field tests
As a conclusion of grouting tests Hollmeacuten (2007) presents the following opinions
The water loss measurement and the flow logging used together are useable and
recommended investigation methods to estimate the number and the hydraulic apertures
of fractures The hydraulic aperture of a fracture is quite a good estimation for the
grouting aperture and it should be known before the grouting parameters are decided
The field tests proved that the overpressure of water loss measurement should be
revised when operating in deep averagely fractured rock Based on the study the
recommended grouting pressure is little less than the limit for hydraulic uplifting
48
Concerning the stop criteria the main conclusion about the field test was that the stop
criteria based on the analysis of grout penetration is not easy to use when a fracture
system is complicated but may be usable when it is simple (Hollmeacuten 2007) The theory
takes into account only the fractures that are intersected by a bore hole The criterion is
also difficult to use if the fracture characteristics are unreliable Therefore Hollmeacuten
(2007) suggested further development of the time stop criterion (grouting time ndash
method) is needed since the exact characterization at the site is very difficult However
the theory behind the time stop criterion is a useful tool for the optimisation
The following conclusions from the experiences of the field tests were also expressed
by Hollmeacuten (2007)
- The grout properties used in the design calculations should be results from the field
using a real grouting equipment not from the laboratory
- The rock characterization methods (the water loss measurement and flow logging)
give only estimations about the fracture density and their apertures Real fracture
network to where the grout penetrates can be much different
- If the required inflow target is strict the grouting holes inside the tunnel profile can
risk the grouting result
- The total number of grouting holes in a fan should not be minimized because there
is always a risk that the grouting hole doesnrsquot cut the fracture sufficiently
- A safety factor for the penetration length is recommended
- Packers must extend longer to the rock mass than the excavation damaged zone
- It is important that before grouting the contractor informs all the differences and
disturbances from the excavation to the grouting designer and
- Grouting equipment the accuracy of the flow meter should be at least
001 dm3min
If the packers are released too early the grout flows out from the borehole and at the
same time the grout may flow from the fractures to the borehole If that happened the
grouting would be unsuccessful The beaker test to illustrate packersrsquo removing time
was used in the field tests The results of the test were invalid because in two cases the
grout flowed out from the borehole when the packers were released Therefore the
methods to indicate packerrsquos removing time need further developing
Pilot field test with colloidal silica
A preliminary study of grouting with colloidal silica was done in the year 2007 This
study included also a pilot test grouting with the colloidal silica which is described
below The test is fully reported in project memorandum
The objectives of the silica test from the grouting technology point of view were to
1 obtain experiences of the material (colloidal silica) under the prevailing conditions
at ONKALO and with Posivaacutes grouting equipment
2 test and collect practical experiences about post-grouting with colloidal silica and
3 collect experiences on removing colloidal silica from the drill holes
49
The test site was located in the ONKALO access tunnel at about the chainage 1815 at
the depth level of about -180 m (Figure 4-7) The location of the grouting and the
control holes is depicted in Figures 4-7 and 4-8 The boreholes PR2 - PR5 are the
grouting holes and the holes PR6 - PR15 are the control holes A vertical geological
structure including water conductive fractures was assigned as the test site location
A commercial Meyco MP 320 colloidal silica and its NaCl accelerator (Meyco MP320
accelerator) were used in the pilot test
Before the first grouting trial the grouting holes PR2 - PR5 were characterized by the
water loss measurement the flow logging and the out flowing water The results
obtained from different measurements were not fully compatible but they gave a clear
indication that the holes intersect a water conductive fracture and its hydraulic aperture
was estimated to be ~15 microm (calculated from the flow log results) No hydraulic
connections between the holes or between the holes and the tunnel were detected The
temperature in the beginning of the holes was ~12 oC eg close to that prevailing in the
tunnel However it varied along the holes The water pressure was 16 MPa The
temperatures of the colloidal silica and the accelerator were 122 oC and 123
oC
respectively
Prior to the grouting test the beaker tests were conducted in order to determine the
gelling times and the dosing of the accelerator The target gelling time was 45 min and
thus the pumping time 23 min was set Five mixing ratios (colloidal silicaaccelerator)
were tested in tunnel conditions and the mixing ratio 5125 met the target value for
gelling time
The grouting design was calculated with the 1D model for penetration The target
penetration length was 15 m The stop criterion was grouting time
Before the grouting was started the agitator and the grouting hose were washed with
water in order to remove the alkaline water from the equipment The grouting mass with
the silicaaccelerator ratio 5125 was mixed in the agitator for 60 seconds
The four grouting holes were equipped with short packers and the valves were in open
position Air and water were removed from the grouting hose The pressure was
increased to the planned grouting overpressure (04 MPa) immediately thereafter and
the pressure was kept constant The grouting was started from the drill hole PR2 It
became evident that the mass intake will be very small within the planned grouting time
(23 min) In fact during the grouting there was water in grouting holes that was injected
into the fractures instead of colloidal silica The grouting overpressure was raised to 09
MPa without any conceivable effect on the rate of mass intake The observations were
made at the pressure gauge grout movement may have happened but it was not possible
to detect
50
Figure 4-7 The silica grouting test The job site in the ONKALO access tunnel (top
view PL refers to the chainage) and the location of the grouting holes ONK-PR2 ndash
ONK-PR5 (A = the length of the grouting holes B = the distance from the tunnel) The
brown element is a vertical geological structure and the blue lines shows the water
leaking fractures observed in the tunnel roof and the walls The control holes were
drilled later to the same direction and inclination with the grouting holes
Figure 4-8 The location of the grouting holes (front view) ONK-PR2 ndash ONK-PR5 and
the control holes ONK-PR6 ndash ONK-PR15 The drill holes ONK-PR2 ndash ONK-PR15 are
7 m long and declined 5 o
PR10
PR3
PR4
PR5
PR7
PR8
PR6
PR9
PR11
PR15
PR14
PR13
PR12
30 m
13 m
15 m
m
075 m
x
y
asymp 40deg
B
A
x
y
x
y
asymp 40deg
B
A
PR2
51
The gelling time determined with the beaker method gave the value of 35 min after the
mixing This value was 10 min shorter than the value (45 min) from the test a few hours
before with the same method One possible explanation could be that in spite of
cleaning the agitator and the hose before the grouting test there has been some alkaline
water left somewhere in the equipment accelerating the gelling reaction In the
following batch the result of the beaker tests was in line with the earlier test results
The most conductive drill hole PR5 was grouted next The longer gelling time (57 min)
was applied with the mixing ratio 511 The grouting overpressure was also raised to
15 MPa The silica intake was about the same as in the previous hole (1 - 2 l) regardless
of longer grouting time (30 min) and higher grouting pressure The gelling time of
55 min was quite close to the value determined earlier with this mixing ratio The
cleaning of the holes was not done
In total two holes were tried to be grouted and then the test was interrupted The first
grouting trial failed because the grout flow was too slow with regard to the gelling time
and the grouting was interrupted A new test was designed The principle was the same
but the following key modifications were made
1 In the calculation the 2D model is to be used instead of applying the 1D model
2 Longer gelling times are preferred because of very small fracture apertures and
3 The grouting holes are to be filled with colloidal silica before grouting
The target was to grout 2 h In order to reach suitable gelling time new mixing ratios
(silicaaccelerator) for the beaker tests were determined One ratio was the same as in
the first trial The air temperature was T = 13 oC during the test In these beaker tests
the silica sol did not gel if the ratio was lt 506 - 504 The optimal ratio seemed to
have been from 508 to 510
When the gelling time of the mix 510 was compared with the earlier result the gelling
time in the second test was 15 min more (79 min) than in the first test (65 min) The
gelling time is an important part of accurate design and grouting Because of the
significant difference in gelling times it was decided to study briefly whether there
would be any potential differences in a) using fresh accelator from the container intact
and option b) aged accelerator from the container been in use earlier The mixing ratio
was set to be 517 The point was to ensure that the accelerator that was to be used for
the grouting test was not defected by aging A small difference was observed (3 min in
gelling time) and the fresh accelerator was quicker It was decided to make the
additional tests with both accelerators just before the grouting test to be more confident
about the behaviour of the accelerator and the suitable mixing ratio
The accelerator from both drums (the difference being in the dates the drums were
opened) with the different mixing ratios was subjected to the additional tests The
colour of the accelerator in the newly opened drum (opened on the previous day) had
turned dark gray overnight The colour was similar to the accelerator in the earlier
opened drum The inner surface of the container looked rusty as well
52
Unexpectedly these tests indicated that the accelerator from the barrel opened earlier
was more effective The only accurate gelling time was from the measurement with
ratio 508 where the accelerator reacted even 2 h faster (2 h 44 min vs 4 h 47 min)
The mixes with ratios 510 gelled in less than 1 h 53 min The results with the aged
accelerator were more in line with the previous test results and it was decided to use that
in the grouting test On the basis of the results the mixing ratio 509 was chosen with an
aim of 2 h gelling time
The grouting design was done with the following assumptions the fracture aperture was
15 microm the grouting pressure was 25 MPa and the gelling time was 2 h The penetration
distance of 16 m was targeted
All four holes were to be grouted The task to fill the holes after mixing the silica mass
(t = 0 which initiated the time available for grouting) was started with a newly
constructed filling device (Figure 4-9) That was used to remove the water from the
grouting hole and the hole was filled with the silica mix The filling proceeded as the
filling hose was inserted through the duct in the packer to the bottom of the hole The
holes were filled one by one There was a short delay because of the grout mix shortage
and a new batch had to be mixed Thats why the start of the grouting was postponed
In the beginning the grouting pressure was raised to the target value (the designed
pressure) about 25 MPa No mass flow was detected in the flow meter Then the
pressure was raised to the values 38 - 42 MPa and eventually to 46 - 47 MPa Due to
the measuring accuracy (00 dm3min) the flow meter did not show any grout flow but
the pistons in the pumps were moving and it was concluded that the flow occured
During the whole grouting three holes (PR2 PR3 and PR5) took in grout each of those
took about 1 l and the total grout intake was 3 - 4 l The grouting was stopped after 86
min counted from the first mixing The sample from the first batch had already started
to gel Out of the total duration 42 min was used for filling the holes and 44 min for the
grouting During the grouting the pressures close to the grouting holes were quite
similar with the gauge readings at the grouting equipment
When comparing the water leakage results (PR2dry PR3125 mlmin PR430 mlmin
and PR5100 mlmin) conducted in the holes before the grouting and the silica intake
during the grouting it can be concluded that the results are not unambiguous
In the beaker including silica from the first batch from the agitator the mix gelled in 1 h
33 min The corresponding sample taken from the end of the hose remained fluid The
gelling times with constants mix ratios differed from the test to another The target
gelling time of 2 hours was not reached in this test
The grouting was considered successful since the grout intake was 3 - 4 l more than the
total volume of the grouting holes and the test continued with controlling of the result
and cleaning of the holes
53
Figure 4-9 The filling device to replace the hole water with silica
Some leakages (1 - 190 mlmin) were observed in five control holes Unexpectedly the
highest leakage was in PR8 and the next highest in PR6-7 These control holes were the
closest to the grouting holes The only measurable water loss was in the drill hole PR8
(50 mlmin under 03 MPa)
The holes PR2 and PR3 were cleaned by removing silica mass using a steel brush A
drill rig was employed for the job Before cleaning the packers were removed from the
holes The packer was removed from one hole and the silica mass in liquid form was
found inside the packer after six days even though the gelling times observed in cups
were about 15 - 2 h Removal of the packers after two weeks setting time resulted in
the out flow of unhardened silica from the holes (see Figure 4-10) A sample was
collected from the surface into a plastic bag and it started to gel within a few hours
Anyhow the cleaning trial was done as follows A steel brush was attached with the rod
(Figure 4-10) As planned brushing was started without flushing (air or water) in the
drill hole PR2 The drill rod and the couplings became hot and decoupling failed Later
the coupling between the brush and the rod had loosened during the previous activity
when trying to open the coupling between the rods Eventually the hole was washed
with the water hose Silica residual was observed on the hole wall (PR2) after brushing
and spooling The trial in this hole failed to remove all the liquid silica In the hole PR3
instead of brushing the drill rod with an old drill bit was inserted into the hole and air
flushing followed by water flushing was used Liquid silica spurted from the hole quite
soon
54
Figure 4-10 The grouting hole PR2 was cleaned with a steel brush coupled into the
drill rod The silica came out and ran along the tunnel wall
Concluding remarks about the pilot test with the colloidal silica
Plenty of first hand practical experiences were obtained
Water pumps and water flow gauges used in conventional way to determine water
loss were not suitable in these rock conditions with quite a poor conductivity
Results cannot be considered reliable and to draw any conclusions on the effect of
grouting is difficult
Also small grout flow was nearly impossible to observe due to too poor measuring
accuracy of the grouting equipment (00 dm3min) and
The reading accuracy of the flow meters should be 001 dm3lmin
Plenty of experiences were obtained in regards to the silica mass and its behaviour and
about grouting activity Salt-accelerator should be stored in a drum made of material
that does not corrode There was substantial variation in the effectiveness of accelerator
depending partially on the time the drum had been open Additionally the substance
originating from the drum material which made the accelerator turn dark may have an
effect on the reaction between accelerator and silica Homogenous and correctly packed
and stored components would probably give more consistent gelling times The correct
mixing ratio is very essential and the volumes of both components should be dosed
carefully Gelling times were difficult to measure exactly with the beaker method
55
especially when the amount of accelerator was small The gelling time should be
defined more exactly and so that there is a method to observe it Mixing ratios with
accelerator less than 04 - 06 units (per 5 units of silica) will not result in gelling which
means that long (over ~15 h) gelling times cannot be applied
The first trial had to be discontinued before the holes were full because the small
apertures and short gelling time resulted in a slow flow rate that was not measurable
with the equipment in use In the second trial a separate filling device was used to fill
the holes with silica prior to grouting That saved time for the actual grouting and that is
a practice recommended at least in the case of tight fractures The filling of three holes
took about 3 x 5 minutes (+ time required for dosing and mixing) and this time
consumes the effective grouting time available Several holes can be filled
simultaneously
The time required for the filling of holes should be taken into account when designing
the grouting with colloidal silica The gelling time should be long enough to allow both
the filling of holes and the actual grouting phase before gelling takes place Detailed
planning of the work phases is important and the work phases should be performed
without significant delays
Long gelling times are not always suitable but in some cases they are preferable
because eg unexpected delays do not cause that significant error in design (open time
shorter than expected in the design) In principle very short gelling times are possible
with colloidal silica but each working stage requires a certain time The work stages
should be taken into account already in the design The inaccuracy in gelling time
particularly by using long gelling times caused by a disturbance (dirty equipment
inexact dosage etc) however can be worse with respect to stop criteria than by short
gelling times Because mass intake can be high in large fractures the gelling times
should be short and that can be difficult to control technically The use of colloidal
silica in larger fractures under high groundwater pressures seems also a little bit
challenging how to get colloidal silica to gel subjected to strong water flows
Silica (at least in a liquid form) cannot be totally removed from holes with brushing and
flushing The steel brush should be welded to the rod if brushing is desired It is
difficult to insert the rod into a hole without direction marks behind the boom Should
monitoring of silica in holes andor cleanliness of holes be considered necessary the
working practices should be developed further
56
57
5 OPTIMISATION OF GROUTING FOR ONKALO 51 Objectives for grouting
The design requirements of the water inflow set for ONKALO are in place to prevent
the disturbances foreseen as described earlier (Chapter 2) Those requirements are
presumed to be met by taking the measures below
ONKALO shall not be built close to heavily water conductive rock or drill holes
Seawater should not intrude into the repository host rock and groundwater table
should not be drawn significantly below sea level
Surface waters should not migrate towards the disposal level
Significant upconing of deep saline groundwater should not take place
ONKALO should not create significant permanent hydraulic connections
Inflow rate of groundwater should be as low as possible and
Seawater should not intrude into the repository host rock
The principals above will result in a respect distance to major water conductive zones
and to investigation holes Furthermore the maximum limit values for the groundwater
inflow have been determined The allowable flow rate is lt140 lmin The latter values
were set by interpreting the ldquoinflow rate of groundwater as low as possiblerdquo to be about
1 - 2 lmin100 m At the time the construction started this inflow was generally
considered the lowest achievable inflow rate
As the understanding has enhanced the interaction between alkalis released from
cements and bentonite as a part of Engineering Barrier System (EBS) and backfill
material in the repository has been raised to be one key issue The phenomena are not
fully understood and absolutely right limit values eg for the use of cement cannot be
given Even though exact values are not possible to determine with models the
guidelines for the use of cement are given grouts below the RH20 structure should be
of low pH (eg the pH in the leachant lt 11) and the amount of cementitious materials
should be minimised The practices to fulfil the latter include limiting the grout take
using as thick grouts as possible and directing the grouting holes inside the tunnel
profile
The design requirements set for the total inflow and the local inflow rates were not
changed due to the R20 programme
52 The expected hydrological conditions from the grouting point of view
The expected hydrological conditions below the depth of -300 m were determined for
grouting design purposes The main aim was to foreseen the conditions that are likely to
prevail for grouting in the future
The data processing and its results are reported fully by Vaittinen et al (2007)
58
521 Collection and selecting of data and data processing
Because the rock volumes about 20 m x 20 m x 20 m are of interest from the grouting
point of view the below presented approach is not connected to any current bedrock
model or hydrological model The design solutions are aimed to be free from any
particular tunnel layout or geological or hydrological model since those may change
and thus the grouting design solutions would become invalid
The criteria for fracture zones in the data processing were the same as in the bedrock
model 20031 (Vaittinen et al 2003) (Table 5-1) This study however is not related in
any other respect to that version of the model The same approach which was used in
that bedrock model that took into account both the hydraulic properties of fractures and
the rock fracturing was selected for the data processing as well The criteria used
comply with the Finnish Engineering Geological Classification system (Gardemeister et
al 1976) and it is complemented with other elements The data used here was the one
available from the deep drill holes (OL-KR-holes) by February 2007
The description of hydrogeological conditions is based on the properties of
hydraulically conductive fractures ie transmissive fractures at the depth range of -300
- -600 m see Figure 5-1 The lowest measured transmissivity is 1110-10
m2s but due
to the measuring method the transmissivity values below 110-9
m2s cannot be
systematically measured The properties are processed statistically and the probable
occurrence density in horizontal tunnels was assessed The combined length of the drill
holes down to the levels between -300 m and -600 m is about 5630 m The
transmissivity of the fractures is measured with the Posiva Flow Logging Device
(Oumlhberg amp Rouhiainen 2000)
Table 5-1 The simplified description of the criteria of fracture zones used in the data
processing (same as in Vaittinen et al 2003) The rest of the rock is treated as
averagely fractured rock
PROPERTY CRITERION
Fracture frequency
The primary fracture frequency criterion ge 10 fractures 2 m
Intersection boundaries lt 10 fractures 2 m
Type of structure intersection
RiIII A fracture zone
RiIV-RiV Crushed zone
Hydraulic zone
Measuredcalculated K-2m 5E-7 ms
59
Figure 5-1 The transmissive fractures observed in the deep drill holes (Vaittinen et al
2007) The red box stands the depth range of -300 - -600 m and those are the
observations used here
The orientation of the transmissive fractures was detected from the drill hole samples
OL-KR1 - 5 7 - 15 19 - 20 and 22 (Hellauml et al 2004 amp 2006) The orientation for the
area represented by the drill holes OL-KR24 - 25 27 and 38 - 42 has been determined
combining flow anomalies with the conductive fractures based on core sample mapping
The processing of transmissive fractures from the original data into the form of
expected hydrological conditions in horizontal tunnels was performed in the following
steps
1 All transmissive fractures were assessed together
2 Transmissive fractures were classified by dip 0 - 30deg 30 - 60deg and 60 - 90deg
3 Order of magnitude correction coefficient was approximated for biased fracture
observations The coefficient was based on the ONKALO fracture mapping data
4 Transmissive fractures were classified by hydraulic aperture below 0020 mm
0020 - 0050 mm and above 0050 mm
5 Transmissive fractures were classified either to occur as a distinct fracture in the
averagely fractured rock or to belong to a fractured zone (criteria as in Vaittinen et
al 2003)
6 In order to evaluate the distance between the transmissive fractures in tunnels the
observations (oriented transmissive fractures) made in drill holes were projected to
the horizontal plane
7 Distinct transmissive fractures were classified by dip as in the stage 2) and by
hydraulic aperture as in the stage 4) and
8 Transmissive fractures in fractured zones (criteria as in Vaittinen et al 2003) were
assessed zone by zone
60
The dip and the hydraulic aperture were selected as a basis for the classification of the
data since they are the key properties from the point of view of groutability The
aperture affects on the penetration ability and the penetration length of a grout mix The
fracture angle in terms of dip is an important factor when determining the penetration
length required Perpendicular penetration length from the tunnel surface is important
due to eg rock bolts and fracture dip affects on this
Based on general understanding about grouting the hydraulic apertures are divided into
the classes less than 0020 mm 0021 - 0050 mm and more than 0050 mm due to the
following reasons the grouting of fractures with an aperture of lt0020 mm is probable
impossible with cementitious grouts and the need for grouting of these fractures is
questionable The grouting of fractures with a hydraulic aperture of 0021 - 0050 mm is
probably needed although it might be difficult with cementitious grouts Colloidal
silica is generally considered more capable to penetrate into the fractures of this size
The fractures with a hydraulic aperture of gt 0050 mm shall be grouted and
cementitious grouts are considered applicable to seal these kind of fractures partly or
fully
The statistics of all fractures and the full data processing is presented by Vaittinen et al
(2007) As an outcome only the data of interest from the point of view of grouting is
presented below
522 Statistics
To characterize the hydrogeological properties expected in the bedrock for grouting
purpose the transmissive fractures were classified either into the averagely fractured
rock or into the fractured zones (criteria presented in Table 5-1) The total hole length
studied was 5630 m Out of this 420 m (75) belonged to the fractured zones
Applying this classification the mean transmissivity is almost two decades higher in the
fractured zones than in the average rock see Table 5-2 and Figure 5-2
The transmissive fractures were divided further on the basis of the hydraulic aperture to
three sub-groups bhydr lt 0020 mm 0021 gt bhydr gt 0050 mm and bhydr gt 0050 mm
(Table 5-2) The distribution of the observations clearly differs between the average
rock and the fractured zones In the average rock 62 of the transmissive fractures have
the hydraulic aperture less than 0020 mm whereas the transmissive fractures with the
hydraulic aperture greater than 0050 mm is the largest group 44 in the fractured
zones (Vaittinen et al 2007) The analysis indicates that the proportion of fractures with
the hydraulic aperture larger than 0050 mm dipping towards the south-west within the
average rock is quite high and proportion of gently dipping fractures with the hydraulic
aperture less than 0020 mm within the fractured zones is low The transmissive
fractures with the hydraulic apertures greater than 0050 mm have mostly gently dipping
orientations
61
Table 5-2 The statistics of the observed transmissive fractures within the averagely
fractured rock and within the fractured zones transmissivity (T m2s) and spacing (S
m) (Vaittinen et al 2007)
T mean m2s
(count)
T
Median
m2s
T St
Dev
m2s
S Mean
m
(Nr of
observations)
S
Median
m
S St
Dev
m
Average rock 26middot10-8
(184) 27middot10-9
83middot10-8
223 (149) 92 323
bhydr lt 002 mm 14middot10-9
(114) 11middot10-9
11middot10-9
249 (85) 114 342
002 gtbhydgt 005 mm 18middot10-8
(56) 13middot10-8
16middot10-8
425 (35) 226 507
bhydr gt 005 mm 26middot10-7
(14) 21middot10-7
18middot10-7
373 (6) 30 580
Fractured zone 16middot10-6
(126) 39middot10-8
47middot10-6
13 (71) 08 16
bhydr lt 002 mm 18middot10-9
(32) 19middot10-9
12middot10-9
08 (21) 07 09
002 gtbhydrgt 005 mm 23middot10-8
(38) 19middot10-8
17middot10-8
13 (23) 07 16
bhydr gt 005 mm 36middot10-6
(56) 47middot10-7
66middot10-6
18 (27) 11 20
0
10
20
30
40
50
60
70
80
90
100
0000 0050 0100 0150 0200 0250 0300 0350 0400
Hydraulic aperture mm
Culu
lativ
e fre
quency
Average rock Zones
Figure 5-2 The cumulative frequencies of the hydraulic apertures within the averagely
fractured rock and within the fractured zones
62
523 Expected transmissive fractures within averagely fractured rock in the
tunnels
The occurrence of the transmissive fractures expected in the tunnels classified
according to the dip and the hydraulic aperture is presented in Table 5-3 The number
of observations with the hydraulic apertures larger than 0050 mm is so low that the
results are only indicative The statistics of spacing and the orientation of the expected
fractures (corrected orientation and occurrence) within the averagely fractured rock are
given in Figure 5-3
524 Expected transmissive fractures within fractured zones in the tunnels
The statistical analysis of the fractured and hydraulic structures based on the bedrock model version 20031 has been done in 2004 (Hellauml et al 2004) Vaittinen et al (2007) further treated this data and defined eight data sets Each of these data sets was used to generate several realizations (Hellauml et al 2004) of the structures
Based on the mean number of the intersections it was estimated that the tunnel would intersect approximately 20 fractured or crushed zones along 3000 m of the tunnel below the level of -300 m Order of magnitude frequency for these structures would be one structure per 150 m After the criteria applied for the fractured zones (Table 5-1) they may contain no transmissive fractures
The histograms of the transmissivity and the corresponding hydraulic aperture and the dip direction and the dip are shown in Figure 5-4 Compared to the fractures in the averagely fractured rock the transmissivity is clearly higher within the fractured zones The orientation histograms are quite similar with the other data sets Vaittinen et al (2007)
The illustrations of the fracture sets expected are presented in Figures 5-5 and 5-6
Table 5-3 The determined spacing of the classified transmissive fractures within the
averagely fractured rock
Hydraulic apertureDip
Dip lt 30 dgr Dip 31 - 60 dgr Dip gt 60 dgr
bhydr =lt 0020 mm 112 m (30) 146 m (23) 146 m (23)
0020 gt bhydr gt 0050 mm 372 m (9) 239 m (14) 419 m (8)
bhydr =gt 0050 mm 1117 m (3) 3350 m (1) 1117 m (3)
0
38
48
22
6
0 0
0
33
75
95 100 100 100
0
5
10
15
20
25
30
35
40
45
50
1E-10 1E-09 1E-08 1E-07 1E-06 1E-05 1E-04
Fracture T m2s
Fre
quency
0
20
40
60
80
100
120
97
47 47
4
8 14
55
96 100
0
5
10
15
20
25
30
35
40
45
50
01 1 10 100 1000
Spacing m
Fre
quency
0
20
40
60
80
100
120
26
47
2219
23
64
83
100
0
5
10
15
20
25
30
35
40
45
50
90 180 270 360
Dip direction
Fre
quency
0
20
40
60
80
100
120
42
38
34
37
70
100
0
5
10
15
20
25
30
35
40
45
50
30 60 90
DipF
requency
0
20
40
60
80
100
120
Figure 5-3 The histograms of the transmissivity the spacing the dip direction and the dip of the transmissive fractures with the
corrected proportion of gently moderately and steeply dipping fractures within the averagely fractured rock
63
0
11
3234
28
14
7
0
9
34
61
83
94 100
0
5
10
15
20
25
30
35
40
1E-10 1E-09 1E-08 1E-07 1E-06 1E-05 1E-04
Fracture T m2s
Fre
quency
0
20
40
60
80
100
120
22
46
26 25
18
57
79
100
0
10
20
30
40
50
60
90 180 270 360
Dip direction
Fre
quency
0
20
40
60
80
100
120
52
46
2144
82
100
0
10
20
30
40
50
60
30 60 90
Dip
Fre
quency
0
20
40
60
80
100
120
Figure 5-4 The frequency of the water conductive fractures within the fracture or crushed zones in terms of the transmissivity and the
histograms of the dip direction and the dip for the fractures within the fracture zones
64
65
Figure 5-5 Examples of water conductive 2- and 3-fracture systems observed in the
deep rock in Olkiluoto
Figure 5-6 Examples of water conductive complicated systems with multiple fractures
observed in the deep rock in Olkiluoto
The information above has been used when selecting the fracture systems studied in the
feasibility study of grouting design solutions (Section 53) The data will be useful also
when preparing for the future groutings beforehand
53 Feasibility of the design solutions
The theoretical study was carried out by Lokkila (2008) in order to assess the feasibility
of the design solutions
The aim was to start with ideal design solution focusing the grouting in places
determined based on the rules for local leakages the grouting with low pH grouts
66
minimising the grout to remain in the rock by having the grouting holes inside the
tunnel profile and limiting the grout take The study concentrated in fracturing
conditions determined by Vaittinen et al (2007) (Section 52) The work was iterating
until the design solution was found If it was not found the alternative design solutions
were suggested This work can be utilized for actual grouting design in the future by
giving general operating limits eg for grouting pressures grouting patterns etc
531 Optimal design solution
The optimal grouting design solution includes the following components
Use of low pH grouts
Grouting holes inside the tunnel profiles (Figure 5-7) and
Controlled grout penetration (3 - 20 m)
This design solution was studied by using the Grouting Time -method (the same
analytical approach as used in time stop grouting) in the study carried out by Lokkila
(2008)
The target was to find the most optimal design solution for different fracture-tunnel
systems However the practical point was kept in mind all the time eg the grouting
pressures were aimed to be low enough
Figure 5-7 A tunnel in rock showing the principle of a pre-grouting fan where the
grouting holes are inside the tunnel profile The grouting holes inside the tunnel profile
diminish the amount of the stray materials in the rock
67
532 Calculation system and studied cases
The study proceeded as presented in Figure 5-8 and the aim of systematic approach was
to
Identify the cases that can be handled with typical design solutions and find feasible
design solutions and
Identify the cases that cannot be handled with typical design solutions
The calculations were made for 1D and 2D cases The 1D case means the flow in a
canal (fast flow) the 2D means radial flow (slower flow) The 2D flow was selected due
to conservativeness of the study It is hard to detect which kind of flow occurs in the
fracture for real The 3D flow is also possible especially in complicated fracture zones
like RH19 and RH20 but it was ruled out in this study since there are no practical
calculation tools available yet
The cases were first determined on the basis of hydrological conditions at the Olkiluoto
site and one additional component ndashtunnel direction ndash was added (Table 5-4) In order
to limit the number of the cases in the study the tunnel directions 000 045 090 and 135
degrees and the dip directions 00000 00015 00030 00045 00060 00075 and
00090 degrees were selected The cases were numbered for identification
In the very beginning it turned out that the range -270 - -520 m has to be divided into
Two parts and the fracture group 50 - 400 microm has to be split into several
parts
Figure 5-8 The study flow chart (Lokkila 2008)
Basic design solution feasible
5-10 optimal solutions for pressure and
time space grouting fan and mass mixes
Succeeded
OK
Succeeded
Other designsolution
Define suitable design
areas for special cases
Special grouting cases
inc pre-injection
R20- structure
shafts
Not Succeeded
Variations
1 Varying mass recipes
2 Changing minimum penetration of grout maximum volume injected
3 Changing fans to outside of the profile
Not succeeded
Starting values
Grouting pressure minimum and maximum penetration length and minimum aperture
About 2-3 basic masses with different properties
Fans to inside of the profile (distance 1m) bevare of the backflow
Basic design solution feasible
5-10 optimal solutions for pressure and
time space grouting fan and mass mixes
Succeeded
OK
Succeeded
Other designsolution
Define suitable design
areas for special cases
Special grouting cases
inc pre-injection
R20- structure
shafts
Not Succeeded
Variations
1 Varying mass recipes
2 Changing minimum penetration of grout maximum volume injected
3 Changing fans to outside of the profile
Not succeeded
Starting values
Grouting pressure minimum and maximum penetration length and minimum aperture
About 2-3 basic masses with different properties
Fans to inside of the profile (distance 1m) bevare of the backflow
68
69
Table 5-4 The fracture-tunnel systems studied (Lokkila 2008) CS = colloidal silica
Aperture bhydr (mm)Dip direction Dip 30deg (0 15 and 30) Dip 30-60deg (30 45 and 60) Dip gt 60deg (60 75 and 90)
lt0020 Restricted penetration tunnel dir vs dip dir tunnel dir vs dip dir tunnel dir vs dip dir
of any grouts 000 045 090 and 135 deg 000 045 090 and 135 deg 000 045 090 and 135 deg
0021-0050 Cement grouting tunnel dir vs dip dir tunnel dir vs dip dir tunnel dir vs dip dir
difficult unrestricted 000 045 090 and 135 deg 000 045 090 and 135 deg 000 045 090 and 135 deg
penetration of CS
assumed
0051-0400 Unrestricted penetration tunnel dir vs dip dir tunnel dir vs dip dir tunnel dir vs dip dir
of cement grouts 000 045 090 and 135 deg 000 045 090 and 135 deg 000 045 090 and 135 deg
assumed
Only case with a single fracture was calculated since the same logic can be used in
multiple fracture cases When applying optimized grouting to the multiple fracture cases
two or several grouting rounds are probably needed This is traditionally called the split
spacing technique
Some cases can be theoretically grouted using the ideal drilling fan because the grouting
holes intersect the fracture (example in Figure 5-9) Some cases turned out to be
impossible to handle with the optimal design solution because the grouting holes do not
intersect the parallel fracture (see Figure 5-8) Those cases in terms of the tunnel
direction and the fracture orientation are 000-00000 045-00000 090-00000 090-
00015 090-00030 090-00045 090-00060 090-00075 090-00090 and 135-00000
In deep rock conditions the groundwater flow pattern and pressure is practically the
same around the tunnel Only the tunnel roof is a little bit different since rock bolts are
located there In many cases the tunnel direction and the fracture orientation were
practically same ie their relative angle turned out to be the same and the calculation
and results are valid for a few occasions Those cases in terms of the tunnel direction
and the fracture orientation are 000-000015 045-00015 and 135-000015 000-
00030) 045-00030135-00030 000-00045 045-00045135-00045 000-00060
045-00060 135-00060 000-00075 045-00075 135-00075 000-00090 045-00090
and 135-00090
70
a) b)
Figure 5-9 Illustrations of fractures that a) can be handled with symmetrical drilling
pattern and b) requires a modified drilling pattern (Lokkila 2008)
533 Starting values
There are six different types of low pH grouts available (Ranta-Korpi et al (2007)
Appendices 1 amp 2) grout 1 (G1) = UF-41-10-3 grout 2 (G2) = UF-41-10-4 grout 3
(G3) = UF-41-12-3 grout 4 (G4) = UF-41-14-3 grout 5 (G5) = UF 41-12-4 and grout 6
(G6) = UF-41-14-4 see Table 5-5 The values measured at 0 min were used in the
calculations
In order to control the grout take the thickest grout (the highest yield value) was
preferred Groundwater pressure increases with depth about 1 MPa per 100 m The
depths used in the study were 270 400 and 520 meters and the groundwater pressures
were 27 MPa 40 MPa and 52 MPa respectively
Because the fracture orientation cannot be observed but the penetration length aimed at
should be determined the perpendicular distance from the tunnel wall was used as a
penetration length instead of the actual penetration length The perpendicular
penetration length is limited between 3 and 20 meters The lowest value is the most
important one because that confirms that grouting seals well The upper limit is used
due the need to limit the grout take
Even though the long pumping time is not desired the maximum pumping time may be
up to 2 hours with the cement-based grouts The gelling time for a silica grout is
determined in advance by changing the silicaaccelerator ratio
The maximum pressure capacity of Posivarsquos grouting pumps is 20 MPa Theoretically
in the depth range -270 - -520 the grouting overpressure can vary between
148 - 173 MPa In the feasibility study the maximum grouting overpressure was
selected to be 15 MPa at most (with the prevailing water pressure of ~5 MPa) The
minimum grouting pressure must be higher than the groundwater pressure The
maximum grouting pressure was calculated with formula by Gustafson (2005)
71
The risk for the backflow was considered as well In practice the risk for the backflow
is not imminent because the grout has set to a certain extent before the removal of the
packers
534 Calculation process
The calculation was made in stages (Lokkila 2008) as briefly described below in Table
5-6
535 Summary of the results
The calculation results are summarised in Tables 5-7 and 5-8 The whole calculation
process and the results are described by Lokkila (2008)
It can be seen from the results that between the depth range of -270 - -400 m the optimal
design solution ie the use of the low pH grouts the predetermined grout take and the
grouting holes inside the tunnel profile is supported by the theory in the hydraulic
apertures of 100 microm In the smaller apertures there is a risk that the grout penetration
length as targeted is not obtained within the reasonable time frame and the alternative
design solutions should be considered if the water leakages are the priority criteria of
the acceptance The problems may occur mainly in the fractures nearly parallel to the
tunnel as the grout has to penetrate very long way to reach the perpendicular distance
required The alternative design solutions are eg the use of the thinner grouts (the
colloidal silica or the thinner cementitious grouts) the addition in the grouting pressures
andor to direct the grouting holes outside the tunnel profile In the depth range of -400 -
-520 m the aperture limit for the feasibility of the optimal design solution is at around
200 microm
Together with the expected rock conditions from the grouting point of view the results
indicate that for the most of the cases alternative solutions rather than the optimal
design solution shall apply
Table 5-5 The grout mixes and their properties used in the feasibility study (modified from Ranta-Korpi et al 2007)
Mix The nr of samples Marsh fresh [s] Marsh 05h [s] Marsh 1h [s] Plast Visc fresh
[mPas]
Plast Visc 30min
[mPas]
Plast Visc 60min
[mPas]
Yield value fresh
[Nm2]
Yield value 30 min
[Nm2]
Yield value 60min
[Nm2]
UF-41-14-4 25 41 41 41 104 166 174 84 93 94
UF-41-14-3 3 54 53 52 220 161
UF-41-12-3 5 114 113 113 366 567 497 312 283 271
UF-41-12-4 4 56 51 49 154 252 263 156 155 163
UF41-10-3 1 612 1087 492 563
UF-41_10-4 4 131 123 95 279 342 366 250
UF-15-10-28 4 39 41 38
UF-41-10-48 1 52 46 47 111 196 213 145 133 143
UF-41-12-36 3+1 61 62 66 272 334 420 199 220 236
UF-41-12-48 10 42 41 41 131 141 162 93 83 90
UF-41-14-48 6 36 36 36 80 100 105 52 48 47
UF-41-08-47 1 130 96 101
UF-41-12-51 1 42
UF-41-14-51 3 37
Mix Filter Pump fresh
100 microm [ml]
Filter Pump (100
microm) 05 h [ml]
Filter Pump
(100microm) 1 h [ml]
b min [microm] b crit [microm] Fall cone 05
kPa [min]
Fall cone 2 h [Kpa] Fall cone 6 h
[Kpa]
Fall Cone 24 h
[Kpa]
UF-41-14-4 310 326 305 34 117 426 10 853
UF-41-14-3 333 337 360 38 85 340 09
UF-41-12-3 275 293 225 47 126 330 11
UF-41-12-4 323 330 290 39 81 345 23
UF41-10-3 130 100 120 106
UF-41_10-4 267 255 140 120 35
UF-15-10-28 278 240 62 192 380 05
UF-41-10-48 340 295 280
UF-41-12-36 290 260 230 32 93 12
UF-41-12-48 332 335 345 19 158 03
UF-41-14-48 303 282 330 30 90 06
UF-41-08-47 300 310 300 64
UF-41-12-51 300 08
UF-41-14-51 325 26 86 05
Filter pump 100 microm sieve Penetrability meter Fall cone
Marsh cone Rheometry measurements
72
73
Table 5-6 The calculation process in the feasibility study The solution refers to the
ideal design solution solved means that the design was analytically solved (Lokkila
2008)
STAGE DESCRIPTION SOLUTION
1 Apertures 50 - 400 microm divided into smaller groups testing with UF-41-14-4 (thinnest) and calculating with UF-41-10-3 (thickest grout)
Apertures down to 200 microm solved fracture dips 15 and 90 turned out to be significant Apertures 50 - 200 microm not solved even with the thinnest grout
2 Apertures 100 - 200 microm calculated with UF-41-10-4 apertures 50 - 100 microm studied
Solution found in group 100 - 200 microm but the grouting overpressures are relatively high Group 50-100 microm not solved
3 Apertures 100 - 200 microm recalculated with UF-41-12-3
Solution found but the grouting overpressures are relatively high
4 Apertures 100 - 200 microm recalculated with UF-41-14-3
Solution found theoretically backflow a little risk and extension of upper limit of penetration length was required
5 Aperture 50 - 200 mm studied with UF-41-12-4
Solutions found drawbacks with backflow and thus extended upper limit of penetration length in group 100 - 200 microm and relatively high grouting pressure in group 50 - 100 microm
6 Aperture 100 microm with UF-41-14-4 (50 microm already tested in Step 1)
Range 50 - 100 microm drawbacks with backflow and thus extended upper limit of penetration length and relatively high grouting pressure in deep rock
7 Aperture 300 - 400 microm recalculated with UF-41-10-4
Solution found theoretically backflow a little risk and required extension of upper limit of penetration length
8 Aperture 200 - 300 microm recalculated with UF-41-10-4
Solution found theoretically backflow a little risk in deep rock and required extension of upper limit of penetration length
9 Summary of the results of the calculations
74
Table 5-7 The results with the cement-based grouts at the depth of -270 - -400 meters
(Lokkila 2008)
B-hydr (mm) Depth 270-400 (m) Comments on design solution Comments
03-04 UF-41-10-3 (mix 1) Solution supported by theory
∆p 43-134 (MPa) (thicker mix better)
I 3-20 (m)
UF-41-10-4 (mix 2) Solution supported by theory Poorer solution risk of
∆p 43-134 (MPa) harmful far penetration
I 3-20 (m)
02-03 UF-41-10-3 (mix 1) Relatively high overpressure Problems in 0200 mm
∆p 64-134 (MPa) with fractures nearly
I 3-20 (m) parallel to the tunnel
UF-41-10-4 (mix 2) Solution supported by theory
∆p 46-134 (MPa)
I 3-20 (m)
B-hydr (mm) Depth 270-400 (m) Comments on design solution Comments
01-02 UF-41-10-3 (mix 1) Solution not supported by theory Problems in 0100 mm
with fractures nearly
parallel to the tunnel
UF-41-10-4 (mix 2) High overpressure Grouting holes Same as above
∆p 98-134 (MPa) outside of the tunnel profile or taking a
I 3-20 (m) risk of remaining leakages in fractures
nearly parallel to the tunnel
UF-41-12-3 (mix 3)
∆p 9-134 (MPa) Same as above Same as above
I 3-20 (m)
UF-41-14-3 (mix 4) Solution supported by theory Risk of harmful
∆p 53-134 (MPa) Relatively high overpressure far penetration
I 3-249 (m)
UF-41-12-4 (mix 5) Solution supported by theory Risk of harmful
∆p 49-134 (MPa) Possible backflow difficult in upper limit far penetration
I 3-257 (m)
005-01 UF-41-12-4 (mix 5) High overpressure Grouting holes Problems in 0050 mm
∆p 103-134 (MPa) outside of the tunnel profile or taking a with fractures nearly
I 3-20 (m) risk of remaining leakages in fractures parallel to the tunnel
nearly parallel to the tunnel
UF-41-14-4 (mix 6)
∆p 63-134 (MPa) Relatively high overpressure grouting Same as above
I 3-239 (m) holes outside of the tunnel profile or
thinner mix or silica grouting
0021-005 UF-41-14-4 (mix 6) Solution not supported by theory Problems in 0021 mm
Grouting holes outside of the tunnel with fractures nearly
profile or thinner mix or silica grouting parallel to the tunnel
∆p = grouting overpressure
I = perpendicular penetration length
75
Table 5-8The results with the cement-based grouts at the depth of -400 - -520 meters
(Lokkila 2008)
B-hydr (mm) Depth 400-520 (m) Comments on design solution Comments
03-04 UF-41-10-3 (mix 1) Solution supported by theory
∆p 58-15 (MPa) Relatively high overpressure
I 32-212 (m)
UF-41-10-4 (mix 2) Poorer solution risk of Problems in 0400 mm
∆p 57-15 (MPa) harmful far penetration with fractures nearly
I 42-285 (m) perpendicular to the tunnel
02-03 UF-41-10-3 (mix 1) Solution supported by theory Problems in 0200 mm
∆p 64-15 (MPa) Relatively high overpressure with fractures nearly
I 3-20 (m) parallel to the tunnel
UF-41-10-4 (mix 2) Solution supported by theory
∆p 57-15 (MPa) Relatively high overpressure
I 3-214 (m)
B-hydr (mm) Depth 400-520 (m) Comments on design solution Comments
01-02 UF-41-10-3 (mix 1) Solution not supported by theory Problems in 0100 mm
∆p 144-15 (MPa) Grouting holes outside of the tunnel with fractures nearly
I 3-20 (m) profile parallel to the tunnel
UF-41-10-4 (mix 2) High overpressure Grouting holes Same as above
∆p 98-15 (MPa) outside of the tunnel profile or taking a
I 3-20 (m) risk of remaining leakages in fractures
nearly parallel to the tunnel
UF-41-12-3 (mix 3)
∆p 9-15 (MPa) Same as above Same as above
I 3-20 (m)
UF-41-14-3 (mix 4) Relatively high overpressure
∆p 73-15 (MPa) Grouting holes outside of the tunnel
I 32-323 (m) profile
UF-41-12-4 (mix 5) Relatively high overpressure or
∆p 67-15 (MPa) thinner mix (backflow)
I 33-334 (m)
005-01 UF-41-12-4 (mix 5) High overpressure grouting holes Problems in 0050 mm
∆p 103-15 (MPa) outside of the tunnel profile with fractures nearly
I 3-20 (m) parallel to the tunnel
UF-41-14-4 (mix 6)
∆p 92-15 (MPa) Relatively high overpressure grouting
I 31-31 (m) holes outside of the tunnel profile or
thinner mix or silica grouting
0021-005 UF-41-14-4 (mix 6) Solution not supported by theory Problems in 0021 mm
Grouting holes outside of the tunnel with fractures nearly
profile or thinner mix or silica grouting parallel to the tunnel
∆p = grouting overpressure
I = perpendicular penetration length
76
536 Additional comments on the grouting of special cases etc
Grouting of the leaking fractures intersecting the tunnel
Post-grouting the grouting of fractures parallel to the tunnel (including all dips between
0 - 90 degrees) and the unsuccessful placement of a grouting fan (too close when a
diagonal fracture is intersected by a tunnel) are conceptually same situations
According to Fransson amp Gustafson (2007) practices for post-grouting have not been
commonly established They have studied post-groutings by analysing the data from the
Aumlspouml rock laboratory Hallandsarings and Toumlrnskog tunnels in Sweden There are very few
experiences in the deep rock Besides the grouting holes have to intersect the fractures
the fan geometry has to be designed taking into account the high pressure gradient
towards to the tunnel This may cause the erosion of grout and the limitations for the
penetration length The deeper the tunnel the greater is the importance of this point The
possibility of jacking should be taken into account and high grouting pressures are not
desired when post-grouting Fransson amp Gustafson (2007) have presented the
theoretical guidelines for designing of post-groutings
Figure 5-10 Illustration of the tendency of grout to flow back to the tunnel under a high
pressure gradient
77
Grouting of major hydrogeological structures compared to small fractures
The nature of major hydrogeological structures differs significantly from that of small
single fractures Major zones consist of complicated fracturing with the wide range of
apertures and fractures are in connection with each other when small single fractures
are typically hard to reach for characterisation
In grouting it is essential to understand that in major hydrogeological structures all the
fractures cannot be successfully sealed at the same time if aiming at somewhat limited
grout take ndash the largest fractures take the grout until they are filled enough and the
pressure starts to rise and the grout is forced to the smaller ones
The hydraulic aperture determines the volume of a fluid in a fracture and follows the
cubic law in relation to water flow This means that as the water flow (and the
transmissivity) from a fracture is doubled the possible grout volume in a fracture will
be 8 fold If comparing the grout take with a certain penetration length in a fracture with
an inflow of 01 lmin to an other fracture with an inflow of 1 lmin the grout take is
1000 times higher in the latter one Vice versa if grouting a fracture with an inflow of
20 lmin instead of a fracture with an inflow of 150 lmin the same penetration length is
reached with 02 of the grout volume in the first mentioned fracture Extremely small
grout takes are expected in the environments of small fractures and it should be
understood that a small grout take ndash even only some litres in addition to the bore hole
volume ndash could be significant and do not necessarily mean grouting in vain
54 Start and stop criteria to be applied 541 Start criteria
When selecting the grouting start criteria for a site one should take into account the
target of the total water inflow and the local leakages the priorities set for the grouting
and the characterisation methods available In the case of ONKALO the targets for the
water inflow and grouting differs significantly from those in most of the tunnelling
projects and the related aspects should be carefully considered Figure 5-11 presents
how the targets can be processed as the start criteria and which are the foreseen
drawbacksrisks in each case The grouting start criterion is based on the approach
where the remaining leakage low enough is prioritized to the grout take
78
Selection of the priorities and
start criteria for grouting
Priorities Priorities
1) Minimised water leakage 1) Minimised grout take and hole position
2) Grout take and hole position 2) Minimised water leakage
Conclusion Conclusion
Overdone grouting Frugal grouting
Slight indication of grouting need Reliable indication of grouting
and low trigger level need and relatively high trigger
level
Drawback Drawback
Unnecessary holes and amount Possibility of too high water leakages
of grout and need for post-grouting
Figure 5-11 A chart for the priorities conclusions and drawbacks for processing a
grouting start criteria
The following properties of a leaking fracturezone are to be observed
1 The leakage from the probe hole or a grouting hole (by measuring the out flowing
water)
2 The water take in a certain measuring section (by 1- and 2-packer water loss
measurement) and
3 The water flow from even a single fracture or a fracture zone (the Posiva flow log
measuring section alterable) ndash may need a hole with water infilling
The fracture orientation (the dip direction and the dip) cannot be detected with the
characterisation methods available However for the full optimisation it is an important
part With the help of oriented drill core samples the dip directions and the dips are
possible to obtain
The start criterioncriteria should be dependent on the fracture properties that are
available and independent on the fracture properties that cannot be observed
The measurements above may give different picture from the rock By measuring the
out flowing water and by the flow logging the real water inflow and the connections in
a larger scale can be observed but the result still represents only a very local point in a
complicated water channel network Furthermore the flow logging uses very sensible
equipment and problems with that in percussion-drilled holes have been encountered
The water loss measurement gives a better picture of the existing connections in smaller
area but does not necessary tell about a) the properties of single fractures and b) the
larger scale connections ndash or it is difficult to interpret from the results However the
measurement can be carried out systematically
79
With a limited number of probe or grouting holes we get only a coincidental hit on the
fracture network and the apertures of fractures Also the fully optimised grouting
should be dependent on the fracture orientation which cannot be observed ndash in the pilot
holes the orientations can be observed
It is suggested that the need for grouting should be based mainly on the water loss
measurement in the probe holes due to the nature of the measurement The method
tends to overestimate rather than underestimate the need for grouting Normally the
water loss measurement in ONKALO is done as 1-packer method Occasionally
2-packer method (1 m measuring section) is carried out if the water loss in a whole hole
has indicated the existence of the water conductive fractures The latter approach seems
to be practical in future The accuracy of the device should be adjusted to the prevailing
grouting start criteria Also the used overpressures should be revised closer to the
grouting overpressures when operating in deep sound rock The measurement of out
flowing water can serve as a complementary method to evaluate the larger connections
Although the Posiva flow log is quite sensitive method it should be utilised as a
complementary and more detailed means of getting more information of the water
conductive fracturing eg the number of fractures and their proportion of the leakages
More reliable and useful results can be obtained if using systematically unbending rods
in drilling When the information of the pilot holes is available that should be taken an
advantage of as well In core drilled pilot holes the flow logging has been accurate and
that can be used even as a main characterisation method
The trigger levels based on the current local limits for the inflowing water are presented
in Table 5-9 These trigger levels are directly applicable for Posivarsquos flow logging
method The trigger levels for other characterisation methods can be calculated from
this value The trigger levels are determined in the same way nowadays but here
presented also for the deeper sections The value 50 mlmin is transformed into the
Lugeon values for the lengths of 1 m and 20 m at different depths in Figure 5-12 The
Lugeon limit for 20 m refers to the measurement of the whole probe hole and the 1 m
Lugeon limit is given for the measurement with the two-seal packer The Lugeon limit
set for 20 m measuring length should be used in order to decide whether to do the two-
seal packer test or not The results of the two-seal packer test should be used when
deciding the need for grouting and selecting the drilling pattern and the grouting
parameters The measurement itself is simple but the water flow expected is too small
for the measurements accurate and reliable enough The principle of the test seems to be
appropriate and the test should be developed further The trigger level transformed into
a form of hydraulic aperture of a single fracture is presented in Figure 5-12
80
Table 5-9 The trigger levels in use in ONKALO
Area hole Trigger level 1 Trigger level 2 Trigger level 3
Depth level between R19 and R20
Pilot holes
Single leakage
Leakage from the hole
Probe holes
Single leakage
Leakage from the hole
Other holes
Single leakage
Leakage from the hole
-
-
-
50 mlmin
-
50 mll
50 mlmin
5 lmin
50 mlmin
-
-
100 mlmin
150 mlmin-
15 lmin
-
15 lmin
-
15 lmin
Below R20
Pilot holes
Single leakage
Leakage from the hole
Probe holes
Single leakage
Leakage from the hole
Other holes
Single leakage
Leakage from the hole
-
-
-
50 mlmin
-
50 mll
50 mlmin
5 lmin
50 mlmin
-
-
100 mlmin
100 mlmin-
10 lmin
-
10 lmin
-
10 lmin
1) Trigger level for detailed measurements
2) Trigger level for actions to control the leakage eg pre-grouting
3) Trigger level for effective actions to control the leakages
0000
0001
0002
0003
0004
0005
0006
0007
0008
0009
0010
0011
0012
0013
0014
0015
0016
0017
0018
0019
0020
240 260 280 300 320 340 360 380 400 420 440 460 480 500 520
Depth (m)
Lu
ge
on
valu
e (
Lu
g)
Lug-20 m
Lug-1m
0
2
4
6
8
10
12
14
16
18
20
240 260 280 300 320 340 360 380 400 420 440 460 480 500 520
Depth (m)
Hydra
ulic
ap
ert
ure
(micro
m)
The trigger level 50 mlmin transformed into 1 m and 20 m
Lugeon values as a function of the depth
The trigger level 50 mlmin transformed into hydraulic aperture of
one fracture as a function of the depth
Figure 5-12 The trigger level 50 mlmin transformed into 1 m and 20 m Lugeon values and into a hydraulic aperture (one fracture) as a
function of the depth
81
82
55 Stop criteria
Originally based on a few decades work Gustafson amp Stille (2005) have presented that
the time can be used as a stop criterion in grouting This statement is based on the
analytical approach developed by Swedish Chalmers University of Technology and
Royal University of Technology in close cooperation of SKB Here this analytical
approach and the related stop criteria are also called Grouting Time ndashmethod (GT)
Both the experiences from the construction of ONKALO and the grouting field tests
made within the project revealed a challenge with grouting time -method The time as
such is an insufficient factor to guarantee the successful grouting result with all the
targets set for ONKALO because of the ambiguity of the input data (fracture
characteristics and grout properties) and the sensitiveness of the model
Even a relatively small error in eg interpretation of the fracture characteristics or the
mix properties may deteriorate the design and consequently the time cannot be used as
a stop criterion alone The aim at optimising the sealing result and the grout take will
require a way to verify during the grouting that the design will remain valid for the
prevailing fracture conditions
Therefore it is suggested that in addition to the calculation of the ideal design
parameters (the grout mix the grouting pressure and the pumping time) according to the
GT method the grout flow is included in the system The prognosis of grout take can be
easily calculated When this is linked to the time the prognosis of grout flow can be
done Since there is always a potential risk to have an excessive inaccuracy in the source
data (the hydraulic aperture the grout properties etc) the grout flow should be used to
verify that the design andor the assumptions are accurate enough
By linking all the five parameters together and monitoring the flow rate and the grouting
time we can either verify that the assumptions were correct and the design is valid (and
continue grouting as designed) or conclude that the assumptions were not correct and
the design is not valid (and abandon the design and change to another) From now on in
this document this application is called the GTF -method referring to the words
ldquoGrouting Time amp Flowrdquo However the time has to be kept with in the stop criteria
since the flow rate may be under the measuring accuracy of the grouting equipment and
the time is then the only way to control the grouting
Due to the variation in the source data and the fact that the fluctuation of the grouting
pressure is unavoidable and that has a significant effect on the flow rate the tolerances
should be wide enough not to lead to the unworkable situations too easily
Figure 5-12 presents an illustration of a predicted flow rate with the tolerances
according to which the grout flow should take place if assumptions in the design were
accurate enough
83
H=-270-320 b=51hellip100 microm
0
2
4
6
8
10
12
14
16
18
00000 01500 03000 04500 10000 11500 13000 14500 20000
Grouting time
Gro
ut
flo
w (
dm
3m
in)
Figure 5-13 An example of the predicted flow in a fracture of 51 - 100 microm located at
the depth of -270 - -320 m The yield strength of the mix is 14 plusmn4 Pa and the viscosity of
the mix is 14 plusmn6 mPas The grouting pressure is 15 MPa
84
85
6 DISCUSSION AND SYNTHESIS
61 Grouting design
The studies made within the project and the suggestions for the future are strictly based
on the current design requirements and the existing trigger levels for the controlling of
the water inflow Some of them were analysed further in the R20 programme but the
significant changes to the design requirements were no made due to the R20
programme The design requirements which originate from the long term safety of the
repository include demanding targets for the water inflow and eg the amount of the
cement That will impose challenges for the working methods the procedures and the
equipment Some design requirements are contradictory which means that the
optimisations are needed The existing targets require that very small fractures should
be sealed The major water conductive fracture zones in the access tunnel and the shafts
have to be sealed as well The high water pressures will be an additional challenge
The data of the transmissive fractures observed in the deep drill holes was studied in
order to recognize the conditions specific to the Olkiluoto site This data was then
studied with the targets for the water inflow and the grouting set for ONKALO and used
in the study of the grouting design solutions It was observed that the averagely
fractured rock differs significantly from the fractured zones in terms of transmissivity
and fracturing The fractures with the hydraulic aperture of over 50 - 100 microm are very
sparse The fractures with the significant hydraulic importance are predominantly gently
dipping
The literature study to find a suitable way to handle the stop criterion for the grouting
which is a key issue in the optimisation was performed The study revealed an
approach which has been developed in Sweden in the cooperation with SKB CTH and
KTH and that turned out to be better tool for the optimisation than the other
alternatives The theory is presented in the context of the time stop criterion and is here
also called the ldquoGrouting Timerdquo -method (the GT method) The method applied is
analytical and very simple The approach does not conform with the Finnish norms for
the grouting but it is however the only one so far that connects all the design
parameters together (the mix properties the grouting pressure the fracture
characteristics the desired penetration length and the pumping time ndash and in some cases
also the grouting hole density) As a comment on the model is that the link between the
parameters characteristic grouting time and the theoretical maximum penetration length
is not fully clear The experiences of the method are limited but the deviations from the
national norms are quite small the only new source parameter is the viscosity of the
grout and the only new parameters in the grouting design will be the use of the pumping
time (under maximum pressure) It is assumed that the method ndash and the approach to the
grouting presented ndash is in the beginning of its evolution and more developed versions
will be available in the future As an additional comment on the design parameters
practically because we are operating in the very deep and sparsely fractured rock the
grouting hole density cannot be linked to the design parameters as presented by
Gustafson amp Stille (2005) ndash the design of the grouting hole drilling pattern is more a
matter of probabilities This will be discussed more in details later
86
The penetration length of a grout is highly dependable on the hydraulic aperture of
fractures and considerably to the yield strength and the viscosity of the grout as well as
to the grouting overpressure The accurate determination of these parameters is
important and full compliance with the grouting design is essential during the grouting
work The model and some investigation methods take into account only the fractures
and the transmissivitiesapertures that are intersected by a probe or a grouting hole
There surely are additional fractures and connections that are not detected in the holes
Also the pressure fall in the fractures is one uncertainty and poorly understood One
way to take this into account is to use safety factors in the design (for the penetration
length) The safety factor to suite in all the instances cannot be established
The GT method and the Olkiluoto site data were used in the feasibility study of the
design solutions In order to reach the set targets for the grouting it was decided that the
optimal design solution that meets the target shall include the following components
The grouted areas are targeted as currently stated in the design requirements and
other ONKALO specific instructions
The use of the available low pH grouts (cementitious used in this study) and
The grouting holes inside the tunnel profile and the limited grout penetration
length in order to minimise the risks to the disturbances due to the cement
The study was done only for 1-fracture systems since the similar approach is applicable
for multi-fracture systems The 1D and 2D models were used in calculations but the 2D
was used for drawing the conclusions In certain conditions the grout flow can be
3-dimensional as probably happened in the second grouting test The only way to get
enough good picture of the dimension of the grout flow in is to analyse the
dimensionality of the flow observed in the real grouting operations That feedback could
be a basis for optimising the grouting design further
Those calculations resulted in the support of the optimal design solution by the theory
for the fracture apertures of 100 microm in the tunnel in the depth level range -270 - -400 m
Below the depth level of -400 m the fracture limit found in this project was 200 microm
Below those aperture limits the designer could consider the following divert the
grouting holes outside the tunnel profile raise the grouting pressure relatively high
(which may be compensated partially by using longer pumping times) or use even
thinner mix (colloidal silica or cementitious grout) than currently available The last
meets the set targets best The strength development of the thin mixes may be slower as
observed in eg the grouting tests On the other hand even thicker grouts are
recommended in the environment of large fractures and high groundwater pressures
However the fractures with the hydraulic aperture of more than 50 - 100 microm are very
sparse and thus the optimal design solutions can be used seldom
The field tests revealed problems in using only the grouting time as the stop criteria If
there is any uncertainty in the source data or the made assumptions the time is set in
wrong basis and that cannot be observed during the grouting The accuracy of the
available fracture and the mix properties is not enough to use the grouting time solely as
a stop criteria The grout flow should be incorporated to the system and it is
recommended that it is used as a part of the stop criteria The grout flow is simple to
87
predict via the expected grouted volume at the certain moment of time Analytical
expressions presented in the literature are available to make these predictions Because
the system is sensible to the fracture aperture and the rheological properties of the
mixes and the grouting pressure cannot be kept constant all the time the tolerances for
the grout flow should be accepted as well
The current trigger levels for the starting the means a need for the use of colloidal silica
in the deep rock There is no practical experiences to prove that very small fractures can
be sealed with cementitious grouts
Pre-grouting is proposed as a primary measure as done this far Some of the grouting
can be handled with typical designs adjusted to the site-specific conditions and that will
disrupt the tunnel drifting the least That is supposed to apply for the most of the access
tunnel The exceptions in the access tunnel might be a) the situations when a leaking
fracture or a fracture zone is parallel to the tunnel or that intersects the drift in a way
that it will lead to redirect the grout hole pattern to intersect with the fracture(s) or
b) the situation of unexpected condition that has not been prepared beforehand for
In a multi-fracture system the way to optimise the grout take is to have two or more
grouting rounds This well-known technique which is strongly recommended in multi-
fracture systems is also called as split spacing ie the wider fractures are sealed first
with thick grout and new grouting holes are then done to seal the smaller apertures with
thinner mix This is essential to understand in order a) to diminish the grout take and b)
to accelerate the strength development of the grout
The grouting of the hydrogeological structures RH19 and RH20 should be designed
separately ndash when met in the access tunnel andor the shafts since the structures have
structure specific features in the hydrogeological environment in the ONKALO area and
due to their orientation However the design principles presented in this work are more
or less applicable to all the structures with the same kind of characteristics The RH20
structure is gently dipping which will be an extra challenge in the access tunnel
The design principles in the tunnel will not apply for the shafts as such since the
grouting should be done in very long sections ndash nearly 100 m Operating too close to the
shaft cross cuts or the tunnel may impose a need to grout with lower pressures to avoid
undesired by-pass connection into the tunnel or hydraulic jacking
The post-groutings should be designed also individually Its worth to realize that when
operating close to the tunnel walls the water gradient and consequently the grout flow
is strongly towards the tunnel Practically this means that eg the post-grouting holes
shuold be taken relatively far away from the tunnel walls In the case of post-grouting
the wider the leaking fracture is the denser the grouting holes should be and the further
away from the tunnel walls they should be located
88
Briefly the grouting design in the future should include the following parts
1 Design basic data and the calculations
2 Start criteria for grouting expressed in the terms of used characterisation methods
3 Design for the criteria to select suitable drilling patterns among a selection of them
for different purposes and determination of the cases when the typical drawings
cannot be used
4 Design for the criteria to select a grout mix (among many) the criteria to accept the
mix in use and the corresponding stop criteria which includes the grouting pressure
the pumping time the grout take and the predicted grout flow with reasonable
tolerances The grout flow should be used to verify if the design is valid or not
None of the parameters should be used alone
5 Design for the actions if the grout take and the flow during a predetermined
pumping time do not correspond with the predicted ones (considering the
tolerances)
6 Design for controlling the grouting result before the excavation (not applicable for
post-groutings) and the actions if the result is not obtained and
7 Design for the details such as determining a hole totally tight or eg filling of the
grouting holes in the environment of small fractures before the actual pumping
under the high pressure is started or for example the removal time of packers
There are some characterisation methods that can be used to estimate the groutability of
the rock The water loss measurement proved to be unfailing in various conditions and it
can be done systematically The more detailed picture of the rock can be obtained if
using 2-seal packers instead of 1-seal packer system The interpretation of the water loss
measurement results is important in order to understand the nature of the hydrological
environment ndash in certain cases the maximum Lugeon value does not indicate the need
for grouting As a complementary method the Posiva flow log is recommended since it
makes it possible to observe the properties and the number of single fractures The start
criteria for the grouting should take both of these into account and the set criteria for the
different methods should be mathematically in line with each other In order to get a
better picture of the rock to be grouted the pressures used in the water loss
measurement should be raised closer to those applied in the grouting Straight holes free
of the drilling cuttings and other debris are essential to assure high quality flow log data
In principle two basic drilling patterns in the access tunnel should be sufficient one
with the holes outside the tunnel profile and one with the holes inside the tunnel profile
In practice more drilling patterns will be needed since the excavation profile varies and
there are the shafts and other rooms that require special drilling considerations The
optimal grouting hole density cannot be set A suitable density shall be found with
practical iteration Even in the case of an extremely dense drilling pattern there is a good
chance to miss the water channel and not to detect it A denser drilling pattern will be a
remedy to reduce this risk In the second grouting field test it was observed that even 1
m grouting hole density did not give the picture of the rock reliable enough
The location of grouting holes turned out to be more complicated thing than expected If
the intention of turning the grouting holes inside the tunnel profile is to diminish the
grout remaining in the rock after excavation the following things are to be happened in
89
principle we can ldquowasterdquo with the number of holes in order to find the water channels
But at the same time we will need higher grouting overpressures and pumping times to
reach the same penetration length of grout Also if the grouting holes are parallel to
each other certain fracture directions are not hit Besides this room for the grouting
holes in possible next grouting rounds and for blasting holes should be saved This
means that there is a limit for the highest grouting hole density and thus eg two
grouting rounds with the holes inside the tunnel profile should be the maximum If the
grouting holes will be diverted outside the tunnel profile every hole increases
significantly the amount of the grout remaining in rock after excavation ndash especially in
the case of small fractures If the grouting hole density is too high there is a risk that the
grout squeezes out from the next grouting holes This can be a problem if operating
with the leaking hole cannot be started soon ndash the grout starts to set and the grouting
hole could be wasted
A collection of cementitious recipes studied (non-accelerated and accelerated) exists
The pH rate of cementitious grouts is not of importance from the point of view of the
grouting techniques The rheology the penetration ability and the strength development
are the key factors leading to successful grouting Since the penetration length is very
sensible to the rheological properties of the grout the quality control in the work site is
important Besides the penetration ability is a key issue especially in small fractures
and should be controlled carefully before the grouting Also it should be emphasized
that when designing the grouting the observations of the mix properties from the field
conditions should be used instead of those from the laboratory The beaker test did not
work as a method to follow the early age strength development of cementitious grouts
because the conditions prevailing in rock differs significantly from those in a tunnel
The grouting of small fractures differs from the grouting of the larger ones In order to
reach the same penetration length for the grout the grout take is high in large fractures
whereas it is extremely small while grouting very small fractures Only a few litres of
grout will be enough to seal the small fractures Thicker mixes than available for the
moment are recommended for grouting of large fractures eg in the environment of the
hydrogeological structure RH20 The selection of the mixes should be wider The
grouting of very small fractures will probably require more mixes than currently proven
by the tests The field tests were done with the non-accelerated low pH grouts Recently
the also accelerated mixes has been used This does not void the studies presented in
this report ndash the basic concept do not suffer essentially
Many practical hints for operating with colloidal silica were obtained in the pilot field
These apply to eg its sensitivity to impurities in the mixers the accelerator quality and
the dosing the practical range of the operating time the operating time considerations
when designing the grouting and the work phases the storage of the components etc It
was hard to remove all the silica from the grouting holes (in order to fill them with the
cement paste later) Because the content of the accelerator has a great impact to
behaviour of the colloidal silica and the practical operation times the question how to
seal relatively large fractures under high water pressures with this material aroused In
order to get the material to gel fast enough the accelerator content should be relatively
high which means that the practical operation time for the grouter will be very short
The beaker test did not work as a method to follow the early age strength development
90
of colloidal silica because the conditions prevailing in rock differs significantly from
those in a tunnel
It was also observed that the lack of understanding in the meaning of the pumping time
under the maximum design pressure leads to following mistakes the smallest fractures
will not be sealed and some holes that actually intersect water leaking fractures are
wrongly interpreted as tight holes and they remain only partially filled with grout This
kind of misconception has probably been the main reason for the relatively high
proportion of unfilled grouting holes between the tunnel chainages 0 - 1850 The filling
of the grouting hole prior to pressurizing proved to be a useful and practical solution
avoid this misinterpretation The filling save time for the pumping and this is important
to do when the mix properties do not change significantly
The recommendations for grouting pressures vary a lot in the literature Based on the
field tests the recommended grouting pressure is a below the limit for hydraulic
uplifting However this results in relatively high grouting pressures at the great depths
What happens to the grouting pressure in rock and in the boundary of water and grout is
not understood and could not be studied in this project However these are phenomena
which affect the grouting result for sure The rock mechanical effects of the high
grouting pressures are poorly understood area
It is clear that the full solution for the optimised grouting is not done in the office and
with the recommendations given above It is necessary that besides the designer the
grouting crew understand the contents of the design and can ldquoreadrdquo the rock response
obtained during the grouting and react to it if the grouting is not proceeding as planned
due eg the uncertainties related to the bedrock data Even though an important step in
the grouting design can be taken the grouting work itself should involve a semi-
activerdquo design during the work However the rules for this semi-active grouting design
during grouting should be determined beforehand and expressed in the design
The grout flow in the small fractures will be so slow that the current flow meter in
Posivarsquos grouting equipment cannot record it anymore This may result in difficult
situations for the grouting crew because they should verify the grout movement by
making the indirect observations eg from the piston movements The flow meters
should be able to detect flows in the accuracy of 001 lmin if willing to observe the
progress of the grouting of the smallest fractures By the same token it should be
possible to record the high grout flow rates as well
62 Grouting work
The accuracy of the flow meters of the water loss measurement device and the grouting
equipment were insufficient when grouting small fractures as targeted in ONKALO
All possible efforts to improve the accuracies should be made
In order to reach the penetration length of the grout as designed the transmissivities and
hydraulic apertures of the fractures should be able to be determined as accurately as
possible Besides the development of the water loss measurement the use of unbending
rods in drilling should be considered in order to enhance the possibility to get the
91
reliable results The holes will be straighter and thus more investigations (the Posiva
flow log) can be carried out and more detailed source data can be obtained Also the
grouting result will be better because the holes are located as planned
The datasets between reliable flow loggings and corresponding sets of the MWD data
gathered for interpretation with the Rockma software were compared No correlation
was found The algorithms in the Rockma software should be at least calibrated
However it is possible that the MWD data cannot be used in deep and tight conditions
like in ONKALO
In the first grouting test the importance of the excavation damage zone (EDZ) was
experienced in the grouting work The EDZ cannot be avoided and thus it should be
managed The practical solutions for this are eg to inform the grouting designer about
possible deviations from the extent of the EDZ normally experienced (eg due to
reblastings) and selecting the packers long enough for water loss measurements and
grouting That will prevent the EDZ from disturbing the successful grouting
It is good to start the grouting far enough (several metres) from the fracture targeted
since we cannot observe its orientation However no definite basis to specify the
distance was obtained
The following investigations aiming at selecting a suitable design or designing the
grouting should be carried out observing the leaking fractures on the rock surfaces and
measuring the water out flow and the water losses in probe holes or in grouting holes
and to carry out the flow logging if possible In order to avoid unnecessary time losses
on the water loss measurements it is recommended that first the hole is measured in the
full length and if the trigger level is exceeded (indicates the possibility that the local
trigger levels may be exceeded) then to measure the water losses in 1 m sections along
the hole The first measurement could be carried out applying several over pressures to
observe the nature of the hydraulics around and the latter measurement could be done
with a uniform pressure
Based on the design approach presented in the previous Section the progress of the
grouting work should happen by as follows
1 Obtain the characterisation results (the water losses the flow logging the water
outflow) from the probe holes and the fracturing
2 A geologisthydrogeologist to interpret the results (in terms of transmissivities and
hydraulic apertures)
3 Selecting the drilling pattern based on the set criteria ndash if the leaking fracture
intersects the drift then change the orientation of the grouting holes
4 Investigate the grouting holes (the water losses the flow logging the water out
flow)
5 Read the results got from the grouting holes and select the suitable design
according to the largest fracture group that determines the actions in the first
grouting round if several rounds are needed
6 Fill the holes in the ldquotightrdquo rock
92
7 Start the grouting according to the instructions taking into account also the quality
criteria set for grout mixes the grouting of holes should start by filling them
8 Measure the grout take time and flow
9 If grouting progresses as planned (observed by the grout flow and its tolerances)
continue up to the end if not then change to the other typical design having a
different mix and the new design parameters
10 Follow the early age strength development of the grout and release the packers
according to the design
11 When grout is set enough verify the grouting result with the control holes the
acceptance criteria is similar to the starting criteria and
12 If the result is within the acceptance criteria then continue the excavation if not
then the control holes are used as new probe holes and the process goes back to the
step 1 until the target is reached
Both the fracture properties and the mix properties are the input data for the grouting
design In order to reach correct adaptation of the design the mix properties should be
controlled before grouting
Even though the objective in this work was to define reasonable low grouting pressures
the increase of the grouting pressures will probably be needed This should be taken into
account when selecting the packers When grouting small fractures custom made
packers that can be used for the filling of holes first and then continuing the grouting
pumping directly should be taken into use
It would be a benefit if several grouting holes could be grouted at the same time with
no significant pressure differences in nearby grouting holes If considering the
connection of the grouting holes to the same grouting line the pressure increase and the
grout flow should be followed and controlled separately for every hole because the
grout flows to the easiest way (the law of the smallest resistance)
The grouting with accelerated mixes and especially with colloidal silica should be
trained more because there are limitations concerning the time frame the material
properties remain within workable limits
The prevailing circumstances together with the strict requirements lead to the fact that
measuring accuracy of the flow meters (the water loss test and the grout flow) are not
sufficient The flow meters should be able to detect the flows in accuracy of 001 lmin
The automatization of the grouting should be considered since it facilitates the work
As stated earlier even thought carefully designed the grouting work is partly empirical
and requires the design-as-you-go ndashthinking The grouting crew should be competent
enough to understand the content of the design and also to change the design according
to the predetermined guidelines when necessary Thats why the crew should be trained
for all the actions presented above
93
7 CONCLUSIONS AND RECOMMENDATIONS
The water inflow target have been obtained in the first two km of the access tunnel of
ONKALO The grout take in the first km has been relatively high and a significant part
of the grouting holes has been unfilled The rock characterisation for the grouting
purposes has been difficult in deep and tight bedrock and more challenges will be met
when going deeper The traditional water loss measurement appeared to be the most
practical method even though the measurement accuracy should be improved the
overpressures should be revised and interpretation of the results should be trained more
The flow logging and the water loss measurements with 2-seal packer are recommended
to search for single fractureszones The geological mapping of the tunnel drift could be
utilized better in the grouting design
Due to the long term safety reasons the new grouting materials (low pH grouts and
colloidal silica) should be taken into use and further optimisations of the grout take
should be done The norms and standards do not give enough guidelines for the
optimisation and new tools were searched for Fortunately this kind of research and
development has been done and the Swedish Grouting Time -method proved to be the
most developed approach to study the grouting parameters the grout properties the
grouting pressure the penetration length aimed and the pumping time The approach
was further developed and so called Grouting Time amp Flow -method with the inclusion
of the grout flow monitoring to overcome uncertainties in the bedrock data is
recommended for ONKALO The original suggestion ndash to use the time solely as a stop
criterion ndash do take into account the uncertainties and the variations related to the source
fracture data and thus the grout flow is necessary to prove With it we can indirectly
observe if the used assumptions in the design were sufficiently close to the real ones
Hopefully the model will be developed further in the future and the design and the
grouting work could then be iteratively developed as more experiences are gained
The re-evaluation of the current trigger levels for starting the grouting are
recommended since the levels have a remarkable effect on the construction and the
every days practices Pre-grouting is recommended to be the main way to seal the rock
In order to enable fluent and cost efficient tunnel driving the use of typical designs for
the expected rock conditions is recommended The major structures like the RH19 and
the RH20 the shafts the post-groutings the cases where a leaking fracture intersects the
tunnel drift should be designed individually According to the study performed the
fractures down to the hydraulic apertures of 100 - 200 microm can be sealed with the
cementitious low pH grouts and having the grouting holes inside the tunnel profile (to
minimise the grout remaining in rock) However these fractures occur very sparcely in
the ONKALO bedrock and usually the alternative design solutions have to be searched
Those are the use of colloidal silica instead of cementitious grouts the grouting holes
outside the tunnel profile or having high grouting pressures Out of these choices the
use of colloidal silica and the grouting holes outside the tunnel profile are
recommended The development of thicker cementitious grouts for intersection of the
major hydrogeological structures is recommended
94
The implementation of the development work requires the following actions
Design basis investigation and design procedure should be revised
Design contents and form should be revised
Grouting procedure and certain details should be revised
Accuracy of the flow meters is recommended to be improved
Water loss measurement should be developed further
Education for designers and grouters should be organised
Systematic data gathering would enable further development of grouting and
Grouting experiences should be evaluated as an every days part of grouting design
work and the increased know-how should be taken in use fluently
The following details are emphasized in this Chapter and more detailed
recommendations can be found in Chapter 6
The penetration length and penetration ability of the grout is sensible to the
hydraulic aperture of the fractures the rheological properties of the grout and the
grouting overpressure The focus in the rock characterisation the grout quality
control and the execution of the grouting should lay on these factors
The follow of the grout flow is recommended to be the most important part to
verify the applicability of the grouting design
The model to measure the groutings does not take into account the fractures that do
not intersect a probe hole or a investigation hole The water loss measurement
should be developed further and the understanding and the utilization of the results
obtained from the results should be increased
The grouting overpressure prevailing and the fall of the pressure in the rock is
poorly understood The rock mechanical effects caused by the grouting pressure are
not understood enough and should be studied further
In the case of multi-fracture systems the grouting should start by sealing of the
largest fractures with relatively thick mixes As the sealing occurs the grouts
should be thinned in the possible next grouting rounds The expected grout take
varies a lot depending on the rock conditions Very small grout takes do not
indicate grouting in vain
The determination of the location and the density of grouting holes are and will be
empirical and the optimum should be iteratively found until better characterisation
methods will be in place Some holes intersect the fractures and some do not The
unnecessary drillings cannot be avoided fully The use of the grouting holes inside
the tunnel profile appeared to be more complicated that expected Only the most
largest fractures can be grouted with that kind of drilling patterns
It is recommended to extend the current selection of the grout mixes to cover
thinner cementitious mixes and colloidal silica for the smallest fractures and thicker
mixes for the largest fractures The quality control in the field should be organised
to keep the uncertainties related to the mix properties under control
Because very small fractures should be sealed and relatively high grouting
overpressures will be needed the packers should be adjusted to the new suite
The occupational safety should be taken into account (the length of packers the
distance to the fracture to be grouted)
95
The better accuracy of the flow meters is recommended since the requirements
concerning the water inflows are so tight and
In principle the working cycles would be the same when grouting small and large
fractures When grouting small fractures the filling of the grouting holes before the
actual grouting (raising the pressure) should be a common practice This should be
taken into account when selecting the packers
Colloidal silica should be studied and tested more The removal of the silica from
the grouting holes should be developed further
In order to go further in optimising of the grouting the development of the probe
hole characterisation methods and the accuracy of the measurement devices is
recommended The geophysics and geostatistics may give the new possibilities in
addition to the existing ones If the variation of the fracture apertures and the
fracture orientation can be observed some day a new significant step for the more
optimised grouting can be taken
96
97
REFERENCES
Ahokas H Hellauml P Ahokas T Hansen J Koskinen K Lehtinen A Koskinen L
Loumlfman J Meacuteszaacuteros F Partamies S Pitkaumlnen P Sievaumlnen U Marcos N
Snellman M amp Vieno T 2006 Control of Water Inflow and Use of Cement in
ONKALO after Penetration of Fracture Zone R19 Posiva Oy Olkiluoto Finland
Working Report 2006-45
Axelsson M 2006 Strength Criteria on Grouting Agents for Hard Rock - Laboratory
studies performed on gelling liquid and cementitious grout Licentiate Thesis Chalmers
University of technology Goumlteborg Sweden
Bergman S amp Nord G 1982 On adequate tightening of tunnels Swedish Rock
Engineering Research Foundation ndash BeFo Stockholm Sweden (In Swedish)
Brantberger M 2000 Metodik vid foumlrinjektering I uppsprucket haringrt berg Licentiate
Thesis Royal Institute of Technology Stockholm Sweden
Concrete Association of Finland 2006 Grouting of Rock Facilities Helsinki Finland
Working Instruction BY53 (In Finnish)
Fransson Aring 2001 Characterisation of Fractured Rock for Grouting Using
Hydrogeological Methods Chalmers University Of Technology Department of
Geology Goumlteborg Sweden
Fransson Aring amp Gustafson G 2007 Efterinjektering Inlaumlckageprognos och design ndash
foumlrslag till analys Swedish Rock Engineering Research Stockholm Sweden SveBeFo
Rapport 75 (In Swedish)
Funehag J 2007 Grouting of Fractured Rock with Silica Sol Grouting design based on
penetration length Chalmers University of Technology Department of Civil and
Environmental Engineering Goumlteborg Sweden
Gardemeister R Johansson S Korhonen P Patrikainen P Tuisku T amp Vaumlhaumlsarja
P 1976 The application of Finnish engineering geological bedrock classification
Techical Research Centre of Finland Geotechnical laboratory Espoo Finland
Research note 25
Gustafson G 2005 Tn 050928 Rev 051003 Considerations on grouting pressure
(Non-checked reference from Concrete Assosiation of Finland 2006)
Gustafson G amp Claesson J 2004 Steering parameters for rock groutingSubmitted to
the International Journal of Rock Mechanics and Mining Sciences In prep
Gustafson G amp Stille H 1996 Prediction of groutability from grout properties and
hydrogeological data Tunnelling and Underground Space Technology Vol 11 No 3
pp 325-332
98
Gustafson G amp Stille H 2005 Stop Criteria for Cement Grouting Felsbau Zeitschrift
fuumlr Geomechanik und Ingenieurgeologie im Bauwesen und Bergbau Vol 23 No 3 pp
62-68
Hakami E 1995 Aperture Distribution of Rock Fractures Division of Engineering
Geology Department of Civil and Environmental Engineering Royal Institute of
Technology Stockholm Sweden Doctoral Thesis p 22
Hansen J Vuorio M Koskinen K Juhola P Vuorinen U Sievaumlnen U Raivio P
amp Karttunen P 2008 Groundwater Inflow Management in ONKALO ndash The Future
Stategy Posiva Oy Eurajoki Finland Working Report 2008-44 (to be published)
Hellauml P Vaittinen T Saksa P amp Nummela J 2004 Statistical analysis and
modelling of Olkiluoto structures Posiva Oy Olkiluoto Finland Working Report
2004-58
Hellauml P Ahokas H Palmeacuten J amp Tammisto E 2006 Analysis of geohydrological
data for design of KBS-3H repository layout Posiva Oy Olkiluoto Finland Working
Report 2006-16
Hollmeacuten K 2007 R20 programme The development of grouting technique ndash Stop
Criteria and Field Tests Posiva Oy Olkiluoto Finland Working Report 2007-101
Houlsby A 1990 Construction and Design of Cement Grouting John Wiley and Sons
New York The United States of America
Haringkansson U 1993 Rheology of Fresh Cement-Based Grouts Royal Institute of
Technology Stockholm Sweden Doctoral Thesis
Haumlssler L 1991 Grouting of Rock ndash simulation and classification Doctoral Thesis
Royal Institute of Technology Stockholm Sweden
Lehtinen amp Hirvonen 2007 Monitoring Waterleakages and Results of Watersampling
from the Leaking Structures and Fractures after Grouting in ONKALO 2005-2006
Posiva Oy Olkiluoto Finland Working Report 2006-28
Lokkila M 2008 Flow of Bingham and Newtonian fluids in hard rock- application for
ONKALO University of Helsinki Department of Physics Helsinki Finland Masters
thesis
Lombardi G 1997 GIN principle revisited Water Power amp Dam Construction
October 1997 pp 33-36
Lombardi G amp Deere D 1993 Grouting Design and Control Using the GIN principle
Water and Power and Dam Constructions June 1993 pp 15-22
Posiva picture archives httpwwwposivafi
99
Ranta-Korpi R Karttunen P amp Sievaumlnen U 2007 R20 programme Field testing of
grouting materials Posiva Oy Olkiluoto Finland Working Report 2007-102
Reiman M Poumlllaumlnen J amp Vaumlisaumlsvaara J 2006 Flow measurements in ONKALO at
Olkiluoto Probe holes and ONK-KR1 ndash ONK-KR4 ONK-PVA1 and ONK-YPPL18
Posiva Oy Olkiluoto Finland Working Report 2006-65
Riekkola R Sievaumlnen U amp Vieno T 2003 Controlling of Disturbances due to
Groundwater Inflow into ONKALO and the Deep Repository Posiva Oy Olkiluoto
Finland Working Report 2003-46
Sievaumlnen U 2002 Groundwater inflow and grouting conditions at the Olkiluoto site
Eurajoki western Finland Licenciate Thesis University of Helsinki Helsinki Finland
Sievaumlnen U amp Riekkola R 2003 Controlling of Groundwater Inflow into ONKALO
and the Deep Repository at Olkiluoto Summary Report Posiva Oy Olkiluoto Finland
Working Report 2003-51
Vaittinen T Ahokas H Heikkinen E Hellauml P Nummela J Saksa P Tammisto
E Paulamaumlki S Paananen M Front K amp Kaumlrki A 2003 Bedrock model of the
Olkiluoto site version 20031 Posiva Oy Olkiluoto Finland Working Report 2003-43
Vaittinen T Nummela J amp Tammisto E 2007 Expected occurence of the
transmissive fractures at the repository level for grouting design purposes Posiva Oy
Olkiluoto Finland Working Report 2007-87
Vieno T Lehikoinen J Loumlfman J Nordman H Meacuteszaacuteros F 2003 Assessment of
Disturbances Caused by Construction and Operation of ONKALO Posiva Oy
Olkiluoto Finland Posiva Report 2003-06 ISBN 951-652-120-7
Oumlhberg A Rouhiainen P 2000 Posiva groundwater flow measuring techniques
Posiva Oy Olkiluoto Finland Working Report 2000-12
100
101
APPENDIX 1
102
103
104
105
106
107
APPENDIX 2
108

2
3
LIST OF ABBREVIATIONS
b = hydraulic aperture (m)
EBS = Engineering Barrier System
EDZ = Excavation Damaged Zone
FT = field test
GTF method = ldquoGrouting Time amp Flowrdquo -method
g = gravitational acceleration (ms2)
GIN method = Grouting Intensity Number -method
GT method = ldquoGrouting Timerdquo ndashmethod also so called time stop grouting
H = depth below ground surface or groundwater table (m)
I = penetration (m)
ID = relative penetration
Imax = maximum penetration (m)
IMA = project concerning the development of low pH cementitious
grouting materials
INKE = project concerning the development of grouting technology
IPA = project concerning the long term safety of grouting
K = hydraulic conductivity (ms)
L = length measuring length (m)
Lug = Lugeon value (dm3(MPa min m))
MWD = Measure While Drilling
OFW = outflow of water (method)
OL-KR = deep drill hole
PFL = Posiva flow log (method)
PH = pilot hole
pg = grouting pressure (Pa)
PL = chainage (m)
PR = bore hole
pw = groundwater pressure (Pa)
∆p = overpressure (Pa)
Q = flow rate (m3s)
R0 = radius of groundwater flow (m)
R = radius of a hole or a tunnel (m)
RampD = research and development
RH = hydrogeological structure such as RH19 or RH20 The names vary
in different hydrological or geological models (Eg R19 HZ19)
made for different purposes
S = spacing (m)
SKB = Svensk Kaumlrnbraumlnslehantering AB
SP = subproject
SPL = superplasticizer
t = time (s)
tD = relative grouting time (dimensioless)
tg = gel induction time (s)
tmax = maximum characteristic grouting time (s)
T = transmissivity (m2s)
4
UF = Ultrafin 16 cement
V(1D) = grout intake in 1D system (channel)
V(2D) = grout intake in 2D system (planar fracture)
w = width (of the channel) (m)
WDM = water to dry material ratio
WLMint = interpreted water loss (Lug)
WLMmax = maximum water loss (Lug)
ρ = density (kgm3)
ρb = density of rock (kgm3)
μ = viscosity of water (Pas)
μg = plastic viscosity of a grout (Pas)
τ0 = yield strength of a grout (Pa)
1D = 1-dimensional
2D = 2-dimensional
3D = 3-dimensional
5
NAMES AND COMPOSITIONS OF GROUTS
Following nomenclature has been applied to the injection grouts The mix name
consists of four parts XX-YY-ZZ-QQ in which the first part XX refers to the cement
(UF = Ultrafin 16) The second part YY refers to the dry silica to the total dry material
weight ratio The third part ZZ is the water to dry material ratio (WDM) multiplied by
10 and the fourth part QQ is the superplasticizer (SPL) content expressed as weight
out of the total dry material The accelerator if used is given as weight out of the
total dry material in bracklets Other mix compositions are named likewise Cement
UF16 GroutAid silica slurry SPL Mighty150 and accelerator Nedmaq has been used as
the materials
Name of the grout Old names
of the grouts
WDM SPL
SilCem Accelerator
UF-41-14-3 P308 14 3 069 0
UF-41-14-3 (5 ) 14 3 069 5
UF-41-14-4 P308B 14 4 069 0
UF-41-14-4 (2 ) 14 4 069 2
UF-41-14-4 (5 ) 14 4 069 5
UF-41-14-48 14 48 069 0
UF-41-14-51 14 51 068 0
UF-41-12-3 P307 12 3 069 0
UF-41-12-3 (2 ) 12 3 069 2
UF-41-12-3 (5 ) 12 3 069 5
UF-41-12-36 12 36 069 0
UF-41-12-37 12 37 069 0
UF-41-12-4 P307B 12 4 069 0
UF-41-12-4 (5 ) 12 4 069 5
UF-41-12-48 12 48 069 0
UF-41-12-51 12 51 069 0
UF-41-10-3 10 3 069 0
UF-41-10-3 (2 ) 10 3 069 2
UF-41-10-3 (5 ) 10 3 069 5
UF-41-10-4 10 4 068 0
UF-41-10-4 (2 ) 10 4 068 2
UF-41-10-4 (5 ) 10 4 068 5
UF-41-10-48 10 48 069 0
UF-15-10-28 5_5 10 28 018 0
UF-15-10-28 (2 ) 10 28 018 2
UF-15-10-28 (5 ) 10 28 018 5
UF-41-08-47 08 47 069 0
6
7
1 INTRODUCTION
The Finnish nuclear waste management company Posiva Oy owned by Teollisuuden
Voima Oy and Fortum Power and Heat Oy constructs an underground rock
characterisation facility called ONKALO (Figure 1-1) in Olkiluoto Eurajoki Finland
The construction commenced in 2004 and is to be completed by the end of the year
2010 In future ONKALO is supposed to be a part of the nuclear waste facility the
repository for spent nuclear fuel By the end of the year 2007 about 2500 m of the
ONKALO access tunnel has been excavated and the ventilation (intake and exhaust)
and the personnel shafts about 180 m each have been raise bored
The investigations and the hydrogeological models made from the bedrock around
ONKALO demonstrate that essential water bearing structures need to be sealed
Otherwise excessive leakages into the tunnel can be expected (Riekkola et al 2003
Sievaumlnen amp Riekkola 2003) and too many disturbances will be foreseen in the
hydrogeological and geochemical environment (Vieno et al 2003) It was decided
before the construction that grouting will be the primary measure to control the
groundwater inflow into the tunnels The achievements and the strategy of grouting was
evaluated earlier when the major water bearing structures called RH19 at the depth
level of about -100 m were intersected (Ahokas et al 2006) The suggestion was made
to develop grouting further for better control of water ingresses
Those recommendations resulted in Posiva Oys decision to set up the R20 programme
for the years 2006 - 2008 The programme is a RampD scheme with an objective to
enhance the control of water inflow by grouting The programme shall come up with a
feasible grouting methodology which can be applied after intersecting the group of
water bearing RH20 structures at the approximate depth of -70 m
Figure 1-1 Schematic picture of ONKALO (yellow) and the deep repository
(httpwwwposivafi)
8
The R20 programme (Hansen et al 2008) consisted of three projects covering the
following areas (the project abbreviation in brackets)
1 Long term safety issues related to the controlling of water inflow (IPA)
2 Technical properties of grouting materials (IMA) and
3 Development of grouting design techniques and procedures (INKE)
This report describes the outcome of the INKE project and presents the outcome of
various subtasks as well as puts forward a suggestion for a grouting method for future
The project had an overall objective to establish a feasible and well-founded grouting
method for the construction of ONKALO The project mainly enhanced the utilization
of existing technology The requirements imposed by the long term safety should be
met without compromising ONKALOrsquos construction schedule The work aims at giving
guidelines for grouting design and work as well as for related investigations deeper in
the bedrock and the shafts to be excavated Furthermore it aims at finding out reliable
characterisation methods which can be applied in probe holes (percussion drilled holes)
for grouting purposes and recognizing the most significant factors the grouting results
may be governed by and establishing procedures functioning well between
investigations and design
The project was divided into seven subprojectssubtasks (SP) as follows
SP 1 Analysis of the grouting activities and investigations performed in ONKALO
and related to grouting
SP 2 Literature study on recent RampD in grouting focusing on the stop criteria and
experiences in demanding tunnelling conditions under high groundwater
pressures and requirements of high degree of tightness
SP 3 Preliminary study on colloidal silica including a pilot grouting test
SP 4 Study and classification of hydrogeological conditions at Olkiluoto site from the
grouting point of view
SP 5 Grouting field tests (optimised grouting)
SP 6 Small software study for grouting design or investigations related to grouting
and
SP 7 Feasibility study on grouting design solutions and a suggestion for the
application in ONKALO
The strategy how to achieve the aimed site specific high quality grouting methodology
is presented in Figure 1-2 The grouting methodology shall be based on the
requirements and the targets set on the experiences obtained from grouting works
performed in ONKALO and on the field tests performed as well as on the experiences
from the reference sites (high water pressure andor requirements for tightness against
water inflows) The rock conditions expected in the deep rock shall be taken into
account as well The optimal and practical solution fit for each rock condition
recognized will be found when grouting approach and suitable methodology is selected
information about competent materials is incorporated and the feasibility of design
solutions is judged
9
The sealing of the deep repository was excluded from the scope of the R20 programme
and the projects The IPA project together with the current design requirements
constituted the frames for grouting (total and local water inflow the volume and the
type of grout(s)) The IMA project had the task to assess the behaviour of grouting
materials and to develop several grout recipes for different circumstances and the
project was carried out in close interaction with the INKE project None of the activities
of the INKE project were governed by engineering design or by construction
procedures However all the field tests had to be performed in compliance with the
requirements in terms of quality safety and security valid for the ONKALO project
Underground facility that meets
the set targets in an optimal
high quality way
Verification of the grouting result
and development of the grouting
Execution of grouting design and
grouting work
Developed working methods Suggestion concerning the
equipment and quality control grouting in future
Feasibility of optimal design
solutions
Tools for optimising the grouting The methodology for Knowledge about grouting
grouting materials
Experiences from ONKALO and Requirements and targets set Expected rock conditions in
the reference sites for water inflow and grouting deep rock
due to the long term safety
Figure 1-2 The project strategy for the development of grouting practices The bronze
boxes are the outcomes of INKE project the light yellow are the outcomes from IPA
and IMA projects The rose boxes consist of the future outcomes
10
11
2 CONTROL OF WATER INGRESS IN ONKALO IN REGARDS OF MULTI BARRIER CONCEPT IN THE REPOSITORY
According to Riekkola et al (2003) the water inflow into underground facilities and the
subsequent water discharge may cause the detrimental flow of groundwater in the
surrounding rock mixing of different types of water and the drawdown of groundwater
table The water inflow into the excavations may cause migration of superficial waters
into the bedrock Changes in groundwater chemistry will have an impact on the
suitability of grouting materials and vice versa the grouting materials can cause
chemical disturbances in the surrounding groundwater After the closure of the deep
repository the most significant impacts are related to the inflows into the deep parts of
the underground facilities (salinity changes) the interactions between different
materials and to the decay of the buffering capacity of fracture fillings and rock in the
vicinity of disposal tunnels The upconing of saline waters from greater depths can also
be related to the drawdown of the groundwater table Rock engineering and construction
including the installation of systems will meet difficulties if big volumes of inflows
will occur The water inflow can make the installation of buffer and backfilling works
difficult
Figure 2-1 Disturbances foreseen due to groundwater inflow into ONKALO and the
deep repository and due to the use of cementitious materials (Riekkola et al 2003)
12
13
3 EXPERIENCES FROM ONKALO AND THE REFERENCE SITES
31 Rock characterisation for grouting design
About 25 of the access tunnel length is investigated with pilot holes (core drilled
holes) (Figure 3-1) Four probe holes (percussion drilled holes) are drilled
systematically about every 20 m as the tunnelling proceeds The pilot holes are typically
100 - 200 m long core drilled holes and the hole specific characterization reports are
produced in all details The characterization data is used to give a preliminary picture
eg of the need for grouting The final decision of the grouting need is done based on
information gathered from the probe holes In a few cases the design has been changed
due to the observations made in the probe holes
The characterisation methods in the probe holes
Water loss measurement (Lugeon test)
Posiva flow log and
Measurement of water out flow
The methods in the pilot holes
The water loss measurement (Lugeon test)
Posiva flow log and measurement of water out flow
Core sample loggings and
Different geophysical methods
The first stage of geological rock mass mapping can serve grouting designs interest as
well (location and orientation of leaking fractures) Eg when the hydrogeological
structure RH19 was intersected the drilling fans were designed according to the
fracturing
Lokkila (2008) has gathered information about the methods The Lugeon test is done by
sealing of the opening to a drilling hole with a packer and pumping water under a
constant pressure for a predetermined time and then measuring the volume pumped The
sequence length of the hole tested can vary In ONKALO mostly the whole length of
the probe holes has been tested and occasionally a split to shorter sections has been
done Applying altering pressures (raising and descending) the hydraulic circumstances
in the surroundings of the hole can be evaluated (Houlsby 1990)
The Posiva flow log device (Figure 3-2) has instrumentation for measuring both
difference and transverse flows (Oumlhberg amp Rouhiainen 2000 Lokkila 2008) In
difference flow measurement the differences of flow rates ie flows into or out from an
investigation hole are measured For the difference flow measurement there are two
optional modes available normal and detailed flow logging With the normal mode
hydraulic conductivities and hydraulic heads of the tested section are obtained The
detailed flow logging mode enables a rapid way to locate the leaky fractures or zones
The transverse flow equipment is used for in-situ measurements of flow rate and its
direction across a test section
14
The flow log measurements (Reiman et al 2006) were started (at chainages 15 - 372 m)
with an automatic logging device applying 10 m section length and 01 m point
interval A manual device with a single rubber disc was used at chainages 442 - 540 m
Another rubber disc was added in the manual device configuration and the measured
section length and the point interval were typically 125 m after the chainage 540
The measurement of out flowing water is also carried out when possible Measure
While Drilling (MWD) data has been tried to utilize also for grouting purposes The
software that interprets the drilling response is Rockma GMP-2 A pressure build up
(Eriksson amp Stille 2005) test has not been in use A simple borehole TV was tried to use
in very beginning of the tunnel with no success
Figure 3-1 Pilot holes OL-PH1 ONK-PH2 - ONK-PH7 between the chainages
0 - 2000
Principle of difference flow method Principle of transverse flow measurement
Figure 3-2 The principle of the Posiva flow log (Oumlhberg amp Rouhiainen 2000)
15
32 Experiences of the rock characterisation for grouting purposes
The data available for the analysis of grouting experiences was obtained from
Pilot holes OL-PH1 ONK-PH2 - 4
Probe hole data between tunnel chainages 0 - 1850 and
Grouting data between tunnel chainages 0 - 1850
Only one part of the personnel shaft was grouted and raise bored at the time the analysis
were made and thus the experiences obtained from the shafts were excluded from the
analysis
Observations on hydraulic properties in the probe holes (chainages 0 - 1505) are
presented in Figures 3-3 3-4 3-5 and 3-6 Hydraulic conductivities are based on water
outflow from the probe holes (Figure 3-3) maximum measured water losses (Figure 3-
4) interpreted water losses (Figure 3-5) and flow loggings (Figure 3-6) It can be seen
that as the excavation has advanced deeper the hydraulic conductivities determined in
the probe holes have significantly decreased ie the occurrences of the transmissive
fractures have diminished and the transmissivities of water conductive fractures have
decreased
The measurements of outflows and water losses have covered one probe hole at time
Recently occasionally the water loss is also measured with 2-packer device with 1 m
measuring section if the water loss in a probe hole has exceeded a predetermined limit
The flow log measurement can be used to distinct hydraulic fractures along a probe
hole The flow logging method was shifted from the automatic to the manual
measurement at the chainage 372 At the same point the trigger value of the outflow for
starting the measurement was changed from 30 mlmin to 500 mlmin in the holes that
are inclined upwards However that did not cause changes to probe hole measurements
since they are inside the tunnel profile and thus typically inclined downwards The holes
with the outflow less than the trigger level were considered dry for the flow logging
purposes (Reiman et al 2006)
About 13 of the probe holes have been flow logged The testing was abandoned in the
rest of the holes due to various technical difficulties andor due to dry holes The
diameter of most of the probe holes was 56 mm and the holes were typically more
bended than those of 64 mm In principle the water loss measurement can be carried out
in any probe hole However the measuring accuracy of the flow meters of water loss
measurement device tend not to meet the requirements for the start criteria of grouting
in ONKALO and the smallest transmissive fractures are difficult or impossible to
detect with the current devices
Comparisons of the results gathered with different hydraulic characterisation tools (the
data from chainages 0 - 1505) showed quite good correlations between the maximum
water loss in any probe hole of a fan (WLMmax) and the interpreted water loss (WLMint)
(correlation coefficient r = 088 or 072) and poor to moderate correlation with the flow
log (r = 043 and 028 correspondingly) The out flowing water measured at different
times correlated very variably with other observations The result obtained in the
16
correlation analysis was largely based on a very limited number of variables and was
considered somewhat unreliable The skin effect was not taken into account However
it may be one reason for differences between the different characterization tools
Hydraulic properties seem to have been slightly different in the probe holes in
comparison with the pilot holes The hydraulic conductivity measured is typically
smaller in the probe holes than in the pilot holes Possible explanations to this
phenomenon are that grouting seals fractures ahead of the excavation along gently
dipping fractures and that causes changes in groundwater flow paths and that blast
shocks may have altered the rock mechanical properties of the bedrock resulting in
decreases of hydraulic apertures of fractures
Figure 3-3 Hydraulic conductivity values (ms) measured by groundwater outflow
(OFW) in the probe holes at the chainages 0 - 1505
17
Hydraulic conductivity mslt 1E-101E-10 ndash 1E-91E-9 ndash 1E-81E-8 ndash 1E-7gt 1E-7not measured
Hydraulic conductivity mslt 1E-101E-10 ndash 1E-91E-9 ndash 1E-81E-8 ndash 1E-7gt 1E-7not measured
Hydraulic conductivity mslt 1E-101E-10 ndash 1E-91E-9 ndash 1E-81E-8 ndash 1E-7gt 1E-7not measured
Hydraulic conductivity mslt 1E-101E-10 ndash 1E-91E-9 ndash 1E-81E-8 ndash 1E-7gt 1E-7not measured
Hydraulic conductivity mslt 1E-101E-10 ndash 1E-91E-9 ndash 1E-81E-8 ndash 1E-7gt 1E-7not measured
Hydraulic conductivity mslt 1E-101E-10 ndash 1E-91E-9 ndash 1E-81E-8 ndash 1E-7gt 1E-7not measured
Figure 3-4 Hydraulic conductivity values (ms) measured by the water loss
measurement the maximum values (WLMmax) in the probe holes at the chainages
0 - 1505
Figure 3-5 Hydraulic conductivity values (ms) measured by the water loss
measurement the interpreted values (WLMint) In the probe holes at the chainages
0 - 1505
18
Hydraulic conductivity mslt 1E-101E-10 ndash 1E-91E-9 ndash 1E-81E-8 ndash 1E-7gt 1E-7not measured
Hydraulic conductivity mslt 1E-101E-10 ndash 1E-91E-9 ndash 1E-81E-8 ndash 1E-7gt 1E-7not measured
Hydraulic conductivity mslt 1E-101E-10 ndash 1E-91E-9 ndash 1E-81E-8 ndash 1E-7gt 1E-7not measured
Figure 3-6 Hydraulic conductivity values (ms) measured with the Posiva flow log
(PFL) in the probe holes at the chainages 0 - 1505
The visible leakages have been mapped four times per year (Figure 3-7) The measuring
weirs have been put in place for measuring the total inflow rate (Hansen et al 2008
Lehtinen amp Hirvonen 2007) The results have varied as the construction has proceeded
but recently a stabilising trend has been seen High occasional peaks have been caused
eg by open leaky grouting holes Major drips are concentrated at the locations of rock
bolts At the chainage 208 the average inflow has been 30 lmin at the chainage 580
106 lmin at the chainage 1255 184 lmin and at the pump station at the chainage 2285
~ 176 lmin The measured leakages have been smaller than expected However as
predicted before the construction started the inflow has significantly decreased below
the depth level -100 m (Riekkola et al 2003)
19
Figure 3-7 The water leakages mapped in the access tunnel between the chainages 0 -
1630
20
33 Experiences of groutings
The decision of grouting has been based on the amount of out flowing water the water
loss measurement and the leakage from single fractures (determined by flow log)
About 70 of the first 1000 m of the access tunnel has been grouted After intersecting
the hydrogeological structures RH19A and B the need for grouting has diminished
significantly Between the tunnel chainages 1000 - 2000 about 25 of the tunnel length
has been grouted The pre-grouting areas and the grout intakes per a hole-m and per a
fan are visualised in Figures 3-8 and 3-9
Grouting holes have been drilled outside the tunnel profile with the exception of the
shafts and one test grouting at the chainage 1880 Various drill patterns have been
applied (Table 3-1) The length of the grouting holes has been from 22 to 26 m A dense
(34 holesfan) pattern was used in the beginning The number of grouting holes was
however soon reduced first to 27 and then to 22 That turned out to be adequate to
achieve the sealing result as planned Special drilling patterns were used through the
hydrogeological structure RH19A (Ahokas et al 2006) between the chainages 916 and
980 to achieve the results wanted (Figure 3-10) The drilling pattern was changed back
to 34 holes after the chainage 1400 in order to enhance the probability to intersect water
conductive channels with grouting holes Post-grouting has been done in very few
places in order to rectify defects in pre-grouting Post-groutings have been designed on
a case by case basis
Grout mixes are based on sulphate resistant micro cement Ultrafin 16 (by Cementa AB)
except in the hydrogeological structure RH19A where also coarser Portland cement
(SR-cement by Finnsementti Oy) was used for better sealing effect Micro silica slurry
(GroutAid by Elkem) and mainly naphthalene sulphonated super plasticizer have been
used as admixtures Water to dry material ratio (in weight) has varied between 10 ndash 13
for early mixes and the ratio was reduced to 05 in the case of high grout intake Silica
to cement ratio has varied between 000 and 018 The content of superplasticizer has
typically varied between 1 and 2 in the weight of dry materials mainly depending on
the type of admixture The low pH grouts have been used in grouting tests with water
to dry material ratio 12 - 14 silica to cement ratio 069 and superplasticizer content of
4 in the weight of dry materials The total grout intake in the first 1000 m of the
access tunnel was ~ 422 m3 and between the tunnel chainages 1000 - 2000 m ~ 35 m
3
see Figure 3-11 All in all grout intake has not been very high and as the rock got less
fractured at the chainage about 550 m the grout intake and the need for grouting
diminished remarkably
The stop criteria used in grouting has been conventional Grout was pumped into the
bedrock as long as the stopping pressure was reached and the pressure was held for
5 min If the termination pressure was not reached and the grout intake had exceeded
the given limit the thicker grout mix was prepared by lowering water content in the
mix The grouting pressure during the first 2000 m has varied between 2 and 9 MPa
with a tendency to increase as the tunnel advanced deeper The grout intake limit for the
thinnest grout mix has typically been 30 lm of a grouting hole The grout intake limit
for the next thicker grout mix was 20 lm and for the last grout mix 20 lm In the
hydrogeological structures RH19A and B the grout intake was also limited Alternative
stop criteria have been studied and used in grouting tests
21
Grout take lmlt 0
0 - 55 - 10
10 - 2020 - 3030 - 4040 - 50
gt 50
Grout take lmlt 0
0 - 55 - 10
10 - 2020 - 3030 - 4040 - 50
gt 50
Grout take lmlt 0
0 - 55 - 10
10 - 2020 - 3030 - 4040 - 50
gt 50
Grout take lmlt 0
0 - 55 - 10
10 - 2020 - 3030 - 4040 - 50
gt 50
Grout take lmlt 0
0 - 55 - 10
10 - 2020 - 3030 - 4040 - 50
gt 50
Grout take lmlt 0
0 - 55 - 10
10 - 2020 - 3030 - 4040 - 50
gt 50
Figure 3-8 Grout intake lm per a grouting hole at the chainages 0 - 1525
Figure 3-9 Average grout intake lgrouting hole-m per a grouting fan at the chainages
0 - 1525
22
Table 3-1 Drilling patterns (for the usual tunnel profile) for the chainages 0 - 2000 in
the ONKALO access tunnel
Chainage Distance between holes (m) No of grouting holes fan
0 - 100 15 34
100 - 155 20 27
155 - 916 25 22
916 - 980 Customized drill patterns
980 - 1405 25 22
1405 - 1880 15 34
1880 15 17
1900 - 2000 15 34 Distance measured between the endpoints of the holes
Grouting holes inside the tunnel profile a grouting experiment
The leakage water inflow and the leakage mapping were the control measures of the
grouting results Occasionally the grouting result were controlled with control holes
which are drilled after grouting In the beginning the control holes were drilled
systematically but they were given up at the chainage ~ 120 m Currently they are
drilled eg for the shafts or grouting experiments
Grouting experiences have been analysed visually and by correlations The first 1000 m
of the access tunnel has been studied in detail A supplementary study in order to verify
the results and study the weird observations in more details covered also the data at the
chainages 1000 - 1850
The assessments of the first 1000 m of the access tunnel showed that the remained water
leakage after grouting is not as much correlated to geological features as to singular
fractures and rock bolts The major leaks seem to match fairly well with fan beginnings
and ends The bolts that extend beyond the grout curtain probably cause the leaks
Minor leaks remaining indicated also that leakages were distributed quite evenly along
the first 1000 m although geological and hydrological circumstances have varied a lot
This indicates that the remaining leakages are due to the used grouting material
(cement-based grouts) and technique (stop criterion) The sealing efficiency determined
by using control holes (thus calculated only for a few fans) was typically good out of
12 areas 9 showed a sealing efficiency of over 99 Only one place gave a poor result
with a sealing efficiency of 60 The sealing efficiency is the initial transmissivity
(probe hole result) minus the end transmissivity (from control holes) divided with the
initial transmissivity and it is usually given in percentage The sealing efficiency is not
used as an acceptance criterion in ONKALO
23
Grouting fans 960 ndash 956 ndash 940 ndash 935 ndash 921 ndash 916 - 905
935
916
905
921
940
956
960
Grouting fans 960 ndash 956 ndash 940 ndash 935 ndash 921 ndash 916 - 905
935
916
905
921
940
956
960
Grout take lmlt 0
0 - 55 - 10
10 - 2020 - 3030 - 4040 - 50
gt 50
Grout take lmlt 0
0 - 55 - 10
10 - 2020 - 3030 - 4040 - 50
gt 50
Figure 3-10 The grouting of the hydrogeological structure RH19A (the geometry of the
RH19A Ahokas et al 2006) The structure was grouted with coarse cement based
grout in the chainages 916 935 and 956 After the grouting of the structure the smaller
fractures were grouted with microcement at the chainages 905 921 940 and 960
24
Grout take (dm3) in ONKALO access tunnel 0-2000 m
0
5000
10000
15000
20000
25000
0 71 145
253
342
446
540
580
644
730
855
915
956
1025
1076
1162
1232
1340
1466
1586
1701
1815
1920
Tunnel chainage (m)
Gro
ut
take (
dm
3)
Pre-grouting
Post-grouting
Figure 3-11 Grout intake per a fan (dm3) both pre- and post-grouting for the first
2000 m of the ONKALO access tunnel
In the first 1000 m three areas of the largest grout intake coincide with the brittle fault
intersections around the chainages 330 and 500 (450 l penetrated into a drill hole) and
with a ductile shear intersection approximately at the chainage 450 There seemed to
have been a poor correlation between the grout intake and rock mass quality The three
areas with a poor or a very poor Q index showed moderate grout intake and the areas
with high grout intake were situated in good quality rock The number of fractures
seemed not to be connected to the grout intake One possible explanation to this is that
grouting seals fractures ahead of the excavation along gently dipping fractures another
reason for these may have been that in densely fractured rock the fractures were more
likely clogged by joint fillings and thus hinder grout penetration The third possible
explanation is that in densely fractured rock the fractures are shorter and narrower than
in sparsely fractured rock Based on the ONKALO fracture mapping data the
orientation of visible fractures with grout mass infilling was compared with all fracture
observations There is clear difference in the dip values between the fracture groups
The fractures with grouting mass infilling are more often gently dipping whereas all the
fractures are more often steeply dipping
Within the first 1000 m of the tunnel it was observed that in 13 of the grouting holes
the grout intake was high and in 43 of the holes the grout intake was less or as much
as the hole volume (Figure 3-12) As the tunnel has gone deeper less and less of
groutable holes have been encountered That indicates either invalid stop criteria that
ignored the existence of tight holes andor the water conducting channels are far apart
and therefore difficult to hit
25
43
68 73
77 81
85 90
99 100
0
100
200
300
400
500
600
0 5 10 20 30 40 50 100 More
Grout take (dm3m)
Nr
of observ
atio
ns
0
20
40
60
80
100
120
Figure 3-12 The distribution of the grout intake in the grouting holes (ch 0 - 1000)
The results obtained from rock characterisation are the basis for deciding grouting need
and design For this purposes the data at chainage 0 - 1850 was analysed Based on the
correlation coefficients obtained the determination of the maximum water loss value
was selected as the investigation method that is most capable to predict the grout intake
The correlation between the WLMmax values and the grout intake is 055 or 065
depending on whether the sum of the values from the four probe holes or the maximum
value in any probe hole will be taken into account This correlation is not considered
very high and the other investigation methods seemed to be even less correlated with
the grout intake However the data from eg flow loggings was very limited to draw
valid conclusions about the method and the measuring accuracy in water loss
measurement is relatively high compared to the start criteria of grouting Also the
correlation analysis was considered not to be useful enough as a tool for the assessment
of this type of data From the same data the predictive capacity of the different
investigation methods was briefly studied by examining zero and non-zero values in the
data set taking also into account the post-groutings and remaining water leakages The
water loss measurements predicted the need for grouting very well and the flow logging
related measurements also quite well However it has to be remembered that the
measuring limit of the flow log is very close to the start criteria for grouting ie this
conclusion is more or less trivial One thing that makes a difference between the flow
log method and the water loss method is that no overpressure is used in the first
mentioned
In general the Lugeon test related measurements appeared to produce more useful
results than the flow logging related measurements which showed only a poor
correlation with the grout intake although they were almost as good as the Lugeon
measurements in predicting the tunnel sections where grouting would have been
needed The determination of the maximum water loss value was the most useful
method both in terms of correlation with the grout intake and in predicting the tunnel
sections where grouting would not have been needed The water loss tests would
26
become more useful if a higher pressure was applied The pressure should be in the
same order of magnitude with the grouting pressure used in pre-grouting and the test
device should measure very small water flows
The comparisons were run between reliable flow logging data sets and corresponding
MWD (measure while drilling) data sets gathered No correlation was found The
algorithms in Rockma software should have been at least calibrated However it is still
uncertain whether the MWD data can be used for purposes of grouting design and
planning in ONKALO where high hydraulic head and tight fractures prevail
34 Reference sites
The experiences from reference sites were gathered by Hollmeacuten (2007) and the key
information has been compiled in the Tables 3-2 and 3-3 below More detailed
information can be found in Hollmeacuten (2007) The reference sites were selected to
represent either deep rock conditions or strict requirements for water inflows The
grouting experiences under high groundwater pressure exist but the problem was a poor
reporting of the experiences gained
In an addition to the reference sites presented in Tables 3-2 and 3-3 Hollmeacuten (2007)
found brief information form three other Norwegian tunnels including the Aringkrafjord
tunnel with the overburden of 600 m At a time of the commencement of systematic
post-grouting was started the water pressure was about 46 MPa and total amount of the
ingress was in a range of 3 - 5 m3min per a geological zone In that tunnel the final
leakage was 10 dm3min100 m which was regarded satisfactory The Eiksund traffic
tunnel is the worldrsquos deepest sub sea tunnel (the completion due in February 2008) The
tunnel is nearly 8 km long and dives to almost 300 m beneath the fjord surface The
acceptable water inflow into the tunnel was set less than 30 dm3min100 m The
decision of grouting is based on systematically drilled probe holes Grouting pressures
up to 10 MPa are used In the shallow located Bekkestua tunnel the limit of water
ingress into the tunnel was set as a maximum 2 dm3min100 m of tunnel The used
cement (Portland cement or micro grained Portland cement) was selected according to
the observed leakage from holes Large volumes of grout were used The leakage was
reduced to about 07 dm3min100 m of tunnel Portland cement based grout was used
only within the most leaking areas where the rates got up to 17 dm3min100 m of
tunnel
Essential new hints or ideas that could be used in ONKALO were not found in this
literatury study However the study confirmed that water leakages can be handled The
challenge in the case of ONKALO is the design requirements which are somewhat
contradictory
27
Table 3-2 The grouting summary in some tunnel projects (Hollmeacuten 2007)
Tunnel project Bragernes Norway Lunner (oslashst) Norway
Year completed 2001 2003
Purpose of tunnel traffic traffic
Overburden 10 - 150 m 10 - 300 m
Total length 2310 m 3800 m
Requirement water inflow 10 - 30 dm
3min100 m of
tunnel 10 - 20 dm
3min100 m of
tunnel
Grouting strategy systematic pre-grouting systematic pre-grouting
Drill hole quantity 057 mm2 (1
126 mm2 (1
Grouting material Standard cement with micro silica (Rapid Rp 38) from Norcem
Standard cement and Ultrafin 12 from Scancem
Additives Rescon HP 2-3 Grout Aid 5-23 SP40 2-3
WC ratio 10 - 05 20 - 05
Pumping pressure 2 - 9 MPa 5 - 7 MPa
Mass quantity 81 kgborehole-m 30 kgborehole-m
Results of grouting (water inflow)
101 dm3min100 m 84 dm
3min100 m
(1 m
2 tunnel is the entire tunnel circumference multiplied with the total tunnel length
Table 3-3 The grouting summary in two tunnel projects (Hollmeacuten 2007)
Tunnel project Baneheia Norway Lundby Sweden
Year completed 2001 1998
Purpose of tunnel traffic traffic
Overburden 20 - 40 m 5 - 35 m
Total length 3000 m 2060 m
Requirement for tightness 60 dm3min total
05 - 25 dm3min100m of
tunnel
Grouting strategy systematic pre-grouting systematic pre-grouting (continuous)
Drill hole quantity 108 mm2 (1
200 mm2 (1
Grouting material Ultrafin 12 from Scancem Grouting cement from Cementa
Additives Grout Aid 5 - 15 SP40 2 Bentonite 3 Intraplaster 05
WC ratio 09 - 07 30 - 05 (03 hole filling)
Pumping pressure 5 - 8 MPa 25 MPa
Mass quantity 9 kghole-m 6 kghole-m
Results of grouting (water inflow)
18 dm3min100 m 09 dm
3min100 m
(1 m
2 tunnel is the entire tunnel circumference multiplied with the total tunnel length
28
29
4 ENHANCED UNDERSTANDING OF GROUTING DESIGN AND EXECUTION
41 General
Common steps in grouting design are
1 Set the functional requirements targets for a tunnel
2 Analyse the data available of water conductive geological features
3 Set the limit for maximum water inflow
4 Establish the start criteria for grouting
5 Engineer the drilling patterns grout mixes and the stop criteria for grouting
6 Specify the other requirements for work including the verification of the grouting
result and quality control and
7 Specify the requirements for documentation and document control
Some of the above mentioned points are emphasised more than the others in this work
Posiva sets targets for water inflow and the grouting (grout type and grout quantity) and
thus they are not evaluated further The available information from drill holes in
ONKALO area was studied from the grouting point of view The start and stop criteria
are paid much attention to since they are important but poorly understood parts of the
grouting design The design of drilling patterns grout mixes and work specifications are
customary design work but they should not be treated separately from the start and stop
criteria
The national and international standards and norms do not guide the optimisation work
sufficiently The national norm (Concrete Association of Finland 2006) does not give
the guidelines for eg
1 Setting the grouting start criteria for the different characterisation methods
2 The quality control tests needed for determination of the mix properties required in
the design
3 Selectingdesigning the mixes for the different rock conditions
4 Grouting in the deep rock (including the guidelines for the water loss measurement
and the grouting pressures) and
5 The design work (to involve the pumping time to other design parameters)
These subjects are paid an attention to in this work
Some items mentioned above are discussed here from the theoretical point of view The
suggestion of application in ONKALO is presented later in this work (Chapters 5-7)
42 Start criteria for grouting
The criteria when grouting is started are important part of controlling groundwater Low
trigger value for grouting means low water leakages but possibly results in much of
grouting and grouting holes which is not always desirable On the other hand high
trigger level may be desirable from the point of view of grout intake or number of
30
grouting holes but not from the remaining water leakages (long term safety aspects)
Practically the start criteria mean a selection of a suitable characterisation method or a
combination of those and derived quantitative trigger levels It is important that the
start criterion is based on the information that can be accurately measured
The flow log measurement water loss measurement and measuring out flowing water
are complementary methods to characterize the probe holes in ONKALO In order to
select one or several methods both the suitability and reliability of the method(s) and the
priority of the grouting objectives should be taken into account while making a choice
between the characterization methods or a combination of them However those
methods tell nothing about fracture orientation or eg the channelling of the flow
If having several methods in use for example due to the reasons of a) complement the
picture of rock and b) verify the availability of the result the start criterion set for
different methods should be linked between each other Below the chain from flow rate
to hydraulic aperture is presented (flow rate gt the transmissivity of a fracture or a
fracture zone (Eq 4-1) gt Lugeon value (Eq 4-3) or hydraulic aperture (Eq 4-4))
Q = the flow rate (m3s) eg from a probe or grouting hole or eg the tunnel
Here Q is the starting point since in the case of ONKALO the trigger level is set based
on that parameter Based on the flow the transmissivity of a geological feature can be
determined as follows
H
RR
Q
T2
ln 0
(4-1)
where T is the transmissivity of a fracturezone (m2s) H = groundwater pressure
expressed as a height of water coloum depth (m) R0 = the radius of the flow (m) (in
flow loggings 14 m is used and in tunnel scale typically 2H is used) and R = the radius
of a hole or a tunnel (m) The transmissivity is connected to the hydraulic conductivity
K (ms) with the following equation
T = KL (4-2)
in which L is the length of the measuring section or the thickness of a geological
formation or in the case of tunnelling the length of a measuring section (m) The
hydraulic conductivity can be transformed as a Lugeon value with the following
relationship (Bergman amp Nord 1982)
1 Lug ~ 17E-7 ms
This relationship varies in different references Eriksson amp Stille (2005) Houlsby
(1990) and Concrete Association of Finland (2006) present relationships 1 Lug ~ 13E-7
ms - 16E-7 ms The connection between the hydraulic conductivity and the Lugeon
value is observed to vary also with depth (Bergman amp Nord 1982)
31
The Lugeon value itself is determined as follows
tpL
QLug
Lug (4-3)
Where QLug = water loss (dm3) L = the length of a measuring section (m) ∆p = the
overpressure (MPa) and t = measuring time (min) The use of water loss data and the
interpretation of the results are handled by Houlsby (1990) When measuring with
several pressures the interpretation of the results is important part of determining the
correct Lugeon value
Since hydraulic apertures are interesting from the grouting point of view finally the
connection between the hydraulic aperture b and the transmissivity of a fracture is as
follows
312
g
Tb (4-4)
where b = hydraulic aperture (m) μ = the viscosity of water (Pas) and ρ = the density of
water (kgm3)
43 Stop criteria for grouting
General
A stop criterion means a point when grouting designer or grouter can be enough
convinced that the aimed sealing result is reached and the targets are met Practically it
is impossible to verify the grouting result during grouting and therefore different stop
criteria have been developed The importance of the stop criterion enhances as the
targets get stricter or optimisation between water leakages and grout take should be
done
Various stop criteria
Grouting practices and the stop criteria were studied (Hollmeacuten 2007) as a literature
study in order to find out the most suitable approach A literature study brought up the
following ways to set the stop criterion
1 Setting the maximum pressure and the grouted volume
2 Grouting intensity number (GIN) ndashprinciple and
3 Time stop criterion
Traditionally the limits for grouting are defined by two stop criteria the highest
allowable grouting pressure andor the highest allowable grout intake Grouting is
stopped after a few minutes the grouting pressure has been stabilised at the set
maximum level Often there are also limitations eg for the maximum grout intake or
the grout flow This kind of stop criteria is empirical but widely used in conventional
32
tunnelling This approach which complies with the national norm (Concrete
Association of Finland 2006) has been used in ONKALO where adequate limits for
the grouting pressure is set based on the rules for grouting pressures (the smallest
fracture to be grouted and the aimed penetration length determined according to
Concrete Association of Finland (2006) and the limits for grout intake based on the
experiences obtained during tunnelling
Another stop criteria typically used in dam grouting is developed by Lombardi and
Deere (1993) and Lombardi (1997) and further studied for tunnelling purposes eg by
Brantberger (2000) The short overview is done and presented by Hollmeacuten (2007) This
so called Grouting Intensity Number (GIN method) defines the limiting curve by three
parameters the maximum pressure the maximum grouted volume and the empirically
selected GIN value The idea of the method is to reduce the risk of hydro fracturing In
practice when the volume of injected grout is low higher pressures can be used And
when the volume of grout injected is high the pressure should be lower Any
combination of the grout pressure and the grout intake can be used as long as their
product falls under the selected GIN curve Grouting is to be stopped when the pressure
rises above the selected maximum limit the grout intake rises above the selected
maximum limit or the product of the grout intake and the pressure rises above the
selected GIN value According to Hollmeacuten (2007) the problem of the GIN value is that
it cannot be explicitly solved Based on the literature study (Hollmeacuten 2007) the GIN
method has been used only once in tunnelling in the Goumlta Tunnel in Sweden Even
though the GIN value was very low most of the performed groutings were stopped to
the maximum pressure or to the maximum volume
The third way to set the stop criteria Hollmeacuten (2007) found is an analytical approach
also called the time stop grouting The model is developed by Chalmers University of
Technology (CTH) and Royal University of Technology (KTH) in Sweden (Gustafson
amp Stille 2005) In this approach the distance between grouting holes the grouting
pressure the fracture openings and the rheological properties of grout are linked with
each other A desired penetration length from the grouting hole in the smallest fracture
to be sealed is to be determined Then the time the grout (with certain rheological
properties) is to be pumped into the rock under the predetermined pressure can be
calculated Or another way around the desired grouting time can be set and the required
grout and the grouting pressure will be adjusted The approach has a complicated
physical background and the implementation requires simplifications and
approximations
In principle this is the only method to link the fracture and the grout properties to the
pumping pressure and the time and thus the design can be continuously presented As
the drawbacks there is very limited practical experience the method is sensitive to eg
the fracture characteristics available (fracture apertures) and to the rheological
properties of the grout Also it is an advantage to know whether the grout flow is one-
dimensional (channel-like) or two-dimensional (a planar fracture or a fracture with a
varying aperture) According to Hollmeacuten (2007) the stop criteria based on the analysis
of the grout penetration is not easy one to use when fracture system is complicated but
may be usable when fracture system is simple The criterion is also difficult to use if
the information about fracture characteristics is unreliable Therefore further
33
development of the time stop criterion is needed since exact characterization at the site
is very difficult
The stop criteria presented are compared in Table 4-1 Among the alternative
approaches the time stop criterion seems to be the most reasonable tool for grouting
design work in ONKALO because optimisation should be done However the
approach does not comply with the national building codes for the grouting
Table 4-1 Comparison of different grouting stop criteria (modified and complemented
from Hollmeacuten 2007)
Stop criterion
criteria Pros and cons Suitability
Prevailing practice = max pressure and max volume
Empirically set maximum volume and maximum pressure
+ Method is widely used Much reference sites in general + Results are sometimes good enough -Poor economy It is possible that grout injection takes more time and grout than is needed On the contrary high pressure and high grout intake do not guarantee sealing result good enough - empirical not a tool for optimisation - not much reference sites with very low inflow target
In principle for every tunnel depends mainly on the investments on grouting and skills of the grouting designer
GIN-method
Maximum volume maximum pressure and selected GIN-value
+ Fast grouting cycle (no hydrogeological characterisation recommended needed) - empirical not a tool for optimisation - experiences only once in tunnelling (Goumlta Tunnel) - no rules how to solve exact definition of the GIN-value Eg the method is empirical - not useable when the joints are very tight
Originally for dam grouting not for deep tunnels There is a possibility that method is workable in variable type of rock mass
Time stop criterion (Grouting Time ndashmethod)
Grouting time (t) for each combination of desired penetration length grout characteristics and allowable grouting pressure
+ Gives analytical method to study grout penetration with relation to stop criterion + Good economy The minimum grouting time can be calculated The grouting can be optimised - Limited practical experience which means that the grouting practises should be further developed -Sensitive to fracture characteristics and grout properties which are not easy to handle in tunnel conditions
In tunnels where sealing result is important and possibly at the same time grout intake is critical which means that investments on grouting are reasonable Further development needed Requires competent designer in fields of grouting geology and hydrogeology
34
Time stop criterion
The relationship between grout properties grouting pressure grout penetration length
and grouting time with cement based grouts
The approach is presented by Gustafson amp Stille (1995) and in the literatury study by
Hollmeacuten (2007)
For a certain grout there is a maximum penetration distance (Imax) at steady state into a
fracture (Haumlssler 1991 Gustafson amp Stille 1996)
0
max2
)( bppI
wg (4-5)
where pg = grouting pressure (Pa) wb pgH 23 (Gustafson 2005 Concrete
Association of Finland 2006) pw = groundwater pressure (Pa) b = the hydraulic
aperture of fracture (m) τ0 = the yield strength of grout (Pa) ρb = the density of rock
(kgm3) g = gravitational acceleration (ms
2 ) and H = depth below ground surface (m)
The equation for the maximum grout penetration (Haumlssler 1991) forms the basis for
analytical approximations for the grout penetration
Correspondingly there is a timescale given as the characteristic grouting time
(Gustafson amp Claesson 2004)
2
0
0
6 gpt (4-6)
Where t0= characteristic grouting time (s) μg= the plastic viscosity of grout (Pas) ∆pg =
grouting overpressure = pg ndash pw (Pa) and τ0 = the yield strength of grout (Pa)
The maximum penetration length and the characteristic grouting time are thought to be
linked together (see Figure 4-1) even though they do not describe exactly the same
point of time However based on this starting point the time t (s) needed for pumping
grout (μg τ0) into a fracture with hydraulic aperture b (m) can be determined as the
desired penetration length I (m) according to the theories presented by Gustafson amp
Stille (2005) Gustafson amp Claesson (2004) In order to determine t relative penetration
length ID and relative penetration time tD are to be determined The key parameters used
in time stop criterion -approach are illustrated in Figure 4-1
Illustration of the parameters in 1 D Illustration of the parameters in 2 D
Figure 4-1 An illustration of the key parameters in the time stop grouting -approach The explanations of the parameters can be found in the
text 1D and 2D refers to the dimension of flow
35
36
The relative penetration ID (s) is calculated with the help of the desired and the
maximum penetration lengths The relative penetration length is the same in all
fractures cut by a borehole (Gustafson amp Stille 2005)
maxI
II D (4-7)
The corresponding relative grouting time (tD) is presented for one-dimensional (1D)
case which presents a flow channel and for two-dimensional (2D) case which presents
a planar fracture The determination of the relative grouting time and the
approximations for the relative time for the 1D and 2D cases are (developed by
Gustafson amp Stille 2005 a typing error corrected by Hollmen 2007)
0t
ttD (4-8)
21
21)1( DDt (4-9)
21
6)2( DDt (4-10)
Where t = the grouting time (s) to reach the point I and
D
D
I
I
24
2
(-) (4-11)
By selecting the dimensionality of the case the time for a certain grout to reach the
desired penetration in a fracture can be calculated
In order to prevent a possible backflow the ratio of water pressure (pw) and the excess
pressure (Δp) should be smaller than the relative penetration length (ID) (Fransson amp
Gustafson 2007 Axelsson 2006)
By varying the grout (its penetration ability and rheological properties) the grouting
pressure and the drilling pattern the optimal grouting for different rock conditions can
be designed According to this principle the stopping of the grouting can be controlled
via the pumping time
Relationship between grout properties grouting pressure grout penetration length and
grouting time with colloidal silica
Colloidal silica (also silica sol) is a Newtonian fluid and in order to control the spread of
it it is important to link the desired penetration length with the gelling time that is
controlled by the dosage of an accelerator in a mix The theory of the grouting with
37
colloidal silica is presented by Funehag (2007) A short overview is collected also by
Lokkila (2008)
The complicated mathematics can be transformed to a simple form and the basic tools
for designing the silica grouting lies on the equations for the penetration length in the
1D and 2D cases
0
1max6
g
D
ptbI (4-12)
DDII 1max2max 450 (4-13)
Where b = hydraulic aperture (m) ∆p = overpressure (Pa) tg = the gel induction time (s)
and μg= the initial viscosity of a grout (Pas) The gel induction time means the point of
time at which the viscosity of colloidal silica has doubled
The maximum penetration length is achieved in the time equal to 15 tg and further
pumping does not result in any further penetration The minimum pumping time should
then be half of the gel time which is characteristic for each silica sol recipe and for each
temperature
As the desired penetration length together with suitable drilling pattern are selected in
certain fracture environment and temperature the adequate grouting time is determined
and based on it the suitable gelling time and thus the dosage of an accelerator are
selected
Grout intake
Gustafson and Stille (2005) have presented the equations to estimate grout volumes in
1D and 2D cases In principle the grouted volume can be used as a stop criterion as
well Also with the help of the penetration time the grout flow is predictable in
principle
The volume of a grout in a fracture is
IwbV D)1( (4-14)
bIV D
2
)2( (4-15)
Where V(1D) (m3) refers to the grout intake in 1D system (a channel) and V(2D) (m
3) to
the grout intake in 2D system (planar fracture) and w = the width of a 1D channel The
maximum grouted volumes can be calculated in similar ways by using Imax instead of I
38
If having a multiple fracture system the grouted volume in each of the fractures and
thus in the whole fracture system can be calculated by using relative grouted volumes
VD (-)
)1()1( DD DD IV (4-16)
2
)2()2( DD DD IV (4-17)
For the number of fractures the theoretical total volume is then
)1()1()1( max DDDVVV Dtot
(4-18)
)2()2()2( max DDDVVV Dtot
(4-19)
Uncertainties in time stop criterion
Like any other method the time stop criterion is sensible to a certain source data and
this causes uncertainties The aperture varies a lot in a single fracture even though the
transmissivity (hydraulic aperture) is studied to be able to describe the groutable
aperture well (Fransson 2001) However it is practically impossible to find a
representative hydraulic aperture with a few boreholes Discussion on the conceptual
understanding of fracture characteristics ndash especially the nature of the fracture aperture
ndash and its role as an uncertain factor are available in the reports by Hakami (1995)
Sievaumlnen (2002) and Lokkila (2008) The rheological properties of a grout have natural
variation due to the variation of cement qualities the measuring methods and also the
reological parameters yield strength and viscosity are interpreted with a models with
more or less confidence The rheological properties of grouts also vary with the time
Also the prevailing overpressure in a fracture always differs more or less from that one
readable at the grouting equipment
In order to understand the most important factors affecting the penetration length of a
grout a sensitivity analysis was done by Lokkila (2008) The analysis was carried out
by selecting the start values for each parameter and varying them one by one The
values for the parameters were selected among the observed properties and the expected
conditions
According to the results of Lokkila (2008) the factor that has the most significant effect
on the penetration length is the hydraulic aperture of a fracture The yield value and the
viscosity of a grout as well as the grouting overpressure also have a notable effect The
system is very sensible to these factors and due to this reason the focus should be
concentrated in the supply of accurate characterisation data the quality control of grout
mixes and careful follow up of the design during the grouting work On the contrary the
system is not that sensible to the pumping time of the grout ndash especially as the grouting
proceeds This should be understood so that relatively high increase in pumping time is
needed in order to increase the penetration length quite a little especially in small
fractures
39
44 Experiences from the field tests
Three grouting tests were performed in ONKALO during the year 2007 The first
grouting test was performed in the ONKALO access tunnel with cement-based low pH
grout The second grouting test was carried out in the personnel shaft 1 This test was
divided into three stages and the low pH grouts were used The third grouting test was a
pilot test with colloidal silica
From now on the method presented by Gustafson amp Stille (2005) is also called
Grouting Time ndashmethod as it was named during the grouting tests
Test grouting in the access tunnel at the chainage 1880
The intention of the first grouting test was to practice the use of the time stop criterion
together with the grouting holes inside the tunnel profile The used grout was cement-
based low pH grout UF-41-14-4 The progress of the field test is reported in detail by
Hollmeacuten (2007) and the grout related tests by Ranta-Korpi et al (2007) The mix
properties are collected to the Appendices 1 and 2 The mix compositions are presented
in ldquoNames and compositions of groutsrdquo
The test site (Figure 4-2) was at the tunnel chainage interval from 1880 to 1906 in
ONKALO The overburden in the test site is ~190 m
Four 26 m long probe holes were drilled and studied (Hollmeacuten 2007) All of the probe
holes were almost dry but the water loss measurement (pressures 22 - 26 - 29 - 26 -
22 MPa) showed a slight water intake The flow logging did not succeed because the
leakage was too small The hydraulic aperture of the fractures was estimated based on
the water loss measurement results and with the assumption of fracture numbers (two)
detected in the pilot hole ONK-PH7 Based on the obtained characterization results the
preliminary impression was that there are two fractures with an aperture of ~30 microm
Figure 4-2 The test sites of the grouting tests in ONKALO in 2007 (Hollmeacuten 2007)
Test site (FT2)
Test site (FT1)
40
In order to study the GT method (time stop criterion) the intention was to design the
grouting to be fully optimised without any safety factors The grouting holes were
located inside the tunnel profile because it is one way to diminish the grout remaining
in rock after excavation
The grouting fan included 17 grouting holes (Oslash 54 mm) and every hole was about 26 m
long (Hollmeacuten 2007) The distance between them was 15 m and all were parallel with
the tunnel and inside the theoretical tunnel profile The flow logging and the water loss
measurement were done in all grouting holes The latter showed connections between a
few grouting holes Because the flow logging didnrsquot give any results the hydraulic
apertures of the fractures were again estimated from the water losses Again the number
of fractures (2 fractures) was estimated with the supposition from the pilot hole ONK-
PH7 and the calculated hydraulic apertures were similar varying between 12 - 30
microns
The test was carried out with Posivarsquos new grouting equipment of which the
components are made by Haumlny Figure 4-3 The equipment was in use in the tunnel for
the first time
There were no results of the mix UF-41-14-4 from the field using Posivaacutes new grouting
equipment Thus the material parameters of the grout were based on the rheology
measurements done in the laboratory
The intended grout penetration was 30 m outside the tunnel profile which means that
the penetrations of 32 - 38 m were needed (Hollmeacuten 2007) The grouting pressure of 8
MPa was the lowest to reach the desired penetration in reasonable grouting time
Because the fractures were very small and channelling like flow was assumed the
fracture system was assumed to be 1D and the grouting times for all single holes were
calculated using the GT method Against the theory the maximum grouting time (tmax)
was limited to 25 min even though the maximum calculated grouting times in some
holes were 40 min Also the stop criterion based on the minimum flow (0 l per 2 min)
was set ndash against the theory
41
Figure 4-3 Posivarsquos new grouting equipment (the mixers agitators and pumps made by
Haumlny) was used in the test (photograph by Kalle Hollmeacuten)
Unexpectedly the grout leaked from nearly all of the roof holes and finally from the
drift The total grout intake in the fan was 1402 dm3 out of which 744 were pumped
into three holes The total grout intake is almost the same than the volume of the
grouting holes and the pilot hole which was assumed to be fully or partly filled During
the grouting there were more connections between the holes than the water loss
measurement indicated There could be several reasons for the grout leaking but the
main reason is probably that on blasting round 1876 - 1880 the excavation damaged
zone (EDZ) extended longer to the rock mass than the packers (10 m) extended due to
the repair blasting Another reason for the grout leakage could be that the rock andor
the grout properties were inaccurate (Hollmeacuten 2007)
The grout properties used in the design were reviewed based on the field measurements
after the field test 1 and the results showed that the values (Ranta-korpi et al 2007
appendices 1 and 2) used in the design were more or less invalid The back calculation
was done by calculating the real viscosity of the grout with the help of the Marsh-funnel
results the stick results and the diagram by Haringkansson (1993) The quick outflow from
nearby grouting holes supported the idea obtained from the observed mix results These
observations showed that it is necessary to check the grout parameters at the site with
real grout mixer not only in the laboratory
Eight control holes were drilled in order to study the grouting result All of the control
holes (extended about 3 m out of the tunnel profile) were dry and one hole showed
42
water loss However the exact penetration length of the grout remains unknown since
the actual orientation of the fracture(s) was unknown Based on the leakage water
mapping the tunnel section was dry and the grouting seemed successful
Test grouting in the personnel shaft 1
The field test 2 was arranged in the ONKALOrsquos personnel shaft 1 from the depth level
-80 m to the level -110 m (Figure 4-2) The grouted area in the shaft was ca -86 -
-110 m (24 m long) and the radius of the shaft was 2 m The progress of the field test is
reported in detail by Hollmeacuten (2007) and the grout related tests by Ranta-Korpi et al
(2007) As more knowledge about the grouting material characteristics was available
they were taken into account in the calculations The mix properties are collected to the
Appendices 1 and 2
Again in order to study the GT method the intention was to design the grouting to be
fully optimised without any safety factors The grouting was done using Posivarsquos
grouting equipment (Figure 4-3)
The grouting was done in three stages in the first and the second rounds three grouting
holes per round were grouted and six holes were grouted in the third round (Hollmeacuten
2007) The second roundrsquos grouting holes were the control holes for the first round and
the grouting holes of the third round were the control holes for the second round
All grouting holes were vertical and they were inside the shaft profile because the
grouting holes outside the shaft profile are not accepted in ONKALO The holes were
core drilled The rock mass was characterized using the water loss test (single packer
and double packer with separation of 1 m) and the flow logging ndashtool Also deviation
measurements were done for the grouting holes
The low pH grouts were used and the recipes were selected separately for every
grouting in order to find an optimal solution (Hollmeacuten 2007) The design approach was
the time stop criterion and it was expected that the dimension of the flow would be 2D
The grouting pressures were set less than the limits possibly leading to the uplifting
which means that the maximum pressures should be less than 65 MPa The target grout
penetrations were 28 m 35 m and 40 m depending on the stage and the hole location
(Figure 4-4) The penetration lengths were selected in a way that a minimum coverage
of the grouting was aimed and no safety factors were used This was done due to
practicing the optimization and testing the method
43
Figure 4-4 The grouting hole locations and the grouting sequencing Sequence 1 the
holes no 86 - 88 Seq 2 the holes no 89 - 91 Seq 3 the holes no 92 - 98 The shaft
radius R is 2 m and the hole spacing is ~ 1 m In total 12 grouting holes were designed
and grouted (Hollmeacuten 2007)
The aim of the grouting in the first stage was to seal the largest fractures (Figure 4-5 a)
(Hollmeacuten 2007) In the hole no 86 the aim was to seal the fractures with apertures of
47 microm or larger and in the holes no 87 and 88 the fractures with the apertures of 24 microm
or larger Because all the holes were grouted at the same time the idea was to find the
same grouting time and the pressure in every hole by using different mixes if needed It
was designed that the grout UF-41-12-51 (τ0 asymp 888 Pa microg asymp 146 mPas) will be used to
the hole no 86 and the grout UF-41-14-51 (τ0 asymp 52 Pa microg asymp 103 mPas) to the holes no
87 and 88 The design window in this grouting stage is presented in Figure 4-6 After
the calculations the grouting time (2D model) was set to be 30 min and the grouting
pressure 45 MPa which means the overpressure of ca 35 MPa The calculated times
and pressures were the same in all holes
The hydraulic packers were set to the depth of 6 meters from the beginning of the holes
First the holes were filled with the grout (20 - 30 min) After that the pressure was
raised to the target level at the same time in every hole
The quality control tests for the first grout mix (UF-41-12-51) showed too low Marsh-
values therefore that mix was rejected and a new grout batch was mixed Because the
Marsh value was again too low the grout recipe was changed to the grout UF-41-12-36
44
(τ0 asymp 157 Pa microg asymp 251 mPas) which passed the quality control tests No changes to the
grouting times were done
The total grout intake was 1172 l out of which the proportion of the grouting holes was
328 l According to the dimensionality analysis the grout flow was one- two- and three-
dimensional during the grouting
After the grouting of the first stage the grouting holes of the second stage were drilled
and via them the result of the earlier grouting was studied The results of the flow
logging showed numerous fractures in the holes and the largest fracture aperture was
75 microm However the proportion of the larger fractures (gt 40 - 50 microm) was decreased
(Figure 4-5 b)
The grouting of the next rounds was designed and executed with the similar principle
(Hollmeacuten 2007) The grout for the next grouting round was UF-41-12-48 (τ0 asymp 888 Pa
microg asymp 1447 mPas) which was used in every hole (Ranta-korpi et al 2007) The aim of
the grouting in the second stage was to seal all the fractures down to 20 microm of an
aperture After the calculations for all holes the grouting time (t(2D)) was set to be
100 min and the grouting pressure 60 MPa which means the overpressure of ca
50 MPa
After all the holes were filled in the grouting pressures were raised to the target level
(60 MPa) in all holes at the same time After 10 minutes old and new grout came out
from one grouting hole and the grouting was interrupted It means that there were
connections between the grouting holes of the first and the second stages Shortly after
the grouting was continued the grout flow was very low in every hole ~ 00 dm3min
until the end of the grouting The total grout intake was 924 l out of which the
proportion of the grouting holes was about 13
The result of the second grouting was studied via the grouting holes of the third stage
(see Figure 4-5 c) The results of the flow logging still showed numerous fractures in all
holes and the largest fracture aperture was 45 microm The need for grouting was evident
even though the larger fractures had been sealed earlier
The third stage was grouted with the grout UF-41-14-4 (τ0 asymp 840 Pa microg asymp 104 mPas)
which was to be used in every hole The planned penetration length was 4 meters in
every hole and the aim was to seal all the fractures with apertures larger than 20 microm
The grouting time (t(2D)) was set to be 110 min and the grouting pressure 60 MPa All
holes were first filled and then grouted at the same time and due to this pipe branches
were used to connect the holes
During the grouting the pressures were less than the target level and the grout flows
were much higher than expected based on the results from the water loss measurement
and the flow logging The fracture system was very complicated and there were more
and larger fractures than expected After 90 minutes the grout leaked to the tunnel at the
chainage 960 (about 30 m away) When the grouting time 110 min was reached grout
flows were still very high (asymp 10 dm3min) in every hole Therefore the grout recipe was
changed for a thicker grout UF 41-10-4 (τ0 asymp 27 Pa microg asymp 278 mPas) and grouting was
45
continued with that grout about 50 min The grout flow and the total grout intakes were
still high in every hole which confirms the arguments that the results of the pre-
measurements were invalid Another possible explanation is that the fractures opened
during the grouting or that fracture infillings moved and new connections formed The
grout flow was two- and three-dimensional during the grouting and there was a large
fracture zone which skewed the dimension-analyses After the third grouting stage a
24 m long extra control hole was drilled The results showed still relatively high water
loss
All in all in this field test the fractures were slightly sealed after the first and the second
round especially the largest fractures but the effect was not so great than expected
(Hollmeacuten 2007) However there remained a question if the results of the measurements
were not reliable Therefore the real results of the grouting can be evaluated from the
possible water leakages after full-face boring Even though the 2D flow model was
used the total grout intake was much higher than expected after the tests in the grouting
holes Especially on the third round the total grout intake was very high in proportion
to the measured Lugeon values and the hydraulic apertures
46
a)
-110
-105
-100
-95
-90
0 10 20 30 40 50 60 70 80 90 100
Aperture of fracture bhydr [microm]
Dep
th Z
[m
]
ONK-PP 86 ONK-PP 87 ONK-PP 88
b)
-110
-105
-100
-95
-90
0 10 20 30 40 50 60 70 80 90 100
Aperture of fracture bhydr [microm]
Dep
th Z
[m
]
ONK-PP 89 ONK-PP 90 ONK-PP 91
c)
-110
-105
-100
-95
-90
0 10 20 30 40 50 60 70 80 90 100
Aperture of fracture bhydr [microm]
Dep
th Z
[m
]
ONK-PP 92 ONK-PP 93 ONK-PP 94 ONK-PP 95 ONK-PP 96 ONK-PP 97 ONK-PP 98
Figure 4-5 The observed fracture apertures at the different stages of the grouting test
a) the observations before grouting (3 holes) b) the observations after the first grouting
round (3 holes) and c) the observations after the second grouting round (7 holes)
before the last grouting round (Hollmeacuten 2007)
47
Figure 4-6 The design window in the first grouting round in the second field test The
penetration depth I as a function of the grouting time (t(2D)) ( 0 = 52 Pa and microg =
103 mPas) The hydraulic aperture of the fracture is 24 microm same as in the grouting
holes 87 and 88 The shaded area represents the design window for the pressure and
the grouting time when I = 283 m (Hollmeacuten 2007)
Conclusions of the two grouting field tests
As a conclusion of grouting tests Hollmeacuten (2007) presents the following opinions
The water loss measurement and the flow logging used together are useable and
recommended investigation methods to estimate the number and the hydraulic apertures
of fractures The hydraulic aperture of a fracture is quite a good estimation for the
grouting aperture and it should be known before the grouting parameters are decided
The field tests proved that the overpressure of water loss measurement should be
revised when operating in deep averagely fractured rock Based on the study the
recommended grouting pressure is little less than the limit for hydraulic uplifting
48
Concerning the stop criteria the main conclusion about the field test was that the stop
criteria based on the analysis of grout penetration is not easy to use when a fracture
system is complicated but may be usable when it is simple (Hollmeacuten 2007) The theory
takes into account only the fractures that are intersected by a bore hole The criterion is
also difficult to use if the fracture characteristics are unreliable Therefore Hollmeacuten
(2007) suggested further development of the time stop criterion (grouting time ndash
method) is needed since the exact characterization at the site is very difficult However
the theory behind the time stop criterion is a useful tool for the optimisation
The following conclusions from the experiences of the field tests were also expressed
by Hollmeacuten (2007)
- The grout properties used in the design calculations should be results from the field
using a real grouting equipment not from the laboratory
- The rock characterization methods (the water loss measurement and flow logging)
give only estimations about the fracture density and their apertures Real fracture
network to where the grout penetrates can be much different
- If the required inflow target is strict the grouting holes inside the tunnel profile can
risk the grouting result
- The total number of grouting holes in a fan should not be minimized because there
is always a risk that the grouting hole doesnrsquot cut the fracture sufficiently
- A safety factor for the penetration length is recommended
- Packers must extend longer to the rock mass than the excavation damaged zone
- It is important that before grouting the contractor informs all the differences and
disturbances from the excavation to the grouting designer and
- Grouting equipment the accuracy of the flow meter should be at least
001 dm3min
If the packers are released too early the grout flows out from the borehole and at the
same time the grout may flow from the fractures to the borehole If that happened the
grouting would be unsuccessful The beaker test to illustrate packersrsquo removing time
was used in the field tests The results of the test were invalid because in two cases the
grout flowed out from the borehole when the packers were released Therefore the
methods to indicate packerrsquos removing time need further developing
Pilot field test with colloidal silica
A preliminary study of grouting with colloidal silica was done in the year 2007 This
study included also a pilot test grouting with the colloidal silica which is described
below The test is fully reported in project memorandum
The objectives of the silica test from the grouting technology point of view were to
1 obtain experiences of the material (colloidal silica) under the prevailing conditions
at ONKALO and with Posivaacutes grouting equipment
2 test and collect practical experiences about post-grouting with colloidal silica and
3 collect experiences on removing colloidal silica from the drill holes
49
The test site was located in the ONKALO access tunnel at about the chainage 1815 at
the depth level of about -180 m (Figure 4-7) The location of the grouting and the
control holes is depicted in Figures 4-7 and 4-8 The boreholes PR2 - PR5 are the
grouting holes and the holes PR6 - PR15 are the control holes A vertical geological
structure including water conductive fractures was assigned as the test site location
A commercial Meyco MP 320 colloidal silica and its NaCl accelerator (Meyco MP320
accelerator) were used in the pilot test
Before the first grouting trial the grouting holes PR2 - PR5 were characterized by the
water loss measurement the flow logging and the out flowing water The results
obtained from different measurements were not fully compatible but they gave a clear
indication that the holes intersect a water conductive fracture and its hydraulic aperture
was estimated to be ~15 microm (calculated from the flow log results) No hydraulic
connections between the holes or between the holes and the tunnel were detected The
temperature in the beginning of the holes was ~12 oC eg close to that prevailing in the
tunnel However it varied along the holes The water pressure was 16 MPa The
temperatures of the colloidal silica and the accelerator were 122 oC and 123
oC
respectively
Prior to the grouting test the beaker tests were conducted in order to determine the
gelling times and the dosing of the accelerator The target gelling time was 45 min and
thus the pumping time 23 min was set Five mixing ratios (colloidal silicaaccelerator)
were tested in tunnel conditions and the mixing ratio 5125 met the target value for
gelling time
The grouting design was calculated with the 1D model for penetration The target
penetration length was 15 m The stop criterion was grouting time
Before the grouting was started the agitator and the grouting hose were washed with
water in order to remove the alkaline water from the equipment The grouting mass with
the silicaaccelerator ratio 5125 was mixed in the agitator for 60 seconds
The four grouting holes were equipped with short packers and the valves were in open
position Air and water were removed from the grouting hose The pressure was
increased to the planned grouting overpressure (04 MPa) immediately thereafter and
the pressure was kept constant The grouting was started from the drill hole PR2 It
became evident that the mass intake will be very small within the planned grouting time
(23 min) In fact during the grouting there was water in grouting holes that was injected
into the fractures instead of colloidal silica The grouting overpressure was raised to 09
MPa without any conceivable effect on the rate of mass intake The observations were
made at the pressure gauge grout movement may have happened but it was not possible
to detect
50
Figure 4-7 The silica grouting test The job site in the ONKALO access tunnel (top
view PL refers to the chainage) and the location of the grouting holes ONK-PR2 ndash
ONK-PR5 (A = the length of the grouting holes B = the distance from the tunnel) The
brown element is a vertical geological structure and the blue lines shows the water
leaking fractures observed in the tunnel roof and the walls The control holes were
drilled later to the same direction and inclination with the grouting holes
Figure 4-8 The location of the grouting holes (front view) ONK-PR2 ndash ONK-PR5 and
the control holes ONK-PR6 ndash ONK-PR15 The drill holes ONK-PR2 ndash ONK-PR15 are
7 m long and declined 5 o
PR10
PR3
PR4
PR5
PR7
PR8
PR6
PR9
PR11
PR15
PR14
PR13
PR12
30 m
13 m
15 m
m
075 m
x
y
asymp 40deg
B
A
x
y
x
y
asymp 40deg
B
A
PR2
51
The gelling time determined with the beaker method gave the value of 35 min after the
mixing This value was 10 min shorter than the value (45 min) from the test a few hours
before with the same method One possible explanation could be that in spite of
cleaning the agitator and the hose before the grouting test there has been some alkaline
water left somewhere in the equipment accelerating the gelling reaction In the
following batch the result of the beaker tests was in line with the earlier test results
The most conductive drill hole PR5 was grouted next The longer gelling time (57 min)
was applied with the mixing ratio 511 The grouting overpressure was also raised to
15 MPa The silica intake was about the same as in the previous hole (1 - 2 l) regardless
of longer grouting time (30 min) and higher grouting pressure The gelling time of
55 min was quite close to the value determined earlier with this mixing ratio The
cleaning of the holes was not done
In total two holes were tried to be grouted and then the test was interrupted The first
grouting trial failed because the grout flow was too slow with regard to the gelling time
and the grouting was interrupted A new test was designed The principle was the same
but the following key modifications were made
1 In the calculation the 2D model is to be used instead of applying the 1D model
2 Longer gelling times are preferred because of very small fracture apertures and
3 The grouting holes are to be filled with colloidal silica before grouting
The target was to grout 2 h In order to reach suitable gelling time new mixing ratios
(silicaaccelerator) for the beaker tests were determined One ratio was the same as in
the first trial The air temperature was T = 13 oC during the test In these beaker tests
the silica sol did not gel if the ratio was lt 506 - 504 The optimal ratio seemed to
have been from 508 to 510
When the gelling time of the mix 510 was compared with the earlier result the gelling
time in the second test was 15 min more (79 min) than in the first test (65 min) The
gelling time is an important part of accurate design and grouting Because of the
significant difference in gelling times it was decided to study briefly whether there
would be any potential differences in a) using fresh accelator from the container intact
and option b) aged accelerator from the container been in use earlier The mixing ratio
was set to be 517 The point was to ensure that the accelerator that was to be used for
the grouting test was not defected by aging A small difference was observed (3 min in
gelling time) and the fresh accelerator was quicker It was decided to make the
additional tests with both accelerators just before the grouting test to be more confident
about the behaviour of the accelerator and the suitable mixing ratio
The accelerator from both drums (the difference being in the dates the drums were
opened) with the different mixing ratios was subjected to the additional tests The
colour of the accelerator in the newly opened drum (opened on the previous day) had
turned dark gray overnight The colour was similar to the accelerator in the earlier
opened drum The inner surface of the container looked rusty as well
52
Unexpectedly these tests indicated that the accelerator from the barrel opened earlier
was more effective The only accurate gelling time was from the measurement with
ratio 508 where the accelerator reacted even 2 h faster (2 h 44 min vs 4 h 47 min)
The mixes with ratios 510 gelled in less than 1 h 53 min The results with the aged
accelerator were more in line with the previous test results and it was decided to use that
in the grouting test On the basis of the results the mixing ratio 509 was chosen with an
aim of 2 h gelling time
The grouting design was done with the following assumptions the fracture aperture was
15 microm the grouting pressure was 25 MPa and the gelling time was 2 h The penetration
distance of 16 m was targeted
All four holes were to be grouted The task to fill the holes after mixing the silica mass
(t = 0 which initiated the time available for grouting) was started with a newly
constructed filling device (Figure 4-9) That was used to remove the water from the
grouting hole and the hole was filled with the silica mix The filling proceeded as the
filling hose was inserted through the duct in the packer to the bottom of the hole The
holes were filled one by one There was a short delay because of the grout mix shortage
and a new batch had to be mixed Thats why the start of the grouting was postponed
In the beginning the grouting pressure was raised to the target value (the designed
pressure) about 25 MPa No mass flow was detected in the flow meter Then the
pressure was raised to the values 38 - 42 MPa and eventually to 46 - 47 MPa Due to
the measuring accuracy (00 dm3min) the flow meter did not show any grout flow but
the pistons in the pumps were moving and it was concluded that the flow occured
During the whole grouting three holes (PR2 PR3 and PR5) took in grout each of those
took about 1 l and the total grout intake was 3 - 4 l The grouting was stopped after 86
min counted from the first mixing The sample from the first batch had already started
to gel Out of the total duration 42 min was used for filling the holes and 44 min for the
grouting During the grouting the pressures close to the grouting holes were quite
similar with the gauge readings at the grouting equipment
When comparing the water leakage results (PR2dry PR3125 mlmin PR430 mlmin
and PR5100 mlmin) conducted in the holes before the grouting and the silica intake
during the grouting it can be concluded that the results are not unambiguous
In the beaker including silica from the first batch from the agitator the mix gelled in 1 h
33 min The corresponding sample taken from the end of the hose remained fluid The
gelling times with constants mix ratios differed from the test to another The target
gelling time of 2 hours was not reached in this test
The grouting was considered successful since the grout intake was 3 - 4 l more than the
total volume of the grouting holes and the test continued with controlling of the result
and cleaning of the holes
53
Figure 4-9 The filling device to replace the hole water with silica
Some leakages (1 - 190 mlmin) were observed in five control holes Unexpectedly the
highest leakage was in PR8 and the next highest in PR6-7 These control holes were the
closest to the grouting holes The only measurable water loss was in the drill hole PR8
(50 mlmin under 03 MPa)
The holes PR2 and PR3 were cleaned by removing silica mass using a steel brush A
drill rig was employed for the job Before cleaning the packers were removed from the
holes The packer was removed from one hole and the silica mass in liquid form was
found inside the packer after six days even though the gelling times observed in cups
were about 15 - 2 h Removal of the packers after two weeks setting time resulted in
the out flow of unhardened silica from the holes (see Figure 4-10) A sample was
collected from the surface into a plastic bag and it started to gel within a few hours
Anyhow the cleaning trial was done as follows A steel brush was attached with the rod
(Figure 4-10) As planned brushing was started without flushing (air or water) in the
drill hole PR2 The drill rod and the couplings became hot and decoupling failed Later
the coupling between the brush and the rod had loosened during the previous activity
when trying to open the coupling between the rods Eventually the hole was washed
with the water hose Silica residual was observed on the hole wall (PR2) after brushing
and spooling The trial in this hole failed to remove all the liquid silica In the hole PR3
instead of brushing the drill rod with an old drill bit was inserted into the hole and air
flushing followed by water flushing was used Liquid silica spurted from the hole quite
soon
54
Figure 4-10 The grouting hole PR2 was cleaned with a steel brush coupled into the
drill rod The silica came out and ran along the tunnel wall
Concluding remarks about the pilot test with the colloidal silica
Plenty of first hand practical experiences were obtained
Water pumps and water flow gauges used in conventional way to determine water
loss were not suitable in these rock conditions with quite a poor conductivity
Results cannot be considered reliable and to draw any conclusions on the effect of
grouting is difficult
Also small grout flow was nearly impossible to observe due to too poor measuring
accuracy of the grouting equipment (00 dm3min) and
The reading accuracy of the flow meters should be 001 dm3lmin
Plenty of experiences were obtained in regards to the silica mass and its behaviour and
about grouting activity Salt-accelerator should be stored in a drum made of material
that does not corrode There was substantial variation in the effectiveness of accelerator
depending partially on the time the drum had been open Additionally the substance
originating from the drum material which made the accelerator turn dark may have an
effect on the reaction between accelerator and silica Homogenous and correctly packed
and stored components would probably give more consistent gelling times The correct
mixing ratio is very essential and the volumes of both components should be dosed
carefully Gelling times were difficult to measure exactly with the beaker method
55
especially when the amount of accelerator was small The gelling time should be
defined more exactly and so that there is a method to observe it Mixing ratios with
accelerator less than 04 - 06 units (per 5 units of silica) will not result in gelling which
means that long (over ~15 h) gelling times cannot be applied
The first trial had to be discontinued before the holes were full because the small
apertures and short gelling time resulted in a slow flow rate that was not measurable
with the equipment in use In the second trial a separate filling device was used to fill
the holes with silica prior to grouting That saved time for the actual grouting and that is
a practice recommended at least in the case of tight fractures The filling of three holes
took about 3 x 5 minutes (+ time required for dosing and mixing) and this time
consumes the effective grouting time available Several holes can be filled
simultaneously
The time required for the filling of holes should be taken into account when designing
the grouting with colloidal silica The gelling time should be long enough to allow both
the filling of holes and the actual grouting phase before gelling takes place Detailed
planning of the work phases is important and the work phases should be performed
without significant delays
Long gelling times are not always suitable but in some cases they are preferable
because eg unexpected delays do not cause that significant error in design (open time
shorter than expected in the design) In principle very short gelling times are possible
with colloidal silica but each working stage requires a certain time The work stages
should be taken into account already in the design The inaccuracy in gelling time
particularly by using long gelling times caused by a disturbance (dirty equipment
inexact dosage etc) however can be worse with respect to stop criteria than by short
gelling times Because mass intake can be high in large fractures the gelling times
should be short and that can be difficult to control technically The use of colloidal
silica in larger fractures under high groundwater pressures seems also a little bit
challenging how to get colloidal silica to gel subjected to strong water flows
Silica (at least in a liquid form) cannot be totally removed from holes with brushing and
flushing The steel brush should be welded to the rod if brushing is desired It is
difficult to insert the rod into a hole without direction marks behind the boom Should
monitoring of silica in holes andor cleanliness of holes be considered necessary the
working practices should be developed further
56
57
5 OPTIMISATION OF GROUTING FOR ONKALO 51 Objectives for grouting
The design requirements of the water inflow set for ONKALO are in place to prevent
the disturbances foreseen as described earlier (Chapter 2) Those requirements are
presumed to be met by taking the measures below
ONKALO shall not be built close to heavily water conductive rock or drill holes
Seawater should not intrude into the repository host rock and groundwater table
should not be drawn significantly below sea level
Surface waters should not migrate towards the disposal level
Significant upconing of deep saline groundwater should not take place
ONKALO should not create significant permanent hydraulic connections
Inflow rate of groundwater should be as low as possible and
Seawater should not intrude into the repository host rock
The principals above will result in a respect distance to major water conductive zones
and to investigation holes Furthermore the maximum limit values for the groundwater
inflow have been determined The allowable flow rate is lt140 lmin The latter values
were set by interpreting the ldquoinflow rate of groundwater as low as possiblerdquo to be about
1 - 2 lmin100 m At the time the construction started this inflow was generally
considered the lowest achievable inflow rate
As the understanding has enhanced the interaction between alkalis released from
cements and bentonite as a part of Engineering Barrier System (EBS) and backfill
material in the repository has been raised to be one key issue The phenomena are not
fully understood and absolutely right limit values eg for the use of cement cannot be
given Even though exact values are not possible to determine with models the
guidelines for the use of cement are given grouts below the RH20 structure should be
of low pH (eg the pH in the leachant lt 11) and the amount of cementitious materials
should be minimised The practices to fulfil the latter include limiting the grout take
using as thick grouts as possible and directing the grouting holes inside the tunnel
profile
The design requirements set for the total inflow and the local inflow rates were not
changed due to the R20 programme
52 The expected hydrological conditions from the grouting point of view
The expected hydrological conditions below the depth of -300 m were determined for
grouting design purposes The main aim was to foreseen the conditions that are likely to
prevail for grouting in the future
The data processing and its results are reported fully by Vaittinen et al (2007)
58
521 Collection and selecting of data and data processing
Because the rock volumes about 20 m x 20 m x 20 m are of interest from the grouting
point of view the below presented approach is not connected to any current bedrock
model or hydrological model The design solutions are aimed to be free from any
particular tunnel layout or geological or hydrological model since those may change
and thus the grouting design solutions would become invalid
The criteria for fracture zones in the data processing were the same as in the bedrock
model 20031 (Vaittinen et al 2003) (Table 5-1) This study however is not related in
any other respect to that version of the model The same approach which was used in
that bedrock model that took into account both the hydraulic properties of fractures and
the rock fracturing was selected for the data processing as well The criteria used
comply with the Finnish Engineering Geological Classification system (Gardemeister et
al 1976) and it is complemented with other elements The data used here was the one
available from the deep drill holes (OL-KR-holes) by February 2007
The description of hydrogeological conditions is based on the properties of
hydraulically conductive fractures ie transmissive fractures at the depth range of -300
- -600 m see Figure 5-1 The lowest measured transmissivity is 1110-10
m2s but due
to the measuring method the transmissivity values below 110-9
m2s cannot be
systematically measured The properties are processed statistically and the probable
occurrence density in horizontal tunnels was assessed The combined length of the drill
holes down to the levels between -300 m and -600 m is about 5630 m The
transmissivity of the fractures is measured with the Posiva Flow Logging Device
(Oumlhberg amp Rouhiainen 2000)
Table 5-1 The simplified description of the criteria of fracture zones used in the data
processing (same as in Vaittinen et al 2003) The rest of the rock is treated as
averagely fractured rock
PROPERTY CRITERION
Fracture frequency
The primary fracture frequency criterion ge 10 fractures 2 m
Intersection boundaries lt 10 fractures 2 m
Type of structure intersection
RiIII A fracture zone
RiIV-RiV Crushed zone
Hydraulic zone
Measuredcalculated K-2m 5E-7 ms
59
Figure 5-1 The transmissive fractures observed in the deep drill holes (Vaittinen et al
2007) The red box stands the depth range of -300 - -600 m and those are the
observations used here
The orientation of the transmissive fractures was detected from the drill hole samples
OL-KR1 - 5 7 - 15 19 - 20 and 22 (Hellauml et al 2004 amp 2006) The orientation for the
area represented by the drill holes OL-KR24 - 25 27 and 38 - 42 has been determined
combining flow anomalies with the conductive fractures based on core sample mapping
The processing of transmissive fractures from the original data into the form of
expected hydrological conditions in horizontal tunnels was performed in the following
steps
1 All transmissive fractures were assessed together
2 Transmissive fractures were classified by dip 0 - 30deg 30 - 60deg and 60 - 90deg
3 Order of magnitude correction coefficient was approximated for biased fracture
observations The coefficient was based on the ONKALO fracture mapping data
4 Transmissive fractures were classified by hydraulic aperture below 0020 mm
0020 - 0050 mm and above 0050 mm
5 Transmissive fractures were classified either to occur as a distinct fracture in the
averagely fractured rock or to belong to a fractured zone (criteria as in Vaittinen et
al 2003)
6 In order to evaluate the distance between the transmissive fractures in tunnels the
observations (oriented transmissive fractures) made in drill holes were projected to
the horizontal plane
7 Distinct transmissive fractures were classified by dip as in the stage 2) and by
hydraulic aperture as in the stage 4) and
8 Transmissive fractures in fractured zones (criteria as in Vaittinen et al 2003) were
assessed zone by zone
60
The dip and the hydraulic aperture were selected as a basis for the classification of the
data since they are the key properties from the point of view of groutability The
aperture affects on the penetration ability and the penetration length of a grout mix The
fracture angle in terms of dip is an important factor when determining the penetration
length required Perpendicular penetration length from the tunnel surface is important
due to eg rock bolts and fracture dip affects on this
Based on general understanding about grouting the hydraulic apertures are divided into
the classes less than 0020 mm 0021 - 0050 mm and more than 0050 mm due to the
following reasons the grouting of fractures with an aperture of lt0020 mm is probable
impossible with cementitious grouts and the need for grouting of these fractures is
questionable The grouting of fractures with a hydraulic aperture of 0021 - 0050 mm is
probably needed although it might be difficult with cementitious grouts Colloidal
silica is generally considered more capable to penetrate into the fractures of this size
The fractures with a hydraulic aperture of gt 0050 mm shall be grouted and
cementitious grouts are considered applicable to seal these kind of fractures partly or
fully
The statistics of all fractures and the full data processing is presented by Vaittinen et al
(2007) As an outcome only the data of interest from the point of view of grouting is
presented below
522 Statistics
To characterize the hydrogeological properties expected in the bedrock for grouting
purpose the transmissive fractures were classified either into the averagely fractured
rock or into the fractured zones (criteria presented in Table 5-1) The total hole length
studied was 5630 m Out of this 420 m (75) belonged to the fractured zones
Applying this classification the mean transmissivity is almost two decades higher in the
fractured zones than in the average rock see Table 5-2 and Figure 5-2
The transmissive fractures were divided further on the basis of the hydraulic aperture to
three sub-groups bhydr lt 0020 mm 0021 gt bhydr gt 0050 mm and bhydr gt 0050 mm
(Table 5-2) The distribution of the observations clearly differs between the average
rock and the fractured zones In the average rock 62 of the transmissive fractures have
the hydraulic aperture less than 0020 mm whereas the transmissive fractures with the
hydraulic aperture greater than 0050 mm is the largest group 44 in the fractured
zones (Vaittinen et al 2007) The analysis indicates that the proportion of fractures with
the hydraulic aperture larger than 0050 mm dipping towards the south-west within the
average rock is quite high and proportion of gently dipping fractures with the hydraulic
aperture less than 0020 mm within the fractured zones is low The transmissive
fractures with the hydraulic apertures greater than 0050 mm have mostly gently dipping
orientations
61
Table 5-2 The statistics of the observed transmissive fractures within the averagely
fractured rock and within the fractured zones transmissivity (T m2s) and spacing (S
m) (Vaittinen et al 2007)
T mean m2s
(count)
T
Median
m2s
T St
Dev
m2s
S Mean
m
(Nr of
observations)
S
Median
m
S St
Dev
m
Average rock 26middot10-8
(184) 27middot10-9
83middot10-8
223 (149) 92 323
bhydr lt 002 mm 14middot10-9
(114) 11middot10-9
11middot10-9
249 (85) 114 342
002 gtbhydgt 005 mm 18middot10-8
(56) 13middot10-8
16middot10-8
425 (35) 226 507
bhydr gt 005 mm 26middot10-7
(14) 21middot10-7
18middot10-7
373 (6) 30 580
Fractured zone 16middot10-6
(126) 39middot10-8
47middot10-6
13 (71) 08 16
bhydr lt 002 mm 18middot10-9
(32) 19middot10-9
12middot10-9
08 (21) 07 09
002 gtbhydrgt 005 mm 23middot10-8
(38) 19middot10-8
17middot10-8
13 (23) 07 16
bhydr gt 005 mm 36middot10-6
(56) 47middot10-7
66middot10-6
18 (27) 11 20
0
10
20
30
40
50
60
70
80
90
100
0000 0050 0100 0150 0200 0250 0300 0350 0400
Hydraulic aperture mm
Culu
lativ
e fre
quency
Average rock Zones
Figure 5-2 The cumulative frequencies of the hydraulic apertures within the averagely
fractured rock and within the fractured zones
62
523 Expected transmissive fractures within averagely fractured rock in the
tunnels
The occurrence of the transmissive fractures expected in the tunnels classified
according to the dip and the hydraulic aperture is presented in Table 5-3 The number
of observations with the hydraulic apertures larger than 0050 mm is so low that the
results are only indicative The statistics of spacing and the orientation of the expected
fractures (corrected orientation and occurrence) within the averagely fractured rock are
given in Figure 5-3
524 Expected transmissive fractures within fractured zones in the tunnels
The statistical analysis of the fractured and hydraulic structures based on the bedrock model version 20031 has been done in 2004 (Hellauml et al 2004) Vaittinen et al (2007) further treated this data and defined eight data sets Each of these data sets was used to generate several realizations (Hellauml et al 2004) of the structures
Based on the mean number of the intersections it was estimated that the tunnel would intersect approximately 20 fractured or crushed zones along 3000 m of the tunnel below the level of -300 m Order of magnitude frequency for these structures would be one structure per 150 m After the criteria applied for the fractured zones (Table 5-1) they may contain no transmissive fractures
The histograms of the transmissivity and the corresponding hydraulic aperture and the dip direction and the dip are shown in Figure 5-4 Compared to the fractures in the averagely fractured rock the transmissivity is clearly higher within the fractured zones The orientation histograms are quite similar with the other data sets Vaittinen et al (2007)
The illustrations of the fracture sets expected are presented in Figures 5-5 and 5-6
Table 5-3 The determined spacing of the classified transmissive fractures within the
averagely fractured rock
Hydraulic apertureDip
Dip lt 30 dgr Dip 31 - 60 dgr Dip gt 60 dgr
bhydr =lt 0020 mm 112 m (30) 146 m (23) 146 m (23)
0020 gt bhydr gt 0050 mm 372 m (9) 239 m (14) 419 m (8)
bhydr =gt 0050 mm 1117 m (3) 3350 m (1) 1117 m (3)
0
38
48
22
6
0 0
0
33
75
95 100 100 100
0
5
10
15
20
25
30
35
40
45
50
1E-10 1E-09 1E-08 1E-07 1E-06 1E-05 1E-04
Fracture T m2s
Fre
quency
0
20
40
60
80
100
120
97
47 47
4
8 14
55
96 100
0
5
10
15
20
25
30
35
40
45
50
01 1 10 100 1000
Spacing m
Fre
quency
0
20
40
60
80
100
120
26
47
2219
23
64
83
100
0
5
10
15
20
25
30
35
40
45
50
90 180 270 360
Dip direction
Fre
quency
0
20
40
60
80
100
120
42
38
34
37
70
100
0
5
10
15
20
25
30
35
40
45
50
30 60 90
DipF
requency
0
20
40
60
80
100
120
Figure 5-3 The histograms of the transmissivity the spacing the dip direction and the dip of the transmissive fractures with the
corrected proportion of gently moderately and steeply dipping fractures within the averagely fractured rock
63
0
11
3234
28
14
7
0
9
34
61
83
94 100
0
5
10
15
20
25
30
35
40
1E-10 1E-09 1E-08 1E-07 1E-06 1E-05 1E-04
Fracture T m2s
Fre
quency
0
20
40
60
80
100
120
22
46
26 25
18
57
79
100
0
10
20
30
40
50
60
90 180 270 360
Dip direction
Fre
quency
0
20
40
60
80
100
120
52
46
2144
82
100
0
10
20
30
40
50
60
30 60 90
Dip
Fre
quency
0
20
40
60
80
100
120
Figure 5-4 The frequency of the water conductive fractures within the fracture or crushed zones in terms of the transmissivity and the
histograms of the dip direction and the dip for the fractures within the fracture zones
64
65
Figure 5-5 Examples of water conductive 2- and 3-fracture systems observed in the
deep rock in Olkiluoto
Figure 5-6 Examples of water conductive complicated systems with multiple fractures
observed in the deep rock in Olkiluoto
The information above has been used when selecting the fracture systems studied in the
feasibility study of grouting design solutions (Section 53) The data will be useful also
when preparing for the future groutings beforehand
53 Feasibility of the design solutions
The theoretical study was carried out by Lokkila (2008) in order to assess the feasibility
of the design solutions
The aim was to start with ideal design solution focusing the grouting in places
determined based on the rules for local leakages the grouting with low pH grouts
66
minimising the grout to remain in the rock by having the grouting holes inside the
tunnel profile and limiting the grout take The study concentrated in fracturing
conditions determined by Vaittinen et al (2007) (Section 52) The work was iterating
until the design solution was found If it was not found the alternative design solutions
were suggested This work can be utilized for actual grouting design in the future by
giving general operating limits eg for grouting pressures grouting patterns etc
531 Optimal design solution
The optimal grouting design solution includes the following components
Use of low pH grouts
Grouting holes inside the tunnel profiles (Figure 5-7) and
Controlled grout penetration (3 - 20 m)
This design solution was studied by using the Grouting Time -method (the same
analytical approach as used in time stop grouting) in the study carried out by Lokkila
(2008)
The target was to find the most optimal design solution for different fracture-tunnel
systems However the practical point was kept in mind all the time eg the grouting
pressures were aimed to be low enough
Figure 5-7 A tunnel in rock showing the principle of a pre-grouting fan where the
grouting holes are inside the tunnel profile The grouting holes inside the tunnel profile
diminish the amount of the stray materials in the rock
67
532 Calculation system and studied cases
The study proceeded as presented in Figure 5-8 and the aim of systematic approach was
to
Identify the cases that can be handled with typical design solutions and find feasible
design solutions and
Identify the cases that cannot be handled with typical design solutions
The calculations were made for 1D and 2D cases The 1D case means the flow in a
canal (fast flow) the 2D means radial flow (slower flow) The 2D flow was selected due
to conservativeness of the study It is hard to detect which kind of flow occurs in the
fracture for real The 3D flow is also possible especially in complicated fracture zones
like RH19 and RH20 but it was ruled out in this study since there are no practical
calculation tools available yet
The cases were first determined on the basis of hydrological conditions at the Olkiluoto
site and one additional component ndashtunnel direction ndash was added (Table 5-4) In order
to limit the number of the cases in the study the tunnel directions 000 045 090 and 135
degrees and the dip directions 00000 00015 00030 00045 00060 00075 and
00090 degrees were selected The cases were numbered for identification
In the very beginning it turned out that the range -270 - -520 m has to be divided into
Two parts and the fracture group 50 - 400 microm has to be split into several
parts
Figure 5-8 The study flow chart (Lokkila 2008)
Basic design solution feasible
5-10 optimal solutions for pressure and
time space grouting fan and mass mixes
Succeeded
OK
Succeeded
Other designsolution
Define suitable design
areas for special cases
Special grouting cases
inc pre-injection
R20- structure
shafts
Not Succeeded
Variations
1 Varying mass recipes
2 Changing minimum penetration of grout maximum volume injected
3 Changing fans to outside of the profile
Not succeeded
Starting values
Grouting pressure minimum and maximum penetration length and minimum aperture
About 2-3 basic masses with different properties
Fans to inside of the profile (distance 1m) bevare of the backflow
Basic design solution feasible
5-10 optimal solutions for pressure and
time space grouting fan and mass mixes
Succeeded
OK
Succeeded
Other designsolution
Define suitable design
areas for special cases
Special grouting cases
inc pre-injection
R20- structure
shafts
Not Succeeded
Variations
1 Varying mass recipes
2 Changing minimum penetration of grout maximum volume injected
3 Changing fans to outside of the profile
Not succeeded
Starting values
Grouting pressure minimum and maximum penetration length and minimum aperture
About 2-3 basic masses with different properties
Fans to inside of the profile (distance 1m) bevare of the backflow
68
69
Table 5-4 The fracture-tunnel systems studied (Lokkila 2008) CS = colloidal silica
Aperture bhydr (mm)Dip direction Dip 30deg (0 15 and 30) Dip 30-60deg (30 45 and 60) Dip gt 60deg (60 75 and 90)
lt0020 Restricted penetration tunnel dir vs dip dir tunnel dir vs dip dir tunnel dir vs dip dir
of any grouts 000 045 090 and 135 deg 000 045 090 and 135 deg 000 045 090 and 135 deg
0021-0050 Cement grouting tunnel dir vs dip dir tunnel dir vs dip dir tunnel dir vs dip dir
difficult unrestricted 000 045 090 and 135 deg 000 045 090 and 135 deg 000 045 090 and 135 deg
penetration of CS
assumed
0051-0400 Unrestricted penetration tunnel dir vs dip dir tunnel dir vs dip dir tunnel dir vs dip dir
of cement grouts 000 045 090 and 135 deg 000 045 090 and 135 deg 000 045 090 and 135 deg
assumed
Only case with a single fracture was calculated since the same logic can be used in
multiple fracture cases When applying optimized grouting to the multiple fracture cases
two or several grouting rounds are probably needed This is traditionally called the split
spacing technique
Some cases can be theoretically grouted using the ideal drilling fan because the grouting
holes intersect the fracture (example in Figure 5-9) Some cases turned out to be
impossible to handle with the optimal design solution because the grouting holes do not
intersect the parallel fracture (see Figure 5-8) Those cases in terms of the tunnel
direction and the fracture orientation are 000-00000 045-00000 090-00000 090-
00015 090-00030 090-00045 090-00060 090-00075 090-00090 and 135-00000
In deep rock conditions the groundwater flow pattern and pressure is practically the
same around the tunnel Only the tunnel roof is a little bit different since rock bolts are
located there In many cases the tunnel direction and the fracture orientation were
practically same ie their relative angle turned out to be the same and the calculation
and results are valid for a few occasions Those cases in terms of the tunnel direction
and the fracture orientation are 000-000015 045-00015 and 135-000015 000-
00030) 045-00030135-00030 000-00045 045-00045135-00045 000-00060
045-00060 135-00060 000-00075 045-00075 135-00075 000-00090 045-00090
and 135-00090
70
a) b)
Figure 5-9 Illustrations of fractures that a) can be handled with symmetrical drilling
pattern and b) requires a modified drilling pattern (Lokkila 2008)
533 Starting values
There are six different types of low pH grouts available (Ranta-Korpi et al (2007)
Appendices 1 amp 2) grout 1 (G1) = UF-41-10-3 grout 2 (G2) = UF-41-10-4 grout 3
(G3) = UF-41-12-3 grout 4 (G4) = UF-41-14-3 grout 5 (G5) = UF 41-12-4 and grout 6
(G6) = UF-41-14-4 see Table 5-5 The values measured at 0 min were used in the
calculations
In order to control the grout take the thickest grout (the highest yield value) was
preferred Groundwater pressure increases with depth about 1 MPa per 100 m The
depths used in the study were 270 400 and 520 meters and the groundwater pressures
were 27 MPa 40 MPa and 52 MPa respectively
Because the fracture orientation cannot be observed but the penetration length aimed at
should be determined the perpendicular distance from the tunnel wall was used as a
penetration length instead of the actual penetration length The perpendicular
penetration length is limited between 3 and 20 meters The lowest value is the most
important one because that confirms that grouting seals well The upper limit is used
due the need to limit the grout take
Even though the long pumping time is not desired the maximum pumping time may be
up to 2 hours with the cement-based grouts The gelling time for a silica grout is
determined in advance by changing the silicaaccelerator ratio
The maximum pressure capacity of Posivarsquos grouting pumps is 20 MPa Theoretically
in the depth range -270 - -520 the grouting overpressure can vary between
148 - 173 MPa In the feasibility study the maximum grouting overpressure was
selected to be 15 MPa at most (with the prevailing water pressure of ~5 MPa) The
minimum grouting pressure must be higher than the groundwater pressure The
maximum grouting pressure was calculated with formula by Gustafson (2005)
71
The risk for the backflow was considered as well In practice the risk for the backflow
is not imminent because the grout has set to a certain extent before the removal of the
packers
534 Calculation process
The calculation was made in stages (Lokkila 2008) as briefly described below in Table
5-6
535 Summary of the results
The calculation results are summarised in Tables 5-7 and 5-8 The whole calculation
process and the results are described by Lokkila (2008)
It can be seen from the results that between the depth range of -270 - -400 m the optimal
design solution ie the use of the low pH grouts the predetermined grout take and the
grouting holes inside the tunnel profile is supported by the theory in the hydraulic
apertures of 100 microm In the smaller apertures there is a risk that the grout penetration
length as targeted is not obtained within the reasonable time frame and the alternative
design solutions should be considered if the water leakages are the priority criteria of
the acceptance The problems may occur mainly in the fractures nearly parallel to the
tunnel as the grout has to penetrate very long way to reach the perpendicular distance
required The alternative design solutions are eg the use of the thinner grouts (the
colloidal silica or the thinner cementitious grouts) the addition in the grouting pressures
andor to direct the grouting holes outside the tunnel profile In the depth range of -400 -
-520 m the aperture limit for the feasibility of the optimal design solution is at around
200 microm
Together with the expected rock conditions from the grouting point of view the results
indicate that for the most of the cases alternative solutions rather than the optimal
design solution shall apply
Table 5-5 The grout mixes and their properties used in the feasibility study (modified from Ranta-Korpi et al 2007)
Mix The nr of samples Marsh fresh [s] Marsh 05h [s] Marsh 1h [s] Plast Visc fresh
[mPas]
Plast Visc 30min
[mPas]
Plast Visc 60min
[mPas]
Yield value fresh
[Nm2]
Yield value 30 min
[Nm2]
Yield value 60min
[Nm2]
UF-41-14-4 25 41 41 41 104 166 174 84 93 94
UF-41-14-3 3 54 53 52 220 161
UF-41-12-3 5 114 113 113 366 567 497 312 283 271
UF-41-12-4 4 56 51 49 154 252 263 156 155 163
UF41-10-3 1 612 1087 492 563
UF-41_10-4 4 131 123 95 279 342 366 250
UF-15-10-28 4 39 41 38
UF-41-10-48 1 52 46 47 111 196 213 145 133 143
UF-41-12-36 3+1 61 62 66 272 334 420 199 220 236
UF-41-12-48 10 42 41 41 131 141 162 93 83 90
UF-41-14-48 6 36 36 36 80 100 105 52 48 47
UF-41-08-47 1 130 96 101
UF-41-12-51 1 42
UF-41-14-51 3 37
Mix Filter Pump fresh
100 microm [ml]
Filter Pump (100
microm) 05 h [ml]
Filter Pump
(100microm) 1 h [ml]
b min [microm] b crit [microm] Fall cone 05
kPa [min]
Fall cone 2 h [Kpa] Fall cone 6 h
[Kpa]
Fall Cone 24 h
[Kpa]
UF-41-14-4 310 326 305 34 117 426 10 853
UF-41-14-3 333 337 360 38 85 340 09
UF-41-12-3 275 293 225 47 126 330 11
UF-41-12-4 323 330 290 39 81 345 23
UF41-10-3 130 100 120 106
UF-41_10-4 267 255 140 120 35
UF-15-10-28 278 240 62 192 380 05
UF-41-10-48 340 295 280
UF-41-12-36 290 260 230 32 93 12
UF-41-12-48 332 335 345 19 158 03
UF-41-14-48 303 282 330 30 90 06
UF-41-08-47 300 310 300 64
UF-41-12-51 300 08
UF-41-14-51 325 26 86 05
Filter pump 100 microm sieve Penetrability meter Fall cone
Marsh cone Rheometry measurements
72
73
Table 5-6 The calculation process in the feasibility study The solution refers to the
ideal design solution solved means that the design was analytically solved (Lokkila
2008)
STAGE DESCRIPTION SOLUTION
1 Apertures 50 - 400 microm divided into smaller groups testing with UF-41-14-4 (thinnest) and calculating with UF-41-10-3 (thickest grout)
Apertures down to 200 microm solved fracture dips 15 and 90 turned out to be significant Apertures 50 - 200 microm not solved even with the thinnest grout
2 Apertures 100 - 200 microm calculated with UF-41-10-4 apertures 50 - 100 microm studied
Solution found in group 100 - 200 microm but the grouting overpressures are relatively high Group 50-100 microm not solved
3 Apertures 100 - 200 microm recalculated with UF-41-12-3
Solution found but the grouting overpressures are relatively high
4 Apertures 100 - 200 microm recalculated with UF-41-14-3
Solution found theoretically backflow a little risk and extension of upper limit of penetration length was required
5 Aperture 50 - 200 mm studied with UF-41-12-4
Solutions found drawbacks with backflow and thus extended upper limit of penetration length in group 100 - 200 microm and relatively high grouting pressure in group 50 - 100 microm
6 Aperture 100 microm with UF-41-14-4 (50 microm already tested in Step 1)
Range 50 - 100 microm drawbacks with backflow and thus extended upper limit of penetration length and relatively high grouting pressure in deep rock
7 Aperture 300 - 400 microm recalculated with UF-41-10-4
Solution found theoretically backflow a little risk and required extension of upper limit of penetration length
8 Aperture 200 - 300 microm recalculated with UF-41-10-4
Solution found theoretically backflow a little risk in deep rock and required extension of upper limit of penetration length
9 Summary of the results of the calculations
74
Table 5-7 The results with the cement-based grouts at the depth of -270 - -400 meters
(Lokkila 2008)
B-hydr (mm) Depth 270-400 (m) Comments on design solution Comments
03-04 UF-41-10-3 (mix 1) Solution supported by theory
∆p 43-134 (MPa) (thicker mix better)
I 3-20 (m)
UF-41-10-4 (mix 2) Solution supported by theory Poorer solution risk of
∆p 43-134 (MPa) harmful far penetration
I 3-20 (m)
02-03 UF-41-10-3 (mix 1) Relatively high overpressure Problems in 0200 mm
∆p 64-134 (MPa) with fractures nearly
I 3-20 (m) parallel to the tunnel
UF-41-10-4 (mix 2) Solution supported by theory
∆p 46-134 (MPa)
I 3-20 (m)
B-hydr (mm) Depth 270-400 (m) Comments on design solution Comments
01-02 UF-41-10-3 (mix 1) Solution not supported by theory Problems in 0100 mm
with fractures nearly
parallel to the tunnel
UF-41-10-4 (mix 2) High overpressure Grouting holes Same as above
∆p 98-134 (MPa) outside of the tunnel profile or taking a
I 3-20 (m) risk of remaining leakages in fractures
nearly parallel to the tunnel
UF-41-12-3 (mix 3)
∆p 9-134 (MPa) Same as above Same as above
I 3-20 (m)
UF-41-14-3 (mix 4) Solution supported by theory Risk of harmful
∆p 53-134 (MPa) Relatively high overpressure far penetration
I 3-249 (m)
UF-41-12-4 (mix 5) Solution supported by theory Risk of harmful
∆p 49-134 (MPa) Possible backflow difficult in upper limit far penetration
I 3-257 (m)
005-01 UF-41-12-4 (mix 5) High overpressure Grouting holes Problems in 0050 mm
∆p 103-134 (MPa) outside of the tunnel profile or taking a with fractures nearly
I 3-20 (m) risk of remaining leakages in fractures parallel to the tunnel
nearly parallel to the tunnel
UF-41-14-4 (mix 6)
∆p 63-134 (MPa) Relatively high overpressure grouting Same as above
I 3-239 (m) holes outside of the tunnel profile or
thinner mix or silica grouting
0021-005 UF-41-14-4 (mix 6) Solution not supported by theory Problems in 0021 mm
Grouting holes outside of the tunnel with fractures nearly
profile or thinner mix or silica grouting parallel to the tunnel
∆p = grouting overpressure
I = perpendicular penetration length
75
Table 5-8The results with the cement-based grouts at the depth of -400 - -520 meters
(Lokkila 2008)
B-hydr (mm) Depth 400-520 (m) Comments on design solution Comments
03-04 UF-41-10-3 (mix 1) Solution supported by theory
∆p 58-15 (MPa) Relatively high overpressure
I 32-212 (m)
UF-41-10-4 (mix 2) Poorer solution risk of Problems in 0400 mm
∆p 57-15 (MPa) harmful far penetration with fractures nearly
I 42-285 (m) perpendicular to the tunnel
02-03 UF-41-10-3 (mix 1) Solution supported by theory Problems in 0200 mm
∆p 64-15 (MPa) Relatively high overpressure with fractures nearly
I 3-20 (m) parallel to the tunnel
UF-41-10-4 (mix 2) Solution supported by theory
∆p 57-15 (MPa) Relatively high overpressure
I 3-214 (m)
B-hydr (mm) Depth 400-520 (m) Comments on design solution Comments
01-02 UF-41-10-3 (mix 1) Solution not supported by theory Problems in 0100 mm
∆p 144-15 (MPa) Grouting holes outside of the tunnel with fractures nearly
I 3-20 (m) profile parallel to the tunnel
UF-41-10-4 (mix 2) High overpressure Grouting holes Same as above
∆p 98-15 (MPa) outside of the tunnel profile or taking a
I 3-20 (m) risk of remaining leakages in fractures
nearly parallel to the tunnel
UF-41-12-3 (mix 3)
∆p 9-15 (MPa) Same as above Same as above
I 3-20 (m)
UF-41-14-3 (mix 4) Relatively high overpressure
∆p 73-15 (MPa) Grouting holes outside of the tunnel
I 32-323 (m) profile
UF-41-12-4 (mix 5) Relatively high overpressure or
∆p 67-15 (MPa) thinner mix (backflow)
I 33-334 (m)
005-01 UF-41-12-4 (mix 5) High overpressure grouting holes Problems in 0050 mm
∆p 103-15 (MPa) outside of the tunnel profile with fractures nearly
I 3-20 (m) parallel to the tunnel
UF-41-14-4 (mix 6)
∆p 92-15 (MPa) Relatively high overpressure grouting
I 31-31 (m) holes outside of the tunnel profile or
thinner mix or silica grouting
0021-005 UF-41-14-4 (mix 6) Solution not supported by theory Problems in 0021 mm
Grouting holes outside of the tunnel with fractures nearly
profile or thinner mix or silica grouting parallel to the tunnel
∆p = grouting overpressure
I = perpendicular penetration length
76
536 Additional comments on the grouting of special cases etc
Grouting of the leaking fractures intersecting the tunnel
Post-grouting the grouting of fractures parallel to the tunnel (including all dips between
0 - 90 degrees) and the unsuccessful placement of a grouting fan (too close when a
diagonal fracture is intersected by a tunnel) are conceptually same situations
According to Fransson amp Gustafson (2007) practices for post-grouting have not been
commonly established They have studied post-groutings by analysing the data from the
Aumlspouml rock laboratory Hallandsarings and Toumlrnskog tunnels in Sweden There are very few
experiences in the deep rock Besides the grouting holes have to intersect the fractures
the fan geometry has to be designed taking into account the high pressure gradient
towards to the tunnel This may cause the erosion of grout and the limitations for the
penetration length The deeper the tunnel the greater is the importance of this point The
possibility of jacking should be taken into account and high grouting pressures are not
desired when post-grouting Fransson amp Gustafson (2007) have presented the
theoretical guidelines for designing of post-groutings
Figure 5-10 Illustration of the tendency of grout to flow back to the tunnel under a high
pressure gradient
77
Grouting of major hydrogeological structures compared to small fractures
The nature of major hydrogeological structures differs significantly from that of small
single fractures Major zones consist of complicated fracturing with the wide range of
apertures and fractures are in connection with each other when small single fractures
are typically hard to reach for characterisation
In grouting it is essential to understand that in major hydrogeological structures all the
fractures cannot be successfully sealed at the same time if aiming at somewhat limited
grout take ndash the largest fractures take the grout until they are filled enough and the
pressure starts to rise and the grout is forced to the smaller ones
The hydraulic aperture determines the volume of a fluid in a fracture and follows the
cubic law in relation to water flow This means that as the water flow (and the
transmissivity) from a fracture is doubled the possible grout volume in a fracture will
be 8 fold If comparing the grout take with a certain penetration length in a fracture with
an inflow of 01 lmin to an other fracture with an inflow of 1 lmin the grout take is
1000 times higher in the latter one Vice versa if grouting a fracture with an inflow of
20 lmin instead of a fracture with an inflow of 150 lmin the same penetration length is
reached with 02 of the grout volume in the first mentioned fracture Extremely small
grout takes are expected in the environments of small fractures and it should be
understood that a small grout take ndash even only some litres in addition to the bore hole
volume ndash could be significant and do not necessarily mean grouting in vain
54 Start and stop criteria to be applied 541 Start criteria
When selecting the grouting start criteria for a site one should take into account the
target of the total water inflow and the local leakages the priorities set for the grouting
and the characterisation methods available In the case of ONKALO the targets for the
water inflow and grouting differs significantly from those in most of the tunnelling
projects and the related aspects should be carefully considered Figure 5-11 presents
how the targets can be processed as the start criteria and which are the foreseen
drawbacksrisks in each case The grouting start criterion is based on the approach
where the remaining leakage low enough is prioritized to the grout take
78
Selection of the priorities and
start criteria for grouting
Priorities Priorities
1) Minimised water leakage 1) Minimised grout take and hole position
2) Grout take and hole position 2) Minimised water leakage
Conclusion Conclusion
Overdone grouting Frugal grouting
Slight indication of grouting need Reliable indication of grouting
and low trigger level need and relatively high trigger
level
Drawback Drawback
Unnecessary holes and amount Possibility of too high water leakages
of grout and need for post-grouting
Figure 5-11 A chart for the priorities conclusions and drawbacks for processing a
grouting start criteria
The following properties of a leaking fracturezone are to be observed
1 The leakage from the probe hole or a grouting hole (by measuring the out flowing
water)
2 The water take in a certain measuring section (by 1- and 2-packer water loss
measurement) and
3 The water flow from even a single fracture or a fracture zone (the Posiva flow log
measuring section alterable) ndash may need a hole with water infilling
The fracture orientation (the dip direction and the dip) cannot be detected with the
characterisation methods available However for the full optimisation it is an important
part With the help of oriented drill core samples the dip directions and the dips are
possible to obtain
The start criterioncriteria should be dependent on the fracture properties that are
available and independent on the fracture properties that cannot be observed
The measurements above may give different picture from the rock By measuring the
out flowing water and by the flow logging the real water inflow and the connections in
a larger scale can be observed but the result still represents only a very local point in a
complicated water channel network Furthermore the flow logging uses very sensible
equipment and problems with that in percussion-drilled holes have been encountered
The water loss measurement gives a better picture of the existing connections in smaller
area but does not necessary tell about a) the properties of single fractures and b) the
larger scale connections ndash or it is difficult to interpret from the results However the
measurement can be carried out systematically
79
With a limited number of probe or grouting holes we get only a coincidental hit on the
fracture network and the apertures of fractures Also the fully optimised grouting
should be dependent on the fracture orientation which cannot be observed ndash in the pilot
holes the orientations can be observed
It is suggested that the need for grouting should be based mainly on the water loss
measurement in the probe holes due to the nature of the measurement The method
tends to overestimate rather than underestimate the need for grouting Normally the
water loss measurement in ONKALO is done as 1-packer method Occasionally
2-packer method (1 m measuring section) is carried out if the water loss in a whole hole
has indicated the existence of the water conductive fractures The latter approach seems
to be practical in future The accuracy of the device should be adjusted to the prevailing
grouting start criteria Also the used overpressures should be revised closer to the
grouting overpressures when operating in deep sound rock The measurement of out
flowing water can serve as a complementary method to evaluate the larger connections
Although the Posiva flow log is quite sensitive method it should be utilised as a
complementary and more detailed means of getting more information of the water
conductive fracturing eg the number of fractures and their proportion of the leakages
More reliable and useful results can be obtained if using systematically unbending rods
in drilling When the information of the pilot holes is available that should be taken an
advantage of as well In core drilled pilot holes the flow logging has been accurate and
that can be used even as a main characterisation method
The trigger levels based on the current local limits for the inflowing water are presented
in Table 5-9 These trigger levels are directly applicable for Posivarsquos flow logging
method The trigger levels for other characterisation methods can be calculated from
this value The trigger levels are determined in the same way nowadays but here
presented also for the deeper sections The value 50 mlmin is transformed into the
Lugeon values for the lengths of 1 m and 20 m at different depths in Figure 5-12 The
Lugeon limit for 20 m refers to the measurement of the whole probe hole and the 1 m
Lugeon limit is given for the measurement with the two-seal packer The Lugeon limit
set for 20 m measuring length should be used in order to decide whether to do the two-
seal packer test or not The results of the two-seal packer test should be used when
deciding the need for grouting and selecting the drilling pattern and the grouting
parameters The measurement itself is simple but the water flow expected is too small
for the measurements accurate and reliable enough The principle of the test seems to be
appropriate and the test should be developed further The trigger level transformed into
a form of hydraulic aperture of a single fracture is presented in Figure 5-12
80
Table 5-9 The trigger levels in use in ONKALO
Area hole Trigger level 1 Trigger level 2 Trigger level 3
Depth level between R19 and R20
Pilot holes
Single leakage
Leakage from the hole
Probe holes
Single leakage
Leakage from the hole
Other holes
Single leakage
Leakage from the hole
-
-
-
50 mlmin
-
50 mll
50 mlmin
5 lmin
50 mlmin
-
-
100 mlmin
150 mlmin-
15 lmin
-
15 lmin
-
15 lmin
Below R20
Pilot holes
Single leakage
Leakage from the hole
Probe holes
Single leakage
Leakage from the hole
Other holes
Single leakage
Leakage from the hole
-
-
-
50 mlmin
-
50 mll
50 mlmin
5 lmin
50 mlmin
-
-
100 mlmin
100 mlmin-
10 lmin
-
10 lmin
-
10 lmin
1) Trigger level for detailed measurements
2) Trigger level for actions to control the leakage eg pre-grouting
3) Trigger level for effective actions to control the leakages
0000
0001
0002
0003
0004
0005
0006
0007
0008
0009
0010
0011
0012
0013
0014
0015
0016
0017
0018
0019
0020
240 260 280 300 320 340 360 380 400 420 440 460 480 500 520
Depth (m)
Lu
ge
on
valu
e (
Lu
g)
Lug-20 m
Lug-1m
0
2
4
6
8
10
12
14
16
18
20
240 260 280 300 320 340 360 380 400 420 440 460 480 500 520
Depth (m)
Hydra
ulic
ap
ert
ure
(micro
m)
The trigger level 50 mlmin transformed into 1 m and 20 m
Lugeon values as a function of the depth
The trigger level 50 mlmin transformed into hydraulic aperture of
one fracture as a function of the depth
Figure 5-12 The trigger level 50 mlmin transformed into 1 m and 20 m Lugeon values and into a hydraulic aperture (one fracture) as a
function of the depth
81
82
55 Stop criteria
Originally based on a few decades work Gustafson amp Stille (2005) have presented that
the time can be used as a stop criterion in grouting This statement is based on the
analytical approach developed by Swedish Chalmers University of Technology and
Royal University of Technology in close cooperation of SKB Here this analytical
approach and the related stop criteria are also called Grouting Time ndashmethod (GT)
Both the experiences from the construction of ONKALO and the grouting field tests
made within the project revealed a challenge with grouting time -method The time as
such is an insufficient factor to guarantee the successful grouting result with all the
targets set for ONKALO because of the ambiguity of the input data (fracture
characteristics and grout properties) and the sensitiveness of the model
Even a relatively small error in eg interpretation of the fracture characteristics or the
mix properties may deteriorate the design and consequently the time cannot be used as
a stop criterion alone The aim at optimising the sealing result and the grout take will
require a way to verify during the grouting that the design will remain valid for the
prevailing fracture conditions
Therefore it is suggested that in addition to the calculation of the ideal design
parameters (the grout mix the grouting pressure and the pumping time) according to the
GT method the grout flow is included in the system The prognosis of grout take can be
easily calculated When this is linked to the time the prognosis of grout flow can be
done Since there is always a potential risk to have an excessive inaccuracy in the source
data (the hydraulic aperture the grout properties etc) the grout flow should be used to
verify that the design andor the assumptions are accurate enough
By linking all the five parameters together and monitoring the flow rate and the grouting
time we can either verify that the assumptions were correct and the design is valid (and
continue grouting as designed) or conclude that the assumptions were not correct and
the design is not valid (and abandon the design and change to another) From now on in
this document this application is called the GTF -method referring to the words
ldquoGrouting Time amp Flowrdquo However the time has to be kept with in the stop criteria
since the flow rate may be under the measuring accuracy of the grouting equipment and
the time is then the only way to control the grouting
Due to the variation in the source data and the fact that the fluctuation of the grouting
pressure is unavoidable and that has a significant effect on the flow rate the tolerances
should be wide enough not to lead to the unworkable situations too easily
Figure 5-12 presents an illustration of a predicted flow rate with the tolerances
according to which the grout flow should take place if assumptions in the design were
accurate enough
83
H=-270-320 b=51hellip100 microm
0
2
4
6
8
10
12
14
16
18
00000 01500 03000 04500 10000 11500 13000 14500 20000
Grouting time
Gro
ut
flo
w (
dm
3m
in)
Figure 5-13 An example of the predicted flow in a fracture of 51 - 100 microm located at
the depth of -270 - -320 m The yield strength of the mix is 14 plusmn4 Pa and the viscosity of
the mix is 14 plusmn6 mPas The grouting pressure is 15 MPa
84
85
6 DISCUSSION AND SYNTHESIS
61 Grouting design
The studies made within the project and the suggestions for the future are strictly based
on the current design requirements and the existing trigger levels for the controlling of
the water inflow Some of them were analysed further in the R20 programme but the
significant changes to the design requirements were no made due to the R20
programme The design requirements which originate from the long term safety of the
repository include demanding targets for the water inflow and eg the amount of the
cement That will impose challenges for the working methods the procedures and the
equipment Some design requirements are contradictory which means that the
optimisations are needed The existing targets require that very small fractures should
be sealed The major water conductive fracture zones in the access tunnel and the shafts
have to be sealed as well The high water pressures will be an additional challenge
The data of the transmissive fractures observed in the deep drill holes was studied in
order to recognize the conditions specific to the Olkiluoto site This data was then
studied with the targets for the water inflow and the grouting set for ONKALO and used
in the study of the grouting design solutions It was observed that the averagely
fractured rock differs significantly from the fractured zones in terms of transmissivity
and fracturing The fractures with the hydraulic aperture of over 50 - 100 microm are very
sparse The fractures with the significant hydraulic importance are predominantly gently
dipping
The literature study to find a suitable way to handle the stop criterion for the grouting
which is a key issue in the optimisation was performed The study revealed an
approach which has been developed in Sweden in the cooperation with SKB CTH and
KTH and that turned out to be better tool for the optimisation than the other
alternatives The theory is presented in the context of the time stop criterion and is here
also called the ldquoGrouting Timerdquo -method (the GT method) The method applied is
analytical and very simple The approach does not conform with the Finnish norms for
the grouting but it is however the only one so far that connects all the design
parameters together (the mix properties the grouting pressure the fracture
characteristics the desired penetration length and the pumping time ndash and in some cases
also the grouting hole density) As a comment on the model is that the link between the
parameters characteristic grouting time and the theoretical maximum penetration length
is not fully clear The experiences of the method are limited but the deviations from the
national norms are quite small the only new source parameter is the viscosity of the
grout and the only new parameters in the grouting design will be the use of the pumping
time (under maximum pressure) It is assumed that the method ndash and the approach to the
grouting presented ndash is in the beginning of its evolution and more developed versions
will be available in the future As an additional comment on the design parameters
practically because we are operating in the very deep and sparsely fractured rock the
grouting hole density cannot be linked to the design parameters as presented by
Gustafson amp Stille (2005) ndash the design of the grouting hole drilling pattern is more a
matter of probabilities This will be discussed more in details later
86
The penetration length of a grout is highly dependable on the hydraulic aperture of
fractures and considerably to the yield strength and the viscosity of the grout as well as
to the grouting overpressure The accurate determination of these parameters is
important and full compliance with the grouting design is essential during the grouting
work The model and some investigation methods take into account only the fractures
and the transmissivitiesapertures that are intersected by a probe or a grouting hole
There surely are additional fractures and connections that are not detected in the holes
Also the pressure fall in the fractures is one uncertainty and poorly understood One
way to take this into account is to use safety factors in the design (for the penetration
length) The safety factor to suite in all the instances cannot be established
The GT method and the Olkiluoto site data were used in the feasibility study of the
design solutions In order to reach the set targets for the grouting it was decided that the
optimal design solution that meets the target shall include the following components
The grouted areas are targeted as currently stated in the design requirements and
other ONKALO specific instructions
The use of the available low pH grouts (cementitious used in this study) and
The grouting holes inside the tunnel profile and the limited grout penetration
length in order to minimise the risks to the disturbances due to the cement
The study was done only for 1-fracture systems since the similar approach is applicable
for multi-fracture systems The 1D and 2D models were used in calculations but the 2D
was used for drawing the conclusions In certain conditions the grout flow can be
3-dimensional as probably happened in the second grouting test The only way to get
enough good picture of the dimension of the grout flow in is to analyse the
dimensionality of the flow observed in the real grouting operations That feedback could
be a basis for optimising the grouting design further
Those calculations resulted in the support of the optimal design solution by the theory
for the fracture apertures of 100 microm in the tunnel in the depth level range -270 - -400 m
Below the depth level of -400 m the fracture limit found in this project was 200 microm
Below those aperture limits the designer could consider the following divert the
grouting holes outside the tunnel profile raise the grouting pressure relatively high
(which may be compensated partially by using longer pumping times) or use even
thinner mix (colloidal silica or cementitious grout) than currently available The last
meets the set targets best The strength development of the thin mixes may be slower as
observed in eg the grouting tests On the other hand even thicker grouts are
recommended in the environment of large fractures and high groundwater pressures
However the fractures with the hydraulic aperture of more than 50 - 100 microm are very
sparse and thus the optimal design solutions can be used seldom
The field tests revealed problems in using only the grouting time as the stop criteria If
there is any uncertainty in the source data or the made assumptions the time is set in
wrong basis and that cannot be observed during the grouting The accuracy of the
available fracture and the mix properties is not enough to use the grouting time solely as
a stop criteria The grout flow should be incorporated to the system and it is
recommended that it is used as a part of the stop criteria The grout flow is simple to
87
predict via the expected grouted volume at the certain moment of time Analytical
expressions presented in the literature are available to make these predictions Because
the system is sensible to the fracture aperture and the rheological properties of the
mixes and the grouting pressure cannot be kept constant all the time the tolerances for
the grout flow should be accepted as well
The current trigger levels for the starting the means a need for the use of colloidal silica
in the deep rock There is no practical experiences to prove that very small fractures can
be sealed with cementitious grouts
Pre-grouting is proposed as a primary measure as done this far Some of the grouting
can be handled with typical designs adjusted to the site-specific conditions and that will
disrupt the tunnel drifting the least That is supposed to apply for the most of the access
tunnel The exceptions in the access tunnel might be a) the situations when a leaking
fracture or a fracture zone is parallel to the tunnel or that intersects the drift in a way
that it will lead to redirect the grout hole pattern to intersect with the fracture(s) or
b) the situation of unexpected condition that has not been prepared beforehand for
In a multi-fracture system the way to optimise the grout take is to have two or more
grouting rounds This well-known technique which is strongly recommended in multi-
fracture systems is also called as split spacing ie the wider fractures are sealed first
with thick grout and new grouting holes are then done to seal the smaller apertures with
thinner mix This is essential to understand in order a) to diminish the grout take and b)
to accelerate the strength development of the grout
The grouting of the hydrogeological structures RH19 and RH20 should be designed
separately ndash when met in the access tunnel andor the shafts since the structures have
structure specific features in the hydrogeological environment in the ONKALO area and
due to their orientation However the design principles presented in this work are more
or less applicable to all the structures with the same kind of characteristics The RH20
structure is gently dipping which will be an extra challenge in the access tunnel
The design principles in the tunnel will not apply for the shafts as such since the
grouting should be done in very long sections ndash nearly 100 m Operating too close to the
shaft cross cuts or the tunnel may impose a need to grout with lower pressures to avoid
undesired by-pass connection into the tunnel or hydraulic jacking
The post-groutings should be designed also individually Its worth to realize that when
operating close to the tunnel walls the water gradient and consequently the grout flow
is strongly towards the tunnel Practically this means that eg the post-grouting holes
shuold be taken relatively far away from the tunnel walls In the case of post-grouting
the wider the leaking fracture is the denser the grouting holes should be and the further
away from the tunnel walls they should be located
88
Briefly the grouting design in the future should include the following parts
1 Design basic data and the calculations
2 Start criteria for grouting expressed in the terms of used characterisation methods
3 Design for the criteria to select suitable drilling patterns among a selection of them
for different purposes and determination of the cases when the typical drawings
cannot be used
4 Design for the criteria to select a grout mix (among many) the criteria to accept the
mix in use and the corresponding stop criteria which includes the grouting pressure
the pumping time the grout take and the predicted grout flow with reasonable
tolerances The grout flow should be used to verify if the design is valid or not
None of the parameters should be used alone
5 Design for the actions if the grout take and the flow during a predetermined
pumping time do not correspond with the predicted ones (considering the
tolerances)
6 Design for controlling the grouting result before the excavation (not applicable for
post-groutings) and the actions if the result is not obtained and
7 Design for the details such as determining a hole totally tight or eg filling of the
grouting holes in the environment of small fractures before the actual pumping
under the high pressure is started or for example the removal time of packers
There are some characterisation methods that can be used to estimate the groutability of
the rock The water loss measurement proved to be unfailing in various conditions and it
can be done systematically The more detailed picture of the rock can be obtained if
using 2-seal packers instead of 1-seal packer system The interpretation of the water loss
measurement results is important in order to understand the nature of the hydrological
environment ndash in certain cases the maximum Lugeon value does not indicate the need
for grouting As a complementary method the Posiva flow log is recommended since it
makes it possible to observe the properties and the number of single fractures The start
criteria for the grouting should take both of these into account and the set criteria for the
different methods should be mathematically in line with each other In order to get a
better picture of the rock to be grouted the pressures used in the water loss
measurement should be raised closer to those applied in the grouting Straight holes free
of the drilling cuttings and other debris are essential to assure high quality flow log data
In principle two basic drilling patterns in the access tunnel should be sufficient one
with the holes outside the tunnel profile and one with the holes inside the tunnel profile
In practice more drilling patterns will be needed since the excavation profile varies and
there are the shafts and other rooms that require special drilling considerations The
optimal grouting hole density cannot be set A suitable density shall be found with
practical iteration Even in the case of an extremely dense drilling pattern there is a good
chance to miss the water channel and not to detect it A denser drilling pattern will be a
remedy to reduce this risk In the second grouting field test it was observed that even 1
m grouting hole density did not give the picture of the rock reliable enough
The location of grouting holes turned out to be more complicated thing than expected If
the intention of turning the grouting holes inside the tunnel profile is to diminish the
grout remaining in the rock after excavation the following things are to be happened in
89
principle we can ldquowasterdquo with the number of holes in order to find the water channels
But at the same time we will need higher grouting overpressures and pumping times to
reach the same penetration length of grout Also if the grouting holes are parallel to
each other certain fracture directions are not hit Besides this room for the grouting
holes in possible next grouting rounds and for blasting holes should be saved This
means that there is a limit for the highest grouting hole density and thus eg two
grouting rounds with the holes inside the tunnel profile should be the maximum If the
grouting holes will be diverted outside the tunnel profile every hole increases
significantly the amount of the grout remaining in rock after excavation ndash especially in
the case of small fractures If the grouting hole density is too high there is a risk that the
grout squeezes out from the next grouting holes This can be a problem if operating
with the leaking hole cannot be started soon ndash the grout starts to set and the grouting
hole could be wasted
A collection of cementitious recipes studied (non-accelerated and accelerated) exists
The pH rate of cementitious grouts is not of importance from the point of view of the
grouting techniques The rheology the penetration ability and the strength development
are the key factors leading to successful grouting Since the penetration length is very
sensible to the rheological properties of the grout the quality control in the work site is
important Besides the penetration ability is a key issue especially in small fractures
and should be controlled carefully before the grouting Also it should be emphasized
that when designing the grouting the observations of the mix properties from the field
conditions should be used instead of those from the laboratory The beaker test did not
work as a method to follow the early age strength development of cementitious grouts
because the conditions prevailing in rock differs significantly from those in a tunnel
The grouting of small fractures differs from the grouting of the larger ones In order to
reach the same penetration length for the grout the grout take is high in large fractures
whereas it is extremely small while grouting very small fractures Only a few litres of
grout will be enough to seal the small fractures Thicker mixes than available for the
moment are recommended for grouting of large fractures eg in the environment of the
hydrogeological structure RH20 The selection of the mixes should be wider The
grouting of very small fractures will probably require more mixes than currently proven
by the tests The field tests were done with the non-accelerated low pH grouts Recently
the also accelerated mixes has been used This does not void the studies presented in
this report ndash the basic concept do not suffer essentially
Many practical hints for operating with colloidal silica were obtained in the pilot field
These apply to eg its sensitivity to impurities in the mixers the accelerator quality and
the dosing the practical range of the operating time the operating time considerations
when designing the grouting and the work phases the storage of the components etc It
was hard to remove all the silica from the grouting holes (in order to fill them with the
cement paste later) Because the content of the accelerator has a great impact to
behaviour of the colloidal silica and the practical operation times the question how to
seal relatively large fractures under high water pressures with this material aroused In
order to get the material to gel fast enough the accelerator content should be relatively
high which means that the practical operation time for the grouter will be very short
The beaker test did not work as a method to follow the early age strength development
90
of colloidal silica because the conditions prevailing in rock differs significantly from
those in a tunnel
It was also observed that the lack of understanding in the meaning of the pumping time
under the maximum design pressure leads to following mistakes the smallest fractures
will not be sealed and some holes that actually intersect water leaking fractures are
wrongly interpreted as tight holes and they remain only partially filled with grout This
kind of misconception has probably been the main reason for the relatively high
proportion of unfilled grouting holes between the tunnel chainages 0 - 1850 The filling
of the grouting hole prior to pressurizing proved to be a useful and practical solution
avoid this misinterpretation The filling save time for the pumping and this is important
to do when the mix properties do not change significantly
The recommendations for grouting pressures vary a lot in the literature Based on the
field tests the recommended grouting pressure is a below the limit for hydraulic
uplifting However this results in relatively high grouting pressures at the great depths
What happens to the grouting pressure in rock and in the boundary of water and grout is
not understood and could not be studied in this project However these are phenomena
which affect the grouting result for sure The rock mechanical effects of the high
grouting pressures are poorly understood area
It is clear that the full solution for the optimised grouting is not done in the office and
with the recommendations given above It is necessary that besides the designer the
grouting crew understand the contents of the design and can ldquoreadrdquo the rock response
obtained during the grouting and react to it if the grouting is not proceeding as planned
due eg the uncertainties related to the bedrock data Even though an important step in
the grouting design can be taken the grouting work itself should involve a semi-
activerdquo design during the work However the rules for this semi-active grouting design
during grouting should be determined beforehand and expressed in the design
The grout flow in the small fractures will be so slow that the current flow meter in
Posivarsquos grouting equipment cannot record it anymore This may result in difficult
situations for the grouting crew because they should verify the grout movement by
making the indirect observations eg from the piston movements The flow meters
should be able to detect flows in the accuracy of 001 lmin if willing to observe the
progress of the grouting of the smallest fractures By the same token it should be
possible to record the high grout flow rates as well
62 Grouting work
The accuracy of the flow meters of the water loss measurement device and the grouting
equipment were insufficient when grouting small fractures as targeted in ONKALO
All possible efforts to improve the accuracies should be made
In order to reach the penetration length of the grout as designed the transmissivities and
hydraulic apertures of the fractures should be able to be determined as accurately as
possible Besides the development of the water loss measurement the use of unbending
rods in drilling should be considered in order to enhance the possibility to get the
91
reliable results The holes will be straighter and thus more investigations (the Posiva
flow log) can be carried out and more detailed source data can be obtained Also the
grouting result will be better because the holes are located as planned
The datasets between reliable flow loggings and corresponding sets of the MWD data
gathered for interpretation with the Rockma software were compared No correlation
was found The algorithms in the Rockma software should be at least calibrated
However it is possible that the MWD data cannot be used in deep and tight conditions
like in ONKALO
In the first grouting test the importance of the excavation damage zone (EDZ) was
experienced in the grouting work The EDZ cannot be avoided and thus it should be
managed The practical solutions for this are eg to inform the grouting designer about
possible deviations from the extent of the EDZ normally experienced (eg due to
reblastings) and selecting the packers long enough for water loss measurements and
grouting That will prevent the EDZ from disturbing the successful grouting
It is good to start the grouting far enough (several metres) from the fracture targeted
since we cannot observe its orientation However no definite basis to specify the
distance was obtained
The following investigations aiming at selecting a suitable design or designing the
grouting should be carried out observing the leaking fractures on the rock surfaces and
measuring the water out flow and the water losses in probe holes or in grouting holes
and to carry out the flow logging if possible In order to avoid unnecessary time losses
on the water loss measurements it is recommended that first the hole is measured in the
full length and if the trigger level is exceeded (indicates the possibility that the local
trigger levels may be exceeded) then to measure the water losses in 1 m sections along
the hole The first measurement could be carried out applying several over pressures to
observe the nature of the hydraulics around and the latter measurement could be done
with a uniform pressure
Based on the design approach presented in the previous Section the progress of the
grouting work should happen by as follows
1 Obtain the characterisation results (the water losses the flow logging the water
outflow) from the probe holes and the fracturing
2 A geologisthydrogeologist to interpret the results (in terms of transmissivities and
hydraulic apertures)
3 Selecting the drilling pattern based on the set criteria ndash if the leaking fracture
intersects the drift then change the orientation of the grouting holes
4 Investigate the grouting holes (the water losses the flow logging the water out
flow)
5 Read the results got from the grouting holes and select the suitable design
according to the largest fracture group that determines the actions in the first
grouting round if several rounds are needed
6 Fill the holes in the ldquotightrdquo rock
92
7 Start the grouting according to the instructions taking into account also the quality
criteria set for grout mixes the grouting of holes should start by filling them
8 Measure the grout take time and flow
9 If grouting progresses as planned (observed by the grout flow and its tolerances)
continue up to the end if not then change to the other typical design having a
different mix and the new design parameters
10 Follow the early age strength development of the grout and release the packers
according to the design
11 When grout is set enough verify the grouting result with the control holes the
acceptance criteria is similar to the starting criteria and
12 If the result is within the acceptance criteria then continue the excavation if not
then the control holes are used as new probe holes and the process goes back to the
step 1 until the target is reached
Both the fracture properties and the mix properties are the input data for the grouting
design In order to reach correct adaptation of the design the mix properties should be
controlled before grouting
Even though the objective in this work was to define reasonable low grouting pressures
the increase of the grouting pressures will probably be needed This should be taken into
account when selecting the packers When grouting small fractures custom made
packers that can be used for the filling of holes first and then continuing the grouting
pumping directly should be taken into use
It would be a benefit if several grouting holes could be grouted at the same time with
no significant pressure differences in nearby grouting holes If considering the
connection of the grouting holes to the same grouting line the pressure increase and the
grout flow should be followed and controlled separately for every hole because the
grout flows to the easiest way (the law of the smallest resistance)
The grouting with accelerated mixes and especially with colloidal silica should be
trained more because there are limitations concerning the time frame the material
properties remain within workable limits
The prevailing circumstances together with the strict requirements lead to the fact that
measuring accuracy of the flow meters (the water loss test and the grout flow) are not
sufficient The flow meters should be able to detect the flows in accuracy of 001 lmin
The automatization of the grouting should be considered since it facilitates the work
As stated earlier even thought carefully designed the grouting work is partly empirical
and requires the design-as-you-go ndashthinking The grouting crew should be competent
enough to understand the content of the design and also to change the design according
to the predetermined guidelines when necessary Thats why the crew should be trained
for all the actions presented above
93
7 CONCLUSIONS AND RECOMMENDATIONS
The water inflow target have been obtained in the first two km of the access tunnel of
ONKALO The grout take in the first km has been relatively high and a significant part
of the grouting holes has been unfilled The rock characterisation for the grouting
purposes has been difficult in deep and tight bedrock and more challenges will be met
when going deeper The traditional water loss measurement appeared to be the most
practical method even though the measurement accuracy should be improved the
overpressures should be revised and interpretation of the results should be trained more
The flow logging and the water loss measurements with 2-seal packer are recommended
to search for single fractureszones The geological mapping of the tunnel drift could be
utilized better in the grouting design
Due to the long term safety reasons the new grouting materials (low pH grouts and
colloidal silica) should be taken into use and further optimisations of the grout take
should be done The norms and standards do not give enough guidelines for the
optimisation and new tools were searched for Fortunately this kind of research and
development has been done and the Swedish Grouting Time -method proved to be the
most developed approach to study the grouting parameters the grout properties the
grouting pressure the penetration length aimed and the pumping time The approach
was further developed and so called Grouting Time amp Flow -method with the inclusion
of the grout flow monitoring to overcome uncertainties in the bedrock data is
recommended for ONKALO The original suggestion ndash to use the time solely as a stop
criterion ndash do take into account the uncertainties and the variations related to the source
fracture data and thus the grout flow is necessary to prove With it we can indirectly
observe if the used assumptions in the design were sufficiently close to the real ones
Hopefully the model will be developed further in the future and the design and the
grouting work could then be iteratively developed as more experiences are gained
The re-evaluation of the current trigger levels for starting the grouting are
recommended since the levels have a remarkable effect on the construction and the
every days practices Pre-grouting is recommended to be the main way to seal the rock
In order to enable fluent and cost efficient tunnel driving the use of typical designs for
the expected rock conditions is recommended The major structures like the RH19 and
the RH20 the shafts the post-groutings the cases where a leaking fracture intersects the
tunnel drift should be designed individually According to the study performed the
fractures down to the hydraulic apertures of 100 - 200 microm can be sealed with the
cementitious low pH grouts and having the grouting holes inside the tunnel profile (to
minimise the grout remaining in rock) However these fractures occur very sparcely in
the ONKALO bedrock and usually the alternative design solutions have to be searched
Those are the use of colloidal silica instead of cementitious grouts the grouting holes
outside the tunnel profile or having high grouting pressures Out of these choices the
use of colloidal silica and the grouting holes outside the tunnel profile are
recommended The development of thicker cementitious grouts for intersection of the
major hydrogeological structures is recommended
94
The implementation of the development work requires the following actions
Design basis investigation and design procedure should be revised
Design contents and form should be revised
Grouting procedure and certain details should be revised
Accuracy of the flow meters is recommended to be improved
Water loss measurement should be developed further
Education for designers and grouters should be organised
Systematic data gathering would enable further development of grouting and
Grouting experiences should be evaluated as an every days part of grouting design
work and the increased know-how should be taken in use fluently
The following details are emphasized in this Chapter and more detailed
recommendations can be found in Chapter 6
The penetration length and penetration ability of the grout is sensible to the
hydraulic aperture of the fractures the rheological properties of the grout and the
grouting overpressure The focus in the rock characterisation the grout quality
control and the execution of the grouting should lay on these factors
The follow of the grout flow is recommended to be the most important part to
verify the applicability of the grouting design
The model to measure the groutings does not take into account the fractures that do
not intersect a probe hole or a investigation hole The water loss measurement
should be developed further and the understanding and the utilization of the results
obtained from the results should be increased
The grouting overpressure prevailing and the fall of the pressure in the rock is
poorly understood The rock mechanical effects caused by the grouting pressure are
not understood enough and should be studied further
In the case of multi-fracture systems the grouting should start by sealing of the
largest fractures with relatively thick mixes As the sealing occurs the grouts
should be thinned in the possible next grouting rounds The expected grout take
varies a lot depending on the rock conditions Very small grout takes do not
indicate grouting in vain
The determination of the location and the density of grouting holes are and will be
empirical and the optimum should be iteratively found until better characterisation
methods will be in place Some holes intersect the fractures and some do not The
unnecessary drillings cannot be avoided fully The use of the grouting holes inside
the tunnel profile appeared to be more complicated that expected Only the most
largest fractures can be grouted with that kind of drilling patterns
It is recommended to extend the current selection of the grout mixes to cover
thinner cementitious mixes and colloidal silica for the smallest fractures and thicker
mixes for the largest fractures The quality control in the field should be organised
to keep the uncertainties related to the mix properties under control
Because very small fractures should be sealed and relatively high grouting
overpressures will be needed the packers should be adjusted to the new suite
The occupational safety should be taken into account (the length of packers the
distance to the fracture to be grouted)
95
The better accuracy of the flow meters is recommended since the requirements
concerning the water inflows are so tight and
In principle the working cycles would be the same when grouting small and large
fractures When grouting small fractures the filling of the grouting holes before the
actual grouting (raising the pressure) should be a common practice This should be
taken into account when selecting the packers
Colloidal silica should be studied and tested more The removal of the silica from
the grouting holes should be developed further
In order to go further in optimising of the grouting the development of the probe
hole characterisation methods and the accuracy of the measurement devices is
recommended The geophysics and geostatistics may give the new possibilities in
addition to the existing ones If the variation of the fracture apertures and the
fracture orientation can be observed some day a new significant step for the more
optimised grouting can be taken
96
97
REFERENCES
Ahokas H Hellauml P Ahokas T Hansen J Koskinen K Lehtinen A Koskinen L
Loumlfman J Meacuteszaacuteros F Partamies S Pitkaumlnen P Sievaumlnen U Marcos N
Snellman M amp Vieno T 2006 Control of Water Inflow and Use of Cement in
ONKALO after Penetration of Fracture Zone R19 Posiva Oy Olkiluoto Finland
Working Report 2006-45
Axelsson M 2006 Strength Criteria on Grouting Agents for Hard Rock - Laboratory
studies performed on gelling liquid and cementitious grout Licentiate Thesis Chalmers
University of technology Goumlteborg Sweden
Bergman S amp Nord G 1982 On adequate tightening of tunnels Swedish Rock
Engineering Research Foundation ndash BeFo Stockholm Sweden (In Swedish)
Brantberger M 2000 Metodik vid foumlrinjektering I uppsprucket haringrt berg Licentiate
Thesis Royal Institute of Technology Stockholm Sweden
Concrete Association of Finland 2006 Grouting of Rock Facilities Helsinki Finland
Working Instruction BY53 (In Finnish)
Fransson Aring 2001 Characterisation of Fractured Rock for Grouting Using
Hydrogeological Methods Chalmers University Of Technology Department of
Geology Goumlteborg Sweden
Fransson Aring amp Gustafson G 2007 Efterinjektering Inlaumlckageprognos och design ndash
foumlrslag till analys Swedish Rock Engineering Research Stockholm Sweden SveBeFo
Rapport 75 (In Swedish)
Funehag J 2007 Grouting of Fractured Rock with Silica Sol Grouting design based on
penetration length Chalmers University of Technology Department of Civil and
Environmental Engineering Goumlteborg Sweden
Gardemeister R Johansson S Korhonen P Patrikainen P Tuisku T amp Vaumlhaumlsarja
P 1976 The application of Finnish engineering geological bedrock classification
Techical Research Centre of Finland Geotechnical laboratory Espoo Finland
Research note 25
Gustafson G 2005 Tn 050928 Rev 051003 Considerations on grouting pressure
(Non-checked reference from Concrete Assosiation of Finland 2006)
Gustafson G amp Claesson J 2004 Steering parameters for rock groutingSubmitted to
the International Journal of Rock Mechanics and Mining Sciences In prep
Gustafson G amp Stille H 1996 Prediction of groutability from grout properties and
hydrogeological data Tunnelling and Underground Space Technology Vol 11 No 3
pp 325-332
98
Gustafson G amp Stille H 2005 Stop Criteria for Cement Grouting Felsbau Zeitschrift
fuumlr Geomechanik und Ingenieurgeologie im Bauwesen und Bergbau Vol 23 No 3 pp
62-68
Hakami E 1995 Aperture Distribution of Rock Fractures Division of Engineering
Geology Department of Civil and Environmental Engineering Royal Institute of
Technology Stockholm Sweden Doctoral Thesis p 22
Hansen J Vuorio M Koskinen K Juhola P Vuorinen U Sievaumlnen U Raivio P
amp Karttunen P 2008 Groundwater Inflow Management in ONKALO ndash The Future
Stategy Posiva Oy Eurajoki Finland Working Report 2008-44 (to be published)
Hellauml P Vaittinen T Saksa P amp Nummela J 2004 Statistical analysis and
modelling of Olkiluoto structures Posiva Oy Olkiluoto Finland Working Report
2004-58
Hellauml P Ahokas H Palmeacuten J amp Tammisto E 2006 Analysis of geohydrological
data for design of KBS-3H repository layout Posiva Oy Olkiluoto Finland Working
Report 2006-16
Hollmeacuten K 2007 R20 programme The development of grouting technique ndash Stop
Criteria and Field Tests Posiva Oy Olkiluoto Finland Working Report 2007-101
Houlsby A 1990 Construction and Design of Cement Grouting John Wiley and Sons
New York The United States of America
Haringkansson U 1993 Rheology of Fresh Cement-Based Grouts Royal Institute of
Technology Stockholm Sweden Doctoral Thesis
Haumlssler L 1991 Grouting of Rock ndash simulation and classification Doctoral Thesis
Royal Institute of Technology Stockholm Sweden
Lehtinen amp Hirvonen 2007 Monitoring Waterleakages and Results of Watersampling
from the Leaking Structures and Fractures after Grouting in ONKALO 2005-2006
Posiva Oy Olkiluoto Finland Working Report 2006-28
Lokkila M 2008 Flow of Bingham and Newtonian fluids in hard rock- application for
ONKALO University of Helsinki Department of Physics Helsinki Finland Masters
thesis
Lombardi G 1997 GIN principle revisited Water Power amp Dam Construction
October 1997 pp 33-36
Lombardi G amp Deere D 1993 Grouting Design and Control Using the GIN principle
Water and Power and Dam Constructions June 1993 pp 15-22
Posiva picture archives httpwwwposivafi
99
Ranta-Korpi R Karttunen P amp Sievaumlnen U 2007 R20 programme Field testing of
grouting materials Posiva Oy Olkiluoto Finland Working Report 2007-102
Reiman M Poumlllaumlnen J amp Vaumlisaumlsvaara J 2006 Flow measurements in ONKALO at
Olkiluoto Probe holes and ONK-KR1 ndash ONK-KR4 ONK-PVA1 and ONK-YPPL18
Posiva Oy Olkiluoto Finland Working Report 2006-65
Riekkola R Sievaumlnen U amp Vieno T 2003 Controlling of Disturbances due to
Groundwater Inflow into ONKALO and the Deep Repository Posiva Oy Olkiluoto
Finland Working Report 2003-46
Sievaumlnen U 2002 Groundwater inflow and grouting conditions at the Olkiluoto site
Eurajoki western Finland Licenciate Thesis University of Helsinki Helsinki Finland
Sievaumlnen U amp Riekkola R 2003 Controlling of Groundwater Inflow into ONKALO
and the Deep Repository at Olkiluoto Summary Report Posiva Oy Olkiluoto Finland
Working Report 2003-51
Vaittinen T Ahokas H Heikkinen E Hellauml P Nummela J Saksa P Tammisto
E Paulamaumlki S Paananen M Front K amp Kaumlrki A 2003 Bedrock model of the
Olkiluoto site version 20031 Posiva Oy Olkiluoto Finland Working Report 2003-43
Vaittinen T Nummela J amp Tammisto E 2007 Expected occurence of the
transmissive fractures at the repository level for grouting design purposes Posiva Oy
Olkiluoto Finland Working Report 2007-87
Vieno T Lehikoinen J Loumlfman J Nordman H Meacuteszaacuteros F 2003 Assessment of
Disturbances Caused by Construction and Operation of ONKALO Posiva Oy
Olkiluoto Finland Posiva Report 2003-06 ISBN 951-652-120-7
Oumlhberg A Rouhiainen P 2000 Posiva groundwater flow measuring techniques
Posiva Oy Olkiluoto Finland Working Report 2000-12
100
101
APPENDIX 1
102
103
104
105
106
107
APPENDIX 2
108

3
LIST OF ABBREVIATIONS
b = hydraulic aperture (m)
EBS = Engineering Barrier System
EDZ = Excavation Damaged Zone
FT = field test
GTF method = ldquoGrouting Time amp Flowrdquo -method
g = gravitational acceleration (ms2)
GIN method = Grouting Intensity Number -method
GT method = ldquoGrouting Timerdquo ndashmethod also so called time stop grouting
H = depth below ground surface or groundwater table (m)
I = penetration (m)
ID = relative penetration
Imax = maximum penetration (m)
IMA = project concerning the development of low pH cementitious
grouting materials
INKE = project concerning the development of grouting technology
IPA = project concerning the long term safety of grouting
K = hydraulic conductivity (ms)
L = length measuring length (m)
Lug = Lugeon value (dm3(MPa min m))
MWD = Measure While Drilling
OFW = outflow of water (method)
OL-KR = deep drill hole
PFL = Posiva flow log (method)
PH = pilot hole
pg = grouting pressure (Pa)
PL = chainage (m)
PR = bore hole
pw = groundwater pressure (Pa)
∆p = overpressure (Pa)
Q = flow rate (m3s)
R0 = radius of groundwater flow (m)
R = radius of a hole or a tunnel (m)
RampD = research and development
RH = hydrogeological structure such as RH19 or RH20 The names vary
in different hydrological or geological models (Eg R19 HZ19)
made for different purposes
S = spacing (m)
SKB = Svensk Kaumlrnbraumlnslehantering AB
SP = subproject
SPL = superplasticizer
t = time (s)
tD = relative grouting time (dimensioless)
tg = gel induction time (s)
tmax = maximum characteristic grouting time (s)
T = transmissivity (m2s)
4
UF = Ultrafin 16 cement
V(1D) = grout intake in 1D system (channel)
V(2D) = grout intake in 2D system (planar fracture)
w = width (of the channel) (m)
WDM = water to dry material ratio
WLMint = interpreted water loss (Lug)
WLMmax = maximum water loss (Lug)
ρ = density (kgm3)
ρb = density of rock (kgm3)
μ = viscosity of water (Pas)
μg = plastic viscosity of a grout (Pas)
τ0 = yield strength of a grout (Pa)
1D = 1-dimensional
2D = 2-dimensional
3D = 3-dimensional
5
NAMES AND COMPOSITIONS OF GROUTS
Following nomenclature has been applied to the injection grouts The mix name
consists of four parts XX-YY-ZZ-QQ in which the first part XX refers to the cement
(UF = Ultrafin 16) The second part YY refers to the dry silica to the total dry material
weight ratio The third part ZZ is the water to dry material ratio (WDM) multiplied by
10 and the fourth part QQ is the superplasticizer (SPL) content expressed as weight
out of the total dry material The accelerator if used is given as weight out of the
total dry material in bracklets Other mix compositions are named likewise Cement
UF16 GroutAid silica slurry SPL Mighty150 and accelerator Nedmaq has been used as
the materials
Name of the grout Old names
of the grouts
WDM SPL
SilCem Accelerator
UF-41-14-3 P308 14 3 069 0
UF-41-14-3 (5 ) 14 3 069 5
UF-41-14-4 P308B 14 4 069 0
UF-41-14-4 (2 ) 14 4 069 2
UF-41-14-4 (5 ) 14 4 069 5
UF-41-14-48 14 48 069 0
UF-41-14-51 14 51 068 0
UF-41-12-3 P307 12 3 069 0
UF-41-12-3 (2 ) 12 3 069 2
UF-41-12-3 (5 ) 12 3 069 5
UF-41-12-36 12 36 069 0
UF-41-12-37 12 37 069 0
UF-41-12-4 P307B 12 4 069 0
UF-41-12-4 (5 ) 12 4 069 5
UF-41-12-48 12 48 069 0
UF-41-12-51 12 51 069 0
UF-41-10-3 10 3 069 0
UF-41-10-3 (2 ) 10 3 069 2
UF-41-10-3 (5 ) 10 3 069 5
UF-41-10-4 10 4 068 0
UF-41-10-4 (2 ) 10 4 068 2
UF-41-10-4 (5 ) 10 4 068 5
UF-41-10-48 10 48 069 0
UF-15-10-28 5_5 10 28 018 0
UF-15-10-28 (2 ) 10 28 018 2
UF-15-10-28 (5 ) 10 28 018 5
UF-41-08-47 08 47 069 0
6
7
1 INTRODUCTION
The Finnish nuclear waste management company Posiva Oy owned by Teollisuuden
Voima Oy and Fortum Power and Heat Oy constructs an underground rock
characterisation facility called ONKALO (Figure 1-1) in Olkiluoto Eurajoki Finland
The construction commenced in 2004 and is to be completed by the end of the year
2010 In future ONKALO is supposed to be a part of the nuclear waste facility the
repository for spent nuclear fuel By the end of the year 2007 about 2500 m of the
ONKALO access tunnel has been excavated and the ventilation (intake and exhaust)
and the personnel shafts about 180 m each have been raise bored
The investigations and the hydrogeological models made from the bedrock around
ONKALO demonstrate that essential water bearing structures need to be sealed
Otherwise excessive leakages into the tunnel can be expected (Riekkola et al 2003
Sievaumlnen amp Riekkola 2003) and too many disturbances will be foreseen in the
hydrogeological and geochemical environment (Vieno et al 2003) It was decided
before the construction that grouting will be the primary measure to control the
groundwater inflow into the tunnels The achievements and the strategy of grouting was
evaluated earlier when the major water bearing structures called RH19 at the depth
level of about -100 m were intersected (Ahokas et al 2006) The suggestion was made
to develop grouting further for better control of water ingresses
Those recommendations resulted in Posiva Oys decision to set up the R20 programme
for the years 2006 - 2008 The programme is a RampD scheme with an objective to
enhance the control of water inflow by grouting The programme shall come up with a
feasible grouting methodology which can be applied after intersecting the group of
water bearing RH20 structures at the approximate depth of -70 m
Figure 1-1 Schematic picture of ONKALO (yellow) and the deep repository
(httpwwwposivafi)
8
The R20 programme (Hansen et al 2008) consisted of three projects covering the
following areas (the project abbreviation in brackets)
1 Long term safety issues related to the controlling of water inflow (IPA)
2 Technical properties of grouting materials (IMA) and
3 Development of grouting design techniques and procedures (INKE)
This report describes the outcome of the INKE project and presents the outcome of
various subtasks as well as puts forward a suggestion for a grouting method for future
The project had an overall objective to establish a feasible and well-founded grouting
method for the construction of ONKALO The project mainly enhanced the utilization
of existing technology The requirements imposed by the long term safety should be
met without compromising ONKALOrsquos construction schedule The work aims at giving
guidelines for grouting design and work as well as for related investigations deeper in
the bedrock and the shafts to be excavated Furthermore it aims at finding out reliable
characterisation methods which can be applied in probe holes (percussion drilled holes)
for grouting purposes and recognizing the most significant factors the grouting results
may be governed by and establishing procedures functioning well between
investigations and design
The project was divided into seven subprojectssubtasks (SP) as follows
SP 1 Analysis of the grouting activities and investigations performed in ONKALO
and related to grouting
SP 2 Literature study on recent RampD in grouting focusing on the stop criteria and
experiences in demanding tunnelling conditions under high groundwater
pressures and requirements of high degree of tightness
SP 3 Preliminary study on colloidal silica including a pilot grouting test
SP 4 Study and classification of hydrogeological conditions at Olkiluoto site from the
grouting point of view
SP 5 Grouting field tests (optimised grouting)
SP 6 Small software study for grouting design or investigations related to grouting
and
SP 7 Feasibility study on grouting design solutions and a suggestion for the
application in ONKALO
The strategy how to achieve the aimed site specific high quality grouting methodology
is presented in Figure 1-2 The grouting methodology shall be based on the
requirements and the targets set on the experiences obtained from grouting works
performed in ONKALO and on the field tests performed as well as on the experiences
from the reference sites (high water pressure andor requirements for tightness against
water inflows) The rock conditions expected in the deep rock shall be taken into
account as well The optimal and practical solution fit for each rock condition
recognized will be found when grouting approach and suitable methodology is selected
information about competent materials is incorporated and the feasibility of design
solutions is judged
9
The sealing of the deep repository was excluded from the scope of the R20 programme
and the projects The IPA project together with the current design requirements
constituted the frames for grouting (total and local water inflow the volume and the
type of grout(s)) The IMA project had the task to assess the behaviour of grouting
materials and to develop several grout recipes for different circumstances and the
project was carried out in close interaction with the INKE project None of the activities
of the INKE project were governed by engineering design or by construction
procedures However all the field tests had to be performed in compliance with the
requirements in terms of quality safety and security valid for the ONKALO project
Underground facility that meets
the set targets in an optimal
high quality way
Verification of the grouting result
and development of the grouting
Execution of grouting design and
grouting work
Developed working methods Suggestion concerning the
equipment and quality control grouting in future
Feasibility of optimal design
solutions
Tools for optimising the grouting The methodology for Knowledge about grouting
grouting materials
Experiences from ONKALO and Requirements and targets set Expected rock conditions in
the reference sites for water inflow and grouting deep rock
due to the long term safety
Figure 1-2 The project strategy for the development of grouting practices The bronze
boxes are the outcomes of INKE project the light yellow are the outcomes from IPA
and IMA projects The rose boxes consist of the future outcomes
10
11
2 CONTROL OF WATER INGRESS IN ONKALO IN REGARDS OF MULTI BARRIER CONCEPT IN THE REPOSITORY
According to Riekkola et al (2003) the water inflow into underground facilities and the
subsequent water discharge may cause the detrimental flow of groundwater in the
surrounding rock mixing of different types of water and the drawdown of groundwater
table The water inflow into the excavations may cause migration of superficial waters
into the bedrock Changes in groundwater chemistry will have an impact on the
suitability of grouting materials and vice versa the grouting materials can cause
chemical disturbances in the surrounding groundwater After the closure of the deep
repository the most significant impacts are related to the inflows into the deep parts of
the underground facilities (salinity changes) the interactions between different
materials and to the decay of the buffering capacity of fracture fillings and rock in the
vicinity of disposal tunnels The upconing of saline waters from greater depths can also
be related to the drawdown of the groundwater table Rock engineering and construction
including the installation of systems will meet difficulties if big volumes of inflows
will occur The water inflow can make the installation of buffer and backfilling works
difficult
Figure 2-1 Disturbances foreseen due to groundwater inflow into ONKALO and the
deep repository and due to the use of cementitious materials (Riekkola et al 2003)
12
13
3 EXPERIENCES FROM ONKALO AND THE REFERENCE SITES
31 Rock characterisation for grouting design
About 25 of the access tunnel length is investigated with pilot holes (core drilled
holes) (Figure 3-1) Four probe holes (percussion drilled holes) are drilled
systematically about every 20 m as the tunnelling proceeds The pilot holes are typically
100 - 200 m long core drilled holes and the hole specific characterization reports are
produced in all details The characterization data is used to give a preliminary picture
eg of the need for grouting The final decision of the grouting need is done based on
information gathered from the probe holes In a few cases the design has been changed
due to the observations made in the probe holes
The characterisation methods in the probe holes
Water loss measurement (Lugeon test)
Posiva flow log and
Measurement of water out flow
The methods in the pilot holes
The water loss measurement (Lugeon test)
Posiva flow log and measurement of water out flow
Core sample loggings and
Different geophysical methods
The first stage of geological rock mass mapping can serve grouting designs interest as
well (location and orientation of leaking fractures) Eg when the hydrogeological
structure RH19 was intersected the drilling fans were designed according to the
fracturing
Lokkila (2008) has gathered information about the methods The Lugeon test is done by
sealing of the opening to a drilling hole with a packer and pumping water under a
constant pressure for a predetermined time and then measuring the volume pumped The
sequence length of the hole tested can vary In ONKALO mostly the whole length of
the probe holes has been tested and occasionally a split to shorter sections has been
done Applying altering pressures (raising and descending) the hydraulic circumstances
in the surroundings of the hole can be evaluated (Houlsby 1990)
The Posiva flow log device (Figure 3-2) has instrumentation for measuring both
difference and transverse flows (Oumlhberg amp Rouhiainen 2000 Lokkila 2008) In
difference flow measurement the differences of flow rates ie flows into or out from an
investigation hole are measured For the difference flow measurement there are two
optional modes available normal and detailed flow logging With the normal mode
hydraulic conductivities and hydraulic heads of the tested section are obtained The
detailed flow logging mode enables a rapid way to locate the leaky fractures or zones
The transverse flow equipment is used for in-situ measurements of flow rate and its
direction across a test section
14
The flow log measurements (Reiman et al 2006) were started (at chainages 15 - 372 m)
with an automatic logging device applying 10 m section length and 01 m point
interval A manual device with a single rubber disc was used at chainages 442 - 540 m
Another rubber disc was added in the manual device configuration and the measured
section length and the point interval were typically 125 m after the chainage 540
The measurement of out flowing water is also carried out when possible Measure
While Drilling (MWD) data has been tried to utilize also for grouting purposes The
software that interprets the drilling response is Rockma GMP-2 A pressure build up
(Eriksson amp Stille 2005) test has not been in use A simple borehole TV was tried to use
in very beginning of the tunnel with no success
Figure 3-1 Pilot holes OL-PH1 ONK-PH2 - ONK-PH7 between the chainages
0 - 2000
Principle of difference flow method Principle of transverse flow measurement
Figure 3-2 The principle of the Posiva flow log (Oumlhberg amp Rouhiainen 2000)
15
32 Experiences of the rock characterisation for grouting purposes
The data available for the analysis of grouting experiences was obtained from
Pilot holes OL-PH1 ONK-PH2 - 4
Probe hole data between tunnel chainages 0 - 1850 and
Grouting data between tunnel chainages 0 - 1850
Only one part of the personnel shaft was grouted and raise bored at the time the analysis
were made and thus the experiences obtained from the shafts were excluded from the
analysis
Observations on hydraulic properties in the probe holes (chainages 0 - 1505) are
presented in Figures 3-3 3-4 3-5 and 3-6 Hydraulic conductivities are based on water
outflow from the probe holes (Figure 3-3) maximum measured water losses (Figure 3-
4) interpreted water losses (Figure 3-5) and flow loggings (Figure 3-6) It can be seen
that as the excavation has advanced deeper the hydraulic conductivities determined in
the probe holes have significantly decreased ie the occurrences of the transmissive
fractures have diminished and the transmissivities of water conductive fractures have
decreased
The measurements of outflows and water losses have covered one probe hole at time
Recently occasionally the water loss is also measured with 2-packer device with 1 m
measuring section if the water loss in a probe hole has exceeded a predetermined limit
The flow log measurement can be used to distinct hydraulic fractures along a probe
hole The flow logging method was shifted from the automatic to the manual
measurement at the chainage 372 At the same point the trigger value of the outflow for
starting the measurement was changed from 30 mlmin to 500 mlmin in the holes that
are inclined upwards However that did not cause changes to probe hole measurements
since they are inside the tunnel profile and thus typically inclined downwards The holes
with the outflow less than the trigger level were considered dry for the flow logging
purposes (Reiman et al 2006)
About 13 of the probe holes have been flow logged The testing was abandoned in the
rest of the holes due to various technical difficulties andor due to dry holes The
diameter of most of the probe holes was 56 mm and the holes were typically more
bended than those of 64 mm In principle the water loss measurement can be carried out
in any probe hole However the measuring accuracy of the flow meters of water loss
measurement device tend not to meet the requirements for the start criteria of grouting
in ONKALO and the smallest transmissive fractures are difficult or impossible to
detect with the current devices
Comparisons of the results gathered with different hydraulic characterisation tools (the
data from chainages 0 - 1505) showed quite good correlations between the maximum
water loss in any probe hole of a fan (WLMmax) and the interpreted water loss (WLMint)
(correlation coefficient r = 088 or 072) and poor to moderate correlation with the flow
log (r = 043 and 028 correspondingly) The out flowing water measured at different
times correlated very variably with other observations The result obtained in the
16
correlation analysis was largely based on a very limited number of variables and was
considered somewhat unreliable The skin effect was not taken into account However
it may be one reason for differences between the different characterization tools
Hydraulic properties seem to have been slightly different in the probe holes in
comparison with the pilot holes The hydraulic conductivity measured is typically
smaller in the probe holes than in the pilot holes Possible explanations to this
phenomenon are that grouting seals fractures ahead of the excavation along gently
dipping fractures and that causes changes in groundwater flow paths and that blast
shocks may have altered the rock mechanical properties of the bedrock resulting in
decreases of hydraulic apertures of fractures
Figure 3-3 Hydraulic conductivity values (ms) measured by groundwater outflow
(OFW) in the probe holes at the chainages 0 - 1505
17
Hydraulic conductivity mslt 1E-101E-10 ndash 1E-91E-9 ndash 1E-81E-8 ndash 1E-7gt 1E-7not measured
Hydraulic conductivity mslt 1E-101E-10 ndash 1E-91E-9 ndash 1E-81E-8 ndash 1E-7gt 1E-7not measured
Hydraulic conductivity mslt 1E-101E-10 ndash 1E-91E-9 ndash 1E-81E-8 ndash 1E-7gt 1E-7not measured
Hydraulic conductivity mslt 1E-101E-10 ndash 1E-91E-9 ndash 1E-81E-8 ndash 1E-7gt 1E-7not measured
Hydraulic conductivity mslt 1E-101E-10 ndash 1E-91E-9 ndash 1E-81E-8 ndash 1E-7gt 1E-7not measured
Hydraulic conductivity mslt 1E-101E-10 ndash 1E-91E-9 ndash 1E-81E-8 ndash 1E-7gt 1E-7not measured
Figure 3-4 Hydraulic conductivity values (ms) measured by the water loss
measurement the maximum values (WLMmax) in the probe holes at the chainages
0 - 1505
Figure 3-5 Hydraulic conductivity values (ms) measured by the water loss
measurement the interpreted values (WLMint) In the probe holes at the chainages
0 - 1505
18
Hydraulic conductivity mslt 1E-101E-10 ndash 1E-91E-9 ndash 1E-81E-8 ndash 1E-7gt 1E-7not measured
Hydraulic conductivity mslt 1E-101E-10 ndash 1E-91E-9 ndash 1E-81E-8 ndash 1E-7gt 1E-7not measured
Hydraulic conductivity mslt 1E-101E-10 ndash 1E-91E-9 ndash 1E-81E-8 ndash 1E-7gt 1E-7not measured
Figure 3-6 Hydraulic conductivity values (ms) measured with the Posiva flow log
(PFL) in the probe holes at the chainages 0 - 1505
The visible leakages have been mapped four times per year (Figure 3-7) The measuring
weirs have been put in place for measuring the total inflow rate (Hansen et al 2008
Lehtinen amp Hirvonen 2007) The results have varied as the construction has proceeded
but recently a stabilising trend has been seen High occasional peaks have been caused
eg by open leaky grouting holes Major drips are concentrated at the locations of rock
bolts At the chainage 208 the average inflow has been 30 lmin at the chainage 580
106 lmin at the chainage 1255 184 lmin and at the pump station at the chainage 2285
~ 176 lmin The measured leakages have been smaller than expected However as
predicted before the construction started the inflow has significantly decreased below
the depth level -100 m (Riekkola et al 2003)
19
Figure 3-7 The water leakages mapped in the access tunnel between the chainages 0 -
1630
20
33 Experiences of groutings
The decision of grouting has been based on the amount of out flowing water the water
loss measurement and the leakage from single fractures (determined by flow log)
About 70 of the first 1000 m of the access tunnel has been grouted After intersecting
the hydrogeological structures RH19A and B the need for grouting has diminished
significantly Between the tunnel chainages 1000 - 2000 about 25 of the tunnel length
has been grouted The pre-grouting areas and the grout intakes per a hole-m and per a
fan are visualised in Figures 3-8 and 3-9
Grouting holes have been drilled outside the tunnel profile with the exception of the
shafts and one test grouting at the chainage 1880 Various drill patterns have been
applied (Table 3-1) The length of the grouting holes has been from 22 to 26 m A dense
(34 holesfan) pattern was used in the beginning The number of grouting holes was
however soon reduced first to 27 and then to 22 That turned out to be adequate to
achieve the sealing result as planned Special drilling patterns were used through the
hydrogeological structure RH19A (Ahokas et al 2006) between the chainages 916 and
980 to achieve the results wanted (Figure 3-10) The drilling pattern was changed back
to 34 holes after the chainage 1400 in order to enhance the probability to intersect water
conductive channels with grouting holes Post-grouting has been done in very few
places in order to rectify defects in pre-grouting Post-groutings have been designed on
a case by case basis
Grout mixes are based on sulphate resistant micro cement Ultrafin 16 (by Cementa AB)
except in the hydrogeological structure RH19A where also coarser Portland cement
(SR-cement by Finnsementti Oy) was used for better sealing effect Micro silica slurry
(GroutAid by Elkem) and mainly naphthalene sulphonated super plasticizer have been
used as admixtures Water to dry material ratio (in weight) has varied between 10 ndash 13
for early mixes and the ratio was reduced to 05 in the case of high grout intake Silica
to cement ratio has varied between 000 and 018 The content of superplasticizer has
typically varied between 1 and 2 in the weight of dry materials mainly depending on
the type of admixture The low pH grouts have been used in grouting tests with water
to dry material ratio 12 - 14 silica to cement ratio 069 and superplasticizer content of
4 in the weight of dry materials The total grout intake in the first 1000 m of the
access tunnel was ~ 422 m3 and between the tunnel chainages 1000 - 2000 m ~ 35 m
3
see Figure 3-11 All in all grout intake has not been very high and as the rock got less
fractured at the chainage about 550 m the grout intake and the need for grouting
diminished remarkably
The stop criteria used in grouting has been conventional Grout was pumped into the
bedrock as long as the stopping pressure was reached and the pressure was held for
5 min If the termination pressure was not reached and the grout intake had exceeded
the given limit the thicker grout mix was prepared by lowering water content in the
mix The grouting pressure during the first 2000 m has varied between 2 and 9 MPa
with a tendency to increase as the tunnel advanced deeper The grout intake limit for the
thinnest grout mix has typically been 30 lm of a grouting hole The grout intake limit
for the next thicker grout mix was 20 lm and for the last grout mix 20 lm In the
hydrogeological structures RH19A and B the grout intake was also limited Alternative
stop criteria have been studied and used in grouting tests
21
Grout take lmlt 0
0 - 55 - 10
10 - 2020 - 3030 - 4040 - 50
gt 50
Grout take lmlt 0
0 - 55 - 10
10 - 2020 - 3030 - 4040 - 50
gt 50
Grout take lmlt 0
0 - 55 - 10
10 - 2020 - 3030 - 4040 - 50
gt 50
Grout take lmlt 0
0 - 55 - 10
10 - 2020 - 3030 - 4040 - 50
gt 50
Grout take lmlt 0
0 - 55 - 10
10 - 2020 - 3030 - 4040 - 50
gt 50
Grout take lmlt 0
0 - 55 - 10
10 - 2020 - 3030 - 4040 - 50
gt 50
Figure 3-8 Grout intake lm per a grouting hole at the chainages 0 - 1525
Figure 3-9 Average grout intake lgrouting hole-m per a grouting fan at the chainages
0 - 1525
22
Table 3-1 Drilling patterns (for the usual tunnel profile) for the chainages 0 - 2000 in
the ONKALO access tunnel
Chainage Distance between holes (m) No of grouting holes fan
0 - 100 15 34
100 - 155 20 27
155 - 916 25 22
916 - 980 Customized drill patterns
980 - 1405 25 22
1405 - 1880 15 34
1880 15 17
1900 - 2000 15 34 Distance measured between the endpoints of the holes
Grouting holes inside the tunnel profile a grouting experiment
The leakage water inflow and the leakage mapping were the control measures of the
grouting results Occasionally the grouting result were controlled with control holes
which are drilled after grouting In the beginning the control holes were drilled
systematically but they were given up at the chainage ~ 120 m Currently they are
drilled eg for the shafts or grouting experiments
Grouting experiences have been analysed visually and by correlations The first 1000 m
of the access tunnel has been studied in detail A supplementary study in order to verify
the results and study the weird observations in more details covered also the data at the
chainages 1000 - 1850
The assessments of the first 1000 m of the access tunnel showed that the remained water
leakage after grouting is not as much correlated to geological features as to singular
fractures and rock bolts The major leaks seem to match fairly well with fan beginnings
and ends The bolts that extend beyond the grout curtain probably cause the leaks
Minor leaks remaining indicated also that leakages were distributed quite evenly along
the first 1000 m although geological and hydrological circumstances have varied a lot
This indicates that the remaining leakages are due to the used grouting material
(cement-based grouts) and technique (stop criterion) The sealing efficiency determined
by using control holes (thus calculated only for a few fans) was typically good out of
12 areas 9 showed a sealing efficiency of over 99 Only one place gave a poor result
with a sealing efficiency of 60 The sealing efficiency is the initial transmissivity
(probe hole result) minus the end transmissivity (from control holes) divided with the
initial transmissivity and it is usually given in percentage The sealing efficiency is not
used as an acceptance criterion in ONKALO
23
Grouting fans 960 ndash 956 ndash 940 ndash 935 ndash 921 ndash 916 - 905
935
916
905
921
940
956
960
Grouting fans 960 ndash 956 ndash 940 ndash 935 ndash 921 ndash 916 - 905
935
916
905
921
940
956
960
Grout take lmlt 0
0 - 55 - 10
10 - 2020 - 3030 - 4040 - 50
gt 50
Grout take lmlt 0
0 - 55 - 10
10 - 2020 - 3030 - 4040 - 50
gt 50
Figure 3-10 The grouting of the hydrogeological structure RH19A (the geometry of the
RH19A Ahokas et al 2006) The structure was grouted with coarse cement based
grout in the chainages 916 935 and 956 After the grouting of the structure the smaller
fractures were grouted with microcement at the chainages 905 921 940 and 960
24
Grout take (dm3) in ONKALO access tunnel 0-2000 m
0
5000
10000
15000
20000
25000
0 71 145
253
342
446
540
580
644
730
855
915
956
1025
1076
1162
1232
1340
1466
1586
1701
1815
1920
Tunnel chainage (m)
Gro
ut
take (
dm
3)
Pre-grouting
Post-grouting
Figure 3-11 Grout intake per a fan (dm3) both pre- and post-grouting for the first
2000 m of the ONKALO access tunnel
In the first 1000 m three areas of the largest grout intake coincide with the brittle fault
intersections around the chainages 330 and 500 (450 l penetrated into a drill hole) and
with a ductile shear intersection approximately at the chainage 450 There seemed to
have been a poor correlation between the grout intake and rock mass quality The three
areas with a poor or a very poor Q index showed moderate grout intake and the areas
with high grout intake were situated in good quality rock The number of fractures
seemed not to be connected to the grout intake One possible explanation to this is that
grouting seals fractures ahead of the excavation along gently dipping fractures another
reason for these may have been that in densely fractured rock the fractures were more
likely clogged by joint fillings and thus hinder grout penetration The third possible
explanation is that in densely fractured rock the fractures are shorter and narrower than
in sparsely fractured rock Based on the ONKALO fracture mapping data the
orientation of visible fractures with grout mass infilling was compared with all fracture
observations There is clear difference in the dip values between the fracture groups
The fractures with grouting mass infilling are more often gently dipping whereas all the
fractures are more often steeply dipping
Within the first 1000 m of the tunnel it was observed that in 13 of the grouting holes
the grout intake was high and in 43 of the holes the grout intake was less or as much
as the hole volume (Figure 3-12) As the tunnel has gone deeper less and less of
groutable holes have been encountered That indicates either invalid stop criteria that
ignored the existence of tight holes andor the water conducting channels are far apart
and therefore difficult to hit
25
43
68 73
77 81
85 90
99 100
0
100
200
300
400
500
600
0 5 10 20 30 40 50 100 More
Grout take (dm3m)
Nr
of observ
atio
ns
0
20
40
60
80
100
120
Figure 3-12 The distribution of the grout intake in the grouting holes (ch 0 - 1000)
The results obtained from rock characterisation are the basis for deciding grouting need
and design For this purposes the data at chainage 0 - 1850 was analysed Based on the
correlation coefficients obtained the determination of the maximum water loss value
was selected as the investigation method that is most capable to predict the grout intake
The correlation between the WLMmax values and the grout intake is 055 or 065
depending on whether the sum of the values from the four probe holes or the maximum
value in any probe hole will be taken into account This correlation is not considered
very high and the other investigation methods seemed to be even less correlated with
the grout intake However the data from eg flow loggings was very limited to draw
valid conclusions about the method and the measuring accuracy in water loss
measurement is relatively high compared to the start criteria of grouting Also the
correlation analysis was considered not to be useful enough as a tool for the assessment
of this type of data From the same data the predictive capacity of the different
investigation methods was briefly studied by examining zero and non-zero values in the
data set taking also into account the post-groutings and remaining water leakages The
water loss measurements predicted the need for grouting very well and the flow logging
related measurements also quite well However it has to be remembered that the
measuring limit of the flow log is very close to the start criteria for grouting ie this
conclusion is more or less trivial One thing that makes a difference between the flow
log method and the water loss method is that no overpressure is used in the first
mentioned
In general the Lugeon test related measurements appeared to produce more useful
results than the flow logging related measurements which showed only a poor
correlation with the grout intake although they were almost as good as the Lugeon
measurements in predicting the tunnel sections where grouting would have been
needed The determination of the maximum water loss value was the most useful
method both in terms of correlation with the grout intake and in predicting the tunnel
sections where grouting would not have been needed The water loss tests would
26
become more useful if a higher pressure was applied The pressure should be in the
same order of magnitude with the grouting pressure used in pre-grouting and the test
device should measure very small water flows
The comparisons were run between reliable flow logging data sets and corresponding
MWD (measure while drilling) data sets gathered No correlation was found The
algorithms in Rockma software should have been at least calibrated However it is still
uncertain whether the MWD data can be used for purposes of grouting design and
planning in ONKALO where high hydraulic head and tight fractures prevail
34 Reference sites
The experiences from reference sites were gathered by Hollmeacuten (2007) and the key
information has been compiled in the Tables 3-2 and 3-3 below More detailed
information can be found in Hollmeacuten (2007) The reference sites were selected to
represent either deep rock conditions or strict requirements for water inflows The
grouting experiences under high groundwater pressure exist but the problem was a poor
reporting of the experiences gained
In an addition to the reference sites presented in Tables 3-2 and 3-3 Hollmeacuten (2007)
found brief information form three other Norwegian tunnels including the Aringkrafjord
tunnel with the overburden of 600 m At a time of the commencement of systematic
post-grouting was started the water pressure was about 46 MPa and total amount of the
ingress was in a range of 3 - 5 m3min per a geological zone In that tunnel the final
leakage was 10 dm3min100 m which was regarded satisfactory The Eiksund traffic
tunnel is the worldrsquos deepest sub sea tunnel (the completion due in February 2008) The
tunnel is nearly 8 km long and dives to almost 300 m beneath the fjord surface The
acceptable water inflow into the tunnel was set less than 30 dm3min100 m The
decision of grouting is based on systematically drilled probe holes Grouting pressures
up to 10 MPa are used In the shallow located Bekkestua tunnel the limit of water
ingress into the tunnel was set as a maximum 2 dm3min100 m of tunnel The used
cement (Portland cement or micro grained Portland cement) was selected according to
the observed leakage from holes Large volumes of grout were used The leakage was
reduced to about 07 dm3min100 m of tunnel Portland cement based grout was used
only within the most leaking areas where the rates got up to 17 dm3min100 m of
tunnel
Essential new hints or ideas that could be used in ONKALO were not found in this
literatury study However the study confirmed that water leakages can be handled The
challenge in the case of ONKALO is the design requirements which are somewhat
contradictory
27
Table 3-2 The grouting summary in some tunnel projects (Hollmeacuten 2007)
Tunnel project Bragernes Norway Lunner (oslashst) Norway
Year completed 2001 2003
Purpose of tunnel traffic traffic
Overburden 10 - 150 m 10 - 300 m
Total length 2310 m 3800 m
Requirement water inflow 10 - 30 dm
3min100 m of
tunnel 10 - 20 dm
3min100 m of
tunnel
Grouting strategy systematic pre-grouting systematic pre-grouting
Drill hole quantity 057 mm2 (1
126 mm2 (1
Grouting material Standard cement with micro silica (Rapid Rp 38) from Norcem
Standard cement and Ultrafin 12 from Scancem
Additives Rescon HP 2-3 Grout Aid 5-23 SP40 2-3
WC ratio 10 - 05 20 - 05
Pumping pressure 2 - 9 MPa 5 - 7 MPa
Mass quantity 81 kgborehole-m 30 kgborehole-m
Results of grouting (water inflow)
101 dm3min100 m 84 dm
3min100 m
(1 m
2 tunnel is the entire tunnel circumference multiplied with the total tunnel length
Table 3-3 The grouting summary in two tunnel projects (Hollmeacuten 2007)
Tunnel project Baneheia Norway Lundby Sweden
Year completed 2001 1998
Purpose of tunnel traffic traffic
Overburden 20 - 40 m 5 - 35 m
Total length 3000 m 2060 m
Requirement for tightness 60 dm3min total
05 - 25 dm3min100m of
tunnel
Grouting strategy systematic pre-grouting systematic pre-grouting (continuous)
Drill hole quantity 108 mm2 (1
200 mm2 (1
Grouting material Ultrafin 12 from Scancem Grouting cement from Cementa
Additives Grout Aid 5 - 15 SP40 2 Bentonite 3 Intraplaster 05
WC ratio 09 - 07 30 - 05 (03 hole filling)
Pumping pressure 5 - 8 MPa 25 MPa
Mass quantity 9 kghole-m 6 kghole-m
Results of grouting (water inflow)
18 dm3min100 m 09 dm
3min100 m
(1 m
2 tunnel is the entire tunnel circumference multiplied with the total tunnel length
28
29
4 ENHANCED UNDERSTANDING OF GROUTING DESIGN AND EXECUTION
41 General
Common steps in grouting design are
1 Set the functional requirements targets for a tunnel
2 Analyse the data available of water conductive geological features
3 Set the limit for maximum water inflow
4 Establish the start criteria for grouting
5 Engineer the drilling patterns grout mixes and the stop criteria for grouting
6 Specify the other requirements for work including the verification of the grouting
result and quality control and
7 Specify the requirements for documentation and document control
Some of the above mentioned points are emphasised more than the others in this work
Posiva sets targets for water inflow and the grouting (grout type and grout quantity) and
thus they are not evaluated further The available information from drill holes in
ONKALO area was studied from the grouting point of view The start and stop criteria
are paid much attention to since they are important but poorly understood parts of the
grouting design The design of drilling patterns grout mixes and work specifications are
customary design work but they should not be treated separately from the start and stop
criteria
The national and international standards and norms do not guide the optimisation work
sufficiently The national norm (Concrete Association of Finland 2006) does not give
the guidelines for eg
1 Setting the grouting start criteria for the different characterisation methods
2 The quality control tests needed for determination of the mix properties required in
the design
3 Selectingdesigning the mixes for the different rock conditions
4 Grouting in the deep rock (including the guidelines for the water loss measurement
and the grouting pressures) and
5 The design work (to involve the pumping time to other design parameters)
These subjects are paid an attention to in this work
Some items mentioned above are discussed here from the theoretical point of view The
suggestion of application in ONKALO is presented later in this work (Chapters 5-7)
42 Start criteria for grouting
The criteria when grouting is started are important part of controlling groundwater Low
trigger value for grouting means low water leakages but possibly results in much of
grouting and grouting holes which is not always desirable On the other hand high
trigger level may be desirable from the point of view of grout intake or number of
30
grouting holes but not from the remaining water leakages (long term safety aspects)
Practically the start criteria mean a selection of a suitable characterisation method or a
combination of those and derived quantitative trigger levels It is important that the
start criterion is based on the information that can be accurately measured
The flow log measurement water loss measurement and measuring out flowing water
are complementary methods to characterize the probe holes in ONKALO In order to
select one or several methods both the suitability and reliability of the method(s) and the
priority of the grouting objectives should be taken into account while making a choice
between the characterization methods or a combination of them However those
methods tell nothing about fracture orientation or eg the channelling of the flow
If having several methods in use for example due to the reasons of a) complement the
picture of rock and b) verify the availability of the result the start criterion set for
different methods should be linked between each other Below the chain from flow rate
to hydraulic aperture is presented (flow rate gt the transmissivity of a fracture or a
fracture zone (Eq 4-1) gt Lugeon value (Eq 4-3) or hydraulic aperture (Eq 4-4))
Q = the flow rate (m3s) eg from a probe or grouting hole or eg the tunnel
Here Q is the starting point since in the case of ONKALO the trigger level is set based
on that parameter Based on the flow the transmissivity of a geological feature can be
determined as follows
H
RR
Q
T2
ln 0
(4-1)
where T is the transmissivity of a fracturezone (m2s) H = groundwater pressure
expressed as a height of water coloum depth (m) R0 = the radius of the flow (m) (in
flow loggings 14 m is used and in tunnel scale typically 2H is used) and R = the radius
of a hole or a tunnel (m) The transmissivity is connected to the hydraulic conductivity
K (ms) with the following equation
T = KL (4-2)
in which L is the length of the measuring section or the thickness of a geological
formation or in the case of tunnelling the length of a measuring section (m) The
hydraulic conductivity can be transformed as a Lugeon value with the following
relationship (Bergman amp Nord 1982)
1 Lug ~ 17E-7 ms
This relationship varies in different references Eriksson amp Stille (2005) Houlsby
(1990) and Concrete Association of Finland (2006) present relationships 1 Lug ~ 13E-7
ms - 16E-7 ms The connection between the hydraulic conductivity and the Lugeon
value is observed to vary also with depth (Bergman amp Nord 1982)
31
The Lugeon value itself is determined as follows
tpL
QLug
Lug (4-3)
Where QLug = water loss (dm3) L = the length of a measuring section (m) ∆p = the
overpressure (MPa) and t = measuring time (min) The use of water loss data and the
interpretation of the results are handled by Houlsby (1990) When measuring with
several pressures the interpretation of the results is important part of determining the
correct Lugeon value
Since hydraulic apertures are interesting from the grouting point of view finally the
connection between the hydraulic aperture b and the transmissivity of a fracture is as
follows
312
g
Tb (4-4)
where b = hydraulic aperture (m) μ = the viscosity of water (Pas) and ρ = the density of
water (kgm3)
43 Stop criteria for grouting
General
A stop criterion means a point when grouting designer or grouter can be enough
convinced that the aimed sealing result is reached and the targets are met Practically it
is impossible to verify the grouting result during grouting and therefore different stop
criteria have been developed The importance of the stop criterion enhances as the
targets get stricter or optimisation between water leakages and grout take should be
done
Various stop criteria
Grouting practices and the stop criteria were studied (Hollmeacuten 2007) as a literature
study in order to find out the most suitable approach A literature study brought up the
following ways to set the stop criterion
1 Setting the maximum pressure and the grouted volume
2 Grouting intensity number (GIN) ndashprinciple and
3 Time stop criterion
Traditionally the limits for grouting are defined by two stop criteria the highest
allowable grouting pressure andor the highest allowable grout intake Grouting is
stopped after a few minutes the grouting pressure has been stabilised at the set
maximum level Often there are also limitations eg for the maximum grout intake or
the grout flow This kind of stop criteria is empirical but widely used in conventional
32
tunnelling This approach which complies with the national norm (Concrete
Association of Finland 2006) has been used in ONKALO where adequate limits for
the grouting pressure is set based on the rules for grouting pressures (the smallest
fracture to be grouted and the aimed penetration length determined according to
Concrete Association of Finland (2006) and the limits for grout intake based on the
experiences obtained during tunnelling
Another stop criteria typically used in dam grouting is developed by Lombardi and
Deere (1993) and Lombardi (1997) and further studied for tunnelling purposes eg by
Brantberger (2000) The short overview is done and presented by Hollmeacuten (2007) This
so called Grouting Intensity Number (GIN method) defines the limiting curve by three
parameters the maximum pressure the maximum grouted volume and the empirically
selected GIN value The idea of the method is to reduce the risk of hydro fracturing In
practice when the volume of injected grout is low higher pressures can be used And
when the volume of grout injected is high the pressure should be lower Any
combination of the grout pressure and the grout intake can be used as long as their
product falls under the selected GIN curve Grouting is to be stopped when the pressure
rises above the selected maximum limit the grout intake rises above the selected
maximum limit or the product of the grout intake and the pressure rises above the
selected GIN value According to Hollmeacuten (2007) the problem of the GIN value is that
it cannot be explicitly solved Based on the literature study (Hollmeacuten 2007) the GIN
method has been used only once in tunnelling in the Goumlta Tunnel in Sweden Even
though the GIN value was very low most of the performed groutings were stopped to
the maximum pressure or to the maximum volume
The third way to set the stop criteria Hollmeacuten (2007) found is an analytical approach
also called the time stop grouting The model is developed by Chalmers University of
Technology (CTH) and Royal University of Technology (KTH) in Sweden (Gustafson
amp Stille 2005) In this approach the distance between grouting holes the grouting
pressure the fracture openings and the rheological properties of grout are linked with
each other A desired penetration length from the grouting hole in the smallest fracture
to be sealed is to be determined Then the time the grout (with certain rheological
properties) is to be pumped into the rock under the predetermined pressure can be
calculated Or another way around the desired grouting time can be set and the required
grout and the grouting pressure will be adjusted The approach has a complicated
physical background and the implementation requires simplifications and
approximations
In principle this is the only method to link the fracture and the grout properties to the
pumping pressure and the time and thus the design can be continuously presented As
the drawbacks there is very limited practical experience the method is sensitive to eg
the fracture characteristics available (fracture apertures) and to the rheological
properties of the grout Also it is an advantage to know whether the grout flow is one-
dimensional (channel-like) or two-dimensional (a planar fracture or a fracture with a
varying aperture) According to Hollmeacuten (2007) the stop criteria based on the analysis
of the grout penetration is not easy one to use when fracture system is complicated but
may be usable when fracture system is simple The criterion is also difficult to use if
the information about fracture characteristics is unreliable Therefore further
33
development of the time stop criterion is needed since exact characterization at the site
is very difficult
The stop criteria presented are compared in Table 4-1 Among the alternative
approaches the time stop criterion seems to be the most reasonable tool for grouting
design work in ONKALO because optimisation should be done However the
approach does not comply with the national building codes for the grouting
Table 4-1 Comparison of different grouting stop criteria (modified and complemented
from Hollmeacuten 2007)
Stop criterion
criteria Pros and cons Suitability
Prevailing practice = max pressure and max volume
Empirically set maximum volume and maximum pressure
+ Method is widely used Much reference sites in general + Results are sometimes good enough -Poor economy It is possible that grout injection takes more time and grout than is needed On the contrary high pressure and high grout intake do not guarantee sealing result good enough - empirical not a tool for optimisation - not much reference sites with very low inflow target
In principle for every tunnel depends mainly on the investments on grouting and skills of the grouting designer
GIN-method
Maximum volume maximum pressure and selected GIN-value
+ Fast grouting cycle (no hydrogeological characterisation recommended needed) - empirical not a tool for optimisation - experiences only once in tunnelling (Goumlta Tunnel) - no rules how to solve exact definition of the GIN-value Eg the method is empirical - not useable when the joints are very tight
Originally for dam grouting not for deep tunnels There is a possibility that method is workable in variable type of rock mass
Time stop criterion (Grouting Time ndashmethod)
Grouting time (t) for each combination of desired penetration length grout characteristics and allowable grouting pressure
+ Gives analytical method to study grout penetration with relation to stop criterion + Good economy The minimum grouting time can be calculated The grouting can be optimised - Limited practical experience which means that the grouting practises should be further developed -Sensitive to fracture characteristics and grout properties which are not easy to handle in tunnel conditions
In tunnels where sealing result is important and possibly at the same time grout intake is critical which means that investments on grouting are reasonable Further development needed Requires competent designer in fields of grouting geology and hydrogeology
34
Time stop criterion
The relationship between grout properties grouting pressure grout penetration length
and grouting time with cement based grouts
The approach is presented by Gustafson amp Stille (1995) and in the literatury study by
Hollmeacuten (2007)
For a certain grout there is a maximum penetration distance (Imax) at steady state into a
fracture (Haumlssler 1991 Gustafson amp Stille 1996)
0
max2
)( bppI
wg (4-5)
where pg = grouting pressure (Pa) wb pgH 23 (Gustafson 2005 Concrete
Association of Finland 2006) pw = groundwater pressure (Pa) b = the hydraulic
aperture of fracture (m) τ0 = the yield strength of grout (Pa) ρb = the density of rock
(kgm3) g = gravitational acceleration (ms
2 ) and H = depth below ground surface (m)
The equation for the maximum grout penetration (Haumlssler 1991) forms the basis for
analytical approximations for the grout penetration
Correspondingly there is a timescale given as the characteristic grouting time
(Gustafson amp Claesson 2004)
2
0
0
6 gpt (4-6)
Where t0= characteristic grouting time (s) μg= the plastic viscosity of grout (Pas) ∆pg =
grouting overpressure = pg ndash pw (Pa) and τ0 = the yield strength of grout (Pa)
The maximum penetration length and the characteristic grouting time are thought to be
linked together (see Figure 4-1) even though they do not describe exactly the same
point of time However based on this starting point the time t (s) needed for pumping
grout (μg τ0) into a fracture with hydraulic aperture b (m) can be determined as the
desired penetration length I (m) according to the theories presented by Gustafson amp
Stille (2005) Gustafson amp Claesson (2004) In order to determine t relative penetration
length ID and relative penetration time tD are to be determined The key parameters used
in time stop criterion -approach are illustrated in Figure 4-1
Illustration of the parameters in 1 D Illustration of the parameters in 2 D
Figure 4-1 An illustration of the key parameters in the time stop grouting -approach The explanations of the parameters can be found in the
text 1D and 2D refers to the dimension of flow
35
36
The relative penetration ID (s) is calculated with the help of the desired and the
maximum penetration lengths The relative penetration length is the same in all
fractures cut by a borehole (Gustafson amp Stille 2005)
maxI
II D (4-7)
The corresponding relative grouting time (tD) is presented for one-dimensional (1D)
case which presents a flow channel and for two-dimensional (2D) case which presents
a planar fracture The determination of the relative grouting time and the
approximations for the relative time for the 1D and 2D cases are (developed by
Gustafson amp Stille 2005 a typing error corrected by Hollmen 2007)
0t
ttD (4-8)
21
21)1( DDt (4-9)
21
6)2( DDt (4-10)
Where t = the grouting time (s) to reach the point I and
D
D
I
I
24
2
(-) (4-11)
By selecting the dimensionality of the case the time for a certain grout to reach the
desired penetration in a fracture can be calculated
In order to prevent a possible backflow the ratio of water pressure (pw) and the excess
pressure (Δp) should be smaller than the relative penetration length (ID) (Fransson amp
Gustafson 2007 Axelsson 2006)
By varying the grout (its penetration ability and rheological properties) the grouting
pressure and the drilling pattern the optimal grouting for different rock conditions can
be designed According to this principle the stopping of the grouting can be controlled
via the pumping time
Relationship between grout properties grouting pressure grout penetration length and
grouting time with colloidal silica
Colloidal silica (also silica sol) is a Newtonian fluid and in order to control the spread of
it it is important to link the desired penetration length with the gelling time that is
controlled by the dosage of an accelerator in a mix The theory of the grouting with
37
colloidal silica is presented by Funehag (2007) A short overview is collected also by
Lokkila (2008)
The complicated mathematics can be transformed to a simple form and the basic tools
for designing the silica grouting lies on the equations for the penetration length in the
1D and 2D cases
0
1max6
g
D
ptbI (4-12)
DDII 1max2max 450 (4-13)
Where b = hydraulic aperture (m) ∆p = overpressure (Pa) tg = the gel induction time (s)
and μg= the initial viscosity of a grout (Pas) The gel induction time means the point of
time at which the viscosity of colloidal silica has doubled
The maximum penetration length is achieved in the time equal to 15 tg and further
pumping does not result in any further penetration The minimum pumping time should
then be half of the gel time which is characteristic for each silica sol recipe and for each
temperature
As the desired penetration length together with suitable drilling pattern are selected in
certain fracture environment and temperature the adequate grouting time is determined
and based on it the suitable gelling time and thus the dosage of an accelerator are
selected
Grout intake
Gustafson and Stille (2005) have presented the equations to estimate grout volumes in
1D and 2D cases In principle the grouted volume can be used as a stop criterion as
well Also with the help of the penetration time the grout flow is predictable in
principle
The volume of a grout in a fracture is
IwbV D)1( (4-14)
bIV D
2
)2( (4-15)
Where V(1D) (m3) refers to the grout intake in 1D system (a channel) and V(2D) (m
3) to
the grout intake in 2D system (planar fracture) and w = the width of a 1D channel The
maximum grouted volumes can be calculated in similar ways by using Imax instead of I
38
If having a multiple fracture system the grouted volume in each of the fractures and
thus in the whole fracture system can be calculated by using relative grouted volumes
VD (-)
)1()1( DD DD IV (4-16)
2
)2()2( DD DD IV (4-17)
For the number of fractures the theoretical total volume is then
)1()1()1( max DDDVVV Dtot
(4-18)
)2()2()2( max DDDVVV Dtot
(4-19)
Uncertainties in time stop criterion
Like any other method the time stop criterion is sensible to a certain source data and
this causes uncertainties The aperture varies a lot in a single fracture even though the
transmissivity (hydraulic aperture) is studied to be able to describe the groutable
aperture well (Fransson 2001) However it is practically impossible to find a
representative hydraulic aperture with a few boreholes Discussion on the conceptual
understanding of fracture characteristics ndash especially the nature of the fracture aperture
ndash and its role as an uncertain factor are available in the reports by Hakami (1995)
Sievaumlnen (2002) and Lokkila (2008) The rheological properties of a grout have natural
variation due to the variation of cement qualities the measuring methods and also the
reological parameters yield strength and viscosity are interpreted with a models with
more or less confidence The rheological properties of grouts also vary with the time
Also the prevailing overpressure in a fracture always differs more or less from that one
readable at the grouting equipment
In order to understand the most important factors affecting the penetration length of a
grout a sensitivity analysis was done by Lokkila (2008) The analysis was carried out
by selecting the start values for each parameter and varying them one by one The
values for the parameters were selected among the observed properties and the expected
conditions
According to the results of Lokkila (2008) the factor that has the most significant effect
on the penetration length is the hydraulic aperture of a fracture The yield value and the
viscosity of a grout as well as the grouting overpressure also have a notable effect The
system is very sensible to these factors and due to this reason the focus should be
concentrated in the supply of accurate characterisation data the quality control of grout
mixes and careful follow up of the design during the grouting work On the contrary the
system is not that sensible to the pumping time of the grout ndash especially as the grouting
proceeds This should be understood so that relatively high increase in pumping time is
needed in order to increase the penetration length quite a little especially in small
fractures
39
44 Experiences from the field tests
Three grouting tests were performed in ONKALO during the year 2007 The first
grouting test was performed in the ONKALO access tunnel with cement-based low pH
grout The second grouting test was carried out in the personnel shaft 1 This test was
divided into three stages and the low pH grouts were used The third grouting test was a
pilot test with colloidal silica
From now on the method presented by Gustafson amp Stille (2005) is also called
Grouting Time ndashmethod as it was named during the grouting tests
Test grouting in the access tunnel at the chainage 1880
The intention of the first grouting test was to practice the use of the time stop criterion
together with the grouting holes inside the tunnel profile The used grout was cement-
based low pH grout UF-41-14-4 The progress of the field test is reported in detail by
Hollmeacuten (2007) and the grout related tests by Ranta-Korpi et al (2007) The mix
properties are collected to the Appendices 1 and 2 The mix compositions are presented
in ldquoNames and compositions of groutsrdquo
The test site (Figure 4-2) was at the tunnel chainage interval from 1880 to 1906 in
ONKALO The overburden in the test site is ~190 m
Four 26 m long probe holes were drilled and studied (Hollmeacuten 2007) All of the probe
holes were almost dry but the water loss measurement (pressures 22 - 26 - 29 - 26 -
22 MPa) showed a slight water intake The flow logging did not succeed because the
leakage was too small The hydraulic aperture of the fractures was estimated based on
the water loss measurement results and with the assumption of fracture numbers (two)
detected in the pilot hole ONK-PH7 Based on the obtained characterization results the
preliminary impression was that there are two fractures with an aperture of ~30 microm
Figure 4-2 The test sites of the grouting tests in ONKALO in 2007 (Hollmeacuten 2007)
Test site (FT2)
Test site (FT1)
40
In order to study the GT method (time stop criterion) the intention was to design the
grouting to be fully optimised without any safety factors The grouting holes were
located inside the tunnel profile because it is one way to diminish the grout remaining
in rock after excavation
The grouting fan included 17 grouting holes (Oslash 54 mm) and every hole was about 26 m
long (Hollmeacuten 2007) The distance between them was 15 m and all were parallel with
the tunnel and inside the theoretical tunnel profile The flow logging and the water loss
measurement were done in all grouting holes The latter showed connections between a
few grouting holes Because the flow logging didnrsquot give any results the hydraulic
apertures of the fractures were again estimated from the water losses Again the number
of fractures (2 fractures) was estimated with the supposition from the pilot hole ONK-
PH7 and the calculated hydraulic apertures were similar varying between 12 - 30
microns
The test was carried out with Posivarsquos new grouting equipment of which the
components are made by Haumlny Figure 4-3 The equipment was in use in the tunnel for
the first time
There were no results of the mix UF-41-14-4 from the field using Posivaacutes new grouting
equipment Thus the material parameters of the grout were based on the rheology
measurements done in the laboratory
The intended grout penetration was 30 m outside the tunnel profile which means that
the penetrations of 32 - 38 m were needed (Hollmeacuten 2007) The grouting pressure of 8
MPa was the lowest to reach the desired penetration in reasonable grouting time
Because the fractures were very small and channelling like flow was assumed the
fracture system was assumed to be 1D and the grouting times for all single holes were
calculated using the GT method Against the theory the maximum grouting time (tmax)
was limited to 25 min even though the maximum calculated grouting times in some
holes were 40 min Also the stop criterion based on the minimum flow (0 l per 2 min)
was set ndash against the theory
41
Figure 4-3 Posivarsquos new grouting equipment (the mixers agitators and pumps made by
Haumlny) was used in the test (photograph by Kalle Hollmeacuten)
Unexpectedly the grout leaked from nearly all of the roof holes and finally from the
drift The total grout intake in the fan was 1402 dm3 out of which 744 were pumped
into three holes The total grout intake is almost the same than the volume of the
grouting holes and the pilot hole which was assumed to be fully or partly filled During
the grouting there were more connections between the holes than the water loss
measurement indicated There could be several reasons for the grout leaking but the
main reason is probably that on blasting round 1876 - 1880 the excavation damaged
zone (EDZ) extended longer to the rock mass than the packers (10 m) extended due to
the repair blasting Another reason for the grout leakage could be that the rock andor
the grout properties were inaccurate (Hollmeacuten 2007)
The grout properties used in the design were reviewed based on the field measurements
after the field test 1 and the results showed that the values (Ranta-korpi et al 2007
appendices 1 and 2) used in the design were more or less invalid The back calculation
was done by calculating the real viscosity of the grout with the help of the Marsh-funnel
results the stick results and the diagram by Haringkansson (1993) The quick outflow from
nearby grouting holes supported the idea obtained from the observed mix results These
observations showed that it is necessary to check the grout parameters at the site with
real grout mixer not only in the laboratory
Eight control holes were drilled in order to study the grouting result All of the control
holes (extended about 3 m out of the tunnel profile) were dry and one hole showed
42
water loss However the exact penetration length of the grout remains unknown since
the actual orientation of the fracture(s) was unknown Based on the leakage water
mapping the tunnel section was dry and the grouting seemed successful
Test grouting in the personnel shaft 1
The field test 2 was arranged in the ONKALOrsquos personnel shaft 1 from the depth level
-80 m to the level -110 m (Figure 4-2) The grouted area in the shaft was ca -86 -
-110 m (24 m long) and the radius of the shaft was 2 m The progress of the field test is
reported in detail by Hollmeacuten (2007) and the grout related tests by Ranta-Korpi et al
(2007) As more knowledge about the grouting material characteristics was available
they were taken into account in the calculations The mix properties are collected to the
Appendices 1 and 2
Again in order to study the GT method the intention was to design the grouting to be
fully optimised without any safety factors The grouting was done using Posivarsquos
grouting equipment (Figure 4-3)
The grouting was done in three stages in the first and the second rounds three grouting
holes per round were grouted and six holes were grouted in the third round (Hollmeacuten
2007) The second roundrsquos grouting holes were the control holes for the first round and
the grouting holes of the third round were the control holes for the second round
All grouting holes were vertical and they were inside the shaft profile because the
grouting holes outside the shaft profile are not accepted in ONKALO The holes were
core drilled The rock mass was characterized using the water loss test (single packer
and double packer with separation of 1 m) and the flow logging ndashtool Also deviation
measurements were done for the grouting holes
The low pH grouts were used and the recipes were selected separately for every
grouting in order to find an optimal solution (Hollmeacuten 2007) The design approach was
the time stop criterion and it was expected that the dimension of the flow would be 2D
The grouting pressures were set less than the limits possibly leading to the uplifting
which means that the maximum pressures should be less than 65 MPa The target grout
penetrations were 28 m 35 m and 40 m depending on the stage and the hole location
(Figure 4-4) The penetration lengths were selected in a way that a minimum coverage
of the grouting was aimed and no safety factors were used This was done due to
practicing the optimization and testing the method
43
Figure 4-4 The grouting hole locations and the grouting sequencing Sequence 1 the
holes no 86 - 88 Seq 2 the holes no 89 - 91 Seq 3 the holes no 92 - 98 The shaft
radius R is 2 m and the hole spacing is ~ 1 m In total 12 grouting holes were designed
and grouted (Hollmeacuten 2007)
The aim of the grouting in the first stage was to seal the largest fractures (Figure 4-5 a)
(Hollmeacuten 2007) In the hole no 86 the aim was to seal the fractures with apertures of
47 microm or larger and in the holes no 87 and 88 the fractures with the apertures of 24 microm
or larger Because all the holes were grouted at the same time the idea was to find the
same grouting time and the pressure in every hole by using different mixes if needed It
was designed that the grout UF-41-12-51 (τ0 asymp 888 Pa microg asymp 146 mPas) will be used to
the hole no 86 and the grout UF-41-14-51 (τ0 asymp 52 Pa microg asymp 103 mPas) to the holes no
87 and 88 The design window in this grouting stage is presented in Figure 4-6 After
the calculations the grouting time (2D model) was set to be 30 min and the grouting
pressure 45 MPa which means the overpressure of ca 35 MPa The calculated times
and pressures were the same in all holes
The hydraulic packers were set to the depth of 6 meters from the beginning of the holes
First the holes were filled with the grout (20 - 30 min) After that the pressure was
raised to the target level at the same time in every hole
The quality control tests for the first grout mix (UF-41-12-51) showed too low Marsh-
values therefore that mix was rejected and a new grout batch was mixed Because the
Marsh value was again too low the grout recipe was changed to the grout UF-41-12-36
44
(τ0 asymp 157 Pa microg asymp 251 mPas) which passed the quality control tests No changes to the
grouting times were done
The total grout intake was 1172 l out of which the proportion of the grouting holes was
328 l According to the dimensionality analysis the grout flow was one- two- and three-
dimensional during the grouting
After the grouting of the first stage the grouting holes of the second stage were drilled
and via them the result of the earlier grouting was studied The results of the flow
logging showed numerous fractures in the holes and the largest fracture aperture was
75 microm However the proportion of the larger fractures (gt 40 - 50 microm) was decreased
(Figure 4-5 b)
The grouting of the next rounds was designed and executed with the similar principle
(Hollmeacuten 2007) The grout for the next grouting round was UF-41-12-48 (τ0 asymp 888 Pa
microg asymp 1447 mPas) which was used in every hole (Ranta-korpi et al 2007) The aim of
the grouting in the second stage was to seal all the fractures down to 20 microm of an
aperture After the calculations for all holes the grouting time (t(2D)) was set to be
100 min and the grouting pressure 60 MPa which means the overpressure of ca
50 MPa
After all the holes were filled in the grouting pressures were raised to the target level
(60 MPa) in all holes at the same time After 10 minutes old and new grout came out
from one grouting hole and the grouting was interrupted It means that there were
connections between the grouting holes of the first and the second stages Shortly after
the grouting was continued the grout flow was very low in every hole ~ 00 dm3min
until the end of the grouting The total grout intake was 924 l out of which the
proportion of the grouting holes was about 13
The result of the second grouting was studied via the grouting holes of the third stage
(see Figure 4-5 c) The results of the flow logging still showed numerous fractures in all
holes and the largest fracture aperture was 45 microm The need for grouting was evident
even though the larger fractures had been sealed earlier
The third stage was grouted with the grout UF-41-14-4 (τ0 asymp 840 Pa microg asymp 104 mPas)
which was to be used in every hole The planned penetration length was 4 meters in
every hole and the aim was to seal all the fractures with apertures larger than 20 microm
The grouting time (t(2D)) was set to be 110 min and the grouting pressure 60 MPa All
holes were first filled and then grouted at the same time and due to this pipe branches
were used to connect the holes
During the grouting the pressures were less than the target level and the grout flows
were much higher than expected based on the results from the water loss measurement
and the flow logging The fracture system was very complicated and there were more
and larger fractures than expected After 90 minutes the grout leaked to the tunnel at the
chainage 960 (about 30 m away) When the grouting time 110 min was reached grout
flows were still very high (asymp 10 dm3min) in every hole Therefore the grout recipe was
changed for a thicker grout UF 41-10-4 (τ0 asymp 27 Pa microg asymp 278 mPas) and grouting was
45
continued with that grout about 50 min The grout flow and the total grout intakes were
still high in every hole which confirms the arguments that the results of the pre-
measurements were invalid Another possible explanation is that the fractures opened
during the grouting or that fracture infillings moved and new connections formed The
grout flow was two- and three-dimensional during the grouting and there was a large
fracture zone which skewed the dimension-analyses After the third grouting stage a
24 m long extra control hole was drilled The results showed still relatively high water
loss
All in all in this field test the fractures were slightly sealed after the first and the second
round especially the largest fractures but the effect was not so great than expected
(Hollmeacuten 2007) However there remained a question if the results of the measurements
were not reliable Therefore the real results of the grouting can be evaluated from the
possible water leakages after full-face boring Even though the 2D flow model was
used the total grout intake was much higher than expected after the tests in the grouting
holes Especially on the third round the total grout intake was very high in proportion
to the measured Lugeon values and the hydraulic apertures
46
a)
-110
-105
-100
-95
-90
0 10 20 30 40 50 60 70 80 90 100
Aperture of fracture bhydr [microm]
Dep
th Z
[m
]
ONK-PP 86 ONK-PP 87 ONK-PP 88
b)
-110
-105
-100
-95
-90
0 10 20 30 40 50 60 70 80 90 100
Aperture of fracture bhydr [microm]
Dep
th Z
[m
]
ONK-PP 89 ONK-PP 90 ONK-PP 91
c)
-110
-105
-100
-95
-90
0 10 20 30 40 50 60 70 80 90 100
Aperture of fracture bhydr [microm]
Dep
th Z
[m
]
ONK-PP 92 ONK-PP 93 ONK-PP 94 ONK-PP 95 ONK-PP 96 ONK-PP 97 ONK-PP 98
Figure 4-5 The observed fracture apertures at the different stages of the grouting test
a) the observations before grouting (3 holes) b) the observations after the first grouting
round (3 holes) and c) the observations after the second grouting round (7 holes)
before the last grouting round (Hollmeacuten 2007)
47
Figure 4-6 The design window in the first grouting round in the second field test The
penetration depth I as a function of the grouting time (t(2D)) ( 0 = 52 Pa and microg =
103 mPas) The hydraulic aperture of the fracture is 24 microm same as in the grouting
holes 87 and 88 The shaded area represents the design window for the pressure and
the grouting time when I = 283 m (Hollmeacuten 2007)
Conclusions of the two grouting field tests
As a conclusion of grouting tests Hollmeacuten (2007) presents the following opinions
The water loss measurement and the flow logging used together are useable and
recommended investigation methods to estimate the number and the hydraulic apertures
of fractures The hydraulic aperture of a fracture is quite a good estimation for the
grouting aperture and it should be known before the grouting parameters are decided
The field tests proved that the overpressure of water loss measurement should be
revised when operating in deep averagely fractured rock Based on the study the
recommended grouting pressure is little less than the limit for hydraulic uplifting
48
Concerning the stop criteria the main conclusion about the field test was that the stop
criteria based on the analysis of grout penetration is not easy to use when a fracture
system is complicated but may be usable when it is simple (Hollmeacuten 2007) The theory
takes into account only the fractures that are intersected by a bore hole The criterion is
also difficult to use if the fracture characteristics are unreliable Therefore Hollmeacuten
(2007) suggested further development of the time stop criterion (grouting time ndash
method) is needed since the exact characterization at the site is very difficult However
the theory behind the time stop criterion is a useful tool for the optimisation
The following conclusions from the experiences of the field tests were also expressed
by Hollmeacuten (2007)
- The grout properties used in the design calculations should be results from the field
using a real grouting equipment not from the laboratory
- The rock characterization methods (the water loss measurement and flow logging)
give only estimations about the fracture density and their apertures Real fracture
network to where the grout penetrates can be much different
- If the required inflow target is strict the grouting holes inside the tunnel profile can
risk the grouting result
- The total number of grouting holes in a fan should not be minimized because there
is always a risk that the grouting hole doesnrsquot cut the fracture sufficiently
- A safety factor for the penetration length is recommended
- Packers must extend longer to the rock mass than the excavation damaged zone
- It is important that before grouting the contractor informs all the differences and
disturbances from the excavation to the grouting designer and
- Grouting equipment the accuracy of the flow meter should be at least
001 dm3min
If the packers are released too early the grout flows out from the borehole and at the
same time the grout may flow from the fractures to the borehole If that happened the
grouting would be unsuccessful The beaker test to illustrate packersrsquo removing time
was used in the field tests The results of the test were invalid because in two cases the
grout flowed out from the borehole when the packers were released Therefore the
methods to indicate packerrsquos removing time need further developing
Pilot field test with colloidal silica
A preliminary study of grouting with colloidal silica was done in the year 2007 This
study included also a pilot test grouting with the colloidal silica which is described
below The test is fully reported in project memorandum
The objectives of the silica test from the grouting technology point of view were to
1 obtain experiences of the material (colloidal silica) under the prevailing conditions
at ONKALO and with Posivaacutes grouting equipment
2 test and collect practical experiences about post-grouting with colloidal silica and
3 collect experiences on removing colloidal silica from the drill holes
49
The test site was located in the ONKALO access tunnel at about the chainage 1815 at
the depth level of about -180 m (Figure 4-7) The location of the grouting and the
control holes is depicted in Figures 4-7 and 4-8 The boreholes PR2 - PR5 are the
grouting holes and the holes PR6 - PR15 are the control holes A vertical geological
structure including water conductive fractures was assigned as the test site location
A commercial Meyco MP 320 colloidal silica and its NaCl accelerator (Meyco MP320
accelerator) were used in the pilot test
Before the first grouting trial the grouting holes PR2 - PR5 were characterized by the
water loss measurement the flow logging and the out flowing water The results
obtained from different measurements were not fully compatible but they gave a clear
indication that the holes intersect a water conductive fracture and its hydraulic aperture
was estimated to be ~15 microm (calculated from the flow log results) No hydraulic
connections between the holes or between the holes and the tunnel were detected The
temperature in the beginning of the holes was ~12 oC eg close to that prevailing in the
tunnel However it varied along the holes The water pressure was 16 MPa The
temperatures of the colloidal silica and the accelerator were 122 oC and 123
oC
respectively
Prior to the grouting test the beaker tests were conducted in order to determine the
gelling times and the dosing of the accelerator The target gelling time was 45 min and
thus the pumping time 23 min was set Five mixing ratios (colloidal silicaaccelerator)
were tested in tunnel conditions and the mixing ratio 5125 met the target value for
gelling time
The grouting design was calculated with the 1D model for penetration The target
penetration length was 15 m The stop criterion was grouting time
Before the grouting was started the agitator and the grouting hose were washed with
water in order to remove the alkaline water from the equipment The grouting mass with
the silicaaccelerator ratio 5125 was mixed in the agitator for 60 seconds
The four grouting holes were equipped with short packers and the valves were in open
position Air and water were removed from the grouting hose The pressure was
increased to the planned grouting overpressure (04 MPa) immediately thereafter and
the pressure was kept constant The grouting was started from the drill hole PR2 It
became evident that the mass intake will be very small within the planned grouting time
(23 min) In fact during the grouting there was water in grouting holes that was injected
into the fractures instead of colloidal silica The grouting overpressure was raised to 09
MPa without any conceivable effect on the rate of mass intake The observations were
made at the pressure gauge grout movement may have happened but it was not possible
to detect
50
Figure 4-7 The silica grouting test The job site in the ONKALO access tunnel (top
view PL refers to the chainage) and the location of the grouting holes ONK-PR2 ndash
ONK-PR5 (A = the length of the grouting holes B = the distance from the tunnel) The
brown element is a vertical geological structure and the blue lines shows the water
leaking fractures observed in the tunnel roof and the walls The control holes were
drilled later to the same direction and inclination with the grouting holes
Figure 4-8 The location of the grouting holes (front view) ONK-PR2 ndash ONK-PR5 and
the control holes ONK-PR6 ndash ONK-PR15 The drill holes ONK-PR2 ndash ONK-PR15 are
7 m long and declined 5 o
PR10
PR3
PR4
PR5
PR7
PR8
PR6
PR9
PR11
PR15
PR14
PR13
PR12
30 m
13 m
15 m
m
075 m
x
y
asymp 40deg
B
A
x
y
x
y
asymp 40deg
B
A
PR2
51
The gelling time determined with the beaker method gave the value of 35 min after the
mixing This value was 10 min shorter than the value (45 min) from the test a few hours
before with the same method One possible explanation could be that in spite of
cleaning the agitator and the hose before the grouting test there has been some alkaline
water left somewhere in the equipment accelerating the gelling reaction In the
following batch the result of the beaker tests was in line with the earlier test results
The most conductive drill hole PR5 was grouted next The longer gelling time (57 min)
was applied with the mixing ratio 511 The grouting overpressure was also raised to
15 MPa The silica intake was about the same as in the previous hole (1 - 2 l) regardless
of longer grouting time (30 min) and higher grouting pressure The gelling time of
55 min was quite close to the value determined earlier with this mixing ratio The
cleaning of the holes was not done
In total two holes were tried to be grouted and then the test was interrupted The first
grouting trial failed because the grout flow was too slow with regard to the gelling time
and the grouting was interrupted A new test was designed The principle was the same
but the following key modifications were made
1 In the calculation the 2D model is to be used instead of applying the 1D model
2 Longer gelling times are preferred because of very small fracture apertures and
3 The grouting holes are to be filled with colloidal silica before grouting
The target was to grout 2 h In order to reach suitable gelling time new mixing ratios
(silicaaccelerator) for the beaker tests were determined One ratio was the same as in
the first trial The air temperature was T = 13 oC during the test In these beaker tests
the silica sol did not gel if the ratio was lt 506 - 504 The optimal ratio seemed to
have been from 508 to 510
When the gelling time of the mix 510 was compared with the earlier result the gelling
time in the second test was 15 min more (79 min) than in the first test (65 min) The
gelling time is an important part of accurate design and grouting Because of the
significant difference in gelling times it was decided to study briefly whether there
would be any potential differences in a) using fresh accelator from the container intact
and option b) aged accelerator from the container been in use earlier The mixing ratio
was set to be 517 The point was to ensure that the accelerator that was to be used for
the grouting test was not defected by aging A small difference was observed (3 min in
gelling time) and the fresh accelerator was quicker It was decided to make the
additional tests with both accelerators just before the grouting test to be more confident
about the behaviour of the accelerator and the suitable mixing ratio
The accelerator from both drums (the difference being in the dates the drums were
opened) with the different mixing ratios was subjected to the additional tests The
colour of the accelerator in the newly opened drum (opened on the previous day) had
turned dark gray overnight The colour was similar to the accelerator in the earlier
opened drum The inner surface of the container looked rusty as well
52
Unexpectedly these tests indicated that the accelerator from the barrel opened earlier
was more effective The only accurate gelling time was from the measurement with
ratio 508 where the accelerator reacted even 2 h faster (2 h 44 min vs 4 h 47 min)
The mixes with ratios 510 gelled in less than 1 h 53 min The results with the aged
accelerator were more in line with the previous test results and it was decided to use that
in the grouting test On the basis of the results the mixing ratio 509 was chosen with an
aim of 2 h gelling time
The grouting design was done with the following assumptions the fracture aperture was
15 microm the grouting pressure was 25 MPa and the gelling time was 2 h The penetration
distance of 16 m was targeted
All four holes were to be grouted The task to fill the holes after mixing the silica mass
(t = 0 which initiated the time available for grouting) was started with a newly
constructed filling device (Figure 4-9) That was used to remove the water from the
grouting hole and the hole was filled with the silica mix The filling proceeded as the
filling hose was inserted through the duct in the packer to the bottom of the hole The
holes were filled one by one There was a short delay because of the grout mix shortage
and a new batch had to be mixed Thats why the start of the grouting was postponed
In the beginning the grouting pressure was raised to the target value (the designed
pressure) about 25 MPa No mass flow was detected in the flow meter Then the
pressure was raised to the values 38 - 42 MPa and eventually to 46 - 47 MPa Due to
the measuring accuracy (00 dm3min) the flow meter did not show any grout flow but
the pistons in the pumps were moving and it was concluded that the flow occured
During the whole grouting three holes (PR2 PR3 and PR5) took in grout each of those
took about 1 l and the total grout intake was 3 - 4 l The grouting was stopped after 86
min counted from the first mixing The sample from the first batch had already started
to gel Out of the total duration 42 min was used for filling the holes and 44 min for the
grouting During the grouting the pressures close to the grouting holes were quite
similar with the gauge readings at the grouting equipment
When comparing the water leakage results (PR2dry PR3125 mlmin PR430 mlmin
and PR5100 mlmin) conducted in the holes before the grouting and the silica intake
during the grouting it can be concluded that the results are not unambiguous
In the beaker including silica from the first batch from the agitator the mix gelled in 1 h
33 min The corresponding sample taken from the end of the hose remained fluid The
gelling times with constants mix ratios differed from the test to another The target
gelling time of 2 hours was not reached in this test
The grouting was considered successful since the grout intake was 3 - 4 l more than the
total volume of the grouting holes and the test continued with controlling of the result
and cleaning of the holes
53
Figure 4-9 The filling device to replace the hole water with silica
Some leakages (1 - 190 mlmin) were observed in five control holes Unexpectedly the
highest leakage was in PR8 and the next highest in PR6-7 These control holes were the
closest to the grouting holes The only measurable water loss was in the drill hole PR8
(50 mlmin under 03 MPa)
The holes PR2 and PR3 were cleaned by removing silica mass using a steel brush A
drill rig was employed for the job Before cleaning the packers were removed from the
holes The packer was removed from one hole and the silica mass in liquid form was
found inside the packer after six days even though the gelling times observed in cups
were about 15 - 2 h Removal of the packers after two weeks setting time resulted in
the out flow of unhardened silica from the holes (see Figure 4-10) A sample was
collected from the surface into a plastic bag and it started to gel within a few hours
Anyhow the cleaning trial was done as follows A steel brush was attached with the rod
(Figure 4-10) As planned brushing was started without flushing (air or water) in the
drill hole PR2 The drill rod and the couplings became hot and decoupling failed Later
the coupling between the brush and the rod had loosened during the previous activity
when trying to open the coupling between the rods Eventually the hole was washed
with the water hose Silica residual was observed on the hole wall (PR2) after brushing
and spooling The trial in this hole failed to remove all the liquid silica In the hole PR3
instead of brushing the drill rod with an old drill bit was inserted into the hole and air
flushing followed by water flushing was used Liquid silica spurted from the hole quite
soon
54
Figure 4-10 The grouting hole PR2 was cleaned with a steel brush coupled into the
drill rod The silica came out and ran along the tunnel wall
Concluding remarks about the pilot test with the colloidal silica
Plenty of first hand practical experiences were obtained
Water pumps and water flow gauges used in conventional way to determine water
loss were not suitable in these rock conditions with quite a poor conductivity
Results cannot be considered reliable and to draw any conclusions on the effect of
grouting is difficult
Also small grout flow was nearly impossible to observe due to too poor measuring
accuracy of the grouting equipment (00 dm3min) and
The reading accuracy of the flow meters should be 001 dm3lmin
Plenty of experiences were obtained in regards to the silica mass and its behaviour and
about grouting activity Salt-accelerator should be stored in a drum made of material
that does not corrode There was substantial variation in the effectiveness of accelerator
depending partially on the time the drum had been open Additionally the substance
originating from the drum material which made the accelerator turn dark may have an
effect on the reaction between accelerator and silica Homogenous and correctly packed
and stored components would probably give more consistent gelling times The correct
mixing ratio is very essential and the volumes of both components should be dosed
carefully Gelling times were difficult to measure exactly with the beaker method
55
especially when the amount of accelerator was small The gelling time should be
defined more exactly and so that there is a method to observe it Mixing ratios with
accelerator less than 04 - 06 units (per 5 units of silica) will not result in gelling which
means that long (over ~15 h) gelling times cannot be applied
The first trial had to be discontinued before the holes were full because the small
apertures and short gelling time resulted in a slow flow rate that was not measurable
with the equipment in use In the second trial a separate filling device was used to fill
the holes with silica prior to grouting That saved time for the actual grouting and that is
a practice recommended at least in the case of tight fractures The filling of three holes
took about 3 x 5 minutes (+ time required for dosing and mixing) and this time
consumes the effective grouting time available Several holes can be filled
simultaneously
The time required for the filling of holes should be taken into account when designing
the grouting with colloidal silica The gelling time should be long enough to allow both
the filling of holes and the actual grouting phase before gelling takes place Detailed
planning of the work phases is important and the work phases should be performed
without significant delays
Long gelling times are not always suitable but in some cases they are preferable
because eg unexpected delays do not cause that significant error in design (open time
shorter than expected in the design) In principle very short gelling times are possible
with colloidal silica but each working stage requires a certain time The work stages
should be taken into account already in the design The inaccuracy in gelling time
particularly by using long gelling times caused by a disturbance (dirty equipment
inexact dosage etc) however can be worse with respect to stop criteria than by short
gelling times Because mass intake can be high in large fractures the gelling times
should be short and that can be difficult to control technically The use of colloidal
silica in larger fractures under high groundwater pressures seems also a little bit
challenging how to get colloidal silica to gel subjected to strong water flows
Silica (at least in a liquid form) cannot be totally removed from holes with brushing and
flushing The steel brush should be welded to the rod if brushing is desired It is
difficult to insert the rod into a hole without direction marks behind the boom Should
monitoring of silica in holes andor cleanliness of holes be considered necessary the
working practices should be developed further
56
57
5 OPTIMISATION OF GROUTING FOR ONKALO 51 Objectives for grouting
The design requirements of the water inflow set for ONKALO are in place to prevent
the disturbances foreseen as described earlier (Chapter 2) Those requirements are
presumed to be met by taking the measures below
ONKALO shall not be built close to heavily water conductive rock or drill holes
Seawater should not intrude into the repository host rock and groundwater table
should not be drawn significantly below sea level
Surface waters should not migrate towards the disposal level
Significant upconing of deep saline groundwater should not take place
ONKALO should not create significant permanent hydraulic connections
Inflow rate of groundwater should be as low as possible and
Seawater should not intrude into the repository host rock
The principals above will result in a respect distance to major water conductive zones
and to investigation holes Furthermore the maximum limit values for the groundwater
inflow have been determined The allowable flow rate is lt140 lmin The latter values
were set by interpreting the ldquoinflow rate of groundwater as low as possiblerdquo to be about
1 - 2 lmin100 m At the time the construction started this inflow was generally
considered the lowest achievable inflow rate
As the understanding has enhanced the interaction between alkalis released from
cements and bentonite as a part of Engineering Barrier System (EBS) and backfill
material in the repository has been raised to be one key issue The phenomena are not
fully understood and absolutely right limit values eg for the use of cement cannot be
given Even though exact values are not possible to determine with models the
guidelines for the use of cement are given grouts below the RH20 structure should be
of low pH (eg the pH in the leachant lt 11) and the amount of cementitious materials
should be minimised The practices to fulfil the latter include limiting the grout take
using as thick grouts as possible and directing the grouting holes inside the tunnel
profile
The design requirements set for the total inflow and the local inflow rates were not
changed due to the R20 programme
52 The expected hydrological conditions from the grouting point of view
The expected hydrological conditions below the depth of -300 m were determined for
grouting design purposes The main aim was to foreseen the conditions that are likely to
prevail for grouting in the future
The data processing and its results are reported fully by Vaittinen et al (2007)
58
521 Collection and selecting of data and data processing
Because the rock volumes about 20 m x 20 m x 20 m are of interest from the grouting
point of view the below presented approach is not connected to any current bedrock
model or hydrological model The design solutions are aimed to be free from any
particular tunnel layout or geological or hydrological model since those may change
and thus the grouting design solutions would become invalid
The criteria for fracture zones in the data processing were the same as in the bedrock
model 20031 (Vaittinen et al 2003) (Table 5-1) This study however is not related in
any other respect to that version of the model The same approach which was used in
that bedrock model that took into account both the hydraulic properties of fractures and
the rock fracturing was selected for the data processing as well The criteria used
comply with the Finnish Engineering Geological Classification system (Gardemeister et
al 1976) and it is complemented with other elements The data used here was the one
available from the deep drill holes (OL-KR-holes) by February 2007
The description of hydrogeological conditions is based on the properties of
hydraulically conductive fractures ie transmissive fractures at the depth range of -300
- -600 m see Figure 5-1 The lowest measured transmissivity is 1110-10
m2s but due
to the measuring method the transmissivity values below 110-9
m2s cannot be
systematically measured The properties are processed statistically and the probable
occurrence density in horizontal tunnels was assessed The combined length of the drill
holes down to the levels between -300 m and -600 m is about 5630 m The
transmissivity of the fractures is measured with the Posiva Flow Logging Device
(Oumlhberg amp Rouhiainen 2000)
Table 5-1 The simplified description of the criteria of fracture zones used in the data
processing (same as in Vaittinen et al 2003) The rest of the rock is treated as
averagely fractured rock
PROPERTY CRITERION
Fracture frequency
The primary fracture frequency criterion ge 10 fractures 2 m
Intersection boundaries lt 10 fractures 2 m
Type of structure intersection
RiIII A fracture zone
RiIV-RiV Crushed zone
Hydraulic zone
Measuredcalculated K-2m 5E-7 ms
59
Figure 5-1 The transmissive fractures observed in the deep drill holes (Vaittinen et al
2007) The red box stands the depth range of -300 - -600 m and those are the
observations used here
The orientation of the transmissive fractures was detected from the drill hole samples
OL-KR1 - 5 7 - 15 19 - 20 and 22 (Hellauml et al 2004 amp 2006) The orientation for the
area represented by the drill holes OL-KR24 - 25 27 and 38 - 42 has been determined
combining flow anomalies with the conductive fractures based on core sample mapping
The processing of transmissive fractures from the original data into the form of
expected hydrological conditions in horizontal tunnels was performed in the following
steps
1 All transmissive fractures were assessed together
2 Transmissive fractures were classified by dip 0 - 30deg 30 - 60deg and 60 - 90deg
3 Order of magnitude correction coefficient was approximated for biased fracture
observations The coefficient was based on the ONKALO fracture mapping data
4 Transmissive fractures were classified by hydraulic aperture below 0020 mm
0020 - 0050 mm and above 0050 mm
5 Transmissive fractures were classified either to occur as a distinct fracture in the
averagely fractured rock or to belong to a fractured zone (criteria as in Vaittinen et
al 2003)
6 In order to evaluate the distance between the transmissive fractures in tunnels the
observations (oriented transmissive fractures) made in drill holes were projected to
the horizontal plane
7 Distinct transmissive fractures were classified by dip as in the stage 2) and by
hydraulic aperture as in the stage 4) and
8 Transmissive fractures in fractured zones (criteria as in Vaittinen et al 2003) were
assessed zone by zone
60
The dip and the hydraulic aperture were selected as a basis for the classification of the
data since they are the key properties from the point of view of groutability The
aperture affects on the penetration ability and the penetration length of a grout mix The
fracture angle in terms of dip is an important factor when determining the penetration
length required Perpendicular penetration length from the tunnel surface is important
due to eg rock bolts and fracture dip affects on this
Based on general understanding about grouting the hydraulic apertures are divided into
the classes less than 0020 mm 0021 - 0050 mm and more than 0050 mm due to the
following reasons the grouting of fractures with an aperture of lt0020 mm is probable
impossible with cementitious grouts and the need for grouting of these fractures is
questionable The grouting of fractures with a hydraulic aperture of 0021 - 0050 mm is
probably needed although it might be difficult with cementitious grouts Colloidal
silica is generally considered more capable to penetrate into the fractures of this size
The fractures with a hydraulic aperture of gt 0050 mm shall be grouted and
cementitious grouts are considered applicable to seal these kind of fractures partly or
fully
The statistics of all fractures and the full data processing is presented by Vaittinen et al
(2007) As an outcome only the data of interest from the point of view of grouting is
presented below
522 Statistics
To characterize the hydrogeological properties expected in the bedrock for grouting
purpose the transmissive fractures were classified either into the averagely fractured
rock or into the fractured zones (criteria presented in Table 5-1) The total hole length
studied was 5630 m Out of this 420 m (75) belonged to the fractured zones
Applying this classification the mean transmissivity is almost two decades higher in the
fractured zones than in the average rock see Table 5-2 and Figure 5-2
The transmissive fractures were divided further on the basis of the hydraulic aperture to
three sub-groups bhydr lt 0020 mm 0021 gt bhydr gt 0050 mm and bhydr gt 0050 mm
(Table 5-2) The distribution of the observations clearly differs between the average
rock and the fractured zones In the average rock 62 of the transmissive fractures have
the hydraulic aperture less than 0020 mm whereas the transmissive fractures with the
hydraulic aperture greater than 0050 mm is the largest group 44 in the fractured
zones (Vaittinen et al 2007) The analysis indicates that the proportion of fractures with
the hydraulic aperture larger than 0050 mm dipping towards the south-west within the
average rock is quite high and proportion of gently dipping fractures with the hydraulic
aperture less than 0020 mm within the fractured zones is low The transmissive
fractures with the hydraulic apertures greater than 0050 mm have mostly gently dipping
orientations
61
Table 5-2 The statistics of the observed transmissive fractures within the averagely
fractured rock and within the fractured zones transmissivity (T m2s) and spacing (S
m) (Vaittinen et al 2007)
T mean m2s
(count)
T
Median
m2s
T St
Dev
m2s
S Mean
m
(Nr of
observations)
S
Median
m
S St
Dev
m
Average rock 26middot10-8
(184) 27middot10-9
83middot10-8
223 (149) 92 323
bhydr lt 002 mm 14middot10-9
(114) 11middot10-9
11middot10-9
249 (85) 114 342
002 gtbhydgt 005 mm 18middot10-8
(56) 13middot10-8
16middot10-8
425 (35) 226 507
bhydr gt 005 mm 26middot10-7
(14) 21middot10-7
18middot10-7
373 (6) 30 580
Fractured zone 16middot10-6
(126) 39middot10-8
47middot10-6
13 (71) 08 16
bhydr lt 002 mm 18middot10-9
(32) 19middot10-9
12middot10-9
08 (21) 07 09
002 gtbhydrgt 005 mm 23middot10-8
(38) 19middot10-8
17middot10-8
13 (23) 07 16
bhydr gt 005 mm 36middot10-6
(56) 47middot10-7
66middot10-6
18 (27) 11 20
0
10
20
30
40
50
60
70
80
90
100
0000 0050 0100 0150 0200 0250 0300 0350 0400
Hydraulic aperture mm
Culu
lativ
e fre
quency
Average rock Zones
Figure 5-2 The cumulative frequencies of the hydraulic apertures within the averagely
fractured rock and within the fractured zones
62
523 Expected transmissive fractures within averagely fractured rock in the
tunnels
The occurrence of the transmissive fractures expected in the tunnels classified
according to the dip and the hydraulic aperture is presented in Table 5-3 The number
of observations with the hydraulic apertures larger than 0050 mm is so low that the
results are only indicative The statistics of spacing and the orientation of the expected
fractures (corrected orientation and occurrence) within the averagely fractured rock are
given in Figure 5-3
524 Expected transmissive fractures within fractured zones in the tunnels
The statistical analysis of the fractured and hydraulic structures based on the bedrock model version 20031 has been done in 2004 (Hellauml et al 2004) Vaittinen et al (2007) further treated this data and defined eight data sets Each of these data sets was used to generate several realizations (Hellauml et al 2004) of the structures
Based on the mean number of the intersections it was estimated that the tunnel would intersect approximately 20 fractured or crushed zones along 3000 m of the tunnel below the level of -300 m Order of magnitude frequency for these structures would be one structure per 150 m After the criteria applied for the fractured zones (Table 5-1) they may contain no transmissive fractures
The histograms of the transmissivity and the corresponding hydraulic aperture and the dip direction and the dip are shown in Figure 5-4 Compared to the fractures in the averagely fractured rock the transmissivity is clearly higher within the fractured zones The orientation histograms are quite similar with the other data sets Vaittinen et al (2007)
The illustrations of the fracture sets expected are presented in Figures 5-5 and 5-6
Table 5-3 The determined spacing of the classified transmissive fractures within the
averagely fractured rock
Hydraulic apertureDip
Dip lt 30 dgr Dip 31 - 60 dgr Dip gt 60 dgr
bhydr =lt 0020 mm 112 m (30) 146 m (23) 146 m (23)
0020 gt bhydr gt 0050 mm 372 m (9) 239 m (14) 419 m (8)
bhydr =gt 0050 mm 1117 m (3) 3350 m (1) 1117 m (3)
0
38
48
22
6
0 0
0
33
75
95 100 100 100
0
5
10
15
20
25
30
35
40
45
50
1E-10 1E-09 1E-08 1E-07 1E-06 1E-05 1E-04
Fracture T m2s
Fre
quency
0
20
40
60
80
100
120
97
47 47
4
8 14
55
96 100
0
5
10
15
20
25
30
35
40
45
50
01 1 10 100 1000
Spacing m
Fre
quency
0
20
40
60
80
100
120
26
47
2219
23
64
83
100
0
5
10
15
20
25
30
35
40
45
50
90 180 270 360
Dip direction
Fre
quency
0
20
40
60
80
100
120
42
38
34
37
70
100
0
5
10
15
20
25
30
35
40
45
50
30 60 90
DipF
requency
0
20
40
60
80
100
120
Figure 5-3 The histograms of the transmissivity the spacing the dip direction and the dip of the transmissive fractures with the
corrected proportion of gently moderately and steeply dipping fractures within the averagely fractured rock
63
0
11
3234
28
14
7
0
9
34
61
83
94 100
0
5
10
15
20
25
30
35
40
1E-10 1E-09 1E-08 1E-07 1E-06 1E-05 1E-04
Fracture T m2s
Fre
quency
0
20
40
60
80
100
120
22
46
26 25
18
57
79
100
0
10
20
30
40
50
60
90 180 270 360
Dip direction
Fre
quency
0
20
40
60
80
100
120
52
46
2144
82
100
0
10
20
30
40
50
60
30 60 90
Dip
Fre
quency
0
20
40
60
80
100
120
Figure 5-4 The frequency of the water conductive fractures within the fracture or crushed zones in terms of the transmissivity and the
histograms of the dip direction and the dip for the fractures within the fracture zones
64
65
Figure 5-5 Examples of water conductive 2- and 3-fracture systems observed in the
deep rock in Olkiluoto
Figure 5-6 Examples of water conductive complicated systems with multiple fractures
observed in the deep rock in Olkiluoto
The information above has been used when selecting the fracture systems studied in the
feasibility study of grouting design solutions (Section 53) The data will be useful also
when preparing for the future groutings beforehand
53 Feasibility of the design solutions
The theoretical study was carried out by Lokkila (2008) in order to assess the feasibility
of the design solutions
The aim was to start with ideal design solution focusing the grouting in places
determined based on the rules for local leakages the grouting with low pH grouts
66
minimising the grout to remain in the rock by having the grouting holes inside the
tunnel profile and limiting the grout take The study concentrated in fracturing
conditions determined by Vaittinen et al (2007) (Section 52) The work was iterating
until the design solution was found If it was not found the alternative design solutions
were suggested This work can be utilized for actual grouting design in the future by
giving general operating limits eg for grouting pressures grouting patterns etc
531 Optimal design solution
The optimal grouting design solution includes the following components
Use of low pH grouts
Grouting holes inside the tunnel profiles (Figure 5-7) and
Controlled grout penetration (3 - 20 m)
This design solution was studied by using the Grouting Time -method (the same
analytical approach as used in time stop grouting) in the study carried out by Lokkila
(2008)
The target was to find the most optimal design solution for different fracture-tunnel
systems However the practical point was kept in mind all the time eg the grouting
pressures were aimed to be low enough
Figure 5-7 A tunnel in rock showing the principle of a pre-grouting fan where the
grouting holes are inside the tunnel profile The grouting holes inside the tunnel profile
diminish the amount of the stray materials in the rock
67
532 Calculation system and studied cases
The study proceeded as presented in Figure 5-8 and the aim of systematic approach was
to
Identify the cases that can be handled with typical design solutions and find feasible
design solutions and
Identify the cases that cannot be handled with typical design solutions
The calculations were made for 1D and 2D cases The 1D case means the flow in a
canal (fast flow) the 2D means radial flow (slower flow) The 2D flow was selected due
to conservativeness of the study It is hard to detect which kind of flow occurs in the
fracture for real The 3D flow is also possible especially in complicated fracture zones
like RH19 and RH20 but it was ruled out in this study since there are no practical
calculation tools available yet
The cases were first determined on the basis of hydrological conditions at the Olkiluoto
site and one additional component ndashtunnel direction ndash was added (Table 5-4) In order
to limit the number of the cases in the study the tunnel directions 000 045 090 and 135
degrees and the dip directions 00000 00015 00030 00045 00060 00075 and
00090 degrees were selected The cases were numbered for identification
In the very beginning it turned out that the range -270 - -520 m has to be divided into
Two parts and the fracture group 50 - 400 microm has to be split into several
parts
Figure 5-8 The study flow chart (Lokkila 2008)
Basic design solution feasible
5-10 optimal solutions for pressure and
time space grouting fan and mass mixes
Succeeded
OK
Succeeded
Other designsolution
Define suitable design
areas for special cases
Special grouting cases
inc pre-injection
R20- structure
shafts
Not Succeeded
Variations
1 Varying mass recipes
2 Changing minimum penetration of grout maximum volume injected
3 Changing fans to outside of the profile
Not succeeded
Starting values
Grouting pressure minimum and maximum penetration length and minimum aperture
About 2-3 basic masses with different properties
Fans to inside of the profile (distance 1m) bevare of the backflow
Basic design solution feasible
5-10 optimal solutions for pressure and
time space grouting fan and mass mixes
Succeeded
OK
Succeeded
Other designsolution
Define suitable design
areas for special cases
Special grouting cases
inc pre-injection
R20- structure
shafts
Not Succeeded
Variations
1 Varying mass recipes
2 Changing minimum penetration of grout maximum volume injected
3 Changing fans to outside of the profile
Not succeeded
Starting values
Grouting pressure minimum and maximum penetration length and minimum aperture
About 2-3 basic masses with different properties
Fans to inside of the profile (distance 1m) bevare of the backflow
68
69
Table 5-4 The fracture-tunnel systems studied (Lokkila 2008) CS = colloidal silica
Aperture bhydr (mm)Dip direction Dip 30deg (0 15 and 30) Dip 30-60deg (30 45 and 60) Dip gt 60deg (60 75 and 90)
lt0020 Restricted penetration tunnel dir vs dip dir tunnel dir vs dip dir tunnel dir vs dip dir
of any grouts 000 045 090 and 135 deg 000 045 090 and 135 deg 000 045 090 and 135 deg
0021-0050 Cement grouting tunnel dir vs dip dir tunnel dir vs dip dir tunnel dir vs dip dir
difficult unrestricted 000 045 090 and 135 deg 000 045 090 and 135 deg 000 045 090 and 135 deg
penetration of CS
assumed
0051-0400 Unrestricted penetration tunnel dir vs dip dir tunnel dir vs dip dir tunnel dir vs dip dir
of cement grouts 000 045 090 and 135 deg 000 045 090 and 135 deg 000 045 090 and 135 deg
assumed
Only case with a single fracture was calculated since the same logic can be used in
multiple fracture cases When applying optimized grouting to the multiple fracture cases
two or several grouting rounds are probably needed This is traditionally called the split
spacing technique
Some cases can be theoretically grouted using the ideal drilling fan because the grouting
holes intersect the fracture (example in Figure 5-9) Some cases turned out to be
impossible to handle with the optimal design solution because the grouting holes do not
intersect the parallel fracture (see Figure 5-8) Those cases in terms of the tunnel
direction and the fracture orientation are 000-00000 045-00000 090-00000 090-
00015 090-00030 090-00045 090-00060 090-00075 090-00090 and 135-00000
In deep rock conditions the groundwater flow pattern and pressure is practically the
same around the tunnel Only the tunnel roof is a little bit different since rock bolts are
located there In many cases the tunnel direction and the fracture orientation were
practically same ie their relative angle turned out to be the same and the calculation
and results are valid for a few occasions Those cases in terms of the tunnel direction
and the fracture orientation are 000-000015 045-00015 and 135-000015 000-
00030) 045-00030135-00030 000-00045 045-00045135-00045 000-00060
045-00060 135-00060 000-00075 045-00075 135-00075 000-00090 045-00090
and 135-00090
70
a) b)
Figure 5-9 Illustrations of fractures that a) can be handled with symmetrical drilling
pattern and b) requires a modified drilling pattern (Lokkila 2008)
533 Starting values
There are six different types of low pH grouts available (Ranta-Korpi et al (2007)
Appendices 1 amp 2) grout 1 (G1) = UF-41-10-3 grout 2 (G2) = UF-41-10-4 grout 3
(G3) = UF-41-12-3 grout 4 (G4) = UF-41-14-3 grout 5 (G5) = UF 41-12-4 and grout 6
(G6) = UF-41-14-4 see Table 5-5 The values measured at 0 min were used in the
calculations
In order to control the grout take the thickest grout (the highest yield value) was
preferred Groundwater pressure increases with depth about 1 MPa per 100 m The
depths used in the study were 270 400 and 520 meters and the groundwater pressures
were 27 MPa 40 MPa and 52 MPa respectively
Because the fracture orientation cannot be observed but the penetration length aimed at
should be determined the perpendicular distance from the tunnel wall was used as a
penetration length instead of the actual penetration length The perpendicular
penetration length is limited between 3 and 20 meters The lowest value is the most
important one because that confirms that grouting seals well The upper limit is used
due the need to limit the grout take
Even though the long pumping time is not desired the maximum pumping time may be
up to 2 hours with the cement-based grouts The gelling time for a silica grout is
determined in advance by changing the silicaaccelerator ratio
The maximum pressure capacity of Posivarsquos grouting pumps is 20 MPa Theoretically
in the depth range -270 - -520 the grouting overpressure can vary between
148 - 173 MPa In the feasibility study the maximum grouting overpressure was
selected to be 15 MPa at most (with the prevailing water pressure of ~5 MPa) The
minimum grouting pressure must be higher than the groundwater pressure The
maximum grouting pressure was calculated with formula by Gustafson (2005)
71
The risk for the backflow was considered as well In practice the risk for the backflow
is not imminent because the grout has set to a certain extent before the removal of the
packers
534 Calculation process
The calculation was made in stages (Lokkila 2008) as briefly described below in Table
5-6
535 Summary of the results
The calculation results are summarised in Tables 5-7 and 5-8 The whole calculation
process and the results are described by Lokkila (2008)
It can be seen from the results that between the depth range of -270 - -400 m the optimal
design solution ie the use of the low pH grouts the predetermined grout take and the
grouting holes inside the tunnel profile is supported by the theory in the hydraulic
apertures of 100 microm In the smaller apertures there is a risk that the grout penetration
length as targeted is not obtained within the reasonable time frame and the alternative
design solutions should be considered if the water leakages are the priority criteria of
the acceptance The problems may occur mainly in the fractures nearly parallel to the
tunnel as the grout has to penetrate very long way to reach the perpendicular distance
required The alternative design solutions are eg the use of the thinner grouts (the
colloidal silica or the thinner cementitious grouts) the addition in the grouting pressures
andor to direct the grouting holes outside the tunnel profile In the depth range of -400 -
-520 m the aperture limit for the feasibility of the optimal design solution is at around
200 microm
Together with the expected rock conditions from the grouting point of view the results
indicate that for the most of the cases alternative solutions rather than the optimal
design solution shall apply
Table 5-5 The grout mixes and their properties used in the feasibility study (modified from Ranta-Korpi et al 2007)
Mix The nr of samples Marsh fresh [s] Marsh 05h [s] Marsh 1h [s] Plast Visc fresh
[mPas]
Plast Visc 30min
[mPas]
Plast Visc 60min
[mPas]
Yield value fresh
[Nm2]
Yield value 30 min
[Nm2]
Yield value 60min
[Nm2]
UF-41-14-4 25 41 41 41 104 166 174 84 93 94
UF-41-14-3 3 54 53 52 220 161
UF-41-12-3 5 114 113 113 366 567 497 312 283 271
UF-41-12-4 4 56 51 49 154 252 263 156 155 163
UF41-10-3 1 612 1087 492 563
UF-41_10-4 4 131 123 95 279 342 366 250
UF-15-10-28 4 39 41 38
UF-41-10-48 1 52 46 47 111 196 213 145 133 143
UF-41-12-36 3+1 61 62 66 272 334 420 199 220 236
UF-41-12-48 10 42 41 41 131 141 162 93 83 90
UF-41-14-48 6 36 36 36 80 100 105 52 48 47
UF-41-08-47 1 130 96 101
UF-41-12-51 1 42
UF-41-14-51 3 37
Mix Filter Pump fresh
100 microm [ml]
Filter Pump (100
microm) 05 h [ml]
Filter Pump
(100microm) 1 h [ml]
b min [microm] b crit [microm] Fall cone 05
kPa [min]
Fall cone 2 h [Kpa] Fall cone 6 h
[Kpa]
Fall Cone 24 h
[Kpa]
UF-41-14-4 310 326 305 34 117 426 10 853
UF-41-14-3 333 337 360 38 85 340 09
UF-41-12-3 275 293 225 47 126 330 11
UF-41-12-4 323 330 290 39 81 345 23
UF41-10-3 130 100 120 106
UF-41_10-4 267 255 140 120 35
UF-15-10-28 278 240 62 192 380 05
UF-41-10-48 340 295 280
UF-41-12-36 290 260 230 32 93 12
UF-41-12-48 332 335 345 19 158 03
UF-41-14-48 303 282 330 30 90 06
UF-41-08-47 300 310 300 64
UF-41-12-51 300 08
UF-41-14-51 325 26 86 05
Filter pump 100 microm sieve Penetrability meter Fall cone
Marsh cone Rheometry measurements
72
73
Table 5-6 The calculation process in the feasibility study The solution refers to the
ideal design solution solved means that the design was analytically solved (Lokkila
2008)
STAGE DESCRIPTION SOLUTION
1 Apertures 50 - 400 microm divided into smaller groups testing with UF-41-14-4 (thinnest) and calculating with UF-41-10-3 (thickest grout)
Apertures down to 200 microm solved fracture dips 15 and 90 turned out to be significant Apertures 50 - 200 microm not solved even with the thinnest grout
2 Apertures 100 - 200 microm calculated with UF-41-10-4 apertures 50 - 100 microm studied
Solution found in group 100 - 200 microm but the grouting overpressures are relatively high Group 50-100 microm not solved
3 Apertures 100 - 200 microm recalculated with UF-41-12-3
Solution found but the grouting overpressures are relatively high
4 Apertures 100 - 200 microm recalculated with UF-41-14-3
Solution found theoretically backflow a little risk and extension of upper limit of penetration length was required
5 Aperture 50 - 200 mm studied with UF-41-12-4
Solutions found drawbacks with backflow and thus extended upper limit of penetration length in group 100 - 200 microm and relatively high grouting pressure in group 50 - 100 microm
6 Aperture 100 microm with UF-41-14-4 (50 microm already tested in Step 1)
Range 50 - 100 microm drawbacks with backflow and thus extended upper limit of penetration length and relatively high grouting pressure in deep rock
7 Aperture 300 - 400 microm recalculated with UF-41-10-4
Solution found theoretically backflow a little risk and required extension of upper limit of penetration length
8 Aperture 200 - 300 microm recalculated with UF-41-10-4
Solution found theoretically backflow a little risk in deep rock and required extension of upper limit of penetration length
9 Summary of the results of the calculations
74
Table 5-7 The results with the cement-based grouts at the depth of -270 - -400 meters
(Lokkila 2008)
B-hydr (mm) Depth 270-400 (m) Comments on design solution Comments
03-04 UF-41-10-3 (mix 1) Solution supported by theory
∆p 43-134 (MPa) (thicker mix better)
I 3-20 (m)
UF-41-10-4 (mix 2) Solution supported by theory Poorer solution risk of
∆p 43-134 (MPa) harmful far penetration
I 3-20 (m)
02-03 UF-41-10-3 (mix 1) Relatively high overpressure Problems in 0200 mm
∆p 64-134 (MPa) with fractures nearly
I 3-20 (m) parallel to the tunnel
UF-41-10-4 (mix 2) Solution supported by theory
∆p 46-134 (MPa)
I 3-20 (m)
B-hydr (mm) Depth 270-400 (m) Comments on design solution Comments
01-02 UF-41-10-3 (mix 1) Solution not supported by theory Problems in 0100 mm
with fractures nearly
parallel to the tunnel
UF-41-10-4 (mix 2) High overpressure Grouting holes Same as above
∆p 98-134 (MPa) outside of the tunnel profile or taking a
I 3-20 (m) risk of remaining leakages in fractures
nearly parallel to the tunnel
UF-41-12-3 (mix 3)
∆p 9-134 (MPa) Same as above Same as above
I 3-20 (m)
UF-41-14-3 (mix 4) Solution supported by theory Risk of harmful
∆p 53-134 (MPa) Relatively high overpressure far penetration
I 3-249 (m)
UF-41-12-4 (mix 5) Solution supported by theory Risk of harmful
∆p 49-134 (MPa) Possible backflow difficult in upper limit far penetration
I 3-257 (m)
005-01 UF-41-12-4 (mix 5) High overpressure Grouting holes Problems in 0050 mm
∆p 103-134 (MPa) outside of the tunnel profile or taking a with fractures nearly
I 3-20 (m) risk of remaining leakages in fractures parallel to the tunnel
nearly parallel to the tunnel
UF-41-14-4 (mix 6)
∆p 63-134 (MPa) Relatively high overpressure grouting Same as above
I 3-239 (m) holes outside of the tunnel profile or
thinner mix or silica grouting
0021-005 UF-41-14-4 (mix 6) Solution not supported by theory Problems in 0021 mm
Grouting holes outside of the tunnel with fractures nearly
profile or thinner mix or silica grouting parallel to the tunnel
∆p = grouting overpressure
I = perpendicular penetration length
75
Table 5-8The results with the cement-based grouts at the depth of -400 - -520 meters
(Lokkila 2008)
B-hydr (mm) Depth 400-520 (m) Comments on design solution Comments
03-04 UF-41-10-3 (mix 1) Solution supported by theory
∆p 58-15 (MPa) Relatively high overpressure
I 32-212 (m)
UF-41-10-4 (mix 2) Poorer solution risk of Problems in 0400 mm
∆p 57-15 (MPa) harmful far penetration with fractures nearly
I 42-285 (m) perpendicular to the tunnel
02-03 UF-41-10-3 (mix 1) Solution supported by theory Problems in 0200 mm
∆p 64-15 (MPa) Relatively high overpressure with fractures nearly
I 3-20 (m) parallel to the tunnel
UF-41-10-4 (mix 2) Solution supported by theory
∆p 57-15 (MPa) Relatively high overpressure
I 3-214 (m)
B-hydr (mm) Depth 400-520 (m) Comments on design solution Comments
01-02 UF-41-10-3 (mix 1) Solution not supported by theory Problems in 0100 mm
∆p 144-15 (MPa) Grouting holes outside of the tunnel with fractures nearly
I 3-20 (m) profile parallel to the tunnel
UF-41-10-4 (mix 2) High overpressure Grouting holes Same as above
∆p 98-15 (MPa) outside of the tunnel profile or taking a
I 3-20 (m) risk of remaining leakages in fractures
nearly parallel to the tunnel
UF-41-12-3 (mix 3)
∆p 9-15 (MPa) Same as above Same as above
I 3-20 (m)
UF-41-14-3 (mix 4) Relatively high overpressure
∆p 73-15 (MPa) Grouting holes outside of the tunnel
I 32-323 (m) profile
UF-41-12-4 (mix 5) Relatively high overpressure or
∆p 67-15 (MPa) thinner mix (backflow)
I 33-334 (m)
005-01 UF-41-12-4 (mix 5) High overpressure grouting holes Problems in 0050 mm
∆p 103-15 (MPa) outside of the tunnel profile with fractures nearly
I 3-20 (m) parallel to the tunnel
UF-41-14-4 (mix 6)
∆p 92-15 (MPa) Relatively high overpressure grouting
I 31-31 (m) holes outside of the tunnel profile or
thinner mix or silica grouting
0021-005 UF-41-14-4 (mix 6) Solution not supported by theory Problems in 0021 mm
Grouting holes outside of the tunnel with fractures nearly
profile or thinner mix or silica grouting parallel to the tunnel
∆p = grouting overpressure
I = perpendicular penetration length
76
536 Additional comments on the grouting of special cases etc
Grouting of the leaking fractures intersecting the tunnel
Post-grouting the grouting of fractures parallel to the tunnel (including all dips between
0 - 90 degrees) and the unsuccessful placement of a grouting fan (too close when a
diagonal fracture is intersected by a tunnel) are conceptually same situations
According to Fransson amp Gustafson (2007) practices for post-grouting have not been
commonly established They have studied post-groutings by analysing the data from the
Aumlspouml rock laboratory Hallandsarings and Toumlrnskog tunnels in Sweden There are very few
experiences in the deep rock Besides the grouting holes have to intersect the fractures
the fan geometry has to be designed taking into account the high pressure gradient
towards to the tunnel This may cause the erosion of grout and the limitations for the
penetration length The deeper the tunnel the greater is the importance of this point The
possibility of jacking should be taken into account and high grouting pressures are not
desired when post-grouting Fransson amp Gustafson (2007) have presented the
theoretical guidelines for designing of post-groutings
Figure 5-10 Illustration of the tendency of grout to flow back to the tunnel under a high
pressure gradient
77
Grouting of major hydrogeological structures compared to small fractures
The nature of major hydrogeological structures differs significantly from that of small
single fractures Major zones consist of complicated fracturing with the wide range of
apertures and fractures are in connection with each other when small single fractures
are typically hard to reach for characterisation
In grouting it is essential to understand that in major hydrogeological structures all the
fractures cannot be successfully sealed at the same time if aiming at somewhat limited
grout take ndash the largest fractures take the grout until they are filled enough and the
pressure starts to rise and the grout is forced to the smaller ones
The hydraulic aperture determines the volume of a fluid in a fracture and follows the
cubic law in relation to water flow This means that as the water flow (and the
transmissivity) from a fracture is doubled the possible grout volume in a fracture will
be 8 fold If comparing the grout take with a certain penetration length in a fracture with
an inflow of 01 lmin to an other fracture with an inflow of 1 lmin the grout take is
1000 times higher in the latter one Vice versa if grouting a fracture with an inflow of
20 lmin instead of a fracture with an inflow of 150 lmin the same penetration length is
reached with 02 of the grout volume in the first mentioned fracture Extremely small
grout takes are expected in the environments of small fractures and it should be
understood that a small grout take ndash even only some litres in addition to the bore hole
volume ndash could be significant and do not necessarily mean grouting in vain
54 Start and stop criteria to be applied 541 Start criteria
When selecting the grouting start criteria for a site one should take into account the
target of the total water inflow and the local leakages the priorities set for the grouting
and the characterisation methods available In the case of ONKALO the targets for the
water inflow and grouting differs significantly from those in most of the tunnelling
projects and the related aspects should be carefully considered Figure 5-11 presents
how the targets can be processed as the start criteria and which are the foreseen
drawbacksrisks in each case The grouting start criterion is based on the approach
where the remaining leakage low enough is prioritized to the grout take
78
Selection of the priorities and
start criteria for grouting
Priorities Priorities
1) Minimised water leakage 1) Minimised grout take and hole position
2) Grout take and hole position 2) Minimised water leakage
Conclusion Conclusion
Overdone grouting Frugal grouting
Slight indication of grouting need Reliable indication of grouting
and low trigger level need and relatively high trigger
level
Drawback Drawback
Unnecessary holes and amount Possibility of too high water leakages
of grout and need for post-grouting
Figure 5-11 A chart for the priorities conclusions and drawbacks for processing a
grouting start criteria
The following properties of a leaking fracturezone are to be observed
1 The leakage from the probe hole or a grouting hole (by measuring the out flowing
water)
2 The water take in a certain measuring section (by 1- and 2-packer water loss
measurement) and
3 The water flow from even a single fracture or a fracture zone (the Posiva flow log
measuring section alterable) ndash may need a hole with water infilling
The fracture orientation (the dip direction and the dip) cannot be detected with the
characterisation methods available However for the full optimisation it is an important
part With the help of oriented drill core samples the dip directions and the dips are
possible to obtain
The start criterioncriteria should be dependent on the fracture properties that are
available and independent on the fracture properties that cannot be observed
The measurements above may give different picture from the rock By measuring the
out flowing water and by the flow logging the real water inflow and the connections in
a larger scale can be observed but the result still represents only a very local point in a
complicated water channel network Furthermore the flow logging uses very sensible
equipment and problems with that in percussion-drilled holes have been encountered
The water loss measurement gives a better picture of the existing connections in smaller
area but does not necessary tell about a) the properties of single fractures and b) the
larger scale connections ndash or it is difficult to interpret from the results However the
measurement can be carried out systematically
79
With a limited number of probe or grouting holes we get only a coincidental hit on the
fracture network and the apertures of fractures Also the fully optimised grouting
should be dependent on the fracture orientation which cannot be observed ndash in the pilot
holes the orientations can be observed
It is suggested that the need for grouting should be based mainly on the water loss
measurement in the probe holes due to the nature of the measurement The method
tends to overestimate rather than underestimate the need for grouting Normally the
water loss measurement in ONKALO is done as 1-packer method Occasionally
2-packer method (1 m measuring section) is carried out if the water loss in a whole hole
has indicated the existence of the water conductive fractures The latter approach seems
to be practical in future The accuracy of the device should be adjusted to the prevailing
grouting start criteria Also the used overpressures should be revised closer to the
grouting overpressures when operating in deep sound rock The measurement of out
flowing water can serve as a complementary method to evaluate the larger connections
Although the Posiva flow log is quite sensitive method it should be utilised as a
complementary and more detailed means of getting more information of the water
conductive fracturing eg the number of fractures and their proportion of the leakages
More reliable and useful results can be obtained if using systematically unbending rods
in drilling When the information of the pilot holes is available that should be taken an
advantage of as well In core drilled pilot holes the flow logging has been accurate and
that can be used even as a main characterisation method
The trigger levels based on the current local limits for the inflowing water are presented
in Table 5-9 These trigger levels are directly applicable for Posivarsquos flow logging
method The trigger levels for other characterisation methods can be calculated from
this value The trigger levels are determined in the same way nowadays but here
presented also for the deeper sections The value 50 mlmin is transformed into the
Lugeon values for the lengths of 1 m and 20 m at different depths in Figure 5-12 The
Lugeon limit for 20 m refers to the measurement of the whole probe hole and the 1 m
Lugeon limit is given for the measurement with the two-seal packer The Lugeon limit
set for 20 m measuring length should be used in order to decide whether to do the two-
seal packer test or not The results of the two-seal packer test should be used when
deciding the need for grouting and selecting the drilling pattern and the grouting
parameters The measurement itself is simple but the water flow expected is too small
for the measurements accurate and reliable enough The principle of the test seems to be
appropriate and the test should be developed further The trigger level transformed into
a form of hydraulic aperture of a single fracture is presented in Figure 5-12
80
Table 5-9 The trigger levels in use in ONKALO
Area hole Trigger level 1 Trigger level 2 Trigger level 3
Depth level between R19 and R20
Pilot holes
Single leakage
Leakage from the hole
Probe holes
Single leakage
Leakage from the hole
Other holes
Single leakage
Leakage from the hole
-
-
-
50 mlmin
-
50 mll
50 mlmin
5 lmin
50 mlmin
-
-
100 mlmin
150 mlmin-
15 lmin
-
15 lmin
-
15 lmin
Below R20
Pilot holes
Single leakage
Leakage from the hole
Probe holes
Single leakage
Leakage from the hole
Other holes
Single leakage
Leakage from the hole
-
-
-
50 mlmin
-
50 mll
50 mlmin
5 lmin
50 mlmin
-
-
100 mlmin
100 mlmin-
10 lmin
-
10 lmin
-
10 lmin
1) Trigger level for detailed measurements
2) Trigger level for actions to control the leakage eg pre-grouting
3) Trigger level for effective actions to control the leakages
0000
0001
0002
0003
0004
0005
0006
0007
0008
0009
0010
0011
0012
0013
0014
0015
0016
0017
0018
0019
0020
240 260 280 300 320 340 360 380 400 420 440 460 480 500 520
Depth (m)
Lu
ge
on
valu
e (
Lu
g)
Lug-20 m
Lug-1m
0
2
4
6
8
10
12
14
16
18
20
240 260 280 300 320 340 360 380 400 420 440 460 480 500 520
Depth (m)
Hydra
ulic
ap
ert
ure
(micro
m)
The trigger level 50 mlmin transformed into 1 m and 20 m
Lugeon values as a function of the depth
The trigger level 50 mlmin transformed into hydraulic aperture of
one fracture as a function of the depth
Figure 5-12 The trigger level 50 mlmin transformed into 1 m and 20 m Lugeon values and into a hydraulic aperture (one fracture) as a
function of the depth
81
82
55 Stop criteria
Originally based on a few decades work Gustafson amp Stille (2005) have presented that
the time can be used as a stop criterion in grouting This statement is based on the
analytical approach developed by Swedish Chalmers University of Technology and
Royal University of Technology in close cooperation of SKB Here this analytical
approach and the related stop criteria are also called Grouting Time ndashmethod (GT)
Both the experiences from the construction of ONKALO and the grouting field tests
made within the project revealed a challenge with grouting time -method The time as
such is an insufficient factor to guarantee the successful grouting result with all the
targets set for ONKALO because of the ambiguity of the input data (fracture
characteristics and grout properties) and the sensitiveness of the model
Even a relatively small error in eg interpretation of the fracture characteristics or the
mix properties may deteriorate the design and consequently the time cannot be used as
a stop criterion alone The aim at optimising the sealing result and the grout take will
require a way to verify during the grouting that the design will remain valid for the
prevailing fracture conditions
Therefore it is suggested that in addition to the calculation of the ideal design
parameters (the grout mix the grouting pressure and the pumping time) according to the
GT method the grout flow is included in the system The prognosis of grout take can be
easily calculated When this is linked to the time the prognosis of grout flow can be
done Since there is always a potential risk to have an excessive inaccuracy in the source
data (the hydraulic aperture the grout properties etc) the grout flow should be used to
verify that the design andor the assumptions are accurate enough
By linking all the five parameters together and monitoring the flow rate and the grouting
time we can either verify that the assumptions were correct and the design is valid (and
continue grouting as designed) or conclude that the assumptions were not correct and
the design is not valid (and abandon the design and change to another) From now on in
this document this application is called the GTF -method referring to the words
ldquoGrouting Time amp Flowrdquo However the time has to be kept with in the stop criteria
since the flow rate may be under the measuring accuracy of the grouting equipment and
the time is then the only way to control the grouting
Due to the variation in the source data and the fact that the fluctuation of the grouting
pressure is unavoidable and that has a significant effect on the flow rate the tolerances
should be wide enough not to lead to the unworkable situations too easily
Figure 5-12 presents an illustration of a predicted flow rate with the tolerances
according to which the grout flow should take place if assumptions in the design were
accurate enough
83
H=-270-320 b=51hellip100 microm
0
2
4
6
8
10
12
14
16
18
00000 01500 03000 04500 10000 11500 13000 14500 20000
Grouting time
Gro
ut
flo
w (
dm
3m
in)
Figure 5-13 An example of the predicted flow in a fracture of 51 - 100 microm located at
the depth of -270 - -320 m The yield strength of the mix is 14 plusmn4 Pa and the viscosity of
the mix is 14 plusmn6 mPas The grouting pressure is 15 MPa
84
85
6 DISCUSSION AND SYNTHESIS
61 Grouting design
The studies made within the project and the suggestions for the future are strictly based
on the current design requirements and the existing trigger levels for the controlling of
the water inflow Some of them were analysed further in the R20 programme but the
significant changes to the design requirements were no made due to the R20
programme The design requirements which originate from the long term safety of the
repository include demanding targets for the water inflow and eg the amount of the
cement That will impose challenges for the working methods the procedures and the
equipment Some design requirements are contradictory which means that the
optimisations are needed The existing targets require that very small fractures should
be sealed The major water conductive fracture zones in the access tunnel and the shafts
have to be sealed as well The high water pressures will be an additional challenge
The data of the transmissive fractures observed in the deep drill holes was studied in
order to recognize the conditions specific to the Olkiluoto site This data was then
studied with the targets for the water inflow and the grouting set for ONKALO and used
in the study of the grouting design solutions It was observed that the averagely
fractured rock differs significantly from the fractured zones in terms of transmissivity
and fracturing The fractures with the hydraulic aperture of over 50 - 100 microm are very
sparse The fractures with the significant hydraulic importance are predominantly gently
dipping
The literature study to find a suitable way to handle the stop criterion for the grouting
which is a key issue in the optimisation was performed The study revealed an
approach which has been developed in Sweden in the cooperation with SKB CTH and
KTH and that turned out to be better tool for the optimisation than the other
alternatives The theory is presented in the context of the time stop criterion and is here
also called the ldquoGrouting Timerdquo -method (the GT method) The method applied is
analytical and very simple The approach does not conform with the Finnish norms for
the grouting but it is however the only one so far that connects all the design
parameters together (the mix properties the grouting pressure the fracture
characteristics the desired penetration length and the pumping time ndash and in some cases
also the grouting hole density) As a comment on the model is that the link between the
parameters characteristic grouting time and the theoretical maximum penetration length
is not fully clear The experiences of the method are limited but the deviations from the
national norms are quite small the only new source parameter is the viscosity of the
grout and the only new parameters in the grouting design will be the use of the pumping
time (under maximum pressure) It is assumed that the method ndash and the approach to the
grouting presented ndash is in the beginning of its evolution and more developed versions
will be available in the future As an additional comment on the design parameters
practically because we are operating in the very deep and sparsely fractured rock the
grouting hole density cannot be linked to the design parameters as presented by
Gustafson amp Stille (2005) ndash the design of the grouting hole drilling pattern is more a
matter of probabilities This will be discussed more in details later
86
The penetration length of a grout is highly dependable on the hydraulic aperture of
fractures and considerably to the yield strength and the viscosity of the grout as well as
to the grouting overpressure The accurate determination of these parameters is
important and full compliance with the grouting design is essential during the grouting
work The model and some investigation methods take into account only the fractures
and the transmissivitiesapertures that are intersected by a probe or a grouting hole
There surely are additional fractures and connections that are not detected in the holes
Also the pressure fall in the fractures is one uncertainty and poorly understood One
way to take this into account is to use safety factors in the design (for the penetration
length) The safety factor to suite in all the instances cannot be established
The GT method and the Olkiluoto site data were used in the feasibility study of the
design solutions In order to reach the set targets for the grouting it was decided that the
optimal design solution that meets the target shall include the following components
The grouted areas are targeted as currently stated in the design requirements and
other ONKALO specific instructions
The use of the available low pH grouts (cementitious used in this study) and
The grouting holes inside the tunnel profile and the limited grout penetration
length in order to minimise the risks to the disturbances due to the cement
The study was done only for 1-fracture systems since the similar approach is applicable
for multi-fracture systems The 1D and 2D models were used in calculations but the 2D
was used for drawing the conclusions In certain conditions the grout flow can be
3-dimensional as probably happened in the second grouting test The only way to get
enough good picture of the dimension of the grout flow in is to analyse the
dimensionality of the flow observed in the real grouting operations That feedback could
be a basis for optimising the grouting design further
Those calculations resulted in the support of the optimal design solution by the theory
for the fracture apertures of 100 microm in the tunnel in the depth level range -270 - -400 m
Below the depth level of -400 m the fracture limit found in this project was 200 microm
Below those aperture limits the designer could consider the following divert the
grouting holes outside the tunnel profile raise the grouting pressure relatively high
(which may be compensated partially by using longer pumping times) or use even
thinner mix (colloidal silica or cementitious grout) than currently available The last
meets the set targets best The strength development of the thin mixes may be slower as
observed in eg the grouting tests On the other hand even thicker grouts are
recommended in the environment of large fractures and high groundwater pressures
However the fractures with the hydraulic aperture of more than 50 - 100 microm are very
sparse and thus the optimal design solutions can be used seldom
The field tests revealed problems in using only the grouting time as the stop criteria If
there is any uncertainty in the source data or the made assumptions the time is set in
wrong basis and that cannot be observed during the grouting The accuracy of the
available fracture and the mix properties is not enough to use the grouting time solely as
a stop criteria The grout flow should be incorporated to the system and it is
recommended that it is used as a part of the stop criteria The grout flow is simple to
87
predict via the expected grouted volume at the certain moment of time Analytical
expressions presented in the literature are available to make these predictions Because
the system is sensible to the fracture aperture and the rheological properties of the
mixes and the grouting pressure cannot be kept constant all the time the tolerances for
the grout flow should be accepted as well
The current trigger levels for the starting the means a need for the use of colloidal silica
in the deep rock There is no practical experiences to prove that very small fractures can
be sealed with cementitious grouts
Pre-grouting is proposed as a primary measure as done this far Some of the grouting
can be handled with typical designs adjusted to the site-specific conditions and that will
disrupt the tunnel drifting the least That is supposed to apply for the most of the access
tunnel The exceptions in the access tunnel might be a) the situations when a leaking
fracture or a fracture zone is parallel to the tunnel or that intersects the drift in a way
that it will lead to redirect the grout hole pattern to intersect with the fracture(s) or
b) the situation of unexpected condition that has not been prepared beforehand for
In a multi-fracture system the way to optimise the grout take is to have two or more
grouting rounds This well-known technique which is strongly recommended in multi-
fracture systems is also called as split spacing ie the wider fractures are sealed first
with thick grout and new grouting holes are then done to seal the smaller apertures with
thinner mix This is essential to understand in order a) to diminish the grout take and b)
to accelerate the strength development of the grout
The grouting of the hydrogeological structures RH19 and RH20 should be designed
separately ndash when met in the access tunnel andor the shafts since the structures have
structure specific features in the hydrogeological environment in the ONKALO area and
due to their orientation However the design principles presented in this work are more
or less applicable to all the structures with the same kind of characteristics The RH20
structure is gently dipping which will be an extra challenge in the access tunnel
The design principles in the tunnel will not apply for the shafts as such since the
grouting should be done in very long sections ndash nearly 100 m Operating too close to the
shaft cross cuts or the tunnel may impose a need to grout with lower pressures to avoid
undesired by-pass connection into the tunnel or hydraulic jacking
The post-groutings should be designed also individually Its worth to realize that when
operating close to the tunnel walls the water gradient and consequently the grout flow
is strongly towards the tunnel Practically this means that eg the post-grouting holes
shuold be taken relatively far away from the tunnel walls In the case of post-grouting
the wider the leaking fracture is the denser the grouting holes should be and the further
away from the tunnel walls they should be located
88
Briefly the grouting design in the future should include the following parts
1 Design basic data and the calculations
2 Start criteria for grouting expressed in the terms of used characterisation methods
3 Design for the criteria to select suitable drilling patterns among a selection of them
for different purposes and determination of the cases when the typical drawings
cannot be used
4 Design for the criteria to select a grout mix (among many) the criteria to accept the
mix in use and the corresponding stop criteria which includes the grouting pressure
the pumping time the grout take and the predicted grout flow with reasonable
tolerances The grout flow should be used to verify if the design is valid or not
None of the parameters should be used alone
5 Design for the actions if the grout take and the flow during a predetermined
pumping time do not correspond with the predicted ones (considering the
tolerances)
6 Design for controlling the grouting result before the excavation (not applicable for
post-groutings) and the actions if the result is not obtained and
7 Design for the details such as determining a hole totally tight or eg filling of the
grouting holes in the environment of small fractures before the actual pumping
under the high pressure is started or for example the removal time of packers
There are some characterisation methods that can be used to estimate the groutability of
the rock The water loss measurement proved to be unfailing in various conditions and it
can be done systematically The more detailed picture of the rock can be obtained if
using 2-seal packers instead of 1-seal packer system The interpretation of the water loss
measurement results is important in order to understand the nature of the hydrological
environment ndash in certain cases the maximum Lugeon value does not indicate the need
for grouting As a complementary method the Posiva flow log is recommended since it
makes it possible to observe the properties and the number of single fractures The start
criteria for the grouting should take both of these into account and the set criteria for the
different methods should be mathematically in line with each other In order to get a
better picture of the rock to be grouted the pressures used in the water loss
measurement should be raised closer to those applied in the grouting Straight holes free
of the drilling cuttings and other debris are essential to assure high quality flow log data
In principle two basic drilling patterns in the access tunnel should be sufficient one
with the holes outside the tunnel profile and one with the holes inside the tunnel profile
In practice more drilling patterns will be needed since the excavation profile varies and
there are the shafts and other rooms that require special drilling considerations The
optimal grouting hole density cannot be set A suitable density shall be found with
practical iteration Even in the case of an extremely dense drilling pattern there is a good
chance to miss the water channel and not to detect it A denser drilling pattern will be a
remedy to reduce this risk In the second grouting field test it was observed that even 1
m grouting hole density did not give the picture of the rock reliable enough
The location of grouting holes turned out to be more complicated thing than expected If
the intention of turning the grouting holes inside the tunnel profile is to diminish the
grout remaining in the rock after excavation the following things are to be happened in
89
principle we can ldquowasterdquo with the number of holes in order to find the water channels
But at the same time we will need higher grouting overpressures and pumping times to
reach the same penetration length of grout Also if the grouting holes are parallel to
each other certain fracture directions are not hit Besides this room for the grouting
holes in possible next grouting rounds and for blasting holes should be saved This
means that there is a limit for the highest grouting hole density and thus eg two
grouting rounds with the holes inside the tunnel profile should be the maximum If the
grouting holes will be diverted outside the tunnel profile every hole increases
significantly the amount of the grout remaining in rock after excavation ndash especially in
the case of small fractures If the grouting hole density is too high there is a risk that the
grout squeezes out from the next grouting holes This can be a problem if operating
with the leaking hole cannot be started soon ndash the grout starts to set and the grouting
hole could be wasted
A collection of cementitious recipes studied (non-accelerated and accelerated) exists
The pH rate of cementitious grouts is not of importance from the point of view of the
grouting techniques The rheology the penetration ability and the strength development
are the key factors leading to successful grouting Since the penetration length is very
sensible to the rheological properties of the grout the quality control in the work site is
important Besides the penetration ability is a key issue especially in small fractures
and should be controlled carefully before the grouting Also it should be emphasized
that when designing the grouting the observations of the mix properties from the field
conditions should be used instead of those from the laboratory The beaker test did not
work as a method to follow the early age strength development of cementitious grouts
because the conditions prevailing in rock differs significantly from those in a tunnel
The grouting of small fractures differs from the grouting of the larger ones In order to
reach the same penetration length for the grout the grout take is high in large fractures
whereas it is extremely small while grouting very small fractures Only a few litres of
grout will be enough to seal the small fractures Thicker mixes than available for the
moment are recommended for grouting of large fractures eg in the environment of the
hydrogeological structure RH20 The selection of the mixes should be wider The
grouting of very small fractures will probably require more mixes than currently proven
by the tests The field tests were done with the non-accelerated low pH grouts Recently
the also accelerated mixes has been used This does not void the studies presented in
this report ndash the basic concept do not suffer essentially
Many practical hints for operating with colloidal silica were obtained in the pilot field
These apply to eg its sensitivity to impurities in the mixers the accelerator quality and
the dosing the practical range of the operating time the operating time considerations
when designing the grouting and the work phases the storage of the components etc It
was hard to remove all the silica from the grouting holes (in order to fill them with the
cement paste later) Because the content of the accelerator has a great impact to
behaviour of the colloidal silica and the practical operation times the question how to
seal relatively large fractures under high water pressures with this material aroused In
order to get the material to gel fast enough the accelerator content should be relatively
high which means that the practical operation time for the grouter will be very short
The beaker test did not work as a method to follow the early age strength development
90
of colloidal silica because the conditions prevailing in rock differs significantly from
those in a tunnel
It was also observed that the lack of understanding in the meaning of the pumping time
under the maximum design pressure leads to following mistakes the smallest fractures
will not be sealed and some holes that actually intersect water leaking fractures are
wrongly interpreted as tight holes and they remain only partially filled with grout This
kind of misconception has probably been the main reason for the relatively high
proportion of unfilled grouting holes between the tunnel chainages 0 - 1850 The filling
of the grouting hole prior to pressurizing proved to be a useful and practical solution
avoid this misinterpretation The filling save time for the pumping and this is important
to do when the mix properties do not change significantly
The recommendations for grouting pressures vary a lot in the literature Based on the
field tests the recommended grouting pressure is a below the limit for hydraulic
uplifting However this results in relatively high grouting pressures at the great depths
What happens to the grouting pressure in rock and in the boundary of water and grout is
not understood and could not be studied in this project However these are phenomena
which affect the grouting result for sure The rock mechanical effects of the high
grouting pressures are poorly understood area
It is clear that the full solution for the optimised grouting is not done in the office and
with the recommendations given above It is necessary that besides the designer the
grouting crew understand the contents of the design and can ldquoreadrdquo the rock response
obtained during the grouting and react to it if the grouting is not proceeding as planned
due eg the uncertainties related to the bedrock data Even though an important step in
the grouting design can be taken the grouting work itself should involve a semi-
activerdquo design during the work However the rules for this semi-active grouting design
during grouting should be determined beforehand and expressed in the design
The grout flow in the small fractures will be so slow that the current flow meter in
Posivarsquos grouting equipment cannot record it anymore This may result in difficult
situations for the grouting crew because they should verify the grout movement by
making the indirect observations eg from the piston movements The flow meters
should be able to detect flows in the accuracy of 001 lmin if willing to observe the
progress of the grouting of the smallest fractures By the same token it should be
possible to record the high grout flow rates as well
62 Grouting work
The accuracy of the flow meters of the water loss measurement device and the grouting
equipment were insufficient when grouting small fractures as targeted in ONKALO
All possible efforts to improve the accuracies should be made
In order to reach the penetration length of the grout as designed the transmissivities and
hydraulic apertures of the fractures should be able to be determined as accurately as
possible Besides the development of the water loss measurement the use of unbending
rods in drilling should be considered in order to enhance the possibility to get the
91
reliable results The holes will be straighter and thus more investigations (the Posiva
flow log) can be carried out and more detailed source data can be obtained Also the
grouting result will be better because the holes are located as planned
The datasets between reliable flow loggings and corresponding sets of the MWD data
gathered for interpretation with the Rockma software were compared No correlation
was found The algorithms in the Rockma software should be at least calibrated
However it is possible that the MWD data cannot be used in deep and tight conditions
like in ONKALO
In the first grouting test the importance of the excavation damage zone (EDZ) was
experienced in the grouting work The EDZ cannot be avoided and thus it should be
managed The practical solutions for this are eg to inform the grouting designer about
possible deviations from the extent of the EDZ normally experienced (eg due to
reblastings) and selecting the packers long enough for water loss measurements and
grouting That will prevent the EDZ from disturbing the successful grouting
It is good to start the grouting far enough (several metres) from the fracture targeted
since we cannot observe its orientation However no definite basis to specify the
distance was obtained
The following investigations aiming at selecting a suitable design or designing the
grouting should be carried out observing the leaking fractures on the rock surfaces and
measuring the water out flow and the water losses in probe holes or in grouting holes
and to carry out the flow logging if possible In order to avoid unnecessary time losses
on the water loss measurements it is recommended that first the hole is measured in the
full length and if the trigger level is exceeded (indicates the possibility that the local
trigger levels may be exceeded) then to measure the water losses in 1 m sections along
the hole The first measurement could be carried out applying several over pressures to
observe the nature of the hydraulics around and the latter measurement could be done
with a uniform pressure
Based on the design approach presented in the previous Section the progress of the
grouting work should happen by as follows
1 Obtain the characterisation results (the water losses the flow logging the water
outflow) from the probe holes and the fracturing
2 A geologisthydrogeologist to interpret the results (in terms of transmissivities and
hydraulic apertures)
3 Selecting the drilling pattern based on the set criteria ndash if the leaking fracture
intersects the drift then change the orientation of the grouting holes
4 Investigate the grouting holes (the water losses the flow logging the water out
flow)
5 Read the results got from the grouting holes and select the suitable design
according to the largest fracture group that determines the actions in the first
grouting round if several rounds are needed
6 Fill the holes in the ldquotightrdquo rock
92
7 Start the grouting according to the instructions taking into account also the quality
criteria set for grout mixes the grouting of holes should start by filling them
8 Measure the grout take time and flow
9 If grouting progresses as planned (observed by the grout flow and its tolerances)
continue up to the end if not then change to the other typical design having a
different mix and the new design parameters
10 Follow the early age strength development of the grout and release the packers
according to the design
11 When grout is set enough verify the grouting result with the control holes the
acceptance criteria is similar to the starting criteria and
12 If the result is within the acceptance criteria then continue the excavation if not
then the control holes are used as new probe holes and the process goes back to the
step 1 until the target is reached
Both the fracture properties and the mix properties are the input data for the grouting
design In order to reach correct adaptation of the design the mix properties should be
controlled before grouting
Even though the objective in this work was to define reasonable low grouting pressures
the increase of the grouting pressures will probably be needed This should be taken into
account when selecting the packers When grouting small fractures custom made
packers that can be used for the filling of holes first and then continuing the grouting
pumping directly should be taken into use
It would be a benefit if several grouting holes could be grouted at the same time with
no significant pressure differences in nearby grouting holes If considering the
connection of the grouting holes to the same grouting line the pressure increase and the
grout flow should be followed and controlled separately for every hole because the
grout flows to the easiest way (the law of the smallest resistance)
The grouting with accelerated mixes and especially with colloidal silica should be
trained more because there are limitations concerning the time frame the material
properties remain within workable limits
The prevailing circumstances together with the strict requirements lead to the fact that
measuring accuracy of the flow meters (the water loss test and the grout flow) are not
sufficient The flow meters should be able to detect the flows in accuracy of 001 lmin
The automatization of the grouting should be considered since it facilitates the work
As stated earlier even thought carefully designed the grouting work is partly empirical
and requires the design-as-you-go ndashthinking The grouting crew should be competent
enough to understand the content of the design and also to change the design according
to the predetermined guidelines when necessary Thats why the crew should be trained
for all the actions presented above
93
7 CONCLUSIONS AND RECOMMENDATIONS
The water inflow target have been obtained in the first two km of the access tunnel of
ONKALO The grout take in the first km has been relatively high and a significant part
of the grouting holes has been unfilled The rock characterisation for the grouting
purposes has been difficult in deep and tight bedrock and more challenges will be met
when going deeper The traditional water loss measurement appeared to be the most
practical method even though the measurement accuracy should be improved the
overpressures should be revised and interpretation of the results should be trained more
The flow logging and the water loss measurements with 2-seal packer are recommended
to search for single fractureszones The geological mapping of the tunnel drift could be
utilized better in the grouting design
Due to the long term safety reasons the new grouting materials (low pH grouts and
colloidal silica) should be taken into use and further optimisations of the grout take
should be done The norms and standards do not give enough guidelines for the
optimisation and new tools were searched for Fortunately this kind of research and
development has been done and the Swedish Grouting Time -method proved to be the
most developed approach to study the grouting parameters the grout properties the
grouting pressure the penetration length aimed and the pumping time The approach
was further developed and so called Grouting Time amp Flow -method with the inclusion
of the grout flow monitoring to overcome uncertainties in the bedrock data is
recommended for ONKALO The original suggestion ndash to use the time solely as a stop
criterion ndash do take into account the uncertainties and the variations related to the source
fracture data and thus the grout flow is necessary to prove With it we can indirectly
observe if the used assumptions in the design were sufficiently close to the real ones
Hopefully the model will be developed further in the future and the design and the
grouting work could then be iteratively developed as more experiences are gained
The re-evaluation of the current trigger levels for starting the grouting are
recommended since the levels have a remarkable effect on the construction and the
every days practices Pre-grouting is recommended to be the main way to seal the rock
In order to enable fluent and cost efficient tunnel driving the use of typical designs for
the expected rock conditions is recommended The major structures like the RH19 and
the RH20 the shafts the post-groutings the cases where a leaking fracture intersects the
tunnel drift should be designed individually According to the study performed the
fractures down to the hydraulic apertures of 100 - 200 microm can be sealed with the
cementitious low pH grouts and having the grouting holes inside the tunnel profile (to
minimise the grout remaining in rock) However these fractures occur very sparcely in
the ONKALO bedrock and usually the alternative design solutions have to be searched
Those are the use of colloidal silica instead of cementitious grouts the grouting holes
outside the tunnel profile or having high grouting pressures Out of these choices the
use of colloidal silica and the grouting holes outside the tunnel profile are
recommended The development of thicker cementitious grouts for intersection of the
major hydrogeological structures is recommended
94
The implementation of the development work requires the following actions
Design basis investigation and design procedure should be revised
Design contents and form should be revised
Grouting procedure and certain details should be revised
Accuracy of the flow meters is recommended to be improved
Water loss measurement should be developed further
Education for designers and grouters should be organised
Systematic data gathering would enable further development of grouting and
Grouting experiences should be evaluated as an every days part of grouting design
work and the increased know-how should be taken in use fluently
The following details are emphasized in this Chapter and more detailed
recommendations can be found in Chapter 6
The penetration length and penetration ability of the grout is sensible to the
hydraulic aperture of the fractures the rheological properties of the grout and the
grouting overpressure The focus in the rock characterisation the grout quality
control and the execution of the grouting should lay on these factors
The follow of the grout flow is recommended to be the most important part to
verify the applicability of the grouting design
The model to measure the groutings does not take into account the fractures that do
not intersect a probe hole or a investigation hole The water loss measurement
should be developed further and the understanding and the utilization of the results
obtained from the results should be increased
The grouting overpressure prevailing and the fall of the pressure in the rock is
poorly understood The rock mechanical effects caused by the grouting pressure are
not understood enough and should be studied further
In the case of multi-fracture systems the grouting should start by sealing of the
largest fractures with relatively thick mixes As the sealing occurs the grouts
should be thinned in the possible next grouting rounds The expected grout take
varies a lot depending on the rock conditions Very small grout takes do not
indicate grouting in vain
The determination of the location and the density of grouting holes are and will be
empirical and the optimum should be iteratively found until better characterisation
methods will be in place Some holes intersect the fractures and some do not The
unnecessary drillings cannot be avoided fully The use of the grouting holes inside
the tunnel profile appeared to be more complicated that expected Only the most
largest fractures can be grouted with that kind of drilling patterns
It is recommended to extend the current selection of the grout mixes to cover
thinner cementitious mixes and colloidal silica for the smallest fractures and thicker
mixes for the largest fractures The quality control in the field should be organised
to keep the uncertainties related to the mix properties under control
Because very small fractures should be sealed and relatively high grouting
overpressures will be needed the packers should be adjusted to the new suite
The occupational safety should be taken into account (the length of packers the
distance to the fracture to be grouted)
95
The better accuracy of the flow meters is recommended since the requirements
concerning the water inflows are so tight and
In principle the working cycles would be the same when grouting small and large
fractures When grouting small fractures the filling of the grouting holes before the
actual grouting (raising the pressure) should be a common practice This should be
taken into account when selecting the packers
Colloidal silica should be studied and tested more The removal of the silica from
the grouting holes should be developed further
In order to go further in optimising of the grouting the development of the probe
hole characterisation methods and the accuracy of the measurement devices is
recommended The geophysics and geostatistics may give the new possibilities in
addition to the existing ones If the variation of the fracture apertures and the
fracture orientation can be observed some day a new significant step for the more
optimised grouting can be taken
96
97
REFERENCES
Ahokas H Hellauml P Ahokas T Hansen J Koskinen K Lehtinen A Koskinen L
Loumlfman J Meacuteszaacuteros F Partamies S Pitkaumlnen P Sievaumlnen U Marcos N
Snellman M amp Vieno T 2006 Control of Water Inflow and Use of Cement in
ONKALO after Penetration of Fracture Zone R19 Posiva Oy Olkiluoto Finland
Working Report 2006-45
Axelsson M 2006 Strength Criteria on Grouting Agents for Hard Rock - Laboratory
studies performed on gelling liquid and cementitious grout Licentiate Thesis Chalmers
University of technology Goumlteborg Sweden
Bergman S amp Nord G 1982 On adequate tightening of tunnels Swedish Rock
Engineering Research Foundation ndash BeFo Stockholm Sweden (In Swedish)
Brantberger M 2000 Metodik vid foumlrinjektering I uppsprucket haringrt berg Licentiate
Thesis Royal Institute of Technology Stockholm Sweden
Concrete Association of Finland 2006 Grouting of Rock Facilities Helsinki Finland
Working Instruction BY53 (In Finnish)
Fransson Aring 2001 Characterisation of Fractured Rock for Grouting Using
Hydrogeological Methods Chalmers University Of Technology Department of
Geology Goumlteborg Sweden
Fransson Aring amp Gustafson G 2007 Efterinjektering Inlaumlckageprognos och design ndash
foumlrslag till analys Swedish Rock Engineering Research Stockholm Sweden SveBeFo
Rapport 75 (In Swedish)
Funehag J 2007 Grouting of Fractured Rock with Silica Sol Grouting design based on
penetration length Chalmers University of Technology Department of Civil and
Environmental Engineering Goumlteborg Sweden
Gardemeister R Johansson S Korhonen P Patrikainen P Tuisku T amp Vaumlhaumlsarja
P 1976 The application of Finnish engineering geological bedrock classification
Techical Research Centre of Finland Geotechnical laboratory Espoo Finland
Research note 25
Gustafson G 2005 Tn 050928 Rev 051003 Considerations on grouting pressure
(Non-checked reference from Concrete Assosiation of Finland 2006)
Gustafson G amp Claesson J 2004 Steering parameters for rock groutingSubmitted to
the International Journal of Rock Mechanics and Mining Sciences In prep
Gustafson G amp Stille H 1996 Prediction of groutability from grout properties and
hydrogeological data Tunnelling and Underground Space Technology Vol 11 No 3
pp 325-332
98
Gustafson G amp Stille H 2005 Stop Criteria for Cement Grouting Felsbau Zeitschrift
fuumlr Geomechanik und Ingenieurgeologie im Bauwesen und Bergbau Vol 23 No 3 pp
62-68
Hakami E 1995 Aperture Distribution of Rock Fractures Division of Engineering
Geology Department of Civil and Environmental Engineering Royal Institute of
Technology Stockholm Sweden Doctoral Thesis p 22
Hansen J Vuorio M Koskinen K Juhola P Vuorinen U Sievaumlnen U Raivio P
amp Karttunen P 2008 Groundwater Inflow Management in ONKALO ndash The Future
Stategy Posiva Oy Eurajoki Finland Working Report 2008-44 (to be published)
Hellauml P Vaittinen T Saksa P amp Nummela J 2004 Statistical analysis and
modelling of Olkiluoto structures Posiva Oy Olkiluoto Finland Working Report
2004-58
Hellauml P Ahokas H Palmeacuten J amp Tammisto E 2006 Analysis of geohydrological
data for design of KBS-3H repository layout Posiva Oy Olkiluoto Finland Working
Report 2006-16
Hollmeacuten K 2007 R20 programme The development of grouting technique ndash Stop
Criteria and Field Tests Posiva Oy Olkiluoto Finland Working Report 2007-101
Houlsby A 1990 Construction and Design of Cement Grouting John Wiley and Sons
New York The United States of America
Haringkansson U 1993 Rheology of Fresh Cement-Based Grouts Royal Institute of
Technology Stockholm Sweden Doctoral Thesis
Haumlssler L 1991 Grouting of Rock ndash simulation and classification Doctoral Thesis
Royal Institute of Technology Stockholm Sweden
Lehtinen amp Hirvonen 2007 Monitoring Waterleakages and Results of Watersampling
from the Leaking Structures and Fractures after Grouting in ONKALO 2005-2006
Posiva Oy Olkiluoto Finland Working Report 2006-28
Lokkila M 2008 Flow of Bingham and Newtonian fluids in hard rock- application for
ONKALO University of Helsinki Department of Physics Helsinki Finland Masters
thesis
Lombardi G 1997 GIN principle revisited Water Power amp Dam Construction
October 1997 pp 33-36
Lombardi G amp Deere D 1993 Grouting Design and Control Using the GIN principle
Water and Power and Dam Constructions June 1993 pp 15-22
Posiva picture archives httpwwwposivafi
99
Ranta-Korpi R Karttunen P amp Sievaumlnen U 2007 R20 programme Field testing of
grouting materials Posiva Oy Olkiluoto Finland Working Report 2007-102
Reiman M Poumlllaumlnen J amp Vaumlisaumlsvaara J 2006 Flow measurements in ONKALO at
Olkiluoto Probe holes and ONK-KR1 ndash ONK-KR4 ONK-PVA1 and ONK-YPPL18
Posiva Oy Olkiluoto Finland Working Report 2006-65
Riekkola R Sievaumlnen U amp Vieno T 2003 Controlling of Disturbances due to
Groundwater Inflow into ONKALO and the Deep Repository Posiva Oy Olkiluoto
Finland Working Report 2003-46
Sievaumlnen U 2002 Groundwater inflow and grouting conditions at the Olkiluoto site
Eurajoki western Finland Licenciate Thesis University of Helsinki Helsinki Finland
Sievaumlnen U amp Riekkola R 2003 Controlling of Groundwater Inflow into ONKALO
and the Deep Repository at Olkiluoto Summary Report Posiva Oy Olkiluoto Finland
Working Report 2003-51
Vaittinen T Ahokas H Heikkinen E Hellauml P Nummela J Saksa P Tammisto
E Paulamaumlki S Paananen M Front K amp Kaumlrki A 2003 Bedrock model of the
Olkiluoto site version 20031 Posiva Oy Olkiluoto Finland Working Report 2003-43
Vaittinen T Nummela J amp Tammisto E 2007 Expected occurence of the
transmissive fractures at the repository level for grouting design purposes Posiva Oy
Olkiluoto Finland Working Report 2007-87
Vieno T Lehikoinen J Loumlfman J Nordman H Meacuteszaacuteros F 2003 Assessment of
Disturbances Caused by Construction and Operation of ONKALO Posiva Oy
Olkiluoto Finland Posiva Report 2003-06 ISBN 951-652-120-7
Oumlhberg A Rouhiainen P 2000 Posiva groundwater flow measuring techniques
Posiva Oy Olkiluoto Finland Working Report 2000-12
100
101
APPENDIX 1
102
103
104
105
106
107
APPENDIX 2
108