race and ethnicity in higher education · race and ethnicity in higher education: a status report...
TRANSCRIPT

RACE AND ETHNICITY IN HIGHER EDUCATION
AmericanCouncil on Education
A Status Report Executive Summary

Race and Ethnicity in Higher Education: A Status Report By Lorelle L. Espinosa, Jonathan M. Turk, Morgan Taylor, and Hollie M. Chessman
Race and Ethnicity in Higher Education: A Status Report and its accompanying microsite provide a data- informed foundation for those working to close persistent equity gaps by providing a comprehensive review of the educational pathways of today’s college students and the educators who serve them.
Race and Ethnicity in Higher Education: A Status Report and the microsite were made possible through the generous support of The Andrew W. Mellon Foundation.
Visit www.equityinhighered.org to learn more about the project and to download the full report containing more than 200 indicators on race and ethnicity. Also available on the site are downloadable figures, detailed data, and other resources on race and ethnicity in higher education.
3 www.equityinhighered.org
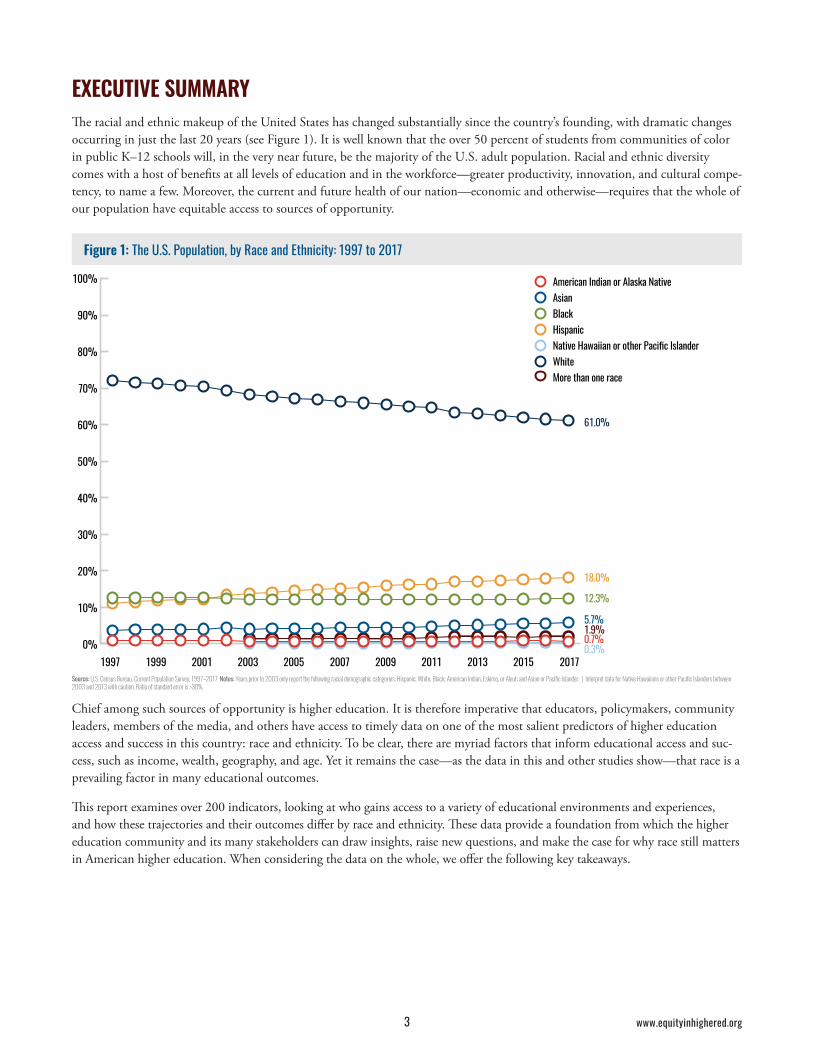
EXECUTIVE SUMMARYThe racial and ethnic makeup of the United States has changed substantially since the country’s founding, with dramatic changes occurring in just the last 20 years (see Figure 1). It is well known that the over 50 percent of students from communities of color in public K–12 schools will, in the very near future, be the majority of the U.S. adult population. Racial and ethnic diversity comes with a host of benefits at all levels of education and in the workforce—greater productivity, innovation, and cultural compe-tency, to name a few. Moreover, the current and future health of our nation—economic and otherwise—requires that the whole of our population have equitable access to sources of opportunity.
Figure 1: The U.S. Population, by Race and Ethnicity: 1997 to 2017
0%
10%
20%
30%
40%
50%
60%
70%
80%
90%
100%
20172015201320112009200720052003200119991997
American Indian or Alaska Native Asian BlackHispanicNative Hawaiian or other Pacific Islander WhiteMore than one race
18.0%
12.3%
5.7%0.7%0.3%
61.0%
1.9%
Source: U.S. Census Bureau, Current Population Survey, 1997–2017 Notes: Years prior to 2003 only report the following racial demographic categories: Hispanic; White; Black; American Indian, Eskimo, or Aleut; and Asian or Pacific Islander. | Interpret data for Native Hawaiians or other Pacific Islanders between 2003 and 2013 with caution. Ratio of standard error is >30%.
Chief among such sources of opportunity is higher education. It is therefore imperative that educators, policymakers, community leaders, members of the media, and others have access to timely data on one of the most salient predictors of higher education access and success in this country: race and ethnicity. To be clear, there are myriad factors that inform educational access and suc-cess, such as income, wealth, geography, and age. Yet it remains the case—as the data in this and other studies show—that race is a prevailing factor in many educational outcomes.
This report examines over 200 indicators, looking at who gains access to a variety of educational environments and experiences, and how these trajectories and their outcomes differ by race and ethnicity. These data provide a foundation from which the higher education community and its many stakeholders can draw insights, raise new questions, and make the case for why race still matters in American higher education. When considering the data on the whole, we offer the following key takeaways.

4 www.equityinhighered.org
As the U.S. population has grown more racially and ethnically diverse, so too have students across all levels of higher education (see Figure 2). The Hispanic population’s growing numbers and rising postsecondary enrollment rates figured centrally in both trends. While much progress has been made for nearly all groups, we nonetheless see stagnant and low levels of secondary school completion, college participation, and educational attainment for many communities of color.
Figure 2: Undergraduate Enrollment, by Race and Ethnicity: 1995–96 and 2015–16
0%
10%
20%
30%
40%
50%
60%
70%
International students
More than one race
WhiteNative Hawaiian or other Pacific Islander
HispanicBlackAsianAmerican Indian or Alaska Native
1995–962015–16
1.0 0.85.4 5.7
12.315.2
10.3
19.8
0.63.3
0.6 2.8N/A 0.4
69.8
52.0
Source: U.S. Department of Education, National Postsecondary Student Aid Study, 1996 and 2016 Note: In 1995–96, Native Hawaiian or other Pacific Islander students was not an available category. These students were included in the category “Asian.”
| In 2017, 44.5 percent of the total population ages 25 and older had attained an associate degree or higher, an increase from 31.1 percent in 1997. For Hispanics in 2017, each 10-year age cohort had higher rates of college attainment than the next-oldest group.
| Asian adults had the highest levels of educational attainment in 2017, with 30.7 percent holding a bachelor’s degree and another 24.7 percent holding an advanced degree (see Figure 3). By contrast and despite steadily rising attainment, Hispanic men and women and American Indian or Alaska Native men had the lowest levels of educational attainment, with most hold-ing a high school credential or less (ranging from 54.5 percent among American Indian or Alaska Native men to 63.4 percent among Hispanic men).
Over the past two decades, the U.S. population has grown not only more educated but also more racially and ethnically diverse, thanks in large part to a growing Hispanic population that is seeking higher education at levels not before seen.

5 www.equityinhighered.org
Figure 3: Educational Attainment of Adults Ages 25 and Older, by Race and Ethnicity: 2017
0%
10%
20%
30%
40%
More than one race
WhiteNative Hawaiian or other
Pacific Islander
HispanicBlackAsian American Indian or Alaska Native
All racial and ethnic groups
Less than high schoolHigh school graduateSome college, no degreeAssociate degreeBachelor’s degreeMaster’s degreeProfessional degreeDoctoral degree
! ! !! !!
Source: U.S. Census Bureau, Current Population Survey, 2017 Notes: ! Interpret with caution. Ratio of standard error to estimate >30% but <50%. | !! Interpret with caution. Ratio of standard error is >50%.
| African American,1 American Indian or Alaska Native, and Native Hawaiian or other Pacific Islander populations each exhib-ited low college enrollment rates among secondary school completers of traditional college-going age (see Figure 4) and were a disproportionately older population of undergraduates.
Figure 4: Immediate College Enrollment of Recent High School or Equivalent Graduates Ages 16 to 24, by Race and Ethnicity: 1996 to 2016
0%40%
50%
60%
70%
80%
90%
100% All racial and ethnic groupsAsian BlackHispanicWhite
2003
2001
1999
1997
2010
2009
2008
2006
2004
2002
2000
1998
1996
2005
2007
2016
2015
2014
2012
2011
2013
70.6%70.5%69.5%
87.4%
56.5%
Source: U.S. Department of Education, Digest of Education Statistics, 2017, Table 302.20 Notes: This figure uses a three-year moving average, which is a weighted average of the year indicated, the year immediately preceding, and the year immediately following. For the final year, a two-year moving average is used. Moving averages are used to produce more stable estimates. | “All racial and ethnic groups” includes persons of other racial and ethnic groups not separately shown. | Prior to 2003, Asian included Pacific Islanders. | After 2002, White, Black, and Asian data exclude persons of more than one race.
| On an encouraging note, students of color who received a bachelor’s degree in 2007–08 were more likely than their White peers to enter graduate education within four years. Specifically, 43.8 percent of White bachelor’s degree recipients enrolled in graduate school, compared with 61.3 percent of Native Hawaiians or other Pacific Islanders, 57.7 percent of African Ameri-cans, and 57.2 percent of bachelor’s degree recipients of more than one race.
1 The terms Black and African American are used interchangeably.
6 www.equityinhighered.org
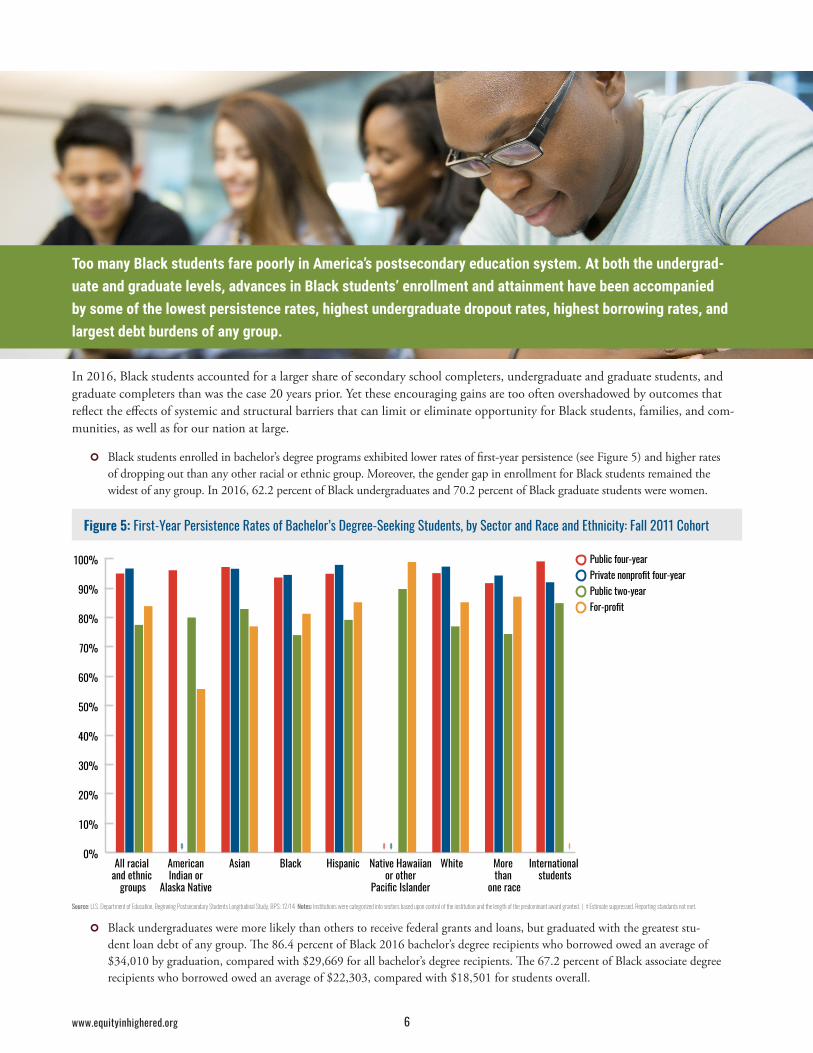
In 2016, Black students accounted for a larger share of secondary school completers, undergraduate and graduate students, and graduate completers than was the case 20 years prior. Yet these encouraging gains are too often overshadowed by outcomes that reflect the effects of systemic and structural barriers that can limit or eliminate opportunity for Black students, families, and com-munities, as well as for our nation at large.
| Black students enrolled in bachelor’s degree programs exhibited lower rates of first-year persistence (see Figure 5) and higher rates of dropping out than any other racial or ethnic group. Moreover, the gender gap in enrollment for Black students remained the widest of any group. In 2016, 62.2 percent of Black undergraduates and 70.2 percent of Black graduate students were women.
Figure 5: First-Year Persistence Rates of Bachelor’s Degree-Seeking Students, by Sector and Race and Ethnicity: Fall 2011 Cohort
Public four-yearPrivate nonprofit four-yearPublic two-yearFor-profit
0%
10%
20%
30%
40%
50%
60%
70%
80%
90%
100%
International students
WhiteHispanicBlackAsian More than
one race
Native Hawaiian or other
Pacific Islander
American Indian or
Alaska Native
All racial and ethnic
groups
‡ ‡ ‡‡
Source: U.S. Department of Education, Beginning Postsecondary Students Longitudinal Study, BPS: 12/14 Notes: Institutions were categorized into sectors based upon control of the institution and the length of the predominant award granted. | ‡ Estimate suppressed. Reporting standards not met.
| Black undergraduates were more likely than others to receive federal grants and loans, but graduated with the greatest stu-dent loan debt of any group. The 86.4 percent of Black 2016 bachelor’s degree recipients who borrowed owed an average of $34,010 by graduation, compared with $29,669 for all bachelor’s degree recipients. The 67.2 percent of Black associate degree recipients who borrowed owed an average of $22,303, compared with $18,501 for students overall.
Too many Black students fare poorly in America’s postsecondary education system. At both the undergrad-uate and graduate levels, advances in Black students’ enrollment and attainment have been accompanied by some of the lowest persistence rates, highest undergraduate dropout rates, highest borrowing rates, and largest debt burdens of any group.

7 www.equityinhighered.org
| Patterns of borrowing among African American graduate students are deeply concerning, especially among those at the nation’s for-profit colleges, which enrolled approximately 50 percent of Black doctoral students in 2016. The vast majority (95.2 percent) of Black doctoral recipients who attended these schools borrowed an average amount of $128,359 for graduate study (see Table 1).
Table 1: Cumulative Debt for Graduate Study: Doctoral Degree Recipients, by Sector and Race and Ethnicity: 2015–16
Public Four-Year Private Nonprofit Four-Year For-Profit
% Who Borrowed
Average Amount
Borrowed per Borrower
Median Amount
Borrowed per Borrower
% Who Borrowed
Average Amount
Borrowed per Borrower
Median Amount
Borrowed per Borrower
% Who Borrowed
Average Amount
Borrowed per Borrower
Median Amount
Borrowed per Borrower
All racial and ethnic groups 45.5% $72,130 $54,490 67.1% $74,590 $50,000! 87.9% $120,110 $129,795
Black 66.5% $111,486 $107,602 86.0% $111,611 $80,926!! 95.2% $128,359 $133,965
White 62.7% $71,724 $57,968 78.7% $57,568 $34,217 86.0% $108,317 $101,293Source: U.S. Department of Education, National Postsecondary Student Aid Study, 2016 Notes: Estimates were suppressed for all other groups due to small sample size. | Institutions were categorized into sectors based upon control of the institution and the length of the predominant award granted. | ! Interpret with caution. Ratio of standard error to estimate is >30% but <50%. | !! Interpret with caution. Ratio of standard error is > 50%.
| Even with a bachelor’s degree in hand, African Americans ages 25 to 34 earned 15 percent less and had an unemployment rate two-thirds higher than the typical bachelor’s degree holder of similar age.
While some important information is available, federal data preclude precise estimates of many key benchmarks for a relatively small and heterogeneous Native population. As a result, we still don’t know enough about indigenous students’ secondary school completion rates or graduate enrollment, or how they fund their college education. The data we can observe show troubling per-sistent equity gaps in educational and labor-market outcomes for American Indian or Alaska Native and Native Hawaiian or other Pacific Islander students when compared with other groups.
| In 2016, high school graduates of American Indian or Alaska Native and Native Hawaiian or other Pacific Islander descent enrolled in college at less than half the average rate (see Figure 6). Only 18.8 percent and 20.4 percent, respectively, were enrolled in college, as compared with 40.9 percent of all high school completers ages 18 to 24.
We still lack precise, national data on many educational outcomes for American Indians or Alaska Natives and Native Hawaiians or other Pacific Islanders; but what the available data do show is troubling.

8 www.equityinhighered.org
Figure 6: Percentage of 18- to 24-Year-Olds Enrolled in College, by Race and Ethnicity: 2016
WhiteHispanicBlackAsian More than one race
Native Hawaiian or other Pacific Islander
American Indian or Alaska Native
All racial and ethnic groups
0%
10%
20%
30%
40%
50%
60%
Source: U.S. Census Bureau, Current Population Survey, 2016
| American Indian or Alaska Native and Native Hawaiian or other Pacific Islander undergraduates were less likely than undergrad-uates of any other group to attend a four-year institution, attend a very selective college, or pursue a bachelor’s degree.
| At the graduate level, a higher share of American Indian or Alaska Native and Native Hawaiian or other Pacific Islander students than of all graduate students completed degrees at for-profit institutions. Among graduates of for-profit institutions, 74.4 percent of 2016 master’s degree recipients who borrowed accrued an average debt of $48,829, and the 87.9 percent of 2016 doctoral degree recipients who borrowed accrued an average debt of $120,110. These debt levels were higher than those of students who completed graduate degrees at public and private nonprofit four-year institutions.
| American Indian or Alaska Native adults earned substantially less than adults with comparable levels of educational attain-ment. Within every level of postsecondary attainment, the median annual earnings of American Indian or Alaska Native adults were between 16.2 percent and 28.5 percent less than the national median in 2016 (see Table 2).
Table 2: Median Annual Earnings of Adults Ages 25 and Older, by Educational Attainment and Race and Ethnicity: 2016
High School Graduate or Equivalent
Associate Degree
Bachelor’s Degree
Master’s Degree
Professional Degree
Doctoral Degree
All racial and ethnic groups $29,100 $39,493 $52,000 $64,809 $95,000 $84,049
American Indian or Alaska Native $24,331 $32,404 $41,316 $50,690 $67,948 $61,842
Asian $25,089 $37,308 $57,495 $81,104 $101,380 $92,735
Black $25,000 $33,452 $45,337 $56,000 $79,000 $75,000
Hispanic $25,345 $35,442 $44,607 $60,758 $69,952 $74,000
Native Hawaiian or other Pacific Islander $29,166 $35,542 $48,000 $52,859 $77,279 $75,948
White $30,912 $40,552 $53,670 $63,796 $100,000 $85,000
More than one race $27,000 $36,455 $50,000 $61,823 $80,000 $78,063 Source: U.S. Census Bureau, American Community Survey, 2016 5-Year Estimates (2012–2016) Note: Only earnings for employed adults are included. All employed adults (both full and part time) are included.

9 www.equityinhighered.org
Where and how students go to school matters, as does what they study. While it is understandable that students experience our country’s diverse set of colleges and universities differently given college readiness, family background, and life stage, we should be concerned when educational opportunities are distributed along racial and ethnic lines.
Figure 7: Undergraduate Enrollment Across Sectors, by Race and Ethnicity: 2015–16
Public four-yearPrivate nonprofit four-yearPublic two-yearFor-profit
0%
10%
20%
30%
40%
50%
60%
70%
80%
90%
100%
International students
WhiteHispanicBlackAsian More than
one race
Native Hawaiian or other
Pacific Islander
American Indian or
Alaska Native
All racial and ethnic
groupsSource: U.S. Department of Education, National Postsecondary Student Aid Study, 2016 Note: Institutions were categorized into sectors based upon control of the institution and the length of the predominant award granted.
| With the exception of Asian students, larger shares of undergraduate and graduate students of color enrolled in, and com-pleted degrees at, for-profit institutions. This was particularly true of Black, American Indian or Alaska Native, and Native Hawaiian or other Pacific Islander students (see Figure 7 and Figure 8).
Great differences exist by race, ethnicity, and gender in where students go to college and what they study, signaling an uneven playing field in the labor market and a threat to the opportunity for intergenerational upward mobility.

10 www.equityinhighered.org
Figure 8: Graduate Enrollment Across Sectors, by Race and Ethnicity: 2015–16
Public four-yearPrivate nonprofit four-yearFor-profit
0%
10%
20%
30%
40%
50%
60%
70%
80%
90%
100%
International students
WhiteHispanicBlackAsian More than
one race
Native Hawaiian or other
Pacific Islander
American Indian or
Alaska Native
All racial and ethnic
groups
!
!!
!
!
Source: U.S. Department of Education, National Postsecondary Student Aid Study, 2016 Notes: Institutions were categorized into sectors based upon control of the institution and the length of the predominant award granted. | ! Interpret with caution. Ratio of standard error to estimate is >30% but <50%. | !! Interpret with caution. Ratio of standard error is > 50%.
| In every income quartile, Black undergraduates were less likely than members of any other racial or ethnic group to attend a very selective institution, and Black undergraduates were among the least likely to enroll in and complete an associate degree or bachelor’s degree in the lucrative STEM fields, at any institution (see Figure 9 and Figure 10).
Figure 9: Field of Study for Bachelor’s Degree Recipients, by Race and Ethnicity: 2016
0%
10%
20%
30%
40%
50%
60%
70%
80%
90%
100% v
v
v
V
v
v
v
Inter-national students
WhiteHispanicBlackAsian Morethan
one race
Native Hawaiian
or other Pacific Islander
American Indian or
Alaska Native
All racial and ethnic
groups
Race or ethnicity unknown
STEM fieldsBusiness Education Health care fields Social sciencesHumanities General studies and other fields Other applied fields
Source: U.S. Department of Education, Integrated Postsecondary Education Data System, 2016 Notes: STEM fields include computer and information sciences, engineering and engineering technology, biological and physical sciences, science technology, math, and agriculture. | General studies and other programs include fields such as liberal arts and sciences, interpersonal and social skills, personal awareness and self-improvement, and multi- or interdisciplinary studies, among others. | Other applied fields for bachelor’s degrees include personal and consumer services; manufacturing, construction, repair, and transportation; military technology and protective services; architecture; communications; public administration and human services; design and applied arts; law and legal studies; library sciences; and theology and religious vocations.
| As a group, Hispanic undergraduates were among the most likely to pursue and complete an associate degree. However, they were the least likely to complete their degree in health care fields (see Figure 10). Among select occupational fields, health care fields have the largest observed earnings gap between high school and associate degree completers ($19,240).

11 www.equityinhighered.org
Figure 10: Field of Study for Associate Degree Recipients, by Race and Ethnicity: 2016
0%
10%
20%
30%
40%
50%
60%
70%
80%
90%
100% v
V
v
v
v
Inter-national students
WhiteHispanicBlackAsian Morethan
one race
Native Hawaiian
or other Pacific Islander
American Indian or
Alaska Native
All racial and ethnic
groups
Race or ethnicity unknown
STEM fieldsBusiness and personal and consumer services Health care fields Social sciences and humanities General studies and other fields Manufacturing, military technology, and other applied fields
Source: U.S. Department of Education, Integrated Postsecondary Education Data System, 2016m Notes: STEM fields include computer and information sciences, engineering and engineering technology, biological and physical sciences, science technology, math, and agriculture. | General studies and other programs include fields such as liberal arts and sciences, interpersonal and social skills, personal awareness and self-improvement, and multi- or interdisciplinary studies, among others. | Other applied fields for sub-baccalaureate credentials include the following fields of study: manufacturing, construction, repair, and transporta-tion; military technology and protective services; education; architecture; communications; public administration and human services; design and applied arts; law and legal studies; library sciences; and theology and religious vocations.
| Larger shares of American Indian or Alaska Native, Native Hawaiian or other Pacific Islander, and Hispanic undergraduates than of other groups were enrolled in public two-year and open-admission four-year institutions.
In 2016, 70.3 percent of undergraduates completed the Free Application for Federal Student Aid, and 37.3 percent borrowed federal direct loans to pay for college. Yet patterns of financing postsecondary education varied markedly by race and ethnicity. The most notable and consistent finding that emerged from the data was that Black students were most likely to borrow and accrue larger debts than other students, with Asian and Hispanic students the least likely to borrow (see Table 3). These patterns held within types of institutions, dependent student status, and family income quartile.
How students pay for higher education varied considerably by race and ethnicity, especially in terms of who borrows and who leaves college with high levels of student loan debt.

12 www.equityinhighered.org
| Asian undergraduates were consistently among the least likely of any group to take out loans: 67.5 percent applied for aid and only 26.0 percent borrowed in 2016. Hispanic undergraduates also borrowed at lower-than-average rates and accrued lower-than-average debts, whereas Black students were more likely to borrow and left college with higher-than-average debts, regardless of income.
Table 3: Total Borrowing: Associate Degree and Bachelor’s Degree Recipients, by Race and Ethnicity: 2015-16
Associate Degree Recipients Bachelor's Degree Recipients
% Who Borrowed
Average Amount Borrowed per
Borrower
Average Amount Borrowed per
Student% Who
Borrowed
Average Amount Borrowed per
Borrower
Average Amount Borrowed per
Student
All racial and ethnic groups 48.0% $18,501 $8,889 68.9% $29,669 $20,432
American Indian or Alaska Native 67.2% $18,225 $12,254 76.2% $26,380 $20,103
Asian 29.6% $17,459 $5,170 58.7% $25,510 $14,968
Black 67.2% $22,303 $14,986 86.4% $34,010 $29,390
Hispanic 36.3% $15,778 $5,719 67.3% $25,524 $17,183
Native Hawaiian or other Pacific Islander 47.3% ‡ ‡ 89.6% $26,515 $23,756
White 50.9% $17,794 $9,063 70.3% $30,119 $21,184
More than one race 51.0% $21,795 $11,113 73.7% $29,906 $22,053
International students 7.9%! ‡ ‡ ‡ ‡ ‡Source: U.S. Department of Education, National Postsecondary Student Aid Study, 2016 Notes: Institutions were categorized into sectors based upon control of the institution and the length of the predominant award granted. | ‡ Estimate suppressed. Reporting standards not met. | ! Interpret with caution. Ratio of standard error to estimate is >30% but <50%.
| As one would suspect, lower-income undergraduates were more likely than their upper-income peers to borrow to pay for col-lege, but lower-income borrowers took on nearly as much debt as more affluent ones. Among dependent bachelor’s recipients, 57.3 percent of upper-income students borrowed an average amount of $27,515, while 74.1 percent of low-income students borrowed an average amount of $24,836.
| At every degree level and within almost every racial and ethnic group, those who received degrees from for-profit institutions borrowed at higher rates and accumulated larger debts than completers who enrolled in other sectors. For instance, 87.4 percent of associate degree completers at for-profit institutions borrowed an average amount of $26,231 to pay for college, compared with 40.4 percent of associate degree completers at public two-year institutions, who borrowed an average amount of $15,486.
13 www.equityinhighered.org
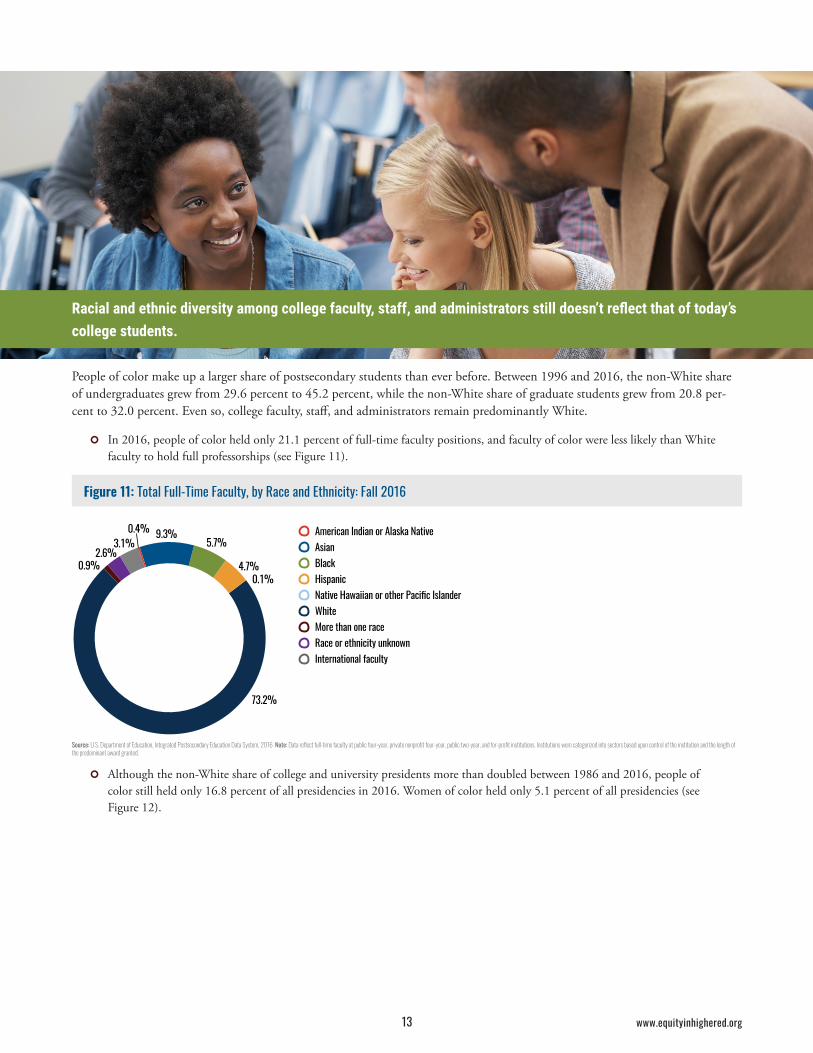
People of color make up a larger share of postsecondary students than ever before. Between 1996 and 2016, the non-White share of undergraduates grew from 29.6 percent to 45.2 percent, while the non-White share of graduate students grew from 20.8 per-cent to 32.0 percent. Even so, college faculty, staff, and administrators remain predominantly White.
| In 2016, people of color held only 21.1 percent of full-time faculty positions, and faculty of color were less likely than White faculty to hold full professorships (see Figure 11).
Figure 11: Total Full-Time Faculty, by Race and Ethnicity: Fall 2016
4.7%
5.7%9.3%0.4%
2.6%0.9%
73.2%
0.1%
American Indian or Alaska NativeAsianBlackHispanicNative Hawaiian or other Pacific IslanderWhiteMore than one raceRace or ethnicity unknownInternational faculty
3.1%
Source: U.S. Department of Education, Integrated Postsecondary Education Data System, 2016 Note: Data reflect full-time faculty at public four-year, private nonprofit four-year, public two-year, and for-profit institutions. Institutions were categorized into sectors based upon control of the institution and the length of the predominant award granted.
| Although the non-White share of college and university presidents more than doubled between 1986 and 2016, people of color still held only 16.8 percent of all presidencies in 2016. Women of color held only 5.1 percent of all presidencies (see Figure 12).
Racial and ethnic diversity among college faculty, staff, and administrators still doesn’t reflect that of today’s college students.

14 www.equityinhighered.org
Figure 12: Percentage Distribution of Presidents, by Race/Ethnicity and Gender: 2016
25.0%
58.1%
5.1%
11.8%
White menWhite womenMen of colorWomen of color
Source: American College President Study 2017
| Students were more likely to encounter people of color in service roles than in faculty or leadership positions. While people of color represented less than one-fifth of senior executives, 42.2 percent of service and maintenance staff and one-third of campus safety personnel were people of color.
| Among college and university administrators, chief student affairs and student life officers were the most diverse positions on campus, with a little more than one-quarter of individuals in these positions identifying as a racial or ethnic group other than White.
Figure 13: College and University Administrators, by Position and Race and Ethnicity: 2017
0%
10%
20%
30%
40%
50%
60%
70%
80%
90%
100%
v
v
v
AsianBlackHispanicWhiteOther ethnicity
Chief ath
letics
adminis
trator
Chief fac
ilities o
fficer
Police c
hief/ch
ief cam
pus
securit
y adminis
trator
Chief stu
dent aff
airs/
student
life offi
cer
Chief dev
elopment
/
advanc
ement offi
cer
Chief inf
ormatio
n officer
Registrar
/chief
student
registr
ation or
record
s officer
Chief acc
ounting
officer
/contro
ller
Chief hum
an
resourc
es officer
Chief stu
dent
financial
aid offi
cer
Provost/c
hief
academ
ic affairs
officer
Source: Bichsel, Jacqueline, Adam Pritchard, Jingyun Li, and Jasper McChesney. 2018. Administrators in Higher Education Annual Report: Key Findings, Trends, and Comprehensive Tables for 2017–18 Academic Year. Research Report. Knoxville, TN: CUPA-HR. Note: Some totals may not add to 100% due to rounding.
| Among college and university professional staff, more than one in four student affairs professionals and slightly more than one in five academic affairs professionals identified as non-White (see Figure 13).

ABOUT THE AMERICAN COUNCIL ON EDUCATIONACE is the major coordinating body for the nation’s colleges and universities. Our strength lies in our diverse base of member institutions. We represent nearly 1,800 college and university presidents and the executives at related associations, and are the only major higher education association to represent all types of U.S. accredited, degree-granting institutions: two-year and four-year, public and private. For more information, visit acenet.edu.

AmericanCouncil on Education