race,racial concentration,and the dynamics of educational
TRANSCRIPT

Race, Racial Concentration, and theDynamics of Educational Inequality Across
Urban and Suburban Schools
Christy LlerasThe University of Illinois at Urbana–Champaign
This study uses national data from the National Educational LongitudinalStudy to model educational inequality as a feedback process among courseplacement, student engagement, and academic achievement, separately forstudents in schools with high and low percentages of African American stu-dents. Results find strong effects of placement, engagement, and performanceon one another over time and across both school types. However, the resultsalso show that racial segregation is detrimental to the overall learning processfor students between 8th and 10th grade. The author concludes that Whiteand African American students in predominantly Black, particularly urban,schools are significantly disadvantaged at each point of the learning processcompared to students in other school types.
KEYWORDS: high school, mathematics, opportunity to learn, racial gaps,tracking, urban schools
Fifty years after Brown v. Board of Education (1954), our schools are stillstrongly segregated by race (Orfield & Yun, 1999). At the same time,
racial differences in educational performance and attainment continue to becentral to inequality in America (Farkas, 2004; Jacobson, Olsen, Rice,Sweetland, & Ralph, 2001; Jencks & Phillips, 1998). But to what extent is theformer the cause of the latter? More generally, how does the process of edu-cational performance and attainment differ across the two types of Americanschools—those with none to at most a modest-sized minority of AfricanAmerican students (Low Minority schools), and those with a large minorityto a large majority of African American students (High Minority schools)?
CHRISTY LLERAS is an assistant professor in the Department of Human andCommunity Development, University of Illinois at Urbana–Champaign, 2026Christopher Hall, Urbana, IL 61801; e-mail: [email protected]. Her main fields of studyare inequality, race and ethnicity, and the sociology of education, with an emphasison stratification processes in schools.
American Educational Research JournalDecember 2008, Vol. 45, No. 4, pp. 886-912
DOI: 10.3102/0002831208316323© 2008 AERA. http://aerj.aera.net
at PENNSYLVANIA STATE UNIV on March 5, 2016http://aerj.aera.netDownloaded from
Educational Inequality in Urban and Suburban Schools
887
Since most Whites attend the former type of school and most AfricanAmericans the latter type of school, differences in the overall learningprocess between these two types of schools could be very consequential forthe Black-White gap in educational performance and attainment.
Although the achievement gap between African Americans and Whitesnarrowed during the 1960s and 1970s, it has held constant since around 1980,and remains substantial today. Recent research shows that during every yearof schooling, African American students continue to learn less than compa-rable White students (Jacobson et al., 2001; Phillips, Crouse, & Ralph, 1998).Whereas African American children begin elementary school approximately1 year behind Whites in vocabulary knowledge, they finish high schoolapproximately 4 years behind Whites (Jacobson et al., 2001; Phillips, Crouse,et al., 1998). Of course, learning requires prior skills, engagement, and oppor-tunities to learn, and at each grade level, African Americans are disadvantaged(Sørensen & Hallinan, 1977). They enter with lower academic skills comparedto White students (Jacobson et al., 2001; Phillips, Brooks-Gunn, Duncan,Klebanov, & Crane, 1998) and generally occupy lower curricular tracks andtake less demanding coursework compared to White students (Gamoran &Mare, 1989; Jones, Vanfossen, & Ensminger, 1995; Lucas, 1999; Mickelson,2001). Moreover, teachers rate them as less attached and engaged in theirschoolwork compared to White students (Ainsworth-Darnell & Downey,1998; Farkas, 1996). Despite modest declines in Black-White residential seg-regation, African American students continue to be concentrated in raciallysegregated public schools within urban districts. And a growing body ofresearch has found lower achievement gains in urban schools and schoolswhere a higher percentage of the student body is African American (Bankston& Caldas, 1996; Entwisle & Alexander, 1992; Roscigno, 1998).
To better understand the sources of the racial gap in educational per-formance and achievement, it is important to examine not only how AfricanAmerican and White students differ with respect to the overall learningprocess but also how these students interact with and are shaped by thelarger organizational context and social environment of the school.Therefore, this study explicitly models the relationship among the three vari-ables—opportunities to learn, academic engagement, and achievement—asthe student’s career evolves over time in either a Low or High Minorityschool. In addition, unlike prior studies that have examined the main effectof school characteristics on student learning, this study focuses on whetherthe influence of a student’s race on the learning process actually varies bythe characteristics of the schools the student attends—in particular, racialcomposition and school location. Specifically, this study addresses the fol-lowing questions. First, what are the magnitudes of the effect of learningopportunities, academic engagement, and academic achievement on itselfand the other two outcomes over time? Second, how do the relative magni-tudes differ between Low and High Minority schools? Third, how much ofthe racial achievement gap is accounted for by these effects and their differ-ential patterns and magnitudes across Low and High Minority schools?
at PENNSYLVANIA STATE UNIV on March 5, 2016http://aerj.aera.netDownloaded from

Finally, does the learning process in Low and High Minority schools differby school location (i.e., urban, suburban, rural), and do any such differenceshelp explain the racial gap in academic achievement?
Opportunities to Learn and Student Achievement
A great many empirical studies have examined the determinants andconsequences of curriculum track placement in American schools. The resultssuggest that placement in higher tracks compared to lower tracks leads togreater achievement gains (Gamoran, 1992; Gamoran & Mare, 1989; Hallinan,1987; Lucas & Gamoran, 2002; Oakes, Gamoran, & Page, 1992; Pallas,Entwisle, Alexander, & Stluka, 1994; Rosenbaum, 1980; Stevenson, Schiller, &Schneider, 1994). The positive relationship between advanced courseworkand academic achievement is typically attributed to more material being cov-ered, at a more advanced level, and with higher instructional quality andhigher teacher expectations in higher track courses (Alexander & Cook, 1982;Friedkin & Thomas, 1997; Gamoran, 1989, 1992; Gamoran & Mare, 1989;Hallinan & Kubitschek, 1999; Lucas, 1999; Oakes, 1985). Furthermore, place-ment in more advanced coursework results in more positive school-relatedattitudes, fewer behavioral problems, and higher educational expectations,even after controls for prior achievement and educational plans (Berends,1994; Rosenbaum, 1980; Vanfossen, Jones, & Spade, 1987).
Regarding racial differences in track placement, the evidence is lessclear. Overall, African American students are enrolled in fewer advancedcourses than White students are. However, early national and regional stud-ies, relying on student self-reports, found that, net of socioeconomic back-ground and prior achievement, African American students were more likelythan White students to be in college-preparatory programs in high school(Alexander & Cook, 1982; Alexander, Cook, & McDill, 1978; Gamoran &Mare, 1989; Rosenbaum, 1980). Later researchers, using course-based track-ing indicators from transcript data to construct track location, found that, netof social class background and prior performance, there are essentially nodifferences in the probability of academic track placement between AfricanAmerican and White students (Kelly, 2004; Lucas & Gamoran, 2002).
As the tracking literature has become more sophisticated, a sharperfocus on specific subjects (such as mathematics) and enrollment in specificcourse titles (e.g., Algebra I) and course sequences (e.g., Algebra I, fol-lowed by Algebra II) have emerged. This is partly due to the fact that highschools vary not only in the number but also in the kind of curriculumtracks they use, including the coursework offered to students within par-ticular tracks and the amount of mobility or course taking allowed inclasses across tracks (Garet & DeLany, 1988; Hallinan & Kubitschek, 1999;Lucas, 1999; Stevenson et al., 1994). Similar to the findings regarding tracklocation and achievement, research shows that enrollment in more acade-mic and challenging coursework has a significant impact on achievement,regardless of parental education and income, prior grades, and test scores
Lleras
888 at PENNSYLVANIA STATE UNIV on March 5, 2016http://aerj.aera.netDownloaded from
(Gamoran, 1987; Gamoran & Mare, 1989; Hallinan, 1987; Jencks & Phillips,1999; Pallas et al., 1994; Vanfossen et al., 1987).
Research also suggests that a student’s learning opportunities at onepoint in time strongly determines future opportunities to learn either directlyor indirectly. For example, enrollment in a particular course may directlyimpact future course taking if the class is a prerequisite for taking futureclasses (Stevenson et al., 1994). Current classes may also influence futurecourse-taking patterns since students experiencing better learning opportu-nities typically learn more and thus secure a positional advantage over otherstudents with poorer or fewer opportunities to learn. Indeed, prior course-work and achievement test scores, particularly in mathematics and English,are strongly related to track placement and course-taking patterns duringhigh school (Gamoran, 1992; Gamoran & Mare, 1989; Hallinan, 1991; Lucas,1999; Oakes, 1985; Rosenbaum, 1980; Stevenson et al., 1994). If AfricanAmerican students are more likely to be enrolled in lower math classes dur-ing middle school, they could have fewer opportunities to take moreadvanced math classes directly or indirectly by influencing their skills andknowledge of math prior to entering high school.
Student Engagement, Opportunities to Learn, and Achievement
Learning requires not only the opportunity to learn but also studenteffort and engagement with the course material. Surprisingly, this has beensomewhat neglected in recent studies of tracking and achievement(Carbonaro, 2005). Thus, a principal contribution of the current study is toexamine the role of school engagement, alongside course-taking patterns, inthe determination of achievement for African American and White studentsin different school contexts.
Student effort may exert both direct and indirect effects on achievement.Students who try hard in school are likely to be rewarded with bothincreased achievement and higher curriculum placement. Empirical evidenceshows that students who are more attentive in class, spend more time on andcomplete homework, and avoid disruptive behaviors have higher cognitivegains (Ainsworth-Darnell & Downey, 1998; Farkas, 1996; Farkas, Grove,Sheehan, & Shaun, 1990) and greater educational attainment (Rosenbaum,2001; Lleras, 2008). Student effort also typically increases the student’s learn-ing opportunities. This is because teacher judgments and course grades arebased on effort and behavior as well as performance, and teachers use all ofthese to judge students and assign them to curricular tracks (Farkas, 1996;Farkas et al., 1990; Hallinan, 1996; Rosenbaum, 2001). Student effort may alsodepend on whether the student has acquired the prior skills and knowledgeneeded to engage effectively in the material presented in the class. In otherwords, students who do not have the ability to do the work may not exertas much effort, particularly if they feel they are too far behind to catch up.
Educational Inequality in Urban and Suburban Schools
889 at PENNSYLVANIA STATE UNIV on March 5, 2016http://aerj.aera.netDownloaded from

School Characteristics and the Learning Process
Research shows that track placement may depend on school as well asindividual student characteristics (Alexander & McDill, 1976; Gamoran,1987). Thus, school racial composition, as well as geographic location, mayinfluence learning outcomes in at least two ways: (a) via their impact on nor-mative processes, teacher-student relations, and peer interactions; and (b) byinfluencing the overall organizational structure within the school that in turnaffects the level and distribution of student learning opportunities. AfricanAmerican students in predominantly Black schools may be exposed to andexperience a less demanding curriculum, both in advanced and generalclasses as a result of lower teacher quality and expectations, and reducedaccess to more academic coursework compared to students in predomi-nantly White schools. Additionally, there is some evidence that teachers inpredominantly White schools teach at a higher level compared to teachersin minority schools (Dreeben & Gamoran, 1986; Mahard & Crain, 1983).Clearly, one reason this might be the case is that teachers often teach to theaverage level of students’ ability in their classrooms. Since the class averageis likely to be higher in predominantly White schools (Bankston & Caldas,1996; Roscigno, 1998), African American students may benefit more from tak-ing more advanced classes in those schools compared to minority schools(Mahard & Crain, 1983). On the other hand, African American students mayhave an increased chance of enrollment in the more advanced classesoffered in minority schools, due to lower discrimination by teachers andreduced competition from other students.
However, few studies have tested whether a student’s race interacts withschool characteristics to determine the student’s track location or course-tak-ing patterns in high school. Rather, studies that have considered racial com-position and other school characteristics have typically included thesecharacteristics as main effects in models predicting track assignment, con-trolling for student characteristics (Gamoran & Mare, 1989; Kilgore, 1991).Only a few researchers have included the percentage of Black students inthe school as a main effect predicting track enrollment, controlling for stu-dents’ race and ethnicity, student achievement, and social background(Gamoran & Mare, 1989; Lucas & Gamoran, 2002; Mickelson, 2001). Of thesestudies using nationally representative samples, researchers have generallyfound that as the proportion of Black students in high school increases, sodoes the likelihood that students will be placed in higher tracks, regardlessof race and whether student self-report or transcript data are used to con-struct track location (Gamoran & Mare, 1989; Lucas & Gamoran, 2002).
In one of the few empirical studies to examine the interaction betweena student’s race and the racial composition of the school in determining aca-demic track, Kelly (2004) finds similar results. Using data from the transcriptsurvey in the National Educational Longitudinal Study (NELS), Kelly (2004)shows that African American students are equally likely to take moreadvanced math coursework during the first 2 years of high school compared
Lleras
890 at PENNSYLVANIA STATE UNIV on March 5, 2016http://aerj.aera.netDownloaded from

to White students, controlling for prior math grades and math test scores (8thgrade). However, once an interaction term between the percentage ofAfrican American students in the high school and race is added to the model,the Black student coefficient becomes negative and statistically significant.These results suggest that African American students who attend predomi-nantly White schools are less likely to be enrolled in higher math coursesequences compared to similar Whites in the same kind of school.
In a recent study using internal data from the Charlotte-MecklenburgSchool District, Mickelson (2001) reaches a different conclusion. She arguesthat racial segregation operates via a variety of mechanisms to offer AfricanAmerican students in racially isolated schools fewer opportunities to learn.These include the assignment of less credentialed and experienced teachersand students to lower track courses in predominantly Black schools. One ofMickelson’s key findings is that students who attended racially isolated ele-mentary schools are more likely when they are in higher grades to be enrolledin lower track courses and to show lower school achievement. These find-ings are consistent with other research we have reviewed: Students that fallbehind early tend to fall further behind in later grade levels. These findingsalso highlight the role of school racial composition and curriculum place-ment in determining students’ educational achievement.
Over the past few decades, the U.S. population has also become moreconcentrated in suburban areas. Although racial and ethnic minorities con-tinue to be underrepresented in the suburbs, the share of minorities amongsuburban populations has been increasing rapidly. As a result, the numbersof Black children attending middle-class suburban schools is also rising(Farley & Frey, 1994; Reardon & Yun, 2001). However, recent empirical evi-dence shows that racial segregation and increasing poverty have oftenaccompanied minority suburbanization (Reardon & Yun, 2001). Thus, despitedeclines in Black-White residential segregation and an increase in the pro-portion of African American families residing in the suburbs, the majority ofAfrican American students remain concentrated in public schools where alarger portion of the population is low income and from a racial or ethnicminority background, regardless of whether they attend urban or suburbanschools (Farley & Frey, 1994). Furthermore, relatively little is known abouthow patterns of racial segregation may influence racial gaps in achievementdepending on the urbanicity of the school that the student attends. This studyexamines whether racial gaps in the learning process differ dependingnot only on the racial composition of the school but also the school’s urban,suburban, or rural location.
Current Study
Previous research shows that African American children enter elemen-tary school with less knowledge and skills than White children and continueto show lower academic achievement (both in terms of scores on standard-ized tests and in course grades) in subsequent grade levels (Jacobson et al.,
Educational Inequality in Urban and Suburban Schools
891 at PENNSYLVANIA STATE UNIV on March 5, 2016http://aerj.aera.netDownloaded from

Lleras
892
2001; Phillips, Crouse, et al., 1998). Among older students, there is also evi-dence that Black students initially fall further behind similar White students(e.g., same prior scores, socioeconomic status) in math achievement, forexample, during middle school and the first years of high school, comparedto other grades (Phillips, Crouse, et al., 1998). Of course, the amount learnedin each of these grades depends on the skills, knowledge, and effort the stu-dent brings to school, as well as the opportunities to learn provided by theschool (Carbonaro, 2005; Sørensen & Hallinan, 1977). Thus, racial gaps atany point in this learning process may have substantial implications forAfrican American students’ educational performance and success. At thesame time, and net of other variables, it has been found that high concen-trations of minority students are associated with lower achievement amongboth White and African American students (Bankston & Caldas, 1996;Roscigno, 1998). This is probably the result of a process in which lower per-formance, a less demanding curriculum, and lower student effort reinforceone another over time. However, this process has never been examined sep-arately for Low and High Minority schools.
Learning does not occur in a vacuum but takes place within the socialand organizational context of the school. Since most African American stu-dents attend racially segregated schools, the racial gap in achievement maybe partly due to different learning processes within Low and High Minorityschools. Furthermore, each school’s geographic location may influence theschool’s academic and social climate, thereby affecting student achievement.To examine the details of this process and its contribution to the Black-Whiteachievement gap, I estimate a series of models of the learning process inwhich the student’s race affects the student’s skills, engagement, and learn-ing opportunities, which in turn, affect one another over time, controlling forfamily background. Furthermore, I estimate how this process of learning dif-fers by the racial composition of the school the student attends as well asschool location.
Method
Data and Sample
This study uses data from the restricted base year and first follow-up sur-veys of the NELS (1988–1990). The NELS are a stratified nationally represen-tative sample of approximately 24,500 8th-grade students in 1,052 public andprivate schools who were followed up in the 10th grade (1990), in the 12thgrade (1992), 2 years after high school (1994), and 8 years after high school(2000). In 1992, NELS also included a high school transcript study, which col-lected data from over 14,000 students who had participated in NELS.
To estimate the over-time effects of student achievement, opportunitiesfor learning (courses taken), and student engagement on one another, Irestrict the sample to students who participated in both the base year (8thgrade) and first follow-up (10th grade) survey. Ideally, I would have preferredto conduct the analysis on students through the 12th grade. However, only
at PENNSYLVANIA STATE UNIV on March 5, 2016http://aerj.aera.netDownloaded from

half of the students in the 12th grade sample were selected to have surveysadministered to their teachers. Since the student engagement measure isbased on teacher reports, this would have severely reduced the sample sizeand limited my ability to examine cross-level interactions between studentand school characteristics. I simplify the racial comparison by restricting atten-tion to non-Hispanic White and African American students. I also limited thesample to students who attended public middle and comprehensive publichigh schools. Unlike magnet schools, comprehensive public schools aremeant to serve all students and typically have an academic or college prepara-tory course of specialization as well as more vocational courses. Only stu-dents with complete data were included in the analysis. These restrictionsyield a final sample of 6,063 White and 650 African American students in 660public middle schools and 667 comprehensive public high schools.
I restricted the sample to public schools for several reasons. First, pub-lic high schools serve approximately 97% of African Americans and 92% ofWhites. Second, a number of studies have demonstrated significant differ-ences in the academic and social organization of private compared to publicschools (Coleman & Hoffer, 1987). Finally, public high schools, particularlythose in urban areas, are differentiated into specialized or magnet schools(including school-within-a-school magnets) and comprehensive public highschools, with most public school students attending the latter type of school.Research shows important differences in the climate and curriculum betweenthe two types of public schools (Gamoran, 1996).
Student-Level Variables
Opportunities to Learn
I use data on student course-taking in mathematics to measure oppor-tunities for learning during the 8th through 10th grade. To measure the abil-ity level of the mathematics course in 8th grade, I use an item that askedwhether the student had attended (at least once a week) any of the follow-ing math classes during the school year: Algebra, General Mathematics, orRemedial Mathematics. These responses were recoded into an ordinal vari-able with three categories: Math Class (see Table 1 for further details).
Research indicates that transcript data are often more accurate than self-reports in measuring students’ course taking (Hallinan, 1994; Lucas &Gamoran, 2002). Unfortunately, in the NELS, transcripts are available for thestudents while they are in high school but not in middle school. Therefore,to measure learning opportunities in high school, I use information from thesecond follow-up transcript survey in the NELS on the combination of math-ematics courses students completed from the beginning of 9th through theend of 10th grade. These course codes were collapsed into an ordinal vari-able (Math Course Sequence) with five categories (see Table 1). Studentswere assigned to one of these five codes based on the highest math coursescompleted by the end of their sophomore year.
Educational Inequality in Urban and Suburban Schools
893 at PENNSYLVANIA STATE UNIV on March 5, 2016http://aerj.aera.netDownloaded from
894
Tab
le 1
R
ace-
Sp
ecif
ic M
ean
s an
d S
tan
dar
d D
evia
tio
ns
(Wei
gh
ted
) o
f V
aria
ble
s U
sed
in A
nal
yses
by
Rac
ial
Co
mp
osi
tio
n o
f S
cho
ol (
Nat
ion
al E
du
cati
on
al L
on
git
ud
inal
Stu
dy,
198
8–19
90)
Low
Min
ority
Sch
ools
Hig
h M
inority
Sch
ools
White
Stu
den
tsBla
ck S
tuden
tsW
hite
Stu
den
tsBla
ck S
tuden
ts
MSD
MSD
MSD
MSD
Stu
den
t-le
vel
char
acte
rist
ics
Opp
ortu
nit
ies
to le
arn
Mat
h c
lass
, 8t
h g
rade
1.70
.57
1.84
.57
1.61
.57
1.86
.55
1 =
atte
nds
alge
bra
.36
.48
.26
.44
.43
.50
.23
.42
2 =
atte
nds
regu
lar
mat
h.5
8.4
9.6
5.4
8.5
2.5
0.6
8.4
73
=at
tends
rem
edia
l m
ath
.06
.23
.10
.29
.04
.20
.09
.28
Mat
h c
ours
e se
quen
ce,
3.32
1.03
3.81
.99
3.30
1.05
3.73
1.03
10th
gra
de
1 =
Trigo
nom
etry
, ca
lculu
s,.0
4.2
0.0
2.1
4.0
5.2
1.0
2.1
5pre
calc
ulu
s2
=Alg
ebra
II an
d g
eom
etry
.15
.35
.07
.25
.16
.37
.09
.29
3 =
Alg
ebra
II or
geom
etry
.42
.49
.29
.46
.39
.49
.28
.45
4 =
Alg
ebra
I.2
3.4
2.3
3.4
7.2
5.4
3.3
4.4
75
=Le
ss than
Alg
ebra
I.1
6.3
6.2
9.4
5.1
5.3
6.2
6.4
4A
cad
emic
en
gage
men
tSt
uden
t ac
adem
ic.0
11.
00–.
151.
11–.
02.9
9–.
451.
30en
gage
men
t, 8t
h g
rade
Studen
t ac
adem
ic.0
1.9
9–.
331.
06–.
10.9
9–.
271.
02en
gage
men
t, 10
th g
rade
Aca
dem
ic a
chie
vem
ent
Mat
h tes
t sc
ore
, 8t
h g
rade
38.4
511
.59
30.3
09.
6037
.11
11.7
428
.65
8.09
Mat
h tes
t sc
ore
, 10
th g
rade
47.5
715
.50
38.9
316
.21
46.6
814
.05
36.7
214
.80
(con
tin
ued
)
at PENNSYLVANIA STATE UNIV on March 5, 2016http://aerj.aera.netDownloaded from
895
Tab
le 1
(co
nti
nu
ed)
Low
Min
ority
Sch
ools
Hig
h M
inority
Sch
ools
White
Stu
den
tsBla
ck S
tuden
tsW
hite
Stu
den
tsBla
ck S
tuden
ts
MSD
MSD
MSD
MSD
Mal
e.4
8.5
0.4
6.5
0.5
0.5
0.4
6.5
0Si
ngl
e-m
oth
er h
ouse
hold
.11
.31
.25
.43
.12
.33
.31
.46
Moth
er’s e
duca
tion
6.63
3.11
6.15
3.31
6.43
3.17
6.01
3.01
Low
soci
oec
onom
ic s
tatu
s.1
6.3
7.3
3.4
7.1
4.3
4.3
9.4
9
Sch
oo
l-le
vel
char
acte
rist
ics
Mid
dle
sch
ool c
ha
ract
eris
tics
Per
centa
ge r
ecei
ving
free
18
.43
15.7
822
.69
18.2
634
.08
17.0
243
.12
22.6
4or
reduce
d-p
rice
lunch
Per
centa
ge B
lack
3.37
5.20
11.7
47.
3538
.18
11.1
961
.54
25.1
9U
rban
.11
.31
.20
.40
.27
.44
.44
.50
Rura
l.4
0.4
9.3
5.4
8.4
1.4
9.3
5.4
8So
uth
.24
.42
.55
.50
.81
.40
.77
.42
Tota
l sc
hool en
rollm
ent
634.
7827
7.48
749.
1127
9.87
656.
0724
2.05
728.
1325
4.59
Hig
h s
choo
l ch
ara
cter
isti
csPer
centa
ge r
ecei
ving
free
14
.80
15.4
719
.28
18.8
428
.18
17.9
937
.32
20.8
5or
reduce
d-p
rice
lunch
Per
centa
ge B
lack
3.81
6.65
15.8
718
.82
35.0
816
.59
58.8
426
.86
Urb
an.1
2.3
2.2
4.4
3.2
8.4
5.4
4.5
0Rura
l.4
0.4
9.3
4.4
7.4
1.4
9.3
5.4
8So
uth
.23
.42
.55
.50
.81
.40
.77
.42
Tota
l sc
hool en
rollm
ent
1,09
5.57
621.
961,
321.
4959
7.60
1,19
5.42
524.
411,
291.
1557
1.80
N(u
nw
eigh
ted)
5,57
821
648
543
4
at PENNSYLVANIA STATE UNIV on March 5, 2016http://aerj.aera.netDownloaded from

Lleras
896
Academic Engagement
To measure student engagement and effort, I used three questions askedof both 8th and 10th grade teachers to evaluate the student’s attentiveness,disruptiveness, and homework habits. In the base year survey, 8th-gradeteachers were asked (1 = yes, 0 = no) whether the student was inattentive inclass, disruptive in class, and rarely completed homework. The dichotomousresponses were reverse coded and collapsed into a scale so that higher val-ues indicate higher levels of student engagement. In the first follow-up sur-vey, 10th-grade teachers were similarly asked to evaluate the extent to whichthe student was attentive in class, disruptive in class, and how often thestudent completed homework on time. Responses ranged from 1 (never) to5 (all the time) and were coded so that higher values indicated higher levelsof academic engagement. The 8th-grade and 10th-grade teacher responseswere averaged for each item before combining the items into two scales, rep-resenting Academic Engagement, with a mean of 0 and a standard deviationof 1.Both engagement scales have relatively high reliability, with a Cronbach’salpha of .74 for the 8th grade and .80 for the 10th grade.
Math Achievement
I measured math achievement via multiple-choice mathematics testsadministered to students at the end of 8th and 10th grades. I focused on math-ematics test scores for two reasons. First, prior studies have found that studentmathematics performance is influenced particularly strongly by classroominstruction (Farkas, 1996; Farkas et al., 1990; Gamoran & Berends, 1987;Roscigno & Ainsworth-Darnell, 1999; Slavin, 1989). Second, studies haveshown math test scores to be highly predictive of later educational and occu-pational success (Deluca & Rosenbaum, 2001; Rosenbaum, 2001).
Student-Level Controls
The analyses include several family background variables, includingfamily socioeconomic status, mother’s education, and family structure as indi-vidual-level control variables in the analyses. Family socioeconomic status is acomposite indicator provided in the NELS that combines standardized values ofthe mother’s and father’s occupation, educational attainment, and family incomeas reported by the parent in the base year of the survey (8th grade). I constructeda dummy variable for students in the bottom quintile of the socioeconomic dis-tribution as a control for students from disadvantaged households. The mother’shighest level of education from the parent survey is also included as a continu-ous variable in the analyses. Finally, a dummy variable is included for studentsliving in single-mother households and for male students in the sample.
School-Level Variables
The principal focus of this study is whether the feedback processesamong academic engagement, math course sequence, and math achievement
at PENNSYLVANIA STATE UNIV on March 5, 2016http://aerj.aera.netDownloaded from

operate differently in schools with higher and lower percentages of Blackstudents and for urban and suburban schools. While prior research has oftenincluded the percentage of minority students or White (non-White) studentsas a continuous variable in analyses of achievement, this study seeks to exam-ine whether the influence of individual and school-level predictors on theBlack-White achievement gap differs for students in more highly segregatedschool systems. Thus, I use an item available from the restricted principal(school) survey on what percentage of the student body was composed ofAfrican American students. I then divided 8th-grade students into two groups:students who attended High Minority middle schools where more than 25%of the student body was Black and students who attended Low Minority middleschools where less than 25% of the student body was made up of Black stu-dents. This resulted in a sample of 131 High Minority and 529 Low Minoritymiddle schools. The majority of students in the sample who attended a HighMinority middle school also attended a High Minority high school. I also cre-ated two dummy variables for middle and high schools located in urban andrural areas and include them as predictors in the analysis.
I also included four additional measures of 8th-grade and 10th-gradeschool characteristics derived from the principal (school) survey. To mea-sure poverty concentration, I used an item in the principal survey that indi-cated the percentage of students receiving free or reduced-price lunch.I included total school enrollment and a dummy variable for middle and highschools located in the South. Since there is variation within both kinds ofschools in the percentage of Black students (i.e., in the “Low Black” schools,students could attend schools with less than 1% Black students, up to 24%),I included a continuous variable for the percentage of Black students inthe school.
Statistical Model and Analysis Plan
The NELS data are multilevel. First, schools were sampled and then stu-dents within those schools were sampled. Given that ordinary least squaresanalysis of such data may produce biased slopes and standard errors due tocorrelated error structures, I use hierarchical linear modeling (HLM) to estimatethe equations. HLM deals with the complex error structures associated withnested data and model the cross-level interactions between the student-leveland school-level characteristics more appropriately (Bryk & Raudenbush,1992).
Since the primary interest of this study is to examine how opportunitiesto learn, student engagement, and math achievement influence one anotheracross different school contexts and contribute to the Black-White achieve-ment gap, all the exogenous variables (i.e., sex, single mother, mother’s edu-cation, and low socioeconomic status) were centered on the grand mean andfixed in all the analyses, with the exception of student’s race. In other words,the effects of these exogenous predictors are constrained to have a constanteffect on the outcomes across schools.
Educational Inequality in Urban and Suburban Schools
897 at PENNSYLVANIA STATE UNIV on March 5, 2016http://aerj.aera.netDownloaded from

Lleras
898
In the slopes-as-outcomes HLM model, student-level outcomes are afunction of the overall intercept: the main student-level predictors and thecross-level interactions between the student predictors and school charac-teristics. This model estimates the effect of race and other student-level pre-dictors on the within-school differences in the outcomes, as well as theinfluence of the school-level characteristics on the relationship between race,the endogenous student predictors, and the student-level outcomes. TheLevel 1 or student-level model estimates the variance of the outcome thatcan be attributed to differences among students within schools, withoutregard to differences between schools, is in the following form:
Yij = β0j + β1j (Black)ij + β2j (Math Test) ij + β3j (Math Class) ij
+ β4j (Academic Engagement) ij . . . Γij
The Level 2 or school-level model takes the following form:
β0j = γ00 + γ01 (Urban) + γ02 (Rural) . . . + u0j
β1j = γ10 + γ11 (Urban) + γ12 (Rural). . . + u1j
. . . β5j = γ50. . . + u5j
All the models include controls for sex and family background, as wellas the effects of the cross-level interactions between student-level predictorsand all other school characteristics.
To ease the interpretation and presentation of the results, the endoge-nous student-level predictors in the models (i.e., student effort, math courses,math achievement) have been centered on their group means and allowedto vary nonrandomly as a function of the school-level predictors in themodel. The intercept in each model represents the mean outcome for aWhite student in school j, adjusted for the mean of all the predictor variables.The Black coefficient represents the average racial gap or difference in theoutcome for Black relative to White students. The other student-level pre-dictors represent the average effect on the outcome across all schools. Theschool-level coefficients represent the effect of the school characteristics onthe slopes of the student predictors.
I begin by estimating an ordinal logistic model, regressing mathematicscourse taken in 8th grade on student’s race. Next, I regressed students’ acad-emic engagement in 8th grade on race and 8th-grade math class. Finally, 8th-grade math class and academic engagement are added sequentially intomodels predicting the mathematics test score at the end of 8th grade. Themajority of the analyses focus on the 10th-grade outcomes, estimating sepa-rate models for students attending Low and High Minority schools. I begin byestimating an ordinal logistic model using race, math class, student engage-ment, and mathematics test score in the 8th grade, as well as several school-level characteristics, to predict the student’s math course sequence in the first2 years of high school. Next, I regress 10th-grade student engagement on race,
(1)
(2)
at PENNSYLVANIA STATE UNIV on March 5, 2016http://aerj.aera.netDownloaded from

Educational Inequality in Urban and Suburban Schools
899
8th-grade measures of academic engagement and math test score, and mathcourse sequence in the first 2 years of high school. The mathematics test scorein 10th grade is then regressed on race, 8th-grade mathematics test score, and10th-grade student engagement and math course sequence in the first 2 yearsof high school.
Results
Descriptive Statistics
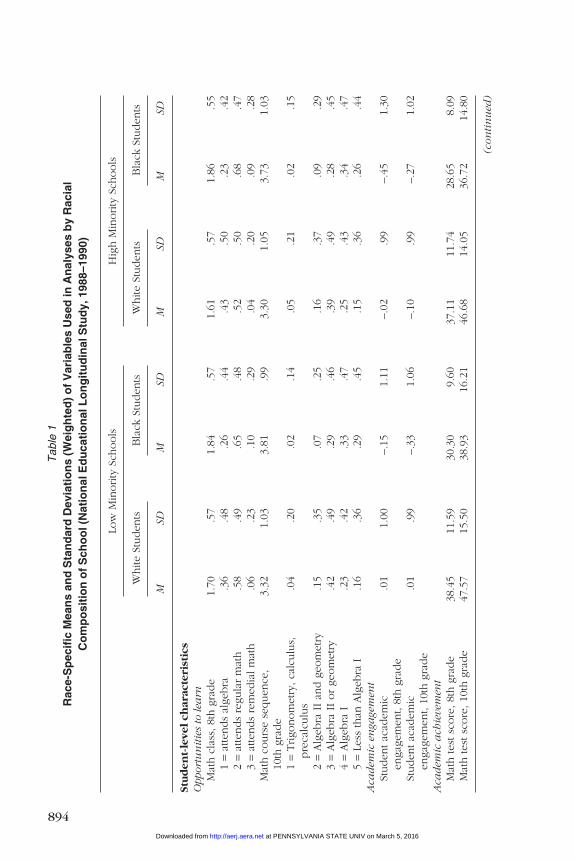
Table 1 shows the means and standard deviations of the variables, sep-arately for Black and White students within Low and High Minority schools.The means shown are weighted by the sample weight provided in the sec-ond wave of the NELS. Both 8th-grade and 10th-grade course placementsfor Black students are similar across the two school types. By comparison,Whites have considerably higher course placement within each school type.The 8th-grade White distribution across math courses is similar across thetwo school types but somewhat higher in High Minority compared to LowMinority schools. However, this modest difference narrows and almost dis-appears in 10th grade, so that Whites get very little course taking advantageby being in High Minority rather than Low Minority schools. Thus, coursetaking is distinct by racial group, but for each group, similar across Low andHigh Minority schools.
In looking at school engagement, at both time periods and in bothschool types, White students are judged by their teachers to have betterschool engagement than African American students. The Black-Whiteengagement gap grows in Low Minority schools between 8th and 10thgrades and declines in High Minority schools. Mathematics test scores showa tendency to vary more by racial group than by school type. Thus, 8th-gradescores show Whites averaging 38.5 in Low Minority schools and 37.1 in HighMinority schools, whereas African Americans average 30.3 in Low Minorityschools and 28.7 in High Minority schools. By 10th grade, Whites havegained, on average, 9 points in each school type, and African Americanshave gained, on average, 8 points in each school type. Thus, the Black-Whiteachievement gap increases slightly within each school type between 8th and10th grades. In addition, among African American students, the math gapacross Low and High Minority schools increases over time. In 8th grade,African American students in High Minority schools scored 1.65 points belowBlack students in Low Minority schools, and by 10th grade, African Americanstudents in High Minority schools scored 2.21 points below African Americanstudents in Low Minority schools.
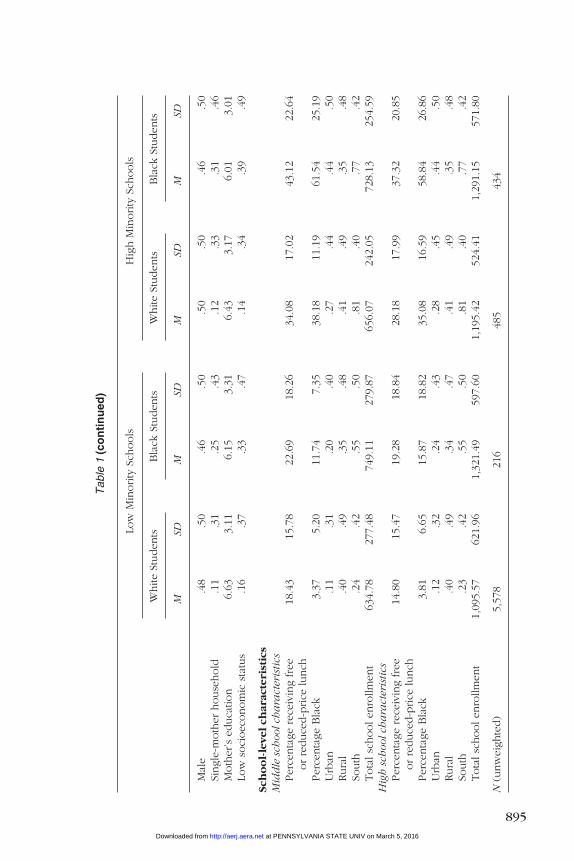
The control variables have characteristic distributions for each racialgroup, and these are generally similar across Low and High Minority schools.Thus, within each school type, African American students have a highershare of single mother and low socioeconomic households, whereas Whitesaverage higher levels of mother’s education. Similar patterns apply to aver-age school-level characteristics for each race group across the two school
at PENNSYLVANIA STATE UNIV on March 5, 2016http://aerj.aera.netDownloaded from

types. The exception is that both Black and White students who attendschools with a higher percentage of African American students are also muchmore likely to attend urban schools and schools with high concentrations ofpoverty.
HLM Regression Results for Eighth Grade Outcomes
Table 2 presents the final intercept and slopes-as-outcome HLM modelspredicting 8th-grade math class, academic engagement, and math achievementtest score. This table gives us a picture of where 8 school years of differentialopportunities and experiences place students by the end of the 8th grade, andspecifically, whether African American students in High Minority schools areparticularly disadvantaged. All analyses include school-level controls forschool size, region, and poverty composition, as well as individual-level con-trols for family socioeconomic background, single-mother household, mater-nal educational attainment, and sex. Since individual level predictors werecentered on their group means, the intercept can be interpreted as the meanoutcome (i.e., math class, academic engagement, math achievement) in schoolj. The Black coefficient essentially represents the Black-White gap in school jor the mean difference between Black and White students in math class,engagement, and achievement. The other predictors in the models (math classand academic engagement) represent the differentiating effect of these pre-dictors on the outcome in school j or the degree to which differences in mathclass and engagement among students in school j relates to the outcome. Theurban and rural coefficients represent the extent to which the intercept andslopes move up or down and represent the extent to which the effects of thepredictors differ by school location.
The first endogenous outcome is 8th-grade math class estimated sepa-rately for students in Low and High Minority schools via an ordered logisticHLM model (Model 1). On average, students in both Low and High Minorityschools are less likely to have taken higher math classes by the end of 8thgrade. However, students in urban and rural High Minority schools have aneven lower chance of completing higher level math courses by the end of 8thgrade. In contrast, there are no effects of school location on math class takenin 8th grade in Low Minority schools. The Black-White gap indicates that with-out controls for prior achievement, African American students are significantlyless likely to take higher math classes compared to White students, particu-larly in High Minority schools. While the effects of school location on theBlack-White math class gap are not significant, it is interesting to note that theBlack-White gap in 8th-grade math class is greatest in suburban High Minorityschools, followed by urban High Minority schools. Overall, these results indi-cate that African American students are less likely to leave 8th grade havingtaken higher level math courses such as pre-Algebra compared to their Whiteclassmates, particularly if they are in High Minority schools.
The second columns show the results from the HLM slopes-as-outcomesmodel predicting teacher’s judgments of students’ effort in class (academic
Lleras
900 at PENNSYLVANIA STATE UNIV on March 5, 2016http://aerj.aera.netDownloaded from

Educational Inequality in Urban and Suburban Schools
901
engagement) during 8th grade (Model 2). Note that math class has beenrecoded so that higher values correspond to a higher math class. On aver-age, students in Low Minority schools are rated as having slightly betteroverall engagement. In contrast, students in High Minority schools havesignificantly lower engagement. Furthermore, African American students inHigh Minority urban schools have lower engagement (approximately onehalf a standard deviation) compared to African American students in LowMinority urban schools. The patterns of the Black-White gap in engagementlook very similar to those for math class. The Black-White engagement gapis virtually zero in Low Minority suburban, urban, and rural schools, indi-cating that there are really no differences between African American and
Table 2 Dynamics of the Black-White Gaps in 8th-Grade Math Class, Academic
Engagement, and Math Achievement by Racial Composition of School and School Location
School Racial Composition
Low Minority School High Minority School
8th Math 8th Academic 8th Math 8th Math 8th Academic 8th MathClassa Engagement Achievement Classa Engagement Achievement
Fixed Effect (Model 1) (Model 2) (Model 3) (Model 1) (Model 2) (Model 3)
School meanBase –0.691*** 0.011 37.768*** –0.734*** –0.210*** 32.742***Urban –0.185 0.016 1.650* –0.384* –0.057 –2.441*Rural –0.072 0.127*** 0.369 –0.454* –0.086 –2.259
BlackBase –0.463† –0.018 –3.800*** –0.894*** –0.172 –6.208***Urban –0.426 –0.033 0.866 0.225 –0.093 2.041Rural 0.193 0.011 –1.430 –0.118 –0.019 1.817
Math class,8th gradeBase .333*** 8.832*** 0.358*** 7.292***Urban –0.088 0.977 0.253 1.604Rural 0.025 –0.496 0.107 2.171
Academicengagement,8th gradeBase 1.809*** 1.914***Urban 0.161 0.447Rural 0.486 –0.495
Threshold 2 3.755*** 3.536***
Note. All models include controls for school size, school poverty, percentage Black, region, student’ssex, single-mother household, mother’s education, and family socioeconomic status.aOrdered logit HLM model, logit coefficients with positive values indicate a greater likelihood of beingin higher level math class in 8th grade. All coefficients in the model are unweighted.†p < .10. *p < .05. ***p < .001. (two-tailed tests)
at PENNSYLVANIA STATE UNIV on March 5, 2016http://aerj.aera.netDownloaded from
White students in their teacher reports of school-related behaviors acrossschool location. However, the Black-White engagement gap is substantiallygreater in High Minority schools, particularly if the schools are located inurban and rural areas.
The coefficient for Math Class indicates that taking higher level mathcourses is associated with better teacher reports of academic engagement inLow and High Minority schools. The effects of math class on teacher reportsof engagement are also greater for students if they are in High Minority urbanschools. Thus, although African American students are less likely than simi-lar White students to take higher level math classes in High Minority urbanschools, the benefits of taking a higher level math class on engagement areactually stronger in these kinds of schools.
So far, the results from the first two models of 8th-grade math class andacademic engagement indicate that racial gaps may operate differently inLow and High Minority schools, as well as across suburban and urban con-texts. The third columns of this table show the results from the HLM modelpredicting 8th-grade mathematics achievement (Model 3). The interceptagain shows that on average, students who attend High Minority schools aredisadvantaged. Overall, the mean achievement at the end of 8th grade issubstantially lower for students in High Minority compared to Low Minoritysuburban schools. In addition, within Low Minority schools, students in urbanschools actually have significantly higher overall math achievement com-pared to students in suburban schools. However, the exact opposite is truewithin High Minority schools. On average, students in High Minority urbanschools leave 8th grade having significantly lower mathematics test scorescompared to students in High Minority suburban schools. The same is alsotrue for rural schools, but the effect fails to reach significance.
Net of the control variables, as well as the causally prior math class andacademic engagement variables, African American students score signifi-cantly lower than Whites in both Low and High Minority schools. This racialmathematics test gap in 8th grade also appears to be substantially larger inHigh Minority compared to Low Minority suburban schools. As in the mod-els of math class, the largest Black-White gap in achievement is in HighMinority suburban schools, followed by High Minority rural and urbanschools.
As for the effects of math class and academic engagement, they are pos-itive and statistically significant. The effect of math class on achievement alsoappears to be larger in Low Minority than in High Minority suburban schools.That is, the learning pay-off for being in a more advanced mathematics classis larger in Low Minority suburban schools. However, the pay-off in terms ofachievement for students who take higher math in High Minority urbanschools is similar to students in Low Minority suburban schools. Academicengagement also seems to help boost academic achievement more in HighMinority versus Low Minority schools, with the largest coefficient for studentsin High Minority urban schools.
Lleras
902 at PENNSYLVANIA STATE UNIV on March 5, 2016http://aerj.aera.netDownloaded from

HLM Regression Results for 10th-Grade Outcomes
Table 3 shows the analysis of 10th-grade outcomes, again estimated sep-arately for students in Low and High Minority schools. The first model (Model1) shows the results from the HLM ordered logit model predicting math coursesequence during the first 2 years of high school. As in the results for 8th-grademath class, on average, students are less likely to take higher math coursesduring their first 2 years of high school. In High Minority schools, there is aslight negative effect on course taking in urban and rural schools, but the coef-ficients fail to reach significance. African American students in both Low andHigh Minority schools are not significantly less likely than Whites to completehigher levels of math in 9th and 10th grades, net of causally prior variables:math class, academic engagement, and math achievement in 8th grade. Thisreplicates previous findings that show that once prior achievement is con-trolled, no racial differences in track placement persist (Kelly, 2004; Lucas &Gamoran, 2002). However, comparing African American students’ course-taking patterns across the two types of schools reveals some important differ-ences. While African American students in Low Minority urban schools areactually more likely than Whites to take higher level math courses during thefirst 2 years of high school, just the opposite is true in High Minority, urbanschools. Furthermore, African American students in rural High Minority schoolsare significantly less likely to take higher math courses compared to their Whiteclassmates. Within High Minority schools, the racial gap in math courses is vir-tually zero in suburban schools. This is different from the models predicting8th-grade math class, where the gap was actually highest in suburban HighMinority schools. This result suggests that much of the gap in suburban schoolsis accounted for by prior achievement, coursework, and engagement.Whereas, the racial gaps in High Minority urban and rural schools is still pre-sent and quite large, even after controlling for these variables. AfricanAmerican students attending these kinds of schools are much less likely to takehigher math courses even after controlling for prior math achievement andmath class in 8th grade.
As for the causally prior endogenous variables, they are significant andin expected directions. That is, prior math class, student effort or engage-ment, and math achievement are all positively related to 9th-grade and 10th-grade mathematics course taking. These effects are of similar magnitudeacross the two types of suburban schools, but prior academic engagementseems to be a more important predictor of high school math sequence forstudents from High Minority compared to Low Minority schools. Once again,the urbanicity of the school also makes a difference. Prior math class is morestrongly related to math course-taking patterns in high school in HighMinority schools located in urban areas. Thus, on average, students attend-ing High Minority schools who take a higher math class in 8th grade aremuch more likely to enroll in higher math courses if they attend urban HighMinority high schools. This demonstrates that the stability of course place-ment over time is much greater in High Minority urban schools and suggests
Educational Inequality in Urban and Suburban Schools
903 at PENNSYLVANIA STATE UNIV on March 5, 2016http://aerj.aera.netDownloaded from

Lleras
904
Table 3 Final HLM Models Regressing 10th-Grade Math Course Sequence, Academic
Engagement, and Math Achievement on Race and 8th and 10th Grade Variables by Racial Composition and School Location
School Racial Composition
Low Minority School High Minority School
10th Math 10th Academic 10th Math 10th Math 10th Academic 10th MathClassa Engagement Achievement Classa Engagement Achievement
Fixed Effect (Model 1) (Model 2) (Model 3) (Model 1) (Model 2) (Model 3)
School meanBase –5.554*** 0.000 47.187*** –5.131*** –0.150*** 41.874***Urban 0.011 0.063 0.970 –0.254 –0.225* –4.898**Rural –0.281 0.019 0.068 –0.341 –0.080 –2.836
BlackBase –0.156 –0.113 –1.729† –0.065 –0.060 –0.260Urban 0.442 0.110 0.096 –0.745 0.206 –1.837Rural –0.422 –0.059 –1.345 –1.118** 0.106 –1.442
Math class,8th gradeBase 1.237*** 1.105***Urban 0.056 0.895*Rural –0.169 0.529
Academicengagement,8th gradeBase 0.427*** 0.306*** 0.530*** 0.282***Urban 0.051 –0.027 –0.339 0.013Rural –0.032 0.069 –0.243 –0.008
Math achievement,8th gradeBase 0.137*** 0.011*** 0.715*** 0.119*** 0.007† 0.849***Urban 0.005 –0.003 –0.031 –0.026 0.009 –0.281**Rural 0.003 0.001 –0.073† –0.015 0.001 –0.338**
Math coursesequence,10th gradeBase 0.186*** 2.977*** 0.186*** 1.940**Urban 0.110† 0.855 –0.018 3.811*Rural 0.004 1.100† 0.077 3.296*
Academicengagement,10th gradeBase 0.410† 0.670Urban –1.563† 0.224Rural 0.177 1.773
Threshold 2 2.644*** 2.116***Threshold 3 6.319*** 5.579***Threshold 4 8.498*** 7.606***
Note. All models include controls for school size, school poverty, percentage Black, region, student’ssex, single-mother household, mother’s education, family socioeconomic status.aLogit coefficients from ordered logit slope-as-outcome HLM model where a positive coefficient indi-cates a greater likelihood that student has taken higher math course sequence (i.e., Algebra 2 andGeometry or higher math) by end of 10th grade.†p < .10. *p < .05. **p < .01. ***p < .001. (two-tailed tests).
at PENNSYLVANIA STATE UNIV on March 5, 2016http://aerj.aera.netDownloaded from

Educational Inequality in Urban and Suburban Schools
905
that students who fail to take higher math courses early on in the schoolingprocess may be at a particular disadvantage later on if they are in HighMinority urban schools.
Model 2 presents the results from the HLM model predicting 10th-gradeacademic engagement. On average, students in minority schools have sig-nificantly lower engagement, particularly if those schools are located inurban areas. There are no significant differences between African Americanand White students in levels of academic engagement. Prior engagement,math achievement, and math course sequence all have positive and signifi-cant effects on 10th-grade engagement in Low and High Minority schools.However, the effect of math course sequence on academic engagement dif-fers between urban Low and High Minority schools. In Low Minority urbanschools, students who take higher math courses during the first 2 years ofhigh school are significantly more likely to have better engagement. However,just the opposite is true in High Minority urban schools. In these schools,taking more challenging math courses does not result in better ratings ofacademic engagement from teachers.
Model 3 presents the analysis of 10th-grade mathematics achievement.On average, the students in Low Minority schools have much higher academicachievement compared to students in High Minority schools. There are nosignificant effects of school location on average math achievement scores inLow Minority schools. However, mean math achievement is significantlylower in High Minority urban schools, even after controlling for prior mathachievement, math course sequence, and academic engagement. As in theanalysis of 8th-grade math achievement, African American students in HighMinority urban schools have much lower achievement compared to AfricanAmerican students in Low Minority urban schools (more than 11 standarddeviations). While the urban coefficient is not significant, the size and direc-tion again suggests that students in predominantly Black, urban schools areparticularly disadvantaged. In the average urban High Minority high school,African American students scored 2.097 points behind their White classmates.The Black-White achievement gap in the average suburban High Minorityhigh school was only .260 points. By contrast, in Low Minority high schools,the Black-White gap continues to be significant in suburban high schools,even after controlling for prior achievement, engagement, and math coursetaking. In the average suburban Low Minority high school, African Americanstudents are 1.729 points behind their White classmates.
The causally prior endogenous variables are significant and in expecteddirections. That is, prior math class, academic engagement, and math achieve-ment are all positively related to math achievement (except for the effect ofengagement on achievement in High Minority schools). In looking at theeffects of prior math achievement, the results again show that school locationmakes a difference. In urban and rural High Minority schools, the stability ofmath achievement over time is much lower, on average, compared to studentsattending suburban High Minority schools. This suggests that the averagegains in mathematics made by students in urban and rural High Minority
at PENNSYLVANIA STATE UNIV on March 5, 2016http://aerj.aera.netDownloaded from

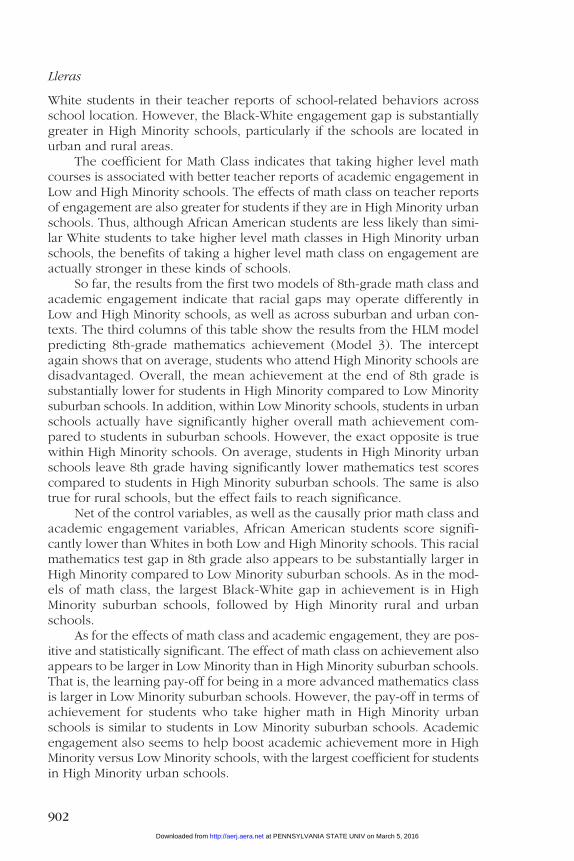
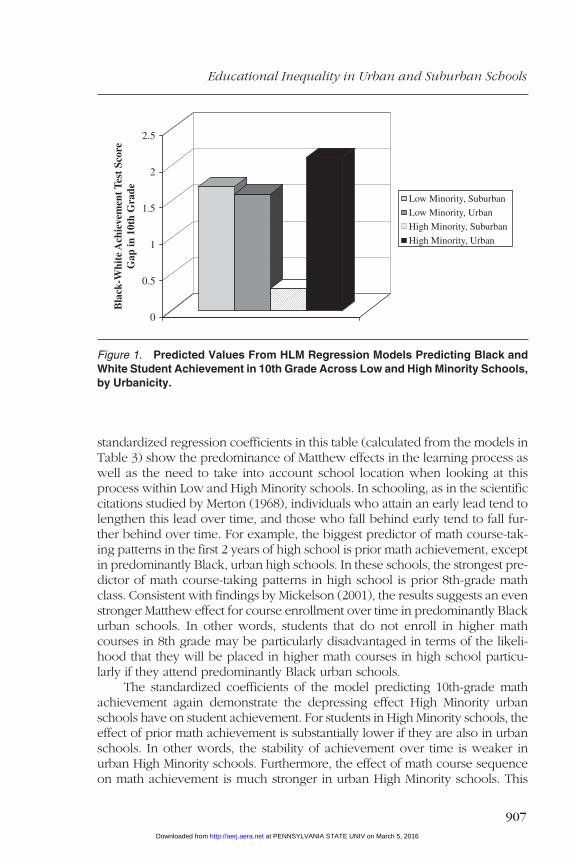
schools were significantly lower than those made by students in suburbanHigh Minority schools. In looking at the effects of math course sequence onmathematics gains over the 2-year period, again there are significant differ-entiating effects by school location. In High Minority schools, the academicpay-off for taking higher level math classes is substantially greater if studentsare in urban or rural schools. Conversely, students who do not take morechallenging math courses are particularly disadvantaged in terms of mathachievement if they are in these kinds of schools. Again, the same pattern istrue in Low Minority schools, but the effects are not nearly as large and strik-ing as in High Minority schools. This supports Kerckhoff and Glennie’s (1999)statement of the “Matthew effect” in schooling: As students progress throughthe grade levels, “the rich get richer and the poor get poorer” so that place-ment and performance gaps tend to increase. However, even with controlsfor prior achievement, math course-taking in 9th and 10th grades, and cur-rent engagement, the Black-White mathematics achievement gap is wideningbetween 8th and 10th grades, particularly in High Minority urban schools (seeFigure 1). Figure 1 shows the predicted achievement gaps between AfricanAmerican and White students between 8th and 10th grades, calculatedfrom the predicted values in Model 3 of Table 3 (base and base + urbancoefficients). The predicted gaps include controls for 8th-grade math achieve-ment test score, 10th-grade engagement, math course sequence in 9th and10th grades, family background, and other school characteristics.
Conclusion
This study has sought to extend our understanding of the micro processesunderlying Black-White differences in school achievement. In particular, thisstudy has investigated whether the schooling feedback process among mathplacement, engagement, and achievement differs across predominantly Black(High Minority) and predominantly White (Low Minority) schools. Furthermore,I have examined how initial racial gaps in math course placement, engagement,and achievement played out over time in Low and High Minority urban, rural,and suburban schools. Overall, the results indicate that math course placement,engagement, and student achievement positively affect one another over time,and these effects occur within both Low and High Minority schools. That is, lessdesirable habits and lower skills in middle school translate into even greatergaps in skills, habits, and achievement in high school. In most schools, thelower achievement gains by African American students compared to White stu-dents are almost entirely accounted for by differences in prior achievement,math course sequence, and to a lesser extent, current engagement. However,substantial racial gaps in math achievement remain in suburban Low Minorityschools as well as urban and rural High Minority schools, even after controllingfor prior math score, math courses, and engagement.
The relative magnitudes of the effects of these three variables on oneanother over time and across Low and High Minority schools are summarizedin Table 4. Note that the outcome variables are centered in the table. The
Lleras
906 at PENNSYLVANIA STATE UNIV on March 5, 2016http://aerj.aera.netDownloaded from
Educational Inequality in Urban and Suburban Schools
907
standardized regression coefficients in this table (calculated from the models inTable 3) show the predominance of Matthew effects in the learning process aswell as the need to take into account school location when looking at thisprocess within Low and High Minority schools. In schooling, as in the scientificcitations studied by Merton (1968), individuals who attain an early lead tend tolengthen this lead over time, and those who fall behind early tend to fall fur-ther behind over time. For example, the biggest predictor of math course-tak-ing patterns in the first 2 years of high school is prior math achievement, exceptin predominantly Black, urban high schools. In these schools, the strongest pre-dictor of math course-taking patterns in high school is prior 8th-grade mathclass. Consistent with findings by Mickelson (2001), the results suggests an evenstronger Matthew effect for course enrollment over time in predominantly Blackurban schools. In other words, students that do not enroll in higher mathcourses in 8th grade may be particularly disadvantaged in terms of the likeli-hood that they will be placed in higher math courses in high school particu-larly if they attend predominantly Black urban schools.
The standardized coefficients of the model predicting 10th-grade mathachievement again demonstrate the depressing effect High Minority urbanschools have on student achievement. For students in High Minority schools, theeffect of prior math achievement is substantially lower if they are also in urbanschools. In other words, the stability of achievement over time is weaker inurban High Minority schools. Furthermore, the effect of math course sequenceon math achievement is much stronger in urban High Minority schools. This
0
0.5
1
1.5
2
2.5
Bla
ck-W
hite
Ach
ieve
men
t Tes
t Sc
ore
Gap
in 1
0th
Gra
de
Low Minority, Suburban
Low Minority, Urban
High Minority, Suburban
High Minority, Urban
Figure 1. Predicted Values From HLM Regression Models Predicting Black andWhite Student Achievement in 10th Grade Across Low and High Minority Schools,by Urbanicity.
at PENNSYLVANIA STATE UNIV on March 5, 2016http://aerj.aera.netDownloaded from

Lleras
908
suggests that predominantly Black urban high schools may be particularly hardon students who are taking average or less challenging mathematics courses.
Two other findings help complete the picture of how the Black-White10th-grade gap in mathematics achievement is formed and relates to bothracial segregation and school urbanicity. First, the results show that althoughthe learning process looks similar in the two types of schools, racial segre-gation is detrimental to the overall learning process. Students in HighMinority middle schools leave 8th grade with lower math achievement, lowerstudent engagement, and having taken less demanding math classes com-pared to students in Low Minority middle schools. By the close of 10th grade,these initial disadvantages have cumulated into greater gaps in learning out-comes, particularly for students who attended predominantly Black urbanhigh schools. Second, the largest Black-White gap in achievement exists inHigh Minority urban schools and the smallest in High Minority suburbanschools (see Figure 1). Both results demonstrate the disadvantaged positionof White and particularly African American students who attend predomi-nantly Black urban schools compared to similar students in High Minoritysuburban or Low Minority schools.
Table 4 Standardized Regression Coefficients From Models Predicting Math Course
Sequence, Academic Engagement, and Math Achievement in 10th Gradeby Racial Composition Across Urban and Suburban Schools
Low Minority High Minority
Independent Variable Suburban Urban Suburban Urban
Math course sequence, 10th gradea
Math class, 8th grade 2.03 2.09 1.88 3.12 Academic engagement, 8th grade 1.53 1.61 1.88 1.25Math achievement, 8th grade 4.90 5.20 3.63 2.75
Math achievement, 10th grade
Math achievement, .53 .50 .60 .408th grade
Math class, 10th grade .20 .27 .13 .40Academic engagement, 10th grade .03 .07 .04 .06
Academic engagement, 10th grade
Academic engagement, .31 .28 .33 .358th grade
Math achievement, 8th grade .13 .09 .08 .17Math class, 10th grade .20 .31 .20 .18
aStandardized regression coefficients for ordered logit regression of math course sequence cal-culated by exp (b × SD of X) = change in odds for standard deviation increase X.
at PENNSYLVANIA STATE UNIV on March 5, 2016http://aerj.aera.netDownloaded from

Educational Inequality in Urban and Suburban Schools
909
This study highlights the importance of addressing early gaps in skills,academic engagement, and opportunities for learning as a way of reducingthe powerful feedback effects that foster incremental inequality throughoutthe schooling experience. However, since this study was restricted to theexperiences of older students in middle and high school, we still do notknow the magnitudes of these effects or how the details of the learningprocess impact students throughout the schooling experience. Therefore,one direction for future research is to examine the beginnings of the learn-ing process in elementary school to see how initial inequalities are exacer-bated or reduced by the learning environment provided by the school. Thenewly released Early Childhood Longitudinal Study offers the data neededto examine these processes within a national cohort of students beginningin elementary school. The results of this study also suggest that it is impor-tant to consider what role racial composition combined with school locationmay play in generating racial gaps in achievement. Indeed, future researchshould examine what aspects of suburban High Minority schools make themmore conducive to academic achievement among African American students.
Overall, the empirical results suggest that increased access to moreadvanced and rigorous coursework could have a significant impact onAfrican American math achievement directly and indirectly via improved stu-dent engagement and behavior, particularly in predominantly Black urbanschools. Since many African American students attend High Minority schoolswhere lower level courses predominate, they are less able to take advantageof the benefits of higher level coursework. Therefore, reforms that increasethe academic rigor of mathematics courses within high minority schools aswell as efforts aimed at desegregation are likely to reduce racial gaps in stu-dent achievement.
While policy makers have spent decades developing programs aimedat reducing inequalities among students, these interventions, primarilyfocused on improving test scores, have been largely unsuccessful. Ratherthan focusing solely on improving test scores, this study shows that schoolsmay also be able to impact educational trajectories by creating academic andsocial environments that foster both academic and behavioral developmentamong students. Universal preschool and the expansion of Head Start maygo a long way in reducing behavioral and learning disparities among chil-dren before the 1st grade. However, additional support, in the form of tutor-ing programs and improved access to challenging coursework are crucial toreducing the feedback effects from initial inequalities that foster racial dif-ferences in academic achievement throughout the schooling experience.
Note
The author’s research examines the micro processes involved in educational andlabor market stratification, with an emphasis on explaining race and class differences.Drawing on elements from human, cultural, and social capital theories, she examines howthe social structure embedded within families, schools, and neighborhoods interacts withhuman agency to influence life opportunities and success. This study was motivated by a
at PENNSYLVANIA STATE UNIV on March 5, 2016http://aerj.aera.netDownloaded from

Lleras
910
desire to understand how the structure of opportunities available to individuals and theirskills and behaviors affect one another over time to influence racial gaps in educationaloutcomes. The author’s hope is that this research will draw attention to the importance ofincreasing access to more advanced coursework and improving the academic rigor ofexisting courses as a way to reduce racial gaps in achievement.
References
Ainsworth-Darnell, J. W., & Downey, D. B. (1998). Assessing the oppositional cultureexplanation for racial/ethnic differences in school performance. AmericanSociological Review, 63, 536–553.
Alexander, K., & Cook, M. (1982). Curricula and coursework: A surprise ending to afamiliar story. American Sociological Review, 47, 626–640.
Alexander, K., Cook, M., & McDill, E. L. (1978). Curriculum tracking and educationalstratification. American Sociological Review, 43, 7–66.
Alexander, K., & McDill, E. (1976). School selection and allocation within schools:Some causes and consequences of curriculum placement. American SociologicalReview, 41, 963–80.
Bankston, C. L., & Caldas, S. J. (1996). Majority African American schools and socialinjustice: The influence of de facto segregation on academic achievement. SocialForces, 75, 535–555.
Berends, M. (1994). Educational stratification and students’ social bonding to school.British Journal of Sociology of Education, 16, 327–351.
Brown v. Board of Education, 347 U.S. 483, 74 S.Ct. 686, 98 L.Ed.2d. 873 (1954).Bryk, A. S., & Raudenbush, S. W. (1992). Hierarchical linear models. Newbury Park,
CA: Sage.Carbonaro, W. (2005). Tracking, students’ effort, and academic achievement.
Sociology of Education, 78, 27–49.Coleman, J. S., & Hoffer, T. (1987). Public and private high schools: The impact of
communities. New York: Basic Books.Deluca, S., & Rosenbaum, J. E. (2001). Individual agency and the life course: Do low
SES students get less long–term payoff for their school efforts? Sociological Focus,34, 357–374.
Dreeben, R., & Gamoran, A. (1986). Race, instruction, and learning. AmericanSociological Review, 51, 660–669.
Entwisle, D. R., & Alexander, K. L. (1992). Summer setback: Race, poverty, schoolcomposition, and mathematics achievement in the first two years of school.American Sociological Review, 57, 72–84.
Farkas, G. (1996). Human capital or cultural capital? Ethnicity and poverty groups inan urban school district. New York: de Gruyter.
Farkas, G. (2004). The black-white test score gap. Contexts, 3, 12–19.Farkas, G., Grobe, R., Sheehan, D., & Shuan, Y. (1990). Cultural resources and school
success: Gender, ethnicity, and poverty groups within an urban school district.American Sociological Review, 55, 127–142.
Farley, R., & Frey, W. H. (1994). Changes in the segregation of whites from blacksduring the 1980s: Small steps toward a more integrated society. AmericanSociological Review, 59, 23–45.
Friedkin, N. E., & Thomas, S. L. (1997). Social positions in schooling. Sociology ofEducation, 70, 239–255.
Gamoran, A. (1987). The stratification of high school learning opportunities. Sociologyof Education, 60, 135–155.
Gamoran, A. (1989). Rank, performance, and mobility in elementary school group-ing. Sociology Quarterly, 30, 109–123.
at PENNSYLVANIA STATE UNIV on March 5, 2016http://aerj.aera.netDownloaded from

Educational Inequality in Urban and Suburban Schools
911
Gamoran, A. (1992). The variable effects of high school tracking. AmericanSociological Review, 57, 812–828.
Gamoran, A. (1996). Student achievement in public magnet, public comprehensive, andprivate city high schools. Education Evaluation and Policy Analysis, 18, 1–18.
Gamoran, A., & Berends, M. (1987). The effects of stratification in secondary schools:Synthesis of survey and ethnographic research. Review of Educational Research,57, 415–435.
Gamoran, A., & Mare, R. (1989). Secondary school tracking and educational equal-ity: Compensation, reinforcement, or neutrality? American Journal of Sociology,94, 1146–1183.
Garet, M., & DeLany, B. (1988). Students, courses, and stratification. Sociology ofEducation, 61, 61–77.
Hallinan, M. T. (1987). The social organization of schools: New conceptualizations ofthe learning process. New York: Plenum.
Hallinan, M. T. (1991). School differences in tracking structures and track assign-ments. Journal of Research on Adolescence, 1, 251–275.
Hallinan, M. T. (1994). School differences in tracking effects on achievement. SocialForces, 72, 799–820.
Hallinan, M. T. (1996). Race effects on students’ track mobility in high school. SocialPsychology of Education, 1, 1–24.
Hallinan, M. T., & Kubitschek, W. N. (1999). Curriculum differentiation and highschool achievement. Social Psychology of Education, 3, 41–62.
Jacobson, J., Olsen, C., Rice, J. K., Sweetland, S., & Ralph, J. (2001). Educational achieve-ment and black-white inequality (Statistical Analysis Report 2001-061). Washington,DC: U.S. Department of Education, National Center for Education Statistics.Jencks, C., & Phillips, M. (Eds.). (1998). The Black-White test score gap.
Washington, DC: Brookings Institution.Jencks, C., & Phillips, M. (1999). Aptitude or achievement: Why do test scores pre-
dict educational attainment and earnings? In S. E. Mayer & P. E. Peterson (Eds.),Earning and learning: How schools matter (pp. 15–48). Washington DC:Brookings Institution.
Jones, J. D., Vanfossen, B. E., & Ensminger, M. (1995). Individual and organizationalpredictors of high school track placement. Sociology of Education, 68, 287–300.
Kelly, S. (2004). Do increased levels of parental involvement account for social classdifferences in track placement? Social Science Research, 33, 626–659.
Kerckhoff, A., & Glennie, E. (1999). The ‘Matthew effect’ in American education.Research in Sociology of Education and Socialization, 12, 35–66.
Kilgore, S. (1991). The organizational context of tracking in schools. AmericanSociological Review, 56, 189–203.
Lleras, C. (2008). Do skills and behaviors in high school matter? The contribution ofnoncognitive factors in explaining differences in educational attainment andearnings. Social Science Research, 37, 888–902.
Lucas, S. R. (1999). Tracking inequality. New York: Teachers College Press.Lucas, S. R., & Gamoran, A. (2002). Tracking and the achievement gap. In J. E. Chubb
& T. Loveless (Eds.), Bridging the achievement gap (pp. 171–198). Washington,DC: Brookings Institution.
Mahard, R. E., & Crain, R. L. (1983). Research on minority achievement in desegre-gated schools. In C. H. Rossell & W. D. Hawley (Eds.), The consequences ofschool desegregation (pp. 103–125). Philadelphia: Temple University Press.
Merton, R. (1968). The Matthew effect in science. Science, 199, 155–163.Mickelson, R. A. (2001). Subverting Swann: First and second-generation segregation
in the Charlotte-Mecklenburg schools. American Educational Research Journal,38, 215–252.
at PENNSYLVANIA STATE UNIV on March 5, 2016http://aerj.aera.netDownloaded from
Lleras
912
Oakes, J. (1985). Keeping track. New Haven, CT: Yale University Press.Oakes, J., Gamoran, A., & Page, R. N. (1992). Curriculum differentiation:
Opportunities, outcomes, and meanings. In P. W. Jackson (Ed.), Handbook ofresearch on curriculum (pp. 570–608). Washington, DC: American EducationalResearch Association.
Orfield, G., & Yun, J. T. (1999). Resegregation in American schools. Cambridge, MA:The Civil Rights Project at Harvard University.
Pallas, A., Entwisle, D., Alexander, K., & Stluka, M. (1994). Ability-group effects:Instructional, social, or institutional? Sociology of Education, 67, 27–46.
Phillips, M., Brooks-Gunn, J., Duncan, G., Klebanov, P., & Crane, J. (1998). Familybackground, parenting practices, and the black-white test-score gap. In C. Jencks& M. Phillips (Eds.), The black–white test score gap (pp. 103–148). Washington,DC: Brookings Institution.
Phillips, M., Crouse, J., & Ralph, J. (1998). Does the black-white test score gap widenafter children enter school? In C. Jencks & M. Phillips (Eds.), The black-white testscore gap (pp. 229–272). Washington, DC: Brookings Institution.
Reardon, S. F., & Yun, J. T. (2001). Suburban racial change and suburban schoolsegregation, 1987–1995. Sociology of Education, 74, 79–101.
Roscigno, V. J. (1998). Race and the reproduction of educational disadvantage. SocialForces, 76, 1033–1061.
Roscigno, V. J., & Ainsworth-Darnell, J. W. (1999). Race and cultural/educationalresources: Inequality, micro-political processes, and achievement returns.Sociology of Education, 72, 158–178.
Rosenbaum, J. (1980). Track misperceptions and frustrated college plans: An analy-sis of the effects of tracks and track perceptions in the National LongitudinalSurvey. Sociology of Education, 53, 74–88.
Rosenbaum, J. (2001). Beyond college for all: Career paths for the forgotten half. NewYork: Russell Sage.
Slavin, R. E. (1989). Achievement effects of ability grouping in secondary schools:A best-evidence synthesis. Review of Educational Research, 60, 471–499.
Sørensen, A. B., & Hallinan, M. T. (1977). A reconceptualization of school effects.Sociology of Education, 50, 273–289.
Stevenson, D. L., Schiller, K., & Schneider, B. (1994). Sequences of opportunities forlearning. Sociology of Education, 67, 194–198.
Vanfossen, B. E., Jones, J. D., & Spade, J. Z. (1987). Curriculum tracking and statusmaintenance. Sociology of Education, 60, 104–122.
Manuscript received January 27, 2007Revision received October 9, 2007
Accepted February 8, 2008
at PENNSYLVANIA STATE UNIV on March 5, 2016http://aerj.aera.netDownloaded from