racial and ethnic disparities by gender in health care in ... · shown separately for women and men...
TRANSCRIPT

RACIAL A
ND
ETHNIC DISPARITIES BY GENDER IN HEALTH CARE in Medicare Advantage
April 2017
CMS Office of Minority Health in collaboration with the RAND Corporation

Background and Purpose
This report presents summary information on the quality of health care received by Medicare beneficiaries. Quality-‐of-‐care data are presented at the national level for both patient experience and quality-‐of-‐care measures and are shown for women and men of different racial/ethnic groups. This information may be of interest to Medicare beneficiaries, Medicare Advantage organizations and prescription drug plan sponsors, and others interested in better understanding how the care received by racial/ethnic minority groups compares with the care received by Whites of the same gender.
In all, this report provides data regarding 8 patient experience measures and 24 clinical care measures. The patient experience data were collected from a national survey of Medicare beneficiaries, known as the Medicare Consumer Assessment of Healthcare Providers and Systems (CAHPS) survey. This survey is administered each year; the data in this report are from the 2015 Medicare CAHPS survey. Examples of patient experience measures include how easy it is to get needed care, how well doctors communicate with beneficiaries, and how easy it is for beneficiaries to get information from their drug plans about prescription drug coverage and cost.
The clinical care data were gathered through medical records and insurance claims for hospitalizations, medical office visits, and procedures. These data, which are collected each year from Medicare health plans (Medicare Advantage plans) nationwide, are part of the Healthcare Effectiveness Data and Information Set (HEDIS). Examples of clinical care measures include whether beneficiaries received appropriate screening for colon cancer, whether beneficiaries with diabetes received a test that determines whether their blood sugar is under control, and whether appropriate treatment was provided to beneficiaries with chronic obstructive pulmonary disease. The HEDIS data reported here were collected in 2015.
In a companion report, Racial and Ethnic Disparities in Health Care in Medicare Advantage, racial/ethnic group comparisons are shown combining women and men. Here, racial and ethnic group comparisons are shown separately for women and men because there is evidence that racial and ethnic differences in health care may vary by gender. For both the patient experience and the clinical care measures, data are provided for women and men in 4 mutually exclusive racial/ethnic groups: (1) Asians or Pacific Islanders (including Native Hawaiians), (2) Blacks, (3) Hispanics, and (4) Whites. These groups were chosen because enough information was available to describe the care received by the beneficiaries in these groups.
The report first presents a pair of bar charts that show, separately for women and men, the number of patient experience measures (out of 8) for which members of each racial/ethnic minority group reported experiences of care that were worse than, similar to, or better than the experiences reported by Whites. Following these stacked bar charts are separate bar charts for each patient experience measure. These charts show, separately for women and men, the average score for each racial/ethnic group on a 0–100 scale. The average score represents the percentage of the best possible score for a given demographic group for that measure. For example, consider a measure for which the best possible score is 4 and the worst possible score is 1. If a given group’s score on that measure is 3.5, then that group’s score on a 0–100 scale is ([3.5−1]/[4−1])*100 = 83.3.
After the patient experience measures, the report presents a pair of stacked bar charts that show, separately for women and men, the number of clinical care measures (out of 24) for which members of each racial/ethnic minority group experienced care that was worse than, similar to, or better than the care experienced by Whites. Following these stacked bar charts are separate bar charts for each clinical care measure that show, separately for women and men, the percentage of beneficiaries in each racial/ethnic group whose care met the standard called for by the specific measure (e.g., a test or treatment).
For detailed information on data sources and analytic methods, see the appendix.
1

Disparities in Care: All Patient Experience Measures
Number of patient experience measures (of 8) for which women and men of selected racial/ethnic minority groups reported experiences that were worse than, similar to, or better than the
experiences reported by White women and men in 2015
Women Men
4 5
6
4 3
2
1
6 5
7
3 2
API vs. Black vs. Hispanic vs. API vs. Black vs. Hispanic vs.
White White White White White White
Worse than Whites Similar to Whites Better than Whites
Data source: These charts summarize data from all Medicare Advantage beneficiaries nationwide who participated in the 2015 Medicare CAHPS survey.
Key: API = Asian or Pacific Islander.
Notes: Racial groups such as Blacks and Whites are non-Hispanic; Hispanic ethnicity includes all races.
Within each gender, the relative difference between a selected group and Whites is used to assess disparities:
Better = Population had better patient experience than Whites did. Differences are statistically significant (p < 0.05), are equal to or larger than 3 points† on a 0–100 scale, and favor the selected racial/ethnic minority group.
Similar = Population and Whites had similar patient experiences. Differences are less than 3 points on a 0–100 scale or not statistically significant.
Worse = Population had worse patient experience than Whites did. Differences are statistically significant, are equal to or larger than 3 points on a 0–100 scale, and favor Whites.
Example: Compared with White women, Hispanic women reported worse patient experience for 2 of the 8 patient experience measures and similar experience for 6 of the measures.
† A difference that is considered to be of moderate magnitude. Paddison CA, Elliott MN, Haviland AM, Farley DO, Lyratzopoulos G, Hambarsoomian K, Dembosky JW, Roland MO. Experiences of care among Medicare beneficiaries with ESRD: Medicare Consumer Assessment of Healthcare Providers and Systems (CAHPS) survey results. Am J Kidney Dis. 2013;61, pp. 440–449.
2

Patient Experience: Getting Needed Care Percentage of the best-possible score (on a 0–100 scale) earned on how easy it is for patients to get
needed care,† by race/ethnicity within gender, 2015
Women Men
82.6 82.3 85.2 85.6
0
20
40
60
80
100
Pe
rcen
tage
of
bes
t-p
oss
ible
sc
ore
* * (−)
78.0 84.1 83.9 86.6
* (−) * *
Data source: Medicare CAHPS survey, 2015.
Key: API = Asian or Pacific Islander.
Note: Racial groups such as Black and White are non-Hispanic; Hispanic ethnicity includes all races.
* Significantly different from the score for Whites of the same gender (p < 0.05).
For statistically significant differences between Whites and racial/ethnic minorities of the same gender, the following symbols are also used when applicable:
(+) Difference is equal to or larger than 3 points (prior to rounding) and favors the racial/ethnic minority group.
(−) Difference is equal to or larger than 3 points (prior to rounding) and favors Whites.
Disparities
o In the 2015 data, Black women and API women reported worse†† experiences getting neededcare than White women reported. The difference between Black women and White women wasgreater than 3 points on a 0–100 scale. The difference between API women and White womenwas less than 3 points on a 0–100 scale. Hispanic women reported experiences with gettingneeded care that were similar to the experiences reported by White women.
o In the 2015 data, API, Black, and Hispanic men reported worse experiences getting needed carethan White men reported. The difference between API men and White men was greater than 3points on a 0–100 scale. The differences between Black and Hispanic men and White men wereless than 3 points on a 0–100 scale.
† This includes how easy it is to get appointments with specialists and how easy it is to get needed care, tests, or treatment.
†† Unlike on the preceding page, we use the terms better or worse to describe all statistically significant differences on individual patient experience measures. We note in the “Disparities” section for each of these measures where differences are greater or less than 3 points.
3

Patient Experience: Getting Appointments and Care Quickly
Percentage of the best-possible score (on a 0–100 scale) earned on how quickly patients get appointments and care,† by race/ethnicity within gender, 2015
Women Men
63.1 68.3 69.1 73.9
0
20
40
60
80
100
Pe
rcen
tage
of
bes
t-p
oss
ible
sc
ore
* (−) * (−) * (−)
62.3 67.4 66.7 72.9
* (−) * (−) * (−)
Data source: Medicare CAHPS survey, 2015.
Key: API = Asian or Pacific Islander.
Note: Racial groups such as Blacks and Whites are non-Hispanic; Hispanic ethnicity includes all races.
* Significantly different from the score for Whites of the same gender (p < 0.05).
For statistically significant differences between Whites and racial/ethnic minorities of the same gender, the following symbols are also used when applicable:
(+) Difference is equal to or larger than 3 points (prior to rounding) and favors the racial/ethnic minority group.
(−) Difference is equal to or larger than 3 points (prior to rounding) and favors Whites.
Disparities
o In the 2015 data, API, Black, and Hispanic women reported getting appointments and care less quickly than White women did. The differences between API, Black, and Hispanic women and White women were greater than 3 points on a 0–100 scale.
o In the 2015 data, API, Black, and Hispanic men reported getting appointments and care less quickly than White men did. The differences between API, Black, and Hispanic men and White men were greater than 3 points on a 0–100 scale.
† This includes how easy it is to get care that is needed right away, as well as how easy it is to get appointments for checkups and routine care.
4

Patient Experience: Customer Service
Percentage of the best-possible score (on a 0–100 scale) earned on how easy it is to get information and help from one’s plan when needed,† by race/ethnicity within gender, 2015
Women Men
77.8 80.8 81.6 81.0
0
20
40
60
80
100
Pe
rcen
tage
of
bes
t-p
oss
ible
sc
ore
* (−)
74.2 79.9 81.6 80.7
* (−)
Data source: Medicare CAHPS survey, 2015.
Key: API = Asian or Pacific Islander.
Note: Racial groups such as Blacks and Whites are non-Hispanic; Hispanic ethnicity includes all races.
* Significantly different from the score for Whites of the same gender (p < 0.05).
For statistically significant differences between Whites and racial/ethnic minorities of the same gender, the following symbols are also used when applicable:
(+) Difference is equal to or larger than 3 points (prior to rounding) and favors the racial/ethnic minority group.
(−) Difference is equal to or larger than 3 points (prior to rounding) and favors Whites.
Disparities
o In the 2015 data, API women reported that it was harder to get information and help from their plans than White women did. The difference between API women and White women was greater than 3 points on a 0–100 scale. Black and Hispanic women reported experiences with getting information and help from their plans that were similar to the experiences reported by White women.
o In the 2015 data, API men reported that it was harder to get information and help from their plans than White men did. The difference between API men and White men was greater than 3 points on a 0–100 scale. Black and Hispanic men reported experiences with getting information and help from their plans that were similar to the experiences reported by White men.
† This includes how often health plan customer service staff provide the information or help that beneficiaries need and treat beneficiaries with courtesy and respect, as well as how often forms from the health plan are easy to fill out.
5

Patient Experience: Doctors Who Communicate Well
Percentage of the best-possible score (on a 0–100 scale) earned on how well doctors communicate with patients,† by race/ethnicity within gender, 2015
Women Men
88.6 90.1 91.4 90.9
0
20
40
60
80
100
Pe
rcen
tage
of
bes
t-p
oss
ible
sc
ore
*
85.5 91.2 90.9 90.9
* (−)
Data source: Medicare CAHPS survey, 2015.
Key: API = Asian or Pacific Islander.
Note: Racial groups such as Blacks and Whites are non-Hispanic; Hispanic ethnicity includes all races.
* Significantly different from the score for Whites of the same gender (p < 0.05).
For statistically significant differences between Whites and racial/ethnic minorities of the same gender, the following symbols are also used when applicable:
(+) Difference is equal to or larger than 3 points (prior to rounding) and favors the racial/ethnic minority group
(−) Difference is equal to or larger than 3 points (prior to rounding) and favors Whites
Disparities
o In the 2015 data, API women reported worse doctor communication than White women did. The difference between API women and White women was less than 3 points on a 0–100 scale. Black and Hispanic women reported experiences with doctor communication that were similar to the experiences reported by White women.
o In the 2015 data, API men reported worse doctor communication than White men did. The difference between API men and White men was greater than 3 points on a 0–100 scale. Black and Hispanic men reported experiences with doctor communication that were similar to the experiences reported by White men.
† This includes how often doctors explain things in a way that is easy to understand, listen carefully, show respect for what patients have to say, and spend time with patients.
6

Patient Experience: Care Coordination
Percentage of the best-possible score (on a 0–100 scale) earned on how well patient care was coordinated,† by race/ethnicity within gender, 2015
Women Men
82.7 84.4 83.2 85.5
0
20
40
60
80
100
Pe
rcen
tage
of
bes
t-p
oss
ible
sc
ore
* * *
80.2 85.9 82.9 86.5
* (−) * (−)
Data source: Medicare CAHPS survey, 2015.
Key: API = Asian or Pacific Islander.
Note: Racial groups such as Blacks and Whites are non-Hispanic; Hispanic ethnicity includes all races.
* Significantly different from the score for Whites of the same gender (p < 0.05).
For statistically significant differences between Whites and racial/ethnic minorities of the same gender, the following symbols are also used when applicable:
(+) Difference is equal to or larger than 3 points (prior to rounding) and favors the racial/ethnic minority group.
(−) Difference is equal to or larger than 3 points (prior to rounding) and favors Whites.
Disparities
o In the 2015 data, API, Black, and Hispanic women reported worse care coordination than White women did. The difference between each of these groups of women and White women was less than 3 points on a 0–100 scale.
o In the 2015 data, API and Hispanic men reported worse care coordination than White men did. The difference between each of these groups of men and White men was greater than 3 points on a 0–100 scale. Black men reported experiences with care coordination that were similar to the experiences reported by White men.
† This includes whether doctors had the records and information they need about patients’ care and how quickly patients received their test results.
7

Patient Experience: Getting Needed Prescription Drugs
Percentage of the best-possible score (on a 0–100 scale) earned on how easy it is for beneficiaries to get the prescription drugs they need using their plans,† by race/ethnicity within gender, 2015
MenWomen
85.5 89.0 88.2 90.6
0
20
40
60
80
100
Pe
rcen
tage
of
bes
t-p
oss
ible
sc
ore
* (−) * *
84.8 88.5 87.7 90.6
* (−) * *
Data source: Medicare CAHPS survey, 2015.
Key: API = Asian or Pacific Islander.
Note: Racial groups such as Blacks and Whites are non-Hispanic; Hispanic ethnicity includes all races.
* Significantly different from the score for Whites of the same gender (p < 0.05).
For statistically significant differences between Whites and racial/ethnic minorities of the same gender, the following symbols are also used when applicable:
(+) Difference is equal to or larger than 3 points (prior to rounding) and favors the racial/ethnic minority group.
(−) Difference is equal to or larger than 3 points (prior to rounding) and favors Whites.
Disparities
o In the 2015 data, API, Black, and Hispanic women reported more difficulty getting needed prescription drugs than White women reported. The difference between API women and White women was greater than 3 points on a 0–100 scale. The difference between Black women and White women was less than 3 points on a 0–100 scale, as was the difference between Hispanic women and White women.
o In the 2015 data, API, Black, and Hispanic men reported more difficulty getting needed prescription drugs than White men reported. The difference between API men and White men was greater than 3 points on a 0–100 scale. The difference between Black men and White men was less than 3 points on a 0–100 scale, as was the difference between Hispanic men and White men.
† This includes how often it is easy to use the plan to get prescribed medications and how easy it is to fill prescriptions at a pharmacy or by mail.
8

Patient Experience: Getting Information About Prescription Drugs
Percentage of the best-possible score (on a 0–100 scale) earned on how easy it was for beneficiaries to get information from their plan about prescription drug coverage
and cost,† by race/ethnicity within gender, 2015
Women Men
73.8 79.4 79.1 81.6
0
20
40
60
80
100
Pe
rce
nta
ge o
f b
est-
po
ssib
le s
core
* (−)
72.2 77.9 78.6 80.8
* (−)
Data source: Medicare CAHPS survey, 2015.
Key: API = Asian or Pacific Islander.
Note: Racial groups such as Blacks and Whites are non-Hispanic; Hispanic ethnicity includes all races.
* Significantly different from the score for Whites of the same gender (p < 0.05).
For statistically significant differences between Whites and racial/ethnic minorities of the same gender, the following symbols are also used when applicable:
(+) Difference is equal to or larger than 3 points (prior to rounding) and favors the racial/ethnic minority group.
(−) Difference is equal to or larger than 3 points (prior to rounding) and favors Whites.
Disparities
o In the 2015 data, API women reported more difficulty getting information about prescription drugs than White women did. The difference between API women and White women was greater than 3 points on a 0–100 scale. Black and Hispanic women reported experiences with getting information about prescription drugs that were similar to the experiences reported by White women.
o In the 2015 data, API men reported more difficulty getting information about prescription drugs than White men did. The difference between API men and White men was greater than 3 points on a 0–100 scale. Black and Hispanic men reported experiences with getting information about prescription drugs that were similar to the experiences reported by White men.
† This includes information about which prescription medications are covered by the plan and how much beneficiaries have to pay for their prescription medications.
9

Patient Experience: Annual Flu Vaccine
Percentage of Medicare enrollees who got a vaccine (flu shot), by race/ethnicity within gender, 2015
Women Men
78.5
62.8 64.4 75.2
0
20
40
60
80
100
Pe
rce
nta
ge o
f b
est-
po
ssib
le s
core
* (−) * (−) 81.8
63.3 69.3
76.6* (−) * (−)
* (+)
Data source: Medicare CAHPS survey, 2015.
Key: API = Asian or Pacific Islander.
Note: Racial groups such as Blacks and Whites are non-Hispanic; Hispanic ethnicity includes all races.
* Significantly different from the score for Whites of the same gender (p < 0.05).
For statistically significant differences between Whites and racial/ethnic minorities of the same gender, the following symbols are also used when applicable:
(+) Difference is equal to or larger than 3 points (prior to rounding) and favors the racial/ethnic minority group.
(−) Difference is equal to or larger than 3 points (prior to rounding) and favors Whites.
Disparities
o In the 2015 data, Black and Hispanic women were less likely than White women to have received the flu vaccine. The differences between Black and Hispanic women and White women were greater than 3 percentage points. API women were as likely as White women to have received the flu vaccine.
o In the 2015 data, API men were more likely than White men to have received the flu vaccine. The difference between API men and White men was greater than 3 percentage points. Black and Hispanic men were less likely than White men to have received the flu vaccine. The differences between Black and Hispanic men and White men were greater than 3 percentage points.
10

Disparities in Care: All Clinical Care Measures Number of clinical care measures (of 24) for which women/men of selected racial/ethnic minority groups
experienced care that was worse than, similar to, or better than the care experienced by White women/men in 2015
Women Men
11
2 7
14
10
10
8 7 3
10
3 5
10 10
9
11 9 5
API vs. Black vs. Hispanic vs. API vs. Black vs. Hispanic vs.
White White White White White White
Worse than Whites Similar to Whites Better than Whites
Data source: Information in this chart is from clinical quality (HEDIS) data collected in 2015 from Medicare health plans nationwide.
Key: API = Asian or Pacific Islander.
Notes: Racial groups such as Blacks and Whites are non-Hispanic; Hispanic ethnicity includes all races. Data are not given on American Indians or Alaska Natives because the clinical care data lack the information to reliably determine whether a beneficiary is in this group.
Within each gender, the relative difference between a selected group and Whites is used to assess disparities:
Better = Population had better clinical care than Whites did. Differences are statistically significant (p < 0.05), are equal to or larger than 3 percentage points,† and favor the selected racial/ethnic minority group.
Similar = Population and Whites had similar clinical care. Differences are less than 3 points on a 0–100 scale or not statistically significant.
Worse = Population had worse clinical care than Whites did. Differences are statistically significant, are equal to or larger than 3 percentage points, and favor Whites.
Example: Compared with White women, Hispanic women had worse-quality care for 7 of the 24 clinical care measures, similar quality care for 10 measures, and better-quality care for 7 measures.
† A difference that is considered to be of moderate magnitude. Paddison CA, Elliott MN, Haviland AM, Farley DO, Lyratzopoulos G, Hambarsoomian K, Dembosky JW, Roland MO. Experiences of care among Medicare beneficiaries with ESRD: Medicare Consumer Assessment of Healthcare Providers and Systems (CAHPS) survey results. Am J Kidney Dis. 2013;61, pp. 440–449.
11

Clinical Care: Colorectal Cancer Screening
Percentage of Medicare enrollees ages 50 to 75 who had appropriate screening for colorectal cancer, by race/ethnicity within gender, 2015
Women Men
75.6
62.3
76.1 65.4
0
20
40
60
80
100
Pe
rcen
tage
* (+)
* (−)
* (+)
73.6
57.1
73.6 63.8
* (+)
* (−)
* (+)
Data source: Clinical quality data collected in 2015 from Medicare health plans nationwide.
Key: API = Asian or Pacific Islander.
Note: Racial groups such as Blacks and Whites are non-Hispanic; Hispanic ethnicity includes all races.
* Significantly different from the score for Whites of the same gender (p < 0.05).
For statistically significant differences between Whites and racial/ethnic minorities of the same gender, the following symbols are also used when applicable:
(+) Difference is equal to or larger than 3 points (prior to rounding) and favors the racial/ethnic minority group.
(−) Difference is equal to or larger than 3 points (prior to rounding) and favors Whites.
Disparities
o In the 2015 data, API and Hispanic women were more likely than White women to have been appropriately screened for colorectal cancer. The differences between API and Hispanic women and White women were greater than 3 percentage points. Black women were less likely than White women to have been appropriately screened for colorectal cancer. The difference between Black women and White women was greater than 3 percentage points.
o In the 2015 data, API and Hispanic men were more likely than White men to have been appropriately screened for colorectal cancer. The differences between API and Hispanic men and White men were greater than 3 percentage points. Black men were less likely than White men to have been appropriately screened for colorectal cancer. The difference between Black men and White men was greater than 3 percentage points.
12

ClinicalCare: Diabetes Care—Blood Sugar Testing Percentage of Medicare enrollees ages 18 to 75 with diabetes (type 1 and type 2) who had 1 or more
HbA1c tests in the past year, by race/ethnicity within gender, 2015
Women Men
Percen
tage
100 * * * * * *
80 96.8 94.4 95.7 94.8 96.2 92.2 94.5 94.0
60
40
20
0
Data source:Clinical quality data collected in 2015 from Medicare health plans nationwide.
Key:API= Asian or Pacific Islander.
Note:Racialgroups such as Blacks and Whites are non-Hispanic;Hispanic ethnicity includes allraces.
* Significantly different from the score for Whites of the same gender (p < 0.05).
For statistically significant differences between Whites and racial/ethnic minorities of the same gender, the following symbols are also used when applicable:
(+) Difference is equal to or larger than 3 points (prior to rounding) and favors the racial/ethnic minority group.
(−) Difference is equal to or larger than 3 points (prior to rounding) and favors Whites.
Disparities
o In the 2015 data, API and Hispanic women with diabetes were more likely than White women with diabetes to have had their blood sugar tested at least once in the past year. The difference between API and Hispanic women and White women was less than 3 percentage points. Black women with diabetes were less likely than White women with diabetes to have had their blood sugar tested at least once in the past year. The difference between Black women and White women was less than 3 percentage points.
o In the 2015 data, API and Hispanic men with diabetes were more likely than White men with diabetes to have had their blood sugar tested at least once in the past year. The differences between API and Hispanic men and White men were less than 3 percentage points. Black men with diabetes were less likely than White men with diabetes to have had their blood sugar tested at least once in the past year. The difference between Black men and White men was less than 3 percentage points.
13

Clinical Care: Diabetes Care—Eye Exam
Percentage of Medicare enrollees ages 18 to 75 with diabetes (type 1 and type 2) who had an eye exam (retinal) in the past year, by race/ethnicity within gender, 2015
Women Men
82.9 72.9
78.3 72.8
0
20
40
60
80
100
Pe
rcen
tage
* (+) * (+)
80.6
67.9 75.4
69.5
* (+)
*
* (+)
Data source: Clinical quality data collected in 2015 from Medicare health plans nationwide.
Key: API = Asian or Pacific Islander.
Note: Racial groups such as Blacks and Whites are non-Hispanic; Hispanic ethnicity includes all races.
* Significantly different from the score for Whites of the same gender (p < 0.05).
For differences statistically significant between Whites and racial/ethnic minorities of the same gender, the following symbols are also used when applicable:
(+) Difference is equal to or larger than 3 points (prior to rounding) and favors the racial/ethnic minority group.
(−) Difference is equal to or larger than 3 points (prior to rounding) and favors Whites.
Disparities
o In the 2015 data, API and Hispanic women with diabetes were more likely than White women with diabetes to have had an eye exam in the past year. The differences between API and Hispanic women and Whites were greater than 3 percentage points. Black women with diabetes were as likely as White women with diabetes to have had an eye exam in the past year.
o In the 2015 data, API and Hispanic men with diabetes were more likely than White men with diabetes to have had an eye exam in the past year. The differences between API and Hispanic men and White men were greater than 3 percentage points. Black men with diabetes were less likely than White men with diabetes to have had an eye exam in the past year. The difference between Black men and White men was less than 3 percentage points.
14

Clinical Care: Diabetes Care—Kidney Disease Monitoring
Percentage of Medicare enrollees ages 18 to 75 with diabetes (type 1 and type 2) who had medical attention for nephropathy in the past year, by race/ethnicity within gender, 2015
Women Men
95.4 94.1 95.5 92.2
0
20
40
60
80
100
Pe
rcen
tage
* (+) * * (+)
95.7 93.4 95.3 92.6
* (+) * *
Data source: Clinical quality data collected in 2015 from Medicare health plans nationwide.
Key: API = Asian or Pacific Islander.
Note: Racial groups such as Blacks and Whites are non-Hispanic; Hispanic ethnicity includes all races.
* Significantly different from the score for Whites of the same gender (p < 0.05).
For statistically significant differences between Whites and racial/ethnic minorities of the same gender, the following symbols are also used when applicable:
(+) Difference is equal to or larger than 3 points (prior to rounding) and favors the racial/ethnic minority group.
(−) Difference is equal to or larger than 3 points (prior to rounding) and favors Whites.
Disparities
o In the 2015 data, API, Black, and Hispanic women with diabetes were more likely than White women with diabetes to have had medical attention for nephropathy in the past year. The differences between API and Hispanic women and White women were greater than 3 percentage points. The difference between Black women and White women was less than 3 percentage points.
o In the 2015 data, API, Black, and Hispanic men with diabetes were more likely than White men with diabetes to have had medical attention for nephropathy in the past year. The differences between API men and White men were greater than 3 percentage points. The difference between Black and Hispanic men and White men was less than 3 percentage points.
15

Clinical Care: Diabetes Care—Blood Pressure Controlled
Percentage of Medicare enrollees ages 18 to 75 with diabetes (type 1 and type 2) whose most recent Pe
rcen
tage
blood pressure was less than 140/90, by race/ethnicity within gender, 2015
Women Men
60
80
100
76.1
* (+)
* 69.9
* (+) 77.0
* (+)
* 69.6
* (+)
40 51.5 53.8 51.8 54.0
20
0
Data source:Clinical quality data collected in 2015 from Medicare health plans nationwide.
Key:API= Asian or Pacific Islander.
Note:Racialgroups such as Blacks and Whites are non-Hispanic;Hispanic ethnicity includes allraces.
* Significantly different from the score for Whites of the same gender (p < 0.05).
For statistically significant differences between Whites and racial/ethnic minorities of the same gender, the following symbols are also used when applicable:
(+) Difference is equal to or larger than 3 points (prior to rounding) and favors the racial/ethnic minority group.
(−) Difference is equal to or larger than 3 points (prior to rounding) and favors Whites.
Disparities
o In the 2015 data, API and Hispanic women with diabetes were more likely than White women with diabetes to have their blood pressure under control. The differences between API and Hispanic women and White women were greater than 3 percentage points. Black women with diabetes were less likely than White women with diabetes to have their blood pressure under control. The difference between Black women and White women was less than 3 percentage points.
o In the 2015 data, API and Hispanic men with diabetes were more likely than White men with diabetes to have their blood pressure under control. The differences between API and Hispanic men and White men were greater than 3 percentage points. Black men with diabetes were less likely than White men with diabetes to have their blood pressure under control. The difference between Black men and White men was less than 3 percentage points.
16

Clinical Care: Diabetes Care—Blood Sugar Controlled
Percentage of Medicare enrollees ages 18 to 75 with diabetes (type 1 and type 2) whose most recent HbA1c level was 9 percent or less, by race/ethnicity within gender, 2015
Women Men
87.8
70.2 77.2 74.0
0
20
40
60
80
100
Pe
rcen
tage
* (+)
* (−) * (+)
86.4
68.0 75.5 73.5
* (+)
* (−) *
Data source: Clinical quality data collected in 2015 from Medicare health plans nationwide.
Key: API = Asian or Pacific Islander.
Note: Racial groups such as Blacks and Whites are non-Hispanic; Hispanic ethnicity includes all races.
* Significantly different from the score for Whites of the same gender (p < 0.05).
For statistically significant differences between Whites and racial/ethnic minorities of the same gender, the following symbols are also used when applicable:
(+) Difference is equal to or larger than 3 points (prior to rounding) and favors the racial/ethnic minority group.
(−) Difference is equal to or larger than 3 points (prior to rounding) and favors Whites.
Disparities
o In the 2015 data, API and Hispanic women with diabetes were more likely than White women with diabetes to have their blood sugar levels under control. The difference between each of these groups of women and White women was greater than 3 percentage points. Black women with diabetes were less likely than White women with diabetes to have their blood sugar levels under control. The difference between Black women and White women was greater than 3 percentage points.
o In the 2015 data, API and Hispanic men with diabetes were more likely than White men with diabetes to have their blood sugar levels under control. The difference between API men and White men was greater than 3 percentage points. The difference between Hispanic men and White men was less than 3 percentage points. Black men with diabetes were less likely than White men with diabetes to have their blood sugar levels under control. The difference between Black men and White men was greater than 3 percentage points.
17

Clinical Care: Adult BMI Assessment
Percentage of Medicare enrollees ages 18 to 74 who had an outpatient visit and whose body mass index (BMI) was documented in the past 2 years, by race/ethnicity within gender, 2015
Women Men
95.7
79.9
93.8 83.9
0
20
40
60
80
100
Pe
rcen
tage
* (+)
* (−)
* (+)
95.1
77.2
92.6 82.9
* (+)
* (−)
* (+)
Data source: Clinical quality data collected in 2015 from Medicare health plans nationwide.
Key: API = Asian or Pacific Islander.
Note: Racial groups such as Blacks and Whites are non-Hispanic; Hispanic ethnicity includes all races.
* Significantly different from the score for Whites of the same gender (p < 0.05).
For statistically significant differences between Whites and racial/ethnic minorities of the same gender, the following symbols are also used when applicable:
(+) Difference is equal to or larger than 3 points (prior to rounding) and favors the racial/ethnic minority group.
(−) Difference is equal to or larger than 3 points (prior to rounding) and favors Whites.
Disparities
o In the 2015 data, API and Hispanic women were more likely than White women to have had their BMIs documented. The differences between API and Hispanic women and White women were greater than 3 percentage points. Black women were less likely than White women to have had their BMIs documented. The difference between Black women and White women was greater than 3 percentage points.
o In the 2015 data, API and Hispanic men were more likely than White men to have had their BMIs documented. The differences between API and Hispanic men and White men were greater than 3 percentage points. Black men were less likely than White men to have had their BMIs documented. The difference between Black men and White men was greater than 3 percentage points.
18

Clinical Care: Continuous Beta-Blocker Treatment
Percentage of Medicare enrollees age 18 and older who were hospitalized and discharged alive with a diagnosis of acute myocardial infarction (AMI) and who received persistent beta-blocker treatment for
6 months after discharge, by race/ethnicity within gender, 2015
Women Men
89.6 90.0 87.5 91.9
0
20
40
60
80
100
Pe
rcen
tage
* * (−)
89.9 84.6 86.8 90.6 * (−) * (−)
Data source: Clinical quality data collected in 2015 from Medicare health plans nationwide.
Key: API = Asian or Pacific Islander.
Note: Racial groups such as Blacks and Whites are non-Hispanic; Hispanic ethnicity includes all races.
* Significantly different from the score for Whites of the same gender (p < 0.05).
For statistically significant differences between Whites and racial/ethnic minorities of the same gender, the following symbols are also used when applicable:
(+) Difference is equal to or larger than 3 points (prior to rounding) and favors the racial/ethnic minority group.
(−) Difference is equal to or larger than 3 points (prior to rounding) and favors Whites.
Disparities
o In the 2015 data, Black and Hispanic women who were hospitalized for a heart attack were less likely than White women who were hospitalized for a heart attack to have received persistent beta-blocker treatment. The difference between Black women and White women was less than 3 percentage points. The difference between Hispanic women and White women was greater than 3 percentage points. API women were as likely as White women to have received persistent beta-blocker treatment.
o In the 2015 data, Black and Hispanic men who were hospitalized for a heart attack were less likely than White men who were hospitalized for a heart attack to have received persistent beta-blocker treatment. The differences between Black and Hispanic men and White men were greater than 3 percentage points. API men were as likely as White men to have received persistent beta-blocker treatment.
19

Clinical Care: Testing to Confirm Chronic Obstructive Pulmonary Disease (COPD)
Percentage of Medicare enrollees age 40 or older with a new diagnosis of COPD or newly active COPD who received a spirometry test to confirm the diagnosis, by race/ethnicity within gender, 2015
Women Men
35.0 40.4 40.2 37.7
0
20
40
60
80
100
Pe
rcen
tage
* * *
37.3 37.2 40.6 38.2
* *
Data source: Clinical quality data collected in 2015 from Medicare health plans nationwide.
Key: API = Asian or Pacific Islander.
Note: Racial groups such as Blacks and Whites are non-Hispanic; Hispanic ethnicity includes all races.
* Significantly different from the score for Whites of the same gender (p < 0.05).
For statistically significant differences between Whites and racial/ethnic minorities of the same gender, the following symbols are also used when applicable:
(+) Difference is equal to or larger than 3 points (prior to rounding) and favors the racial/ethnic minority group.
(−) Difference is equal to or larger than 3 points (prior to rounding) and favors Whites.
Disparities
o In the 2015 data, Black and Hispanic women with a new diagnosis of COPD or newly active COPD were more likely than White women to have received a spirometry test to confirm the diagnosis. In contrast, API women with a new diagnosis of COPD or newly active COPD were less likely than White women to have received a spirometry test to confirm the diagnosis. The differences between Black, Hispanic, and API women and White women were less than 3 percentage points.
o In the 2015 data, Black men with a new diagnosis of COPD or newly active COPD were less likely than White men to have received a spirometry test to confirm the diagnosis. In contrast, Hispanic men with a new diagnosis of COPD or newly active COPD were more likely than White men to have received a spirometry test to confirm the diagnosis. The differences between Black and Hispanic men and White men were less than 3 percentage points. API men with a new diagnosis of COPD or newly active COPD were as likely as White men to have received a spirometry test to confirm the diagnosis.
20

Clinical Care: Pharmacotherapy Management of COPD Exacerbation— Systemic Corticosteroid
Percentage of COPD exacerbations for Medicare enrollees age 40 and older who had an acute inpatient discharge or emergency department encounter in the past year and who were dispensed a systemic
corticosteroid within 14 days of the event, by race/ethnicity within gender, 2015
Women Men
75.6 70.2 65.5
72.7
0
20
40
60
80
100
Pe
rcen
tage
* * (−) 74.0
66.0 64.8 70.3
* (+) * (−) * (−)
Data source: Clinical quality data collected in 2015 from Medicare health plans nationwide.
Key: API = Asian or Pacific Islander.
Note: Racial groups such as Blacks and Whites are non-Hispanic; Hispanic ethnicity includes all races.
* Significantly different from the score for Whites of the same gender (p < 0.05).
For statistically significant differences between Whites and racial/ethnic minorities of the same gender, the following symbols are also used when applicable:
(+) Difference is equal to or larger than 3 points (prior to rounding) and favors the racial/ethnic minority group.
(−) Difference is equal to or larger than 3 points (prior to rounding) and favors Whites.
Disparities
o In the 2015 data, Black and Hispanic women who experienced a COPD exacerbation were less likely than White women to have been dispensed a systemic corticosteroid within 14 days of the event. The difference between Black women and White women was less than 3 percentage points. The difference between Hispanic women and White women was greater than 3 percentage points. API women who experienced a COPD exacerbation were as likely as White women to have been dispensed a systemic corticosteroid within 14 days of the event.
o In the 2015 data, API men who experienced a COPD exacerbation were more likely than White men to have been dispensed a systemic corticosteroid within 14 days of the event. The difference between API men and White men was greater than 3 percentage points. Black and Hispanic men who experienced a COPD exacerbation were less likely than White men to have been dispensed a systemic corticosteroid within 14 days of the event. The differences between Black and Hispanic men and White men were greater than 3 percentage points.
21

Clinical Care: Pharmacotherapy Management of COPD Exacerbation— Bronchodilator
Percentage of COPD exacerbations for Medicare enrollees 40 years of age and older who had an acute inpatient discharge or emergency department encounter in the past year and who were dispensed a
bronchodilator within 30 days of experiencing the event, by race/ethnicity within gender, 2015
Women Men
85.5 79.5 78.0 79.2
0
20
40
60
80
100
Pe
rcen
tage
* (+) *
85.2 76.8 78.3 74.3
* (+) *
* (+)
Data source: Clinical quality data collected in 2015 from Medicare health plans nationwide.
Key: API = Asian or Pacific Islander.
Note: Racial groups such as Blacks and Whites are non-Hispanic; Hispanic ethnicity includes all races.
* Significantly different from the score for Whites of the same gender (p < 0.05).
For statistically significant differences between Whites and racial/ethnic minorities of the same gender, the following symbols are also used when applicable:
(+) Difference is equal to or larger than 3 points (prior to rounding) and favors the racial/ethnic minority group.
(−) Difference is equal to or larger than 3 points (prior to rounding) and favors Whites.
Disparities
o In the 2015 data, API and Black women who experienced a COPD exacerbation were more likely than White women to have been dispensed a bronchodilator within 30 days of the event. The difference between API women and White women was greater than 3 percentage points. The difference between Black women and White women was less than 3 percentage points. Hispanic women who experienced a COPD exacerbation were as likely as White women to have been dispensed a bronchodilator within 30 days of the event.
o In the 2015 data, API, Black, and Hispanic men who experienced a COPD exacerbation were more likely than White men to have been dispensed a bronchodilator within 30 days of the event. The difference between API men and White men was greater than 3 percentage points, as was the difference between Hispanic men and White men. The difference between Black men and White men was less than 3 percentage points.
22

Clinical Care: Rheumatoid Arthritis Management
Percentage of Medicare enrollees who were diagnosed with rheumatic arthritis during the past year and who were dispensed at least 1 ambulatory prescription for a disease-modifying antirheumatic drug
(DMARD), by race/ethnicity within gender, 2015
Women Men
79.1 78.1 76.9 79.1
0
20
40
60
80
100
Pe
rcen
tage
* *
71.1 69.1 71.5 76.6
* (−) * (−) * (−)
Data source: Clinical quality data collected in 2015 from Medicare health plans nationwide.
Key: API = Asian or Pacific Islander.
Note: Racial groups such as Blacks and Whites are non-Hispanic; Hispanic ethnicity includes all races.
* Significantly different from the score for Whites of the same gender (p < 0.05).
For statistically significant differences between Whites and racial/ethnic minorities of the same gender, the following symbols are also used when applicable:
(+) Difference is equal to or larger than 3 points (prior to rounding) and favors the racial/ethnic minority group.
(−) Difference is equal to or larger than 3 points (prior to rounding) and favors Whites.
Disparities
o In the 2015 data, Black and Hispanic women who were diagnosed with rheumatic arthritis were less likely than White women who were diagnosed with rheumatic arthritis to have been dispensed at least 1 DMARD. The differences between Black and Hispanic women and White women were less than 3 percentage points. API women were as likely as White women to have been dispensed at least 1 DMARD.
o In the 2015 data, API, Black, and Hispanic men who were diagnosed with rheumatic arthritis were less likely than White men who were diagnosed with rheumatic arthritis to have been dispensed at least 1 DMARD. The difference between each of these groups of men and White men was greater than 3 percentage points.
23

Clinical Care: Appropriate Monitoring of Patients Taking Long-Term Medications
Percentage of Medicare enrollees age 18 and older who received at least 180 treatment days of ambulatory medication therapy for a selected therapeutic agent† during the past year and at least
1 therapeutic monitoring event for the therapeutic agent during the year, by race/ethnicity within gender, 2015
Women Men
93.4 93.7 95.0 92.7
0
20
40
60
80
100
Pe
rcen
tage
* * *
93.6 92.8 94.3 91.9
* * *
Data source: Clinical quality data collected in 2015 from Medicare health plans nationwide.
Key: API = Asian or Pacific Islander.
Note: Racial groups such as Blacks and Whites are non-Hispanic; Hispanic ethnicity includes all races.
* Significantly different from the score for Whites of the same gender (p < 0.05).
For statistically significant differences between Whites and racial/ethnic minorities of the same gender, the following symbols are also used when applicable:
(+) Difference is equal to or larger than 3 points (prior to rounding) and favors the racial/ethnic minority group.
(−) Difference is equal to or larger than 3 points (prior to rounding) and favors Whites.
Disparities
o In the 2015 data, API, Black, and Hispanic women were more likely than White women to have had at least 1 appropriate follow-up visit during the year to monitor their use of a higher-risk medication. The differences between API, Black, and Hispanic women and White women were less than 3 percentage points.
o In the 2015 data, API, Black, and Hispanic men were more likely than White men to have had at least 1 appropriate follow-up visit during the year to monitor their use of a higher-risk medication. The differences between API, Black, and Hispanic men and White men were less than 3 percentage points.
† This measure is limited to those who had a prescription to 1 or more of the following drugs for 6 months or longer: angiotensin converting enzyme (ACE) inhibitors, angiotensin receptor blockers (ARBs), digoxin, diuretics, anticonvulsants, and statins. These drugs are known to have possibly harmful side effects if used long term.
24

Clinical Care: Avoiding Use of High-Risk Medications in the Elderly
Percentage of Medicare enrollees age 65 and older who were not prescribed a high-risk medication, by race/ethnicity within gender, 2015
Women Men * * ***
98.6 98.2 98.2 97.8
0
20
40
60
80
100
Pe
rcen
tage
98.7 99.0 98.9 99.0
Data source: Clinical quality data collected in 2015 from Medicare health plans nationwide.
Key: API = Asian or Pacific Islander.
Note: Racial groups such as Blacks and Whites are non-Hispanic; Hispanic ethnicity includes all races.
* Significantly different from the score for Whites of the same gender (p < 0.05).
For statistically significant differences between Whites and racial/ethnic minorities of the same gender, the following symbols are also used when applicable:
(+) Difference is equal to or larger than 3 points (prior to rounding) and favors the racial/ethnic minority group
(−) Difference is equal to or larger than 3 points (prior to rounding) and favors Whites
Disparities
o Long-term use of high-risk medication should be avoided for the elderly. In the 2015 data, it was observed that this standard of care was met more often for elderly API, Black, and Hispanic women than for elderly White women. The differences between API, Black, and Hispanic women and White women were less than 3 percentage points.
o In the 2015 data, it was observed that this standard of care was met less often for elderly API and Hispanic men than for elderly White men. The differences between API and Hispanic men and White men was less than 3 percentage points. This standard of care was met as often for
elderly Black men as it was for elderly White men.
25

Clinical Care: Avoiding Potentially Harmful Drug-Disease Interactions in Elderly Patients with Chronic Renal Failure
Percentage of Medicare enrollees age 65 and older with chronic renal failure who were not dispensed a prescription for a potentially harmful medication,† by race/ethnicity within gender, 2015
Women Men
89.5 87.4 83.2 90.8
0
20
40
60
80
100
Pe
rcen
tage
* * (−) * (−)
89.0 89.3 84.3
92.4
* (−) * (−) * (−)
Data source: Clinical quality data collected in 2015 from Medicare health plans nationwide.
Key: API = Asian or Pacific Islander.
Note: Racial groups such as Blacks and Whites are non-Hispanic; Hispanic ethnicity includes all races.
* Significantly different from the score for Whites of the same gender (p < 0.05).
For statistically significant differences between Whites and racial/ethnic minorities of the same gender, the following symbols are also used when applicable:
(+) Difference is equal to or larger than 3 points (prior to rounding) and favors the racial/ethnic minority group.
(−) Difference is equal to or larger than 3 points (prior to rounding) and favors Whites.
Disparities
o Potentially harmful medication† should be avoided among elderly adults with chronic renal failure. In the 2015 data, it was observed that this standard of care was met less often for elderly API, Black, and Hispanic women with chronic renal failure than for elderly White women with chronic renal failure. The difference between API women and White women was less than 3 percentage points. The difference between Black women and White women was greater than 3 percentage points, as was the difference between Hispanic women and White women.
o In the 2015 data, it was observed that this standard of care was met less often for elderly API, Black, and Hispanic men with chronic renal failure than for elderly White men with chronic renal failure. The difference between each of these groups of men and White men was greater than 3 percentage points.
† This includes cyclo-oxygenase-2 (COX-2) selective nonsteroidal anti-inflammatory drugs (NSAIDs) and nonaspirin NSAIDs.
26

Clinical Care: Avoiding Potentially Harmful Drug-Disease Interactions in Elderly Patients with Dementia
Percentage of Medicare enrollees age 65 and older with dementia who were not dispensed a prescription for a potentially harmful medication,† by race/ethnicity within gender, 2015
Women Men
Pe
rcen
tage
100
80
60
40
20
0
58.4 55.4
37.7 48.1
* (+) * (+)
* (−) 59.9 61.6
45.4 57.3
* * (+) * (−)
Data source: Clinical quality data collected in 2015 from Medicare health plans nationwide.
Key: API = Asian or Pacific Islander.
Note: Racial groups such as Blacks and Whites are non-Hispanic; Hispanic ethnicity includes all races.
* Significantly different from the score for Whites of the same gender (p < 0.05).
For statistically significant differences between Whites and racial/ethnic minorities of the same gender, the following symbols are also used when applicable:
(+) Difference is equal to or larger than 3 points (prior to rounding) and favors the racial/ethnic minority group.
(−) Difference is equal to or larger than 3 points (prior to rounding) and favors Whites.
Disparities
o Potentially harmful medication† should be avoided among elderly adults with dementia. In the 2015 data, it was observed that this standard of care was met more often for elderly API and Black women with dementia than for elderly White women with dementia. The differences between API and Black women and White women were greater than 3 percentage points. The standard of care was met less often for elderly Hispanic women with dementia than for elderly White women with dementia. The difference between elderly Hispanic women and elderly White women was greater than 3 percentage points.
o In the 2015 data, it was observed that the standard of care was met more often for elderly API and Black men with dementia than for elderly White men with dementia. The difference between elderly API men and elderly White men was less than 3 percentage points. The difference between elderly Black men and White men was greater than 3 percentage points. The standard of care was met less often for elderly Hispanic men with dementia than for elderly White men with dementia. The difference between elderly Hispanic men and elderly White men was greater than 3 percentage points.
† This includes antiemetics, antipsychotics, benzodiazepines, tricyclic antidepressants, H2 receptor antagonists, nonbenzodiazepine hypnotics, and anticholinergic agents.
27

Clinical Care: Avoiding Potentially Harmful Drug-Disease Interactions in Elderly Patients with a History of Falls
Percentage of Medicare enrollees age 65 and older with a history of falls who were not dispensed a prescription for a potentially harmful medication,† by race/ethnicity within gender, 2015
Women Men
69.4 60.6
46.7 48.5
0
20
40
60
80
100
Pe
rcen
tage
* (+) * (+)
* 73.9 70.1
56.9 60.2
* (+) * (+)
* (−)
Data source: Clinical quality data collected in 2015 from Medicare health plans nationwide.
Key: API = Asian or Pacific Islander.
Note: Racial groups such as Blacks and Whites are non-Hispanic; Hispanic ethnicity includes all races.
* Significantly different from the score for Whites of the same gender (p < 0.05).
For differences between Whites and racial/ethnic minorities of the same gender that are statistically significant, the following symbols are also used when applicable:
(+) Difference is equal to or larger than 3 points (prior to rounding) and favors the racial/ethnic minority group.
(−) Difference is equal to or larger than 3 points (prior to rounding) and favors Whites.
Disparities
o Potentially harmful medication† should be avoided among elderly adults with a history of falls. In the 2015 data, it was observed that this standard of care was met more often for elderly API and Black women with a history of falls than for elderly White women with a history of falls. The differences between API and Black women and White women were greater than 3 percentage points. This standard of care was met less often for elderly Hispanic women with a history of falls than for elderly White women with a history of falls. The difference between elderly Hispanic women and elderly White women was less than 3 percentage points.
o In the 2015 data, it was observed that this standard of care was met more often for elderly API and Black men with a history of falls than for elderly White men with a history of falls. The differences between API and Black men and White men were greater than 3 percentage points. This standard of care was met less often for elderly Hispanic men with a history of falls than for elderly White men with a history of falls. The difference between elderly Hispanic men and elderly White men was greater than 3 percentage points.
† This includes anticonvulsants, nonbenzodiazepine hypnotics, selective serotonin reuptake inhibitors (SSRIs), antiemetics, antipsychotics, benzodiazepines, and tricyclic antidepressants.
28

Clinical Care: Older Adults’ Access to Preventive/Ambulatory Services
Percentage of Medicare enrollees age 65 and older who had an ambulatory or preventive care visit, by race/ethnicity within gender, 2015
Women Men
95.7 96.8 96.9 97.0
0
20
40
60
80
100
Pe
rcen
tage
* * *
94.8 92.8 94.4 95.3
* * *
Data source: Clinical quality data collected in 2015 from Medicare health plans nationwide.
Key: API = Asian or Pacific Islander.
Note: Racial groups such as Blacks and Whites are non-Hispanic; Hispanic ethnicity includes all races.
* Significantly different from the score for Whites of the same gender (p < 0.05).
For statistically significant differences between Whites and racial/ethnic minorities of the same gender, the following symbols are also used when applicable:
(+) Difference is equal to or larger than 3 points (prior to rounding) and favors the racial/ethnic minority group.
(−) Difference is equal to or larger than 3 points (prior to rounding) and favors Whites.
Disparities
o In the 2015 data, API, Black, and Hispanic women were less likely than White women to have had an ambulatory or preventive care visit. The differences between API, Black, and Hispanic women and White women were less than 3 percentage points.
o In the 2015 data, API, Black, and Hispanic men were less likely than White men to have had an ambulatory or preventive care visit. The differences between API, Black, and Hispanic men and White men were less than 3 percentage points.
29

Clinical Care: Antidepressant Medication Management— Acute-Phase Treatment
Percentage of Medicare enrollees age 18 and older who were diagnosed with a new episode of major depression and remained on antidepressant medication for at least 84 days,
by race/ethnicity within gender, 2015
Women Men
61.4 57.8 61.7 71.6
0
20
40
60
80
100
Pe
rcen
tage
* (−) * (−) * (−)
63.9 55.6
60.6 69.1
* (−) * (−)
Data source: Clinical quality data collected in 2015 from Medicare health plans nationwide.
Key: API = Asian or Pacific Islander.
Note: Racial groups such as Blacks and Whites are non-Hispanic; Hispanic ethnicity includes all races.
* Significantly different from the score for Whites of the same gender (p < 0.05).
For statistically significant differences between Whites and racial/ethnic minorities of the same gender, the following symbols are also used when applicable:
(+) Difference is equal to or larger than 3 points (prior to rounding) and favors the racial/ethnic minority group.
(−) Difference is equal to or larger than 3 points (prior to rounding) and favors Whites.
Disparities
o In the 2015 data, API, Black, and Hispanic women who were diagnosed with a new episode ofmajor depression were less likely than White women who were diagnosed with a new episode ofmajor depression to have remained on antidepressant medication for at least 84 days. Thedifferences between API, Black, and Hispanic women and White women were greater than 3percentage points.
o In the 2015 data, API, Black, and Hispanic men who were diagnosed with a new episode of majordepression were less likely than White men who were diagnosed with a new episode of majordepression to have remained on antidepressant medication for at least 84 days. The differencesbetween API, Black, and Hispanic men and White men were greater than 3 percentage points.
30
* (−)

Clinical Care: Antidepressant Medication Management— Continuation-Phase Treatment
Percentage of Medicare enrollees age 18 and older with a new diagnosis of major depression who were newly treated with antidepressant medication and who remained on an antidepressant medication
treatment for at least 180 days, by race/ethnicity within gender, 2015
Women Men
44.9 41.0 44.0
57.4
0
20
40
60
80
100
Pe
rcen
tage
* (−) * (−) * (−)
46.6 38.9 43.8
54.7 * (−)
* (−) * (−)
Data source: Clinical quality data collected in 2015 from Medicare health plans nationwide.
Key: API = Asian or Pacific Islander.
Note: Racial groups such as Blacks and Whites are non-Hispanic; Hispanic ethnicity includes all races.
* Significantly different from the score for Whites of the same gender (p < 0.05).
For statistically significant differences between Whites and racial/ethnic minorities of the same gender, the following symbols are also used when applicable:
(+) Difference is equal to or larger than 3 points (prior to rounding) and favors the racial/ethnic minority group.
(−) Difference is equal to or larger than 3 points (prior to rounding) and favors Whites.
Disparities
o In the 2015 data, API, Black, and Hispanic women who were diagnosed with a new episode of major depression were less likely than White women who were diagnosed with a new episode of major depression to have remained on antidepressant medication for at least 180 days. The differences between API, Black, and Hispanic women and White women were greater than 3 percentage points.
o In the 2015 data, API, Black, and Hispanic men who were diagnosed with a new episode of major depression were less likely than White men who were diagnosed with a new episode of major depression to have remained on antidepressant medication for at least 180 days. The differences between API, Black, and Hispanic men and White men were greater than 3 percentage points.
31

Clinical Care: Follow-Up Visit After Hospital Stay for Mental Illness (within 7 days of discharge)
Percentage of Medicare enrollees age 6 and older† who were hospitalized for treatment of selected mental health disorders and who had an outpatient visit, an intensive outpatient encounter, or partial
hospitalization with a mental health practitioner within 7 days of discharge, by race/ethnicity within gender, 2015
Women Men
45.0
28.9 39.6 36.6
0
20
40
60
80
100
Pe
rcen
tage
* (+)
* (−) * (+)
38.4
23.8 35.2 32.3
* (+)
* (−) *
Data source: Clinical quality data collected in 2015 from Medicare health plans nationwide.
Key: API = Asian or Pacific Islander.
Note: Racial groups such as Blacks and Whites are non-Hispanic; Hispanic ethnicity includes all races.
* Significantly different from the score for Whites of the same gender (p < 0.05).
For statistically significant differences between Whites and racial/ethnic minorities of the same gender, the following symbols are also used when applicable:
(+) Difference is equal to or larger than 3 points (prior to rounding) and favors the racial/ethnic minority group.
(−) Difference is equal to or larger than 3 points (prior to rounding) and favors Whites.
Disparities
o In the 2015 data, API and Hispanic women hospitalized for a mental health disorder were more likely than White women hospitalized for a mental health disorder to have had a follow-up visit with a mental health practitioner within 7 days of discharge. In contrast, Black women hospitalized for a mental health disorder were less likely than White women hospitalized for a mental health disorder to have had a follow-up visit with a mental health practitioner within 7 days of discharge. The differences between API, Black, and Hispanic women and White women were greater than 3 percentage points.
o In the 2015 data, API and Hispanic men hospitalized for a mental health disorder were more likely than White men hospitalized for a mental health disorder to have had a follow-up visit with a mental health practitioner within 7 days of discharge. The difference between API and White men was greater than 3 percentage points. The difference between Hispanic and White men was less than 3 percentage points. Black men hospitalized for a mental health disorder were less likely than White men hospitalized for a mental health disorder to have had a follow-up visit with
32

a mental health practitioner within 7 days of discharge. The difference between Black and White men was greater than 3 percentage points.
† !lthough the lower-bound age cutoff for this HEDIS measure is 6 years old, the data used in this report are limited to adults.
33

Clinical Care: Follow-Up Visit After Hospital Stay for Mental Illness (within 30 days of discharge)
Percentage of Medicare enrollees age 6 and older† who were hospitalized for treatment of selected mental health disorders and who had an outpatient visit, an intensive outpatient encounter, or partial
hospitalization with a mental health practitioner within 30 days of discharge, by race/ethnicity within gender, 2015
Women Men
66.8
46.9
60.5 58.5
0
20
40
60
80
100
Pe
rcen
tage
* (+)
* (−)
53.1
37.6
53.1 51.2* (−)
Data source: Clinical quality data collected in 2015 from Medicare health plans nationwide.
Key: API = Asian or Pacific Islander.
Note: Racial groups such as Blacks and Whites are non-Hispanic; Hispanic ethnicity includes all races.
* Significantly different from the score for Whites of the same gender (p < 0.05).
For statistically significant differences between Whites and racial/ethnic minorities of the same gender, the following symbols are also used when applicable:
(+) Difference is equal to or larger than 3 points (prior to rounding) and favors the racial/ethnic minority group.
(−) Difference is equal to or larger than 3 points (prior to rounding) and favors Whites.
Disparities
o In the 2015 data, API women hospitalized for a mental health disorder were more likely than White women hospitalized for a mental health disorder to have had a follow-up visit with a mental health practitioner within 30 days of discharge. The difference between API women and White women was greater than 3 percentage points. Black women hospitalized for a mental health disorder were less likely than White women hospitalized for a mental health disorder to have had a follow-up visit with a mental health practitioner within 30 days of discharge. The difference between Black women and White women was greater than 3 percentage points. Hispanic women were as likely as White women to have had a follow-up visit with a mental health practitioner within 30 days of discharge.
o In the 2015 data, Black men hospitalized for a mental health disorder were less likely than White men hospitalized for a mental health disorder to have had a follow-up visit with a mental health practitioner within 30 days of discharge. The difference between Black men and White men was
34

greater than 3 percentage points. API and Hispanic men were as likely as White men to have had a follow-up visit with a mental health practitioner within 30 days of discharge.
† !lthough the lower-bound age cutoff for this HEDIS measure is 6 years old, the data used in this report are limited to adults.
35

Clinical Care: Initiation of Alcohol or Other Drug Treatment Percentage of Medicare enrollees with a new episode of alcohol or drug (AOD) dependence who initiate†
treatment within 14 days of the diagnosis, by race/ethnicity within gender, 2015
Women Men
12.6 26.2 13.3 23.8
0
20
40
60
80
100
Pe
rcen
tage
* (−) *
* (−) 19.3
33.2 22.5
29.4 * (−)
* (+) * (−)
Data source: Clinical quality data collected in 2015 from Medicare health plans nationwide.
Key: API = Asian or Pacific Islander.
Note: Racial groups such as Blacks and Whites are non-Hispanic; Hispanic ethnicity includes all races.
* Significantly different from the score for Whites of the same gender (p < 0.05).
For statistically significant differences between Whites and racial/ethnic minorities of the same gender, the following symbols are also used when applicable:
(+) Difference is equal to or larger than 3 points (prior to rounding) and favors the racial/ethnic minority group.
(−) Difference is equal to or larger than 3 points (prior to rounding) and favors Whites.
Disparities
o In the 2015 data, API and Hispanic women with a new episode of AOD dependence were less likely than White women with a new episode of AOD dependence to have initiated treatment within 14 days of diagnosis. The difference between each of these groups of women and White women was greater than 3 percentage points. Black women with a new episode of AOD dependence were more likely than White women with a new episode of AOD dependence to have initiated treatment within 14 days of diagnosis. The difference between Black women and White women was less than 3 percentage points.
o In the 2015 data, API and Hispanic men with a new episode of AOD dependence were less likely than White men with a new episode of AOD dependence to have initiated treatment within 14 days of diagnosis. The differences between API and Hispanic men and White men were greater than 3 percentage points. Black men with a new episode of AOD dependence were more likely than White men with a new episode of AOD dependence to have initiated treatment within 14 days of the diagnosis. The difference between Black men and White men was greater than 3 percentage points.
† Initiation may occur through an inpatient !OD admission, outpatient visit, intensive outpatient encounter, or partial hospitalization.
36
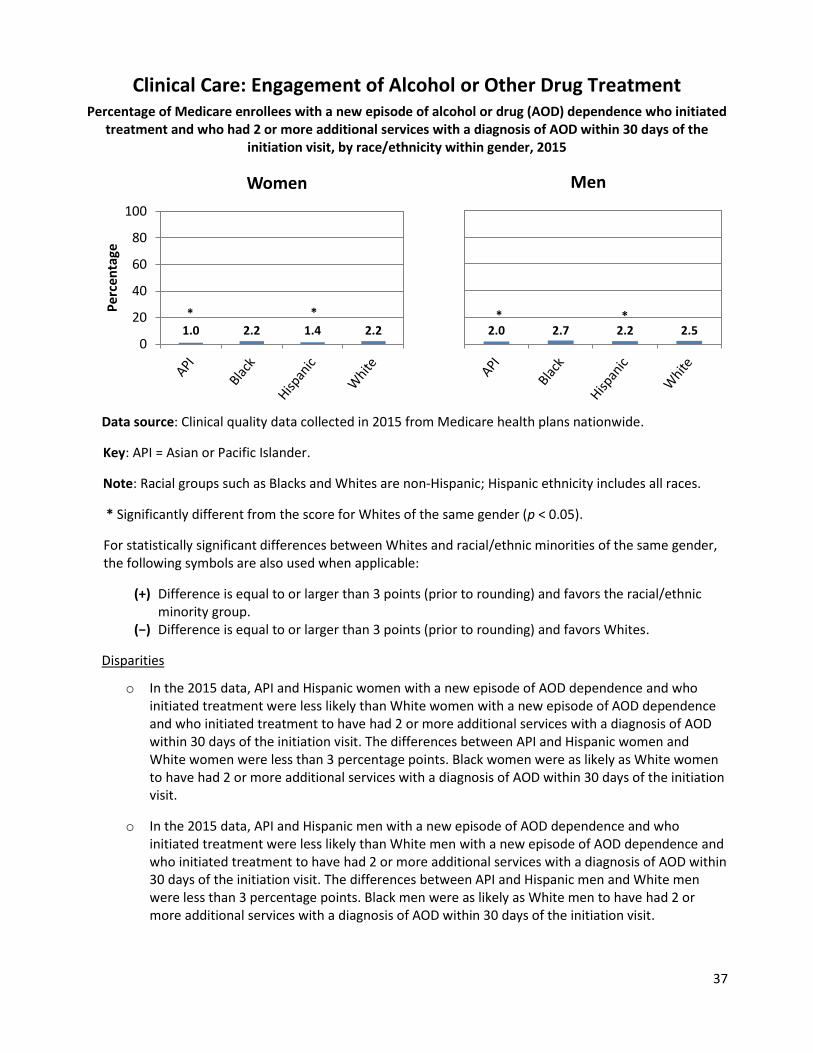
Clinical Care: Engagement of Alcohol or Other Drug Treatment Percentage of Medicare enrollees with a new episode of alcohol or drug (AOD) dependence who initiated
treatment and who had 2 or more additional services with a diagnosis of AOD within 30 days of the initiation visit, by race/ethnicity within gender, 2015
Women Men
Pe
rcen
tage
100
80
60
40
20
0 1.0 2.2 1.4 2.2
* *
2.0 2.7 2.2 2.5 * *
Data source: Clinical quality data collected in 2015 from Medicare health plans nationwide.
Key: API = Asian or Pacific Islander.
Note: Racial groups such as Blacks and Whites are non-Hispanic; Hispanic ethnicity includes all races.
* Significantly different from the score for Whites of the same gender (p < 0.05).
For statistically significant differences between Whites and racial/ethnic minorities of the same gender, the following symbols are also used when applicable:
(+) Difference is equal to or larger than 3 points (prior to rounding) and favors the racial/ethnic minority group.
(−) Difference is equal to or larger than 3 points (prior to rounding) and favors Whites.
Disparities
o In the 2015 data, API and Hispanic women with a new episode of AOD dependence and who initiated treatment were less likely than White women with a new episode of AOD dependence and who initiated treatment to have had 2 or more additional services with a diagnosis of AOD within 30 days of the initiation visit. The differences between API and Hispanic women and White women were less than 3 percentage points. Black women were as likely as White women to have had 2 or more additional services with a diagnosis of AOD within 30 days of the initiation visit.
o In the 2015 data, API and Hispanic men with a new episode of AOD dependence and who initiated treatment were less likely than White men with a new episode of AOD dependence and who initiated treatment to have had 2 or more additional services with a diagnosis of AOD within 30 days of the initiation visit. The differences between API and Hispanic men and White men were less than 3 percentage points. Black men were as likely as White men to have had 2 or more additional services with a diagnosis of AOD within 30 days of the initiation visit.
37

38
Suggested Citation:CMS Office of Minority Health and RAND Corporation. Racial and Ethnic Disparities by Gender in HealthCare in Medicare Advantage. Baltimore, MD. 2017.
Copyright Information:This communication was produced, published, and disseminated at U.S. taxpayer expense. All materialappearing in this report is in the public domain and may be reproduced or copied without permission;citation as to source, however, is appreciated.