racial characteristics of the michigan teacher workforce · racial/ethnic composition of michigan...
TRANSCRIPT
White Paper | April 2018
Racial Characteristics of the Michigan Teacher Workforce
Shannon Stackhouse, Ph.D.
1 | P a g e
Contents Racial Characteristics of the Michigan Teacher Workforce ................................................................................................... 0
Introduction ........................................................................................................................................................................ 2
Diversity in the Workforce .............................................................................................................................................. 2
Key Terms and Data Considerations ................................................................................................................................... 3
Results and Analysis ............................................................................................................................................................ 3
Racial Diversity in the Michigan Teacher Workforce .......................................................................................................... 4
Q1. What is the current racial/ethnic distribution of teachers in Michigan? ............................................................. 4
Q2. What has been the longitudinal trend in Michigan teacher staffing, by race/ethnicity? .................................... 4
Q3. How have student racial/ethnic demographics changed over the same period? ............................................... 7
Q4. How does the racial/ethnic composition of the Michigan teaching force compare with the U.S. teaching force? .......................................................................................................................................................................... 8
Q5. How do the racial/ethnic demographics of Michigan teachers compare with the overall Michigan workforce?..................................................................................................................................................................................... 9
Racial Diversity in the Michigan Teacher Pipeline .............................................................................................................. 9
Preparation: Enrollment and Certification ...................................................................................................................... 9
Q6. What is the racial/ethnic distribution of candidates enrolled in educator preparation programs in Michigan (2016-2017)? .............................................................................................................................................................10
Q7. What is the racial distribution of initial teaching certificates issued, and how has it changed over time? ....... 10
Placement: New Hires ................................................................................................................................................... 12
Q8: What is the racial/ethnic distribution of the most recent cohort of newly hired teachers, and how has it changed over time? .................................................................................................................................................. 12
Q9. How does the racial/ethnic distribution change from high school graduation to staffing of new teachers within one graduating class? .................................................................................................................................... 13
Retention: Mobility ....................................................................................................................................................... 14
Q10. How do Michigan teacher retention, mobility and attrition differ by race/ethnicity and how do they compare with national rates? ................................................................................................................................... 15
Q11. Have teacher retention and mobility within Michigan changed over time, overall and by race/ethnicity? ... 16
Summary of Findings ..................................................................................................................................................... 18
Policy Implications and Next Steps ................................................................................................................................... 18
References ........................................................................................................................................................................ 22
2 | P a g e
Introduction The purpose of this brief is to report on the racial/ethnic demographics of the educator workforce in Michigan at key points along the teacher pipeline.
A healthy and vibrant educator workforce is an important component of high-functioning education systems. The state of Michigan has identified an effective education workforce as one of its four focus areas in Michigan’s Top 10 in 10 Strategic Plan.
This white paper is part of a series designed to leverage the rich data sources available through the Michigan Department of Education (MDE) and the Center for Educational Performance and Information (CEPI) to present information pertaining to pressing workforce issues. This work is intended to support internal and external stakeholders in making informed decisions regarding educator preparation, credentialing, recruitment, hiring, professional development, and retention.
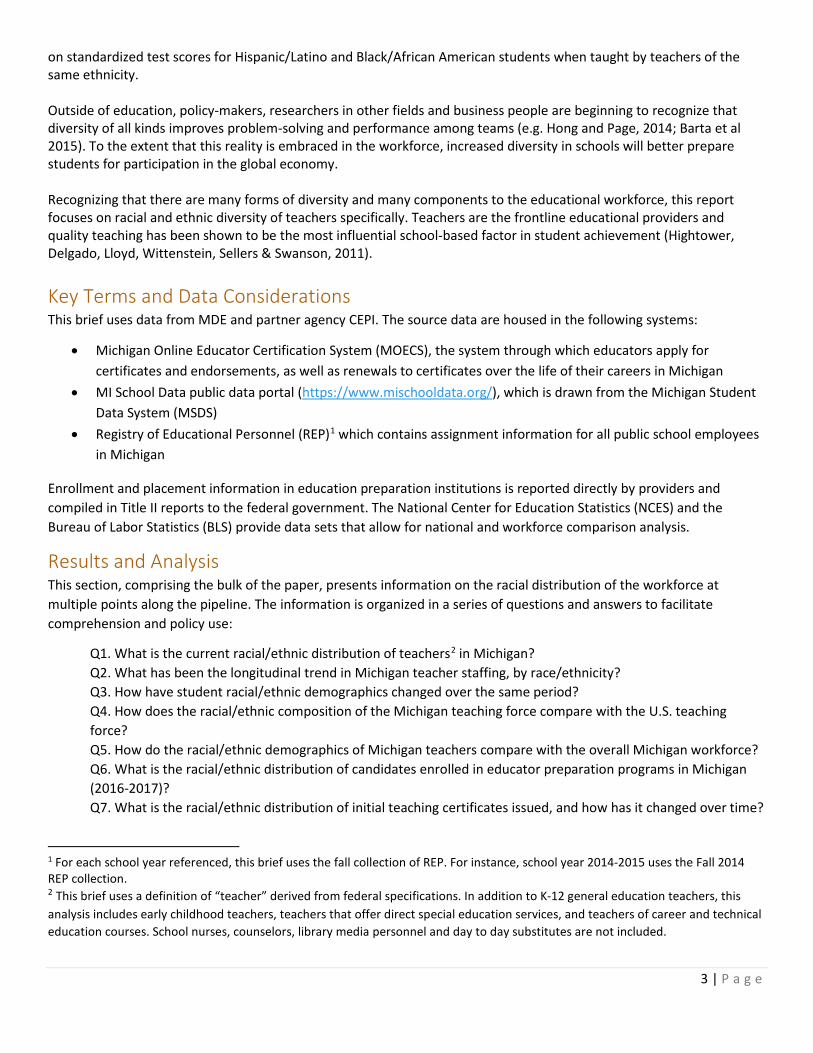
The teacher pipeline may be conceptualized in many ways. Figure 1 is a representation of Michigan’s teacher pipeline, useful to understanding the analyses in this brief.
Figure 1. Michigan teacher pipeline
Diversity in the Workforce
The issue of diversity in the education workforce is discussed and debated among academic researchers and policymakers, as well as at the local level as school leaders respond to diversifying student populations. Researchers theorize that higher numbers of minority teachers produce benefits for all students, as well as specific benefits for minority students. The U.S. Department of Education (2016) stated that:
Improving teacher diversity can help all students. Teachers of color are positive role models for all students in breaking down negative stereotypes and preparing students to live and work in a multiracial society. A more diverse teacher workforce can also supplement training in the culturally sensitive teaching practices most effective with today’s student populations. (p. 1)
The same report cited research that teachers of color can contribute to closing the persistent achievement gap via a number of possible mechanisms. Researchers lend support to arguments that minority teachers: 1.) have higher expectations for minority students; 2.) serve as advocates for minority students 3.) develop more trusting relationships with minority students and 4.) serve as role models for minority students (Villegas, 2010). Additionally, minority teachers have been found more likely to seek positions in low-income minority communities, which are often in greatest need for teachers (e.g. Sutcher et al, 2016; Ingersoll & May, 2016).
There is additional research to support the positive impact of minority teachers on the academic achievement of minority students (Villegas & Irvine, 2010). For example, researchers such as Dee (2004) have found significant impact
Prepare• Recruit• Train• Certify
Place• Hire• Assign
Develop• Induct• Evaluate• Grow
Retain• Recognize• Advance
3 | P a g e
on standardized test scores for Hispanic/Latino and Black/African American students when taught by teachers of the same ethnicity.
Outside of education, policy-makers, researchers in other fields and business people are beginning to recognize that diversity of all kinds improves problem-solving and performance among teams (e.g. Hong and Page, 2014; Barta et al 2015). To the extent that this reality is embraced in the workforce, increased diversity in schools will better prepare students for participation in the global economy.
Recognizing that there are many forms of diversity and many components to the educational workforce, this report focuses on racial and ethnic diversity of teachers specifically. Teachers are the frontline educational providers and quality teaching has been shown to be the most influential school-based factor in student achievement (Hightower, Delgado, Lloyd, Wittenstein, Sellers & Swanson, 2011).
Key Terms and Data Considerations This brief uses data from MDE and partner agency CEPI. The source data are housed in the following systems:
• Michigan Online Educator Certification System (MOECS), the system through which educators apply forcertificates and endorsements, as well as renewals to certificates over the life of their careers in Michigan
• MI School Data public data portal (https://www.mischooldata.org/), which is drawn from the Michigan StudentData System (MSDS)
• Registry of Educational Personnel (REP)1 which contains assignment information for all public school employeesin Michigan
Enrollment and placement information in education preparation institutions is reported directly by providers and compiled in Title II reports to the federal government. The National Center for Education Statistics (NCES) and the Bureau of Labor Statistics (BLS) provide data sets that allow for national and workforce comparison analysis.
Results and Analysis This section, comprising the bulk of the paper, presents information on the racial distribution of the workforce at multiple points along the pipeline. The information is organized in a series of questions and answers to facilitate comprehension and policy use:
Q1. What is the current racial/ethnic distribution of teachers2 in Michigan? Q2. What has been the longitudinal trend in Michigan teacher staffing, by race/ethnicity? Q3. How have student racial/ethnic demographics changed over the same period? Q4. How does the racial/ethnic composition of the Michigan teaching force compare with the U.S. teaching force? Q5. How do the racial/ethnic demographics of Michigan teachers compare with the overall Michigan workforce? Q6. What is the racial/ethnic distribution of candidates enrolled in educator preparation programs in Michigan (2016-2017)? Q7. What is the racial/ethnic distribution of initial teaching certificates issued, and how has it changed over time?
1 For each school year referenced, this brief uses the fall collection of REP. For instance, school year 2014-2015 uses the Fall 2014 REP collection. 2 This brief uses a definition of “teacher” derived from federal specifications. In addition to K-12 general education teachers, this analysis includes early childhood teachers, teachers that offer direct special education services, and teachers of career and technical education courses. School nurses, counselors, library media personnel and day to day substitutes are not included.
4 | P a g e
Q8: What is the racial/ethnic distribution of the most recent cohort of newly hired teachers, and how has it changed over time? Q9. How does the racial/ethnic distribution change from high school graduation to staffing of new teachers within one graduating class? Q10. How do Michigan teacher retention and mobility differ by race/ethnicity and how do they compare with national rates? Q11. Have teacher retention and mobility within Michigan changed over time, overall and by race/ethnicity?
Racial Diversity in the Michigan Teacher Workforce
Q1. What is the current racial/ethnic distribution of teachers in Michigan?
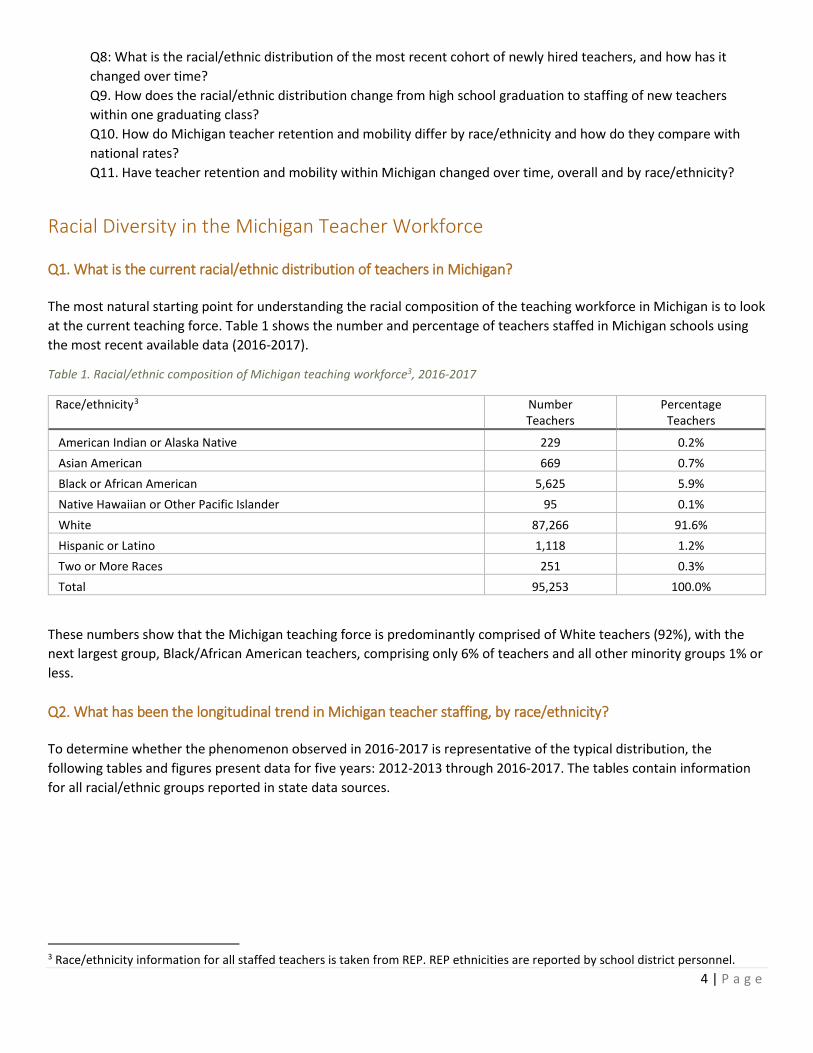
The most natural starting point for understanding the racial composition of the teaching workforce in Michigan is to look at the current teaching force. Table 1 shows the number and percentage of teachers staffed in Michigan schools using the most recent available data (2016-2017).
Table 1. Racial/ethnic composition of Michigan teaching workforce3, 2016-2017
Race/ethnicity3 Number Teachers
Percentage Teachers
American Indian or Alaska Native 229 0.2% Asian American 669 0.7% Black or African American 5,625 5.9% Native Hawaiian or Other Pacific Islander 95 0.1% White 87,266 91.6% Hispanic or Latino 1,118 1.2% Two or More Races 251 0.3% Total 95,253 100.0%
These numbers show that the Michigan teaching force is predominantly comprised of White teachers (92%), with the next largest group, Black/African American teachers, comprising only 6% of teachers and all other minority groups 1% or less.
Q2. What has been the longitudinal trend in Michigan teacher staffing, by race/ethnicity?
To determine whether the phenomenon observed in 2016-2017 is representative of the typical distribution, the following tables and figures present data for five years: 2012-2013 through 2016-2017. The tables contain information for all racial/ethnic groups reported in state data sources.
3 Race/ethnicity information for all staffed teachers is taken from REP. REP ethnicities are reported by school district personnel.
5 | P a g e
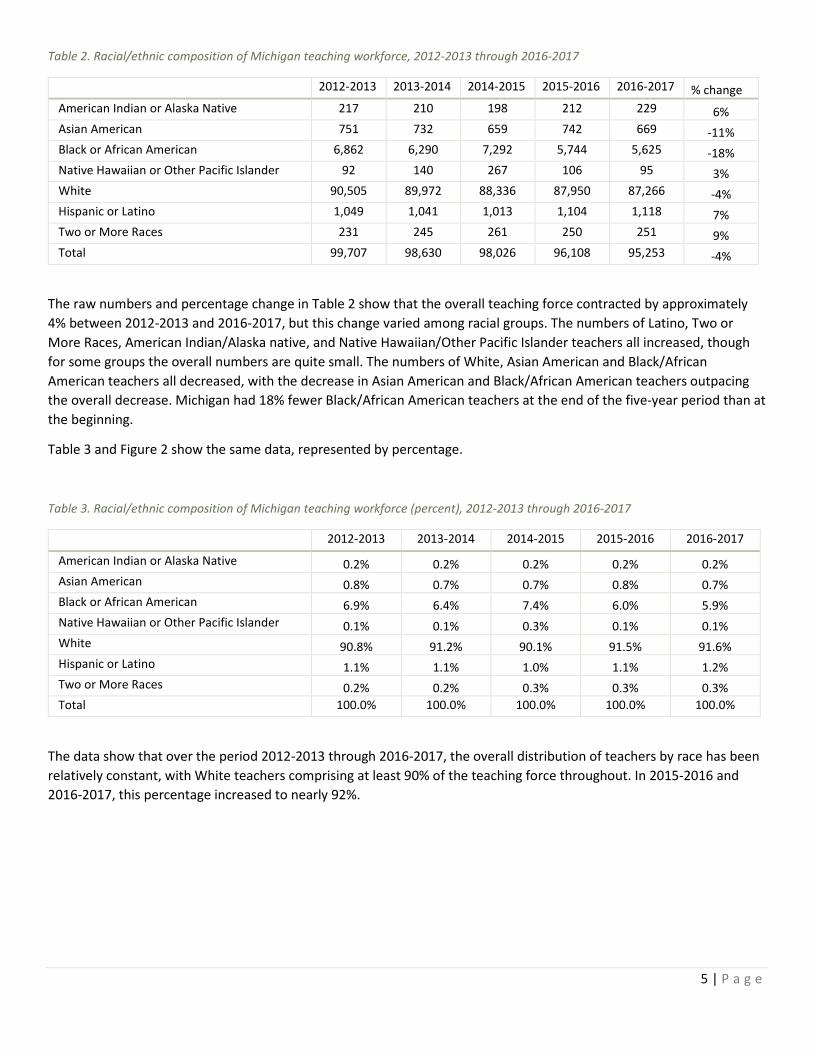
Table 2. Racial/ethnic composition of Michigan teaching workforce, 2012-2013 through 2016-2017
2012-2013 2013-2014 2014-2015 2015-2016 2016-2017 % change American Indian or Alaska Native 217 210 198 212 229 6% Asian American 751 732 659 742 669 -11% Black or African American 6,862 6,290 7,292 5,744 5,625 -18% Native Hawaiian or Other Pacific Islander 92 140 267 106 95 3% White 90,505 89,972 88,336 87,950 87,266 -4% Hispanic or Latino 1,049 1,041 1,013 1,104 1,118 7% Two or More Races 231 245 261 250 251 9% Total 99,707 98,630 98,026 96,108 95,253 -4%
The raw numbers and percentage change in Table 2 show that the overall teaching force contracted by approximately 4% between 2012-2013 and 2016-2017, but this change varied among racial groups. The numbers of Latino, Two or More Races, American Indian/Alaska native, and Native Hawaiian/Other Pacific Islander teachers all increased, though for some groups the overall numbers are quite small. The numbers of White, Asian American and Black/African American teachers all decreased, with the decrease in Asian American and Black/African American teachers outpacing the overall decrease. Michigan had 18% fewer Black/African American teachers at the end of the five-year period than at the beginning.
Table 3 and Figure 2 show the same data, represented by percentage.
Table 3. Racial/ethnic composition of Michigan teaching workforce (percent), 2012-2013 through 2016-2017
2012-2013 2013-2014 2014-2015 2015-2016 2016-2017
American Indian or Alaska Native 0.2% 0.2% 0.2% 0.2% 0.2% Asian American 0.8% 0.7% 0.7% 0.8% 0.7% Black or African American 6.9% 6.4% 7.4% 6.0% 5.9% Native Hawaiian or Other Pacific Islander 0.1% 0.1% 0.3% 0.1% 0.1% White 90.8% 91.2% 90.1% 91.5% 91.6% Hispanic or Latino 1.1% 1.1% 1.0% 1.1% 1.2% Two or More Races 0.2% 0.2% 0.3% 0.3% 0.3% Total 100.0% 100.0% 100.0% 100.0% 100.0%
The data show that over the period 2012-2013 through 2016-2017, the overall distribution of teachers by race has been relatively constant, with White teachers comprising at least 90% of the teaching force throughout. In 2015-2016 and 2016-2017, this percentage increased to nearly 92%.
6 | P a g e
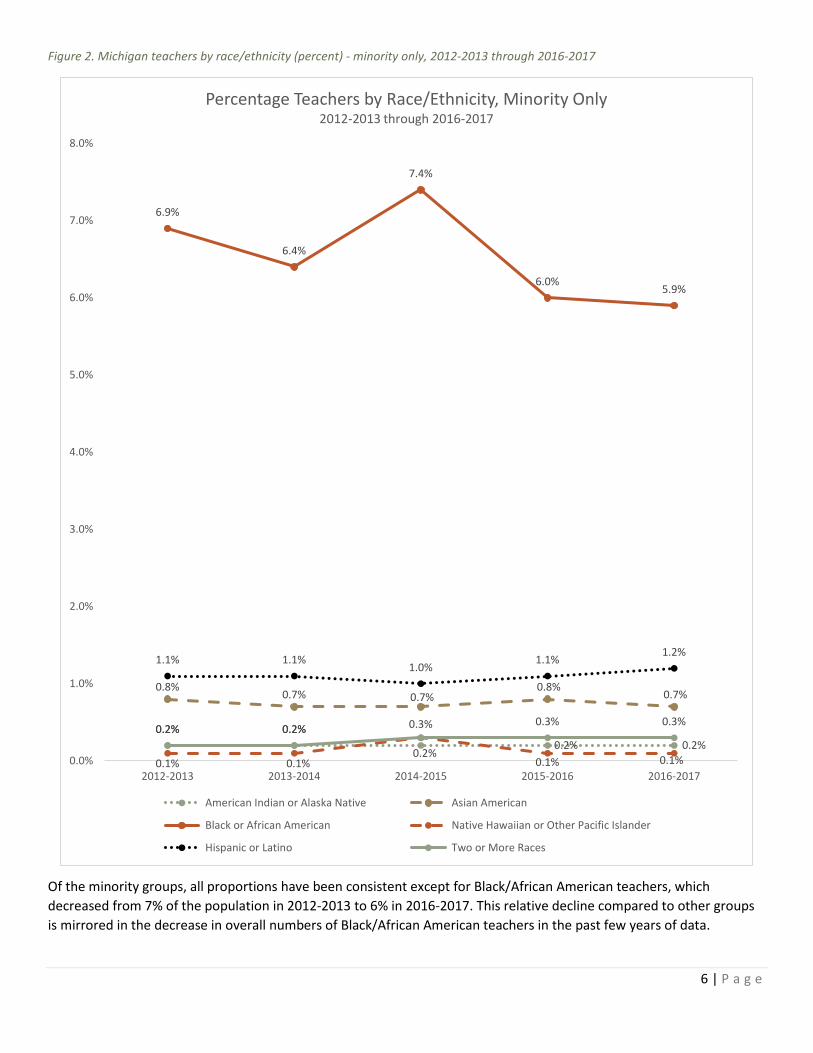
Figure 2. Michigan teachers by race/ethnicity (percent) - minority only, 2012-2013 through 2016-2017
Of the minority groups, all proportions have been consistent except for Black/African American teachers, which decreased from 7% of the population in 2012-2013 to 6% in 2016-2017. This relative decline compared to other groups is mirrored in the decrease in overall numbers of Black/African American teachers in the past few years of data.
0.2% 0.2%
0.2%0.2% 0.2%
0.8%0.7% 0.7%
0.8%0.7%
6.9%
6.4%
7.4%
6.0%5.9%
0.1% 0.1% 0.1% 0.1%
1.1% 1.1%1.0%
1.1%1.2%
0.2% 0.2% 0.3% 0.3% 0.3%
0.0%
1.0%
2.0%
3.0%
4.0%
5.0%
6.0%
7.0%
8.0%
2012-2013 2013-2014 2014-2015 2015-2016 2016-2017
Percentage Teachers by Race/Ethnicity, Minority Only2012-2013 through 2016-2017
American Indian or Alaska Native Asian American
Black or African American Native Hawaiian or Other Pacific Islander
Hispanic or Latino Two or More Races
7 | P a g e
Q3. How have student racial/ethnic demographics changed over the same period?
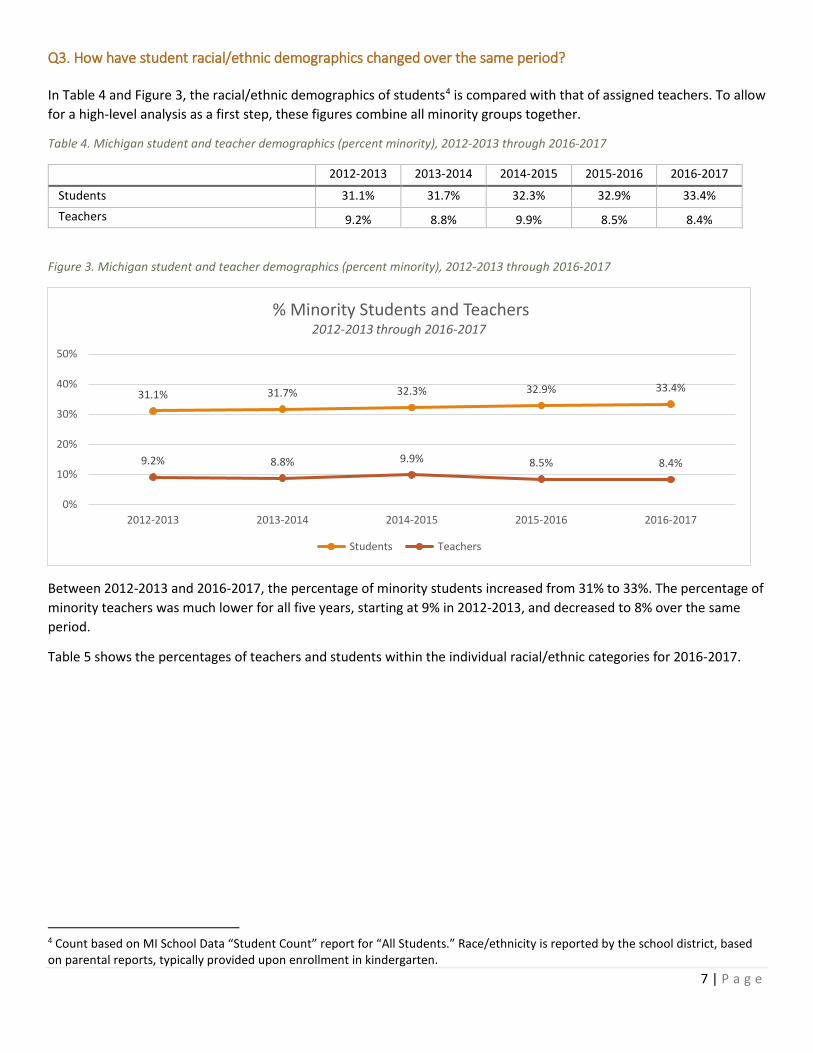
In Table 4 and Figure 3, the racial/ethnic demographics of students4 is compared with that of assigned teachers. To allow for a high-level analysis as a first step, these figures combine all minority groups together.
Table 4. Michigan student and teacher demographics (percent minority), 2012-2013 through 2016-2017
2012-2013 2013-2014 2014-2015 2015-2016 2016-2017
Students 31.1% 31.7% 32.3% 32.9% 33.4% Teachers 9.2% 8.8% 9.9% 8.5% 8.4%
Figure 3. Michigan student and teacher demographics (percent minority), 2012-2013 through 2016-2017
Between 2012-2013 and 2016-2017, the percentage of minority students increased from 31% to 33%. The percentage of minority teachers was much lower for all five years, starting at 9% in 2012-2013, and decreased to 8% over the same period.
Table 5 shows the percentages of teachers and students within the individual racial/ethnic categories for 2016-2017.
4 Count based on MI School Data “Student Count” report for “All Students.” Race/ethnicity is reported by the school district, based on parental reports, typically provided upon enrollment in kindergarten.
31.1% 31.7% 32.3% 32.9% 33.4%
9.2% 8.8% 9.9% 8.5% 8.4%
0%
10%
20%
30%
40%
50%
2012-2013 2013-2014 2014-2015 2015-2016 2016-2017
% Minority Students and Teachers2012-2013 through 2016-2017
Students Teachers
8 | P a g e
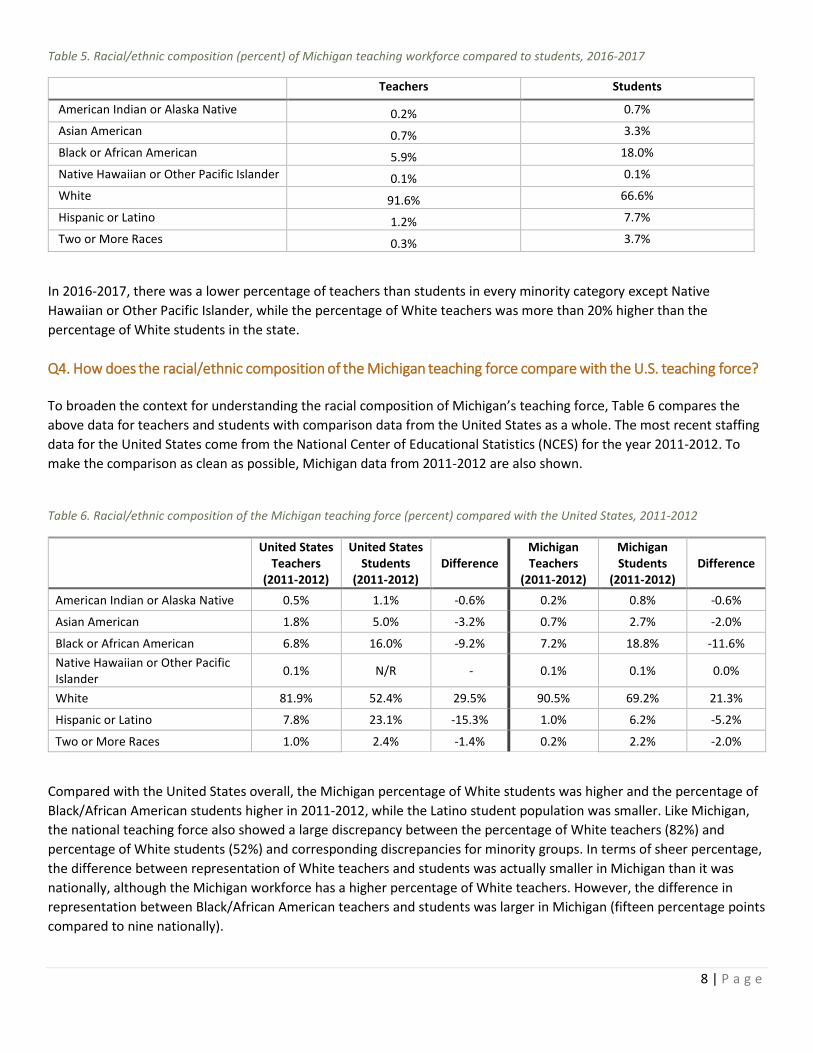
Table 5. Racial/ethnic composition (percent) of Michigan teaching workforce compared to students, 2016-2017
Teachers Students
American Indian or Alaska Native 0.2% 0.7%
Asian American 0.7% 3.3%
Black or African American 5.9% 18.0%
Native Hawaiian or Other Pacific Islander 0.1% 0.1%
White 91.6% 66.6%
Hispanic or Latino 1.2% 7.7%
Two or More Races 0.3% 3.7%
In 2016-2017, there was a lower percentage of teachers than students in every minority category except Native Hawaiian or Other Pacific Islander, while the percentage of White teachers was more than 20% higher than the percentage of White students in the state.
Q4. How does the racial/ethnic composition of the Michigan teaching force compare with the U.S. teaching force?
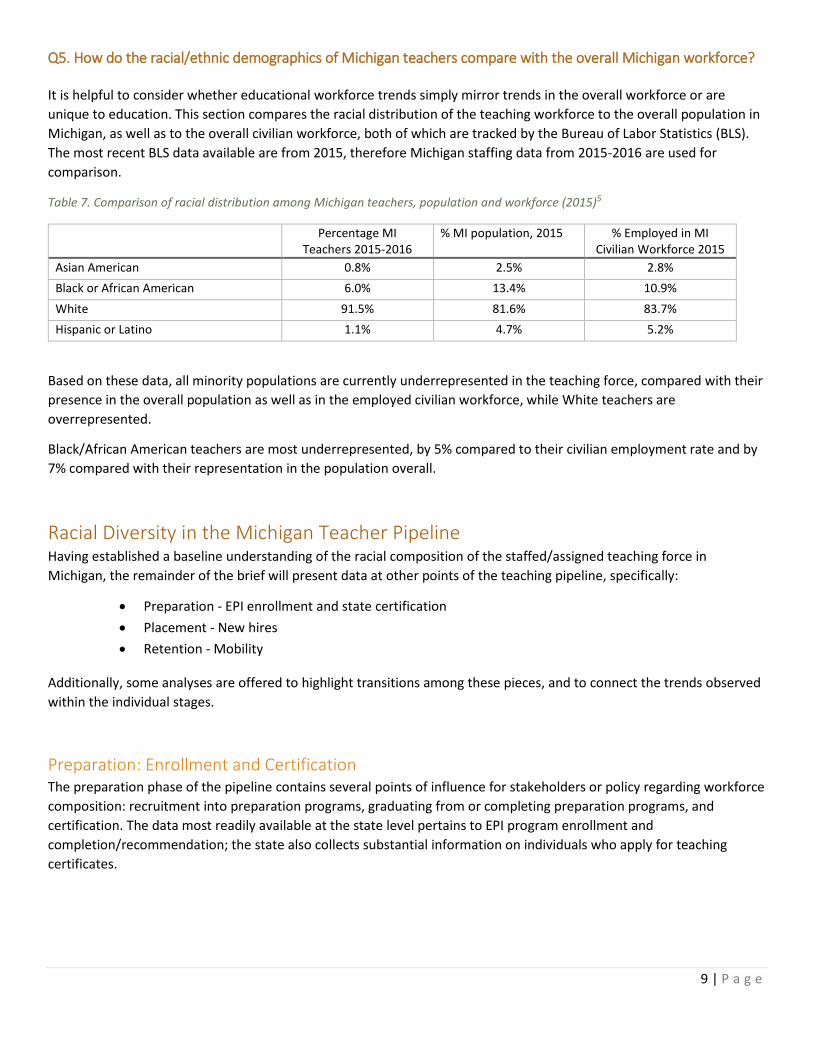
To broaden the context for understanding the racial composition of Michigan’s teaching force, Table 6 compares the above data for teachers and students with comparison data from the United States as a whole. The most recent staffing data for the United States come from the National Center of Educational Statistics (NCES) for the year 2011-2012. To make the comparison as clean as possible, Michigan data from 2011-2012 are also shown.
Table 6. Racial/ethnic composition of the Michigan teaching force (percent) compared with the United States, 2011-2012
United States Teachers
(2011-2012)
United States Students
(2011-2012) Difference
Michigan Teachers
(2011-2012)
Michigan Students
(2011-2012) Difference
American Indian or Alaska Native 0.5% 1.1% -0.6% 0.2% 0.8% -0.6%
Asian American 1.8% 5.0% -3.2% 0.7% 2.7% -2.0%
Black or African American 6.8% 16.0% -9.2% 7.2% 18.8% -11.6%Native Hawaiian or Other Pacific Islander 0.1% N/R - 0.1% 0.1% 0.0%
White 81.9% 52.4% 29.5% 90.5% 69.2% 21.3%
Hispanic or Latino 7.8% 23.1% -15.3% 1.0% 6.2% -5.2%
Two or More Races 1.0% 2.4% -1.4% 0.2% 2.2% -2.0%
Compared with the United States overall, the Michigan percentage of White students was higher and the percentage of Black/African American students higher in 2011-2012, while the Latino student population was smaller. Like Michigan, the national teaching force also showed a large discrepancy between the percentage of White teachers (82%) and percentage of White students (52%) and corresponding discrepancies for minority groups. In terms of sheer percentage, the difference between representation of White teachers and students was actually smaller in Michigan than it was nationally, although the Michigan workforce has a higher percentage of White teachers. However, the difference in representation between Black/African American teachers and students was larger in Michigan (fifteen percentage points compared to nine nationally).
9 | P a g e
Q5. How do the racial/ethnic demographics of Michigan teachers compare with the overall Michigan workforce?
It is helpful to consider whether educational workforce trends simply mirror trends in the overall workforce or are unique to education. This section compares the racial distribution of the teaching workforce to the overall population in Michigan, as well as to the overall civilian workforce, both of which are tracked by the Bureau of Labor Statistics (BLS). The most recent BLS data available are from 2015, therefore Michigan staffing data from 2015-2016 are used for comparison.
Table 7. Comparison of racial distribution among Michigan teachers, population and workforce (2015)5
Percentage MI Teachers 2015-2016
% MI population, 2015 % Employed in MI Civilian Workforce 2015
Asian American 0.8% 2.5% 2.8% Black or African American 6.0% 13.4% 10.9% White 91.5% 81.6% 83.7% Hispanic or Latino 1.1% 4.7% 5.2%
Based on these data, all minority populations are currently underrepresented in the teaching force, compared with their presence in the overall population as well as in the employed civilian workforce, while White teachers are overrepresented.
Black/African American teachers are most underrepresented, by 5% compared to their civilian employment rate and by 7% compared with their representation in the population overall.
Racial Diversity in the Michigan Teacher Pipeline Having established a baseline understanding of the racial composition of the staffed/assigned teaching force in Michigan, the remainder of the brief will present data at other points of the teaching pipeline, specifically:
• Preparation - EPI enrollment and state certification• Placement - New hires• Retention - Mobility
Additionally, some analyses are offered to highlight transitions among these pieces, and to connect the trends observed within the individual stages.
Preparation: Enrollment and Certification The preparation phase of the pipeline contains several points of influence for stakeholders or policy regarding workforce composition: recruitment into preparation programs, graduating from or completing preparation programs, and certification. The data most readily available at the state level pertains to EPI program enrollment and completion/recommendation; the state also collects substantial information on individuals who apply for teaching certificates.
10 | P a g e
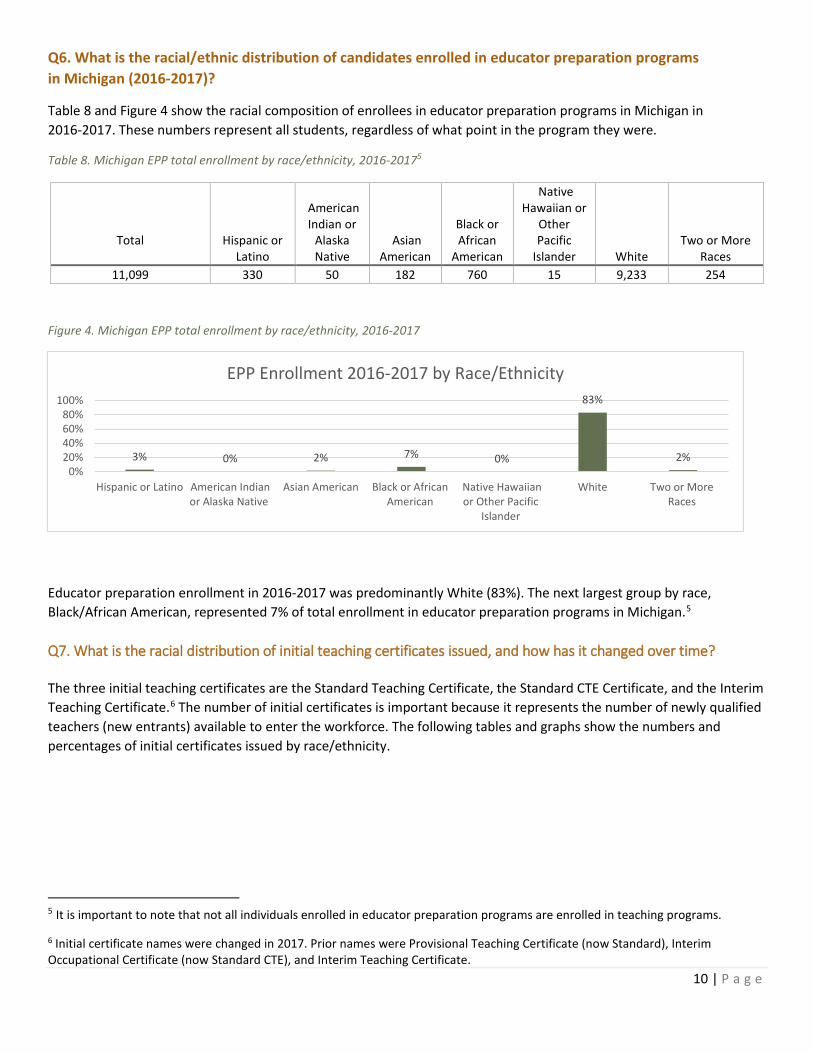
Q6. What is the racial/ethnic distribution of candidates enrolled in educator preparation programs in Michigan (2016-2017)?
Table 8 and Figure 4 show the racial composition of enrollees in educator preparation programs in Michigan in 2016-2017. These numbers represent all students, regardless of what point in the program they were.
Table 8. Michigan EPP total enrollment by race/ethnicity, 2016-20175
Total Hispanic or Latino
American Indian or
Alaska Native
Asian American
Black or African
American
Native Hawaiian or
Other Pacific
Islander White Two or More
Races 11,099 330 50 182 760 15 9,233 254
Figure 4. Michigan EPP total enrollment by race/ethnicity, 2016-2017
Educator preparation enrollment in 2016-2017 was predominantly White (83%). The next largest group by race, Black/African American, represented 7% of total enrollment in educator preparation programs in Michigan.5
Q7. What is the racial distribution of initial teaching certificates issued, and how has it changed over time?
The three initial teaching certificates are the Standard Teaching Certificate, the Standard CTE Certificate, and the Interim Teaching Certificate.6 The number of initial certificates is important because it represents the number of newly qualified teachers (new entrants) available to enter the workforce. The following tables and graphs show the numbers and percentages of initial certificates issued by race/ethnicity.
5 It is important to note that not all individuals enrolled in educator preparation programs are enrolled in teaching programs.
6 Initial certificate names were changed in 2017. Prior names were Provisional Teaching Certificate (now Standard), Interim Occupational Certificate (now Standard CTE), and Interim Teaching Certificate.
3% 0% 2% 7% 0%
83%
2%0%
20%40%60%80%
100%
Hispanic or Latino American Indianor Alaska Native
Asian American Black or AfricanAmerican
Native Hawaiianor Other Pacific
Islander
White Two or MoreRaces
EPP Enrollment 2016-2017 by Race/Ethnicity
11 | P a g e
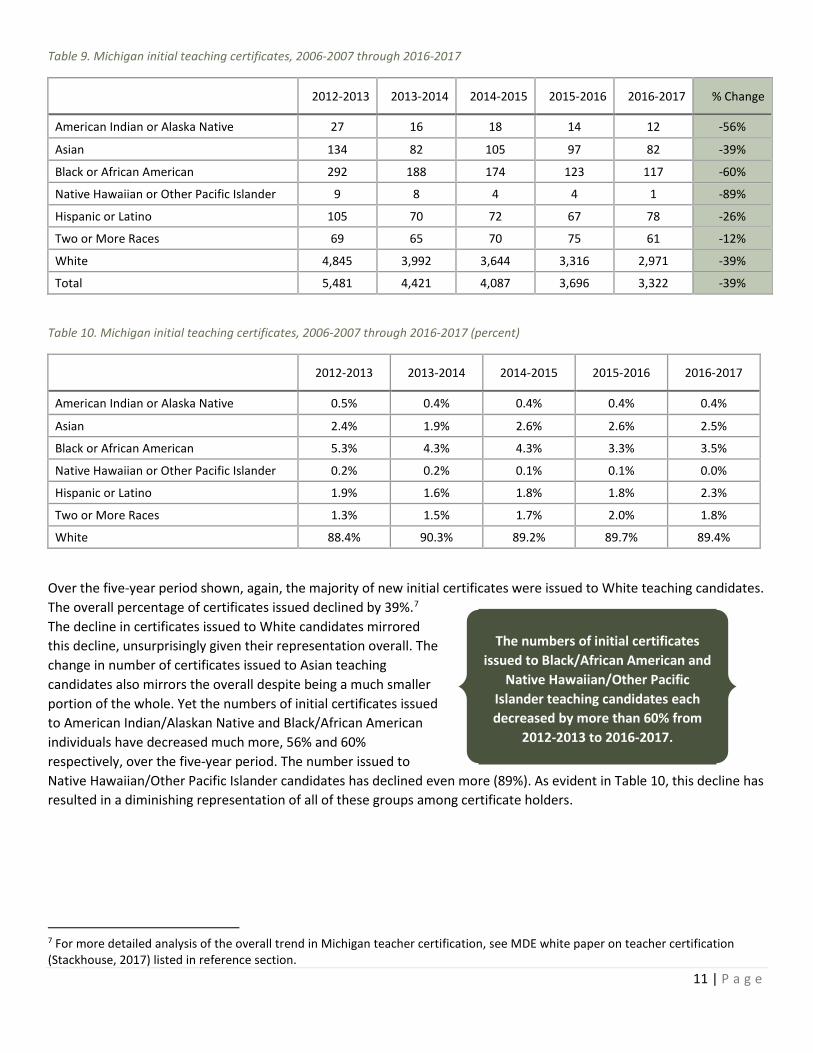
Table 9. Michigan initial teaching certificates, 2006-2007 through 2016-2017
2012-2013 2013-2014 2014-2015 2015-2016 2016-2017 % Change
American Indian or Alaska Native 27 16 18 14 12 -56%
Asian 134 82 105 97 82 -39%
Black or African American 292 188 174 123 117 -60%
Native Hawaiian or Other Pacific Islander 9 8 4 4 1 -89%
Hispanic or Latino 105 70 72 67 78 -26%
Two or More Races 69 65 70 75 61 -12%
White 4,845 3,992 3,644 3,316 2,971 -39%
Total 5,481 4,421 4,087 3,696 3,322 -39%
Table 10. Michigan initial teaching certificates, 2006-2007 through 2016-2017 (percent)
2012-2013 2013-2014 2014-2015 2015-2016 2016-2017
American Indian or Alaska Native 0.5% 0.4% 0.4% 0.4% 0.4%
Asian 2.4% 1.9% 2.6% 2.6% 2.5%
Black or African American 5.3% 4.3% 4.3% 3.3% 3.5%
Native Hawaiian or Other Pacific Islander 0.2% 0.2% 0.1% 0.1% 0.0%
Hispanic or Latino 1.9% 1.6% 1.8% 1.8% 2.3%
Two or More Races 1.3% 1.5% 1.7% 2.0% 1.8%
White 88.4% 90.3% 89.2% 89.7% 89.4%
Over the five-year period shown, again, the majority of new initial certificates were issued to White teaching candidates. The overall percentage of certificates issued declined by 39%.7 The decline in certificates issued to White candidates mirrored this decline, unsurprisingly given their representation overall. The change in number of certificates issued to Asian teaching candidates also mirrors the overall despite being a much smaller portion of the whole. Yet the numbers of initial certificates issued to American Indian/Alaskan Native and Black/African American individuals have decreased much more, 56% and 60% respectively, over the five-year period. The number issued to Native Hawaiian/Other Pacific Islander candidates has declined even more (89%). As evident in Table 10, this decline has resulted in a diminishing representation of all of these groups among certificate holders.
7 For more detailed analysis of the overall trend in Michigan teacher certification, see MDE white paper on teacher certification (Stackhouse, 2017) listed in reference section.
The numbers of initial certificates issued to Black/African American and
Native Hawaiian/Other Pacific Islander teaching candidates each decreased by more than 60% from
2012-2013 to 2016-2017.
12 | P a g e
Placement: New Hires
Q8: What is the racial/ethnic distribution of the most recent cohort of newly hired teachers, and how has it changed over time?
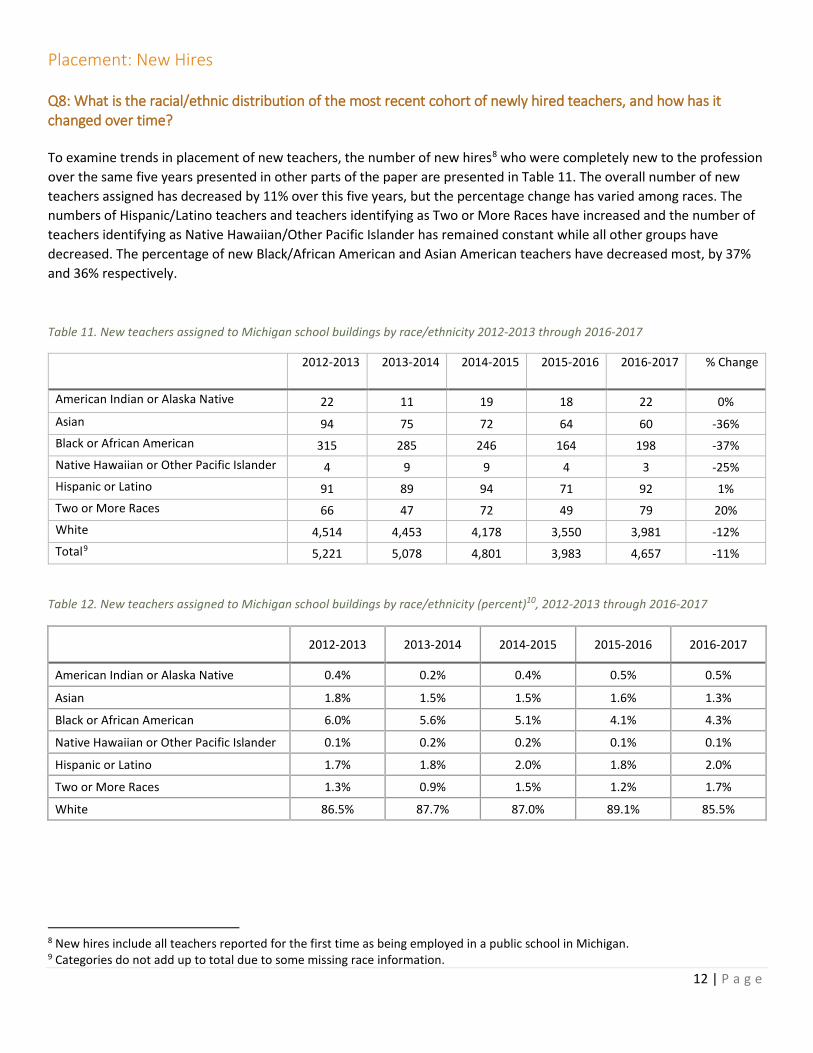
To examine trends in placement of new teachers, the number of new hires8 who were completely new to the profession over the same five years presented in other parts of the paper are presented in Table 11. The overall number of new teachers assigned has decreased by 11% over this five years, but the percentage change has varied among races. The numbers of Hispanic/Latino teachers and teachers identifying as Two or More Races have increased and the number of teachers identifying as Native Hawaiian/Other Pacific Islander has remained constant while all other groups have decreased. The percentage of new Black/African American and Asian American teachers have decreased most, by 37% and 36% respectively.
Table 11. New teachers assigned to Michigan school buildings by race/ethnicity 2012-2013 through 2016-2017
2012-2013 2013-2014 2014-2015 2015-2016 2016-2017 % Change
American Indian or Alaska Native 22 11 19 18 22 0% Asian 94 75 72 64 60 -36%Black or African American 315 285 246 164 198 -37%Native Hawaiian or Other Pacific Islander 4 9 9 4 3 -25%Hispanic or Latino 91 89 94 71 92 1% Two or More Races 66 47 20% 72 49 79 White 4,514 4,453 4,178 3,550 3,981 -12%Total9 5,221 5,078 4,801 3,983 4,657 -11%
Table 12. New teachers assigned to Michigan school buildings by race/ethnicity (percent)10, 2012-2013 through 2016-2017
2012-2013 2013-2014 2014-2015 2015-2016 2016-2017
American Indian or Alaska Native 0.4% 0.2% 0.4% 0.5% 0.5%
Asian 1.8% 1.5% 1.5% 1.6% 1.3%
Black or African American 6.0% 5.6% 5.1% 4.1% 4.3%
Native Hawaiian or Other Pacific Islander 0.1% 0.2% 0.2% 0.1% 0.1%
Hispanic or Latino 1.7% 1.8% 2.0% 1.8% 2.0%
Two or More Races 1.3% 0.9% 1.5% 1.2% 1.7%
White 86.5% 87.7% 87.0% 89.1% 85.5%
8 New hires include all teachers reported for the first time as being employed in a public school in Michigan. 9 Categories do not add up to total due to some missing race information.
13 | P a g e
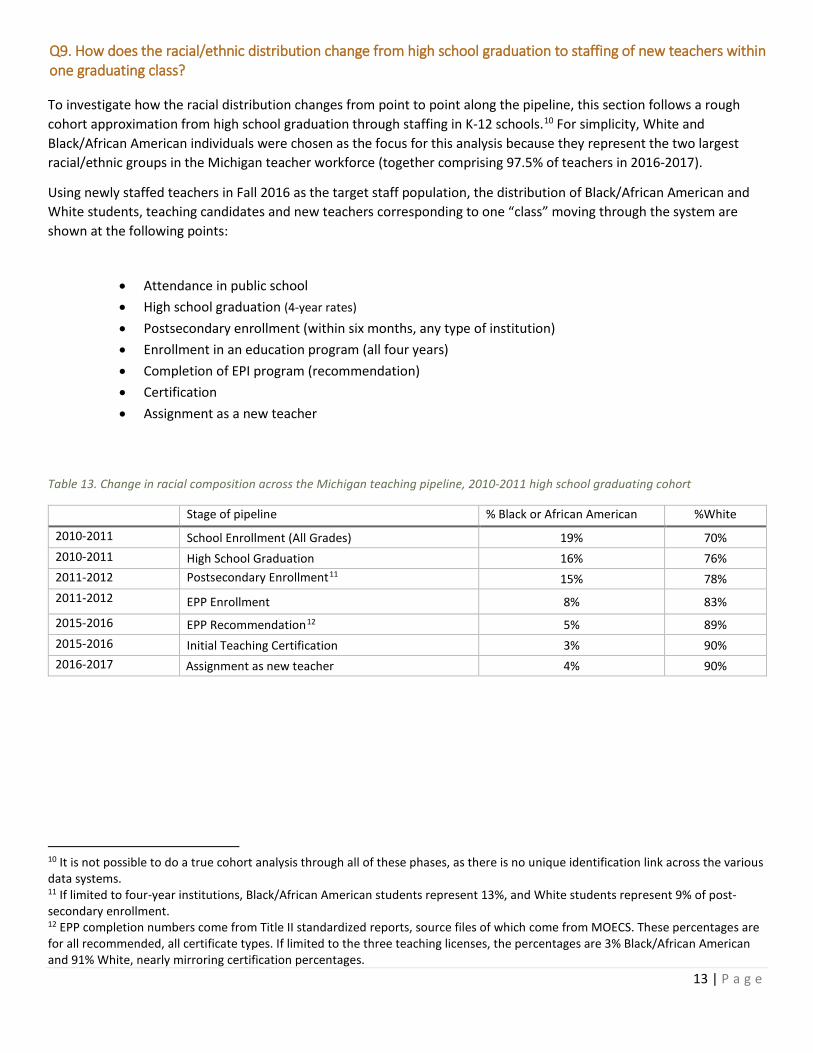
Q9. How does the racial/ethnic distribution change from high school graduation to staffing of new teachers within one graduating class?
To investigate how the racial distribution changes from point to point along the pipeline, this section follows a rough cohort approximation from high school graduation through staffing in K-12 schools.10 For simplicity, White and Black/African American individuals were chosen as the focus for this analysis because they represent the two largest racial/ethnic groups in the Michigan teacher workforce (together comprising 97.5% of teachers in 2016-2017).
Using newly staffed teachers in Fall 2016 as the target staff population, the distribution of Black/African American and White students, teaching candidates and new teachers corresponding to one “class” moving through the system are shown at the following points:
• Attendance in public school• High school graduation (4-year rates)
• Postsecondary enrollment (within six months, any type of institution)• Enrollment in an education program (all four years)• Completion of EPI program (recommendation)• Certification• Assignment as a new teacher
Table 13. Change in racial composition across the Michigan teaching pipeline, 2010-2011 high school graduating cohort
School Year Stage of pipeline % Black or African American %White
2010-2011 School Enrollment (All Grades) 19% 70% 2010-2011 High School Graduation 16% 76% 2011-2012 Postsecondary Enrollment11 15% 78% 2011-2012 EPP Enrollment 8% 83% 2015-2016 EPP Recommendation12 5% 89% 2015-2016 Initial Teaching Certification 3% 90% 2016-2017 Assignment as new teacher 4% 90%
10 It is not possible to do a true cohort analysis through all of these phases, as there is no unique identification link across the various data systems. 11 If limited to four-year institutions, Black/African American students represent 13%, and White students represent 9% of post-secondary enrollment. 12 EPP completion numbers come from Title II standardized reports, source files of which come from MOECS. These percentages are for all recommended, all certificate types. If limited to the three teaching licenses, the percentages are 3% Black/African American and 91% White, nearly mirroring certification percentages.
14 | P a g e
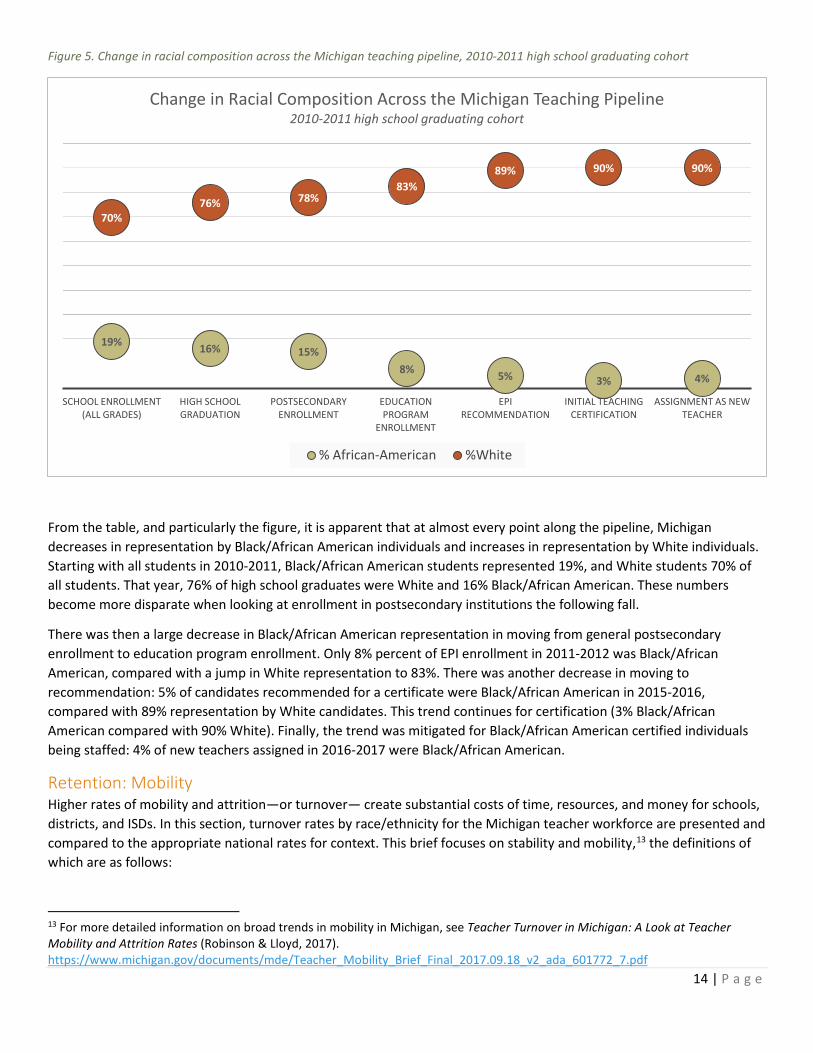
Figure 5. Change in racial composition across the Michigan teaching pipeline, 2010-2011 high school graduating cohort
From the table, and particularly the figure, it is apparent that at almost every point along the pipeline, Michigan decreases in representation by Black/African American individuals and increases in representation by White individuals. Starting with all students in 2010-2011, Black/African American students represented 19%, and White students 70% of all students. That year, 76% of high school graduates were White and 16% Black/African American. These numbers become more disparate when looking at enrollment in postsecondary institutions the following fall.
There was then a large decrease in Black/African American representation in moving from general postsecondary enrollment to education program enrollment. Only 8% percent of EPI enrollment in 2011-2012 was Black/African American, compared with a jump in White representation to 83%. There was another decrease in moving to recommendation: 5% of candidates recommended for a certificate were Black/African American in 2015-2016, compared with 89% representation by White candidates. This trend continues for certification (3% Black/African American compared with 90% White). Finally, the trend was mitigated for Black/African American certified individuals being staffed: 4% of new teachers assigned in 2016-2017 were Black/African American.
Retention: Mobility Higher rates of mobility and attrition—or turnover— create substantial costs of time, resources, and money for schools, districts, and ISDs. In this section, turnover rates by race/ethnicity for the Michigan teacher workforce are presented and compared to the appropriate national rates for context. This brief focuses on stability and mobility,13 the definitions of which are as follows:
13 For more detailed information on broad trends in mobility in Michigan, see Teacher Turnover in Michigan: A Look at Teacher Mobility and Attrition Rates (Robinson & Lloyd, 2017). https://www.michigan.gov/documents/mde/Teacher_Mobility_Brief_Final_2017.09.18_v2_ada_601772_7.pdf
19% 16% 15%8% 5% 3% 4%
70%76% 78%
83%89% 90% 90%
SCHOOL ENROLLMENT (ALL GRADES)
HIGH SCHOOL GRADUATION
POSTSECONDARY ENROLLMENT
EDUCATION PROGRAM
ENROLLMENT
EPI RECOMMENDATION
INITIAL TEACHING CERTIFICATION
ASSIGNMENT AS NEW TEACHER
Change in Racial Composition Across the Michigan Teaching Pipeline2010-2011 high school graduating cohort
% African-American %White
15 | P a g e
Teacher stability rate: The percentage of teachers teaching in the same school in the consecutive year.
Teacher mobility: The percentage of teachers teaching in one school in one year and a different school in the next.14 These teachers are referred to as “movers”.
Q10. How do Michigan teacher retention, mobility and attrition differ by race/ethnicity and how do they compare with national rates?
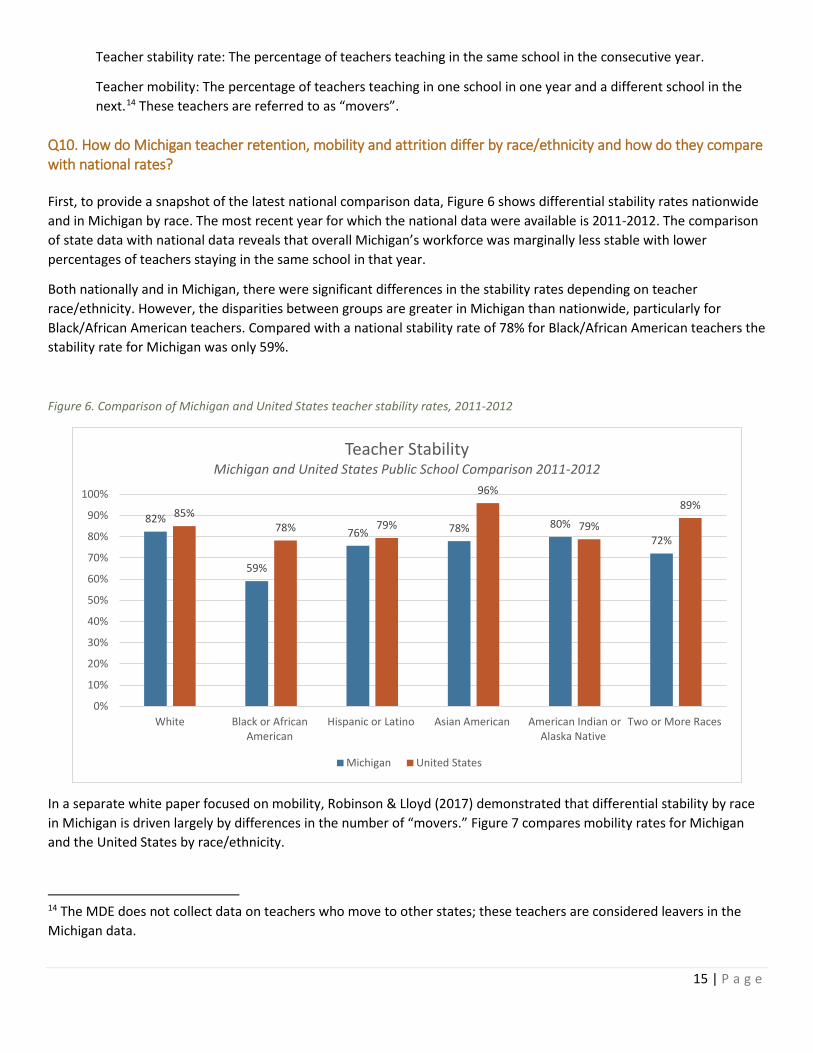
First, to provide a snapshot of the latest national comparison data, Figure 6 shows differential stability rates nationwide and in Michigan by race. The most recent year for which the national data were available is 2011-2012. The comparison of state data with national data reveals that overall Michigan’s workforce was marginally less stable with lower percentages of teachers staying in the same school in that year.
Both nationally and in Michigan, there were significant differences in the stability rates depending on teacher race/ethnicity. However, the disparities between groups are greater in Michigan than nationwide, particularly for Black/African American teachers. Compared with a national stability rate of 78% for Black/African American teachers the stability rate for Michigan was only 59%.
Figure 6. Comparison of Michigan and United States teacher stability rates, 2011-2012
In a separate white paper focused on mobility, Robinson & Lloyd (2017) demonstrated that differential stability by race in Michigan is driven largely by differences in the number of “movers.” Figure 7 compares mobility rates for Michigan and the United States by race/ethnicity.
14 The MDE does not collect data on teachers who move to other states; these teachers are considered leavers in the Michigan data.
82%
59%
76% 78% 80%72%
85%78% 79%
96%
79%
89%
0%
10%
20%
30%
40%
50%
60%
70%
80%
90%
100%
White Black or AfricanAmerican
Hispanic or Latino Asian American American Indian orAlaska Native
Two or More Races
Teacher StabilityMichigan and United States Public School Comparison 2011-2012
Michigan United States
16 | P a g e
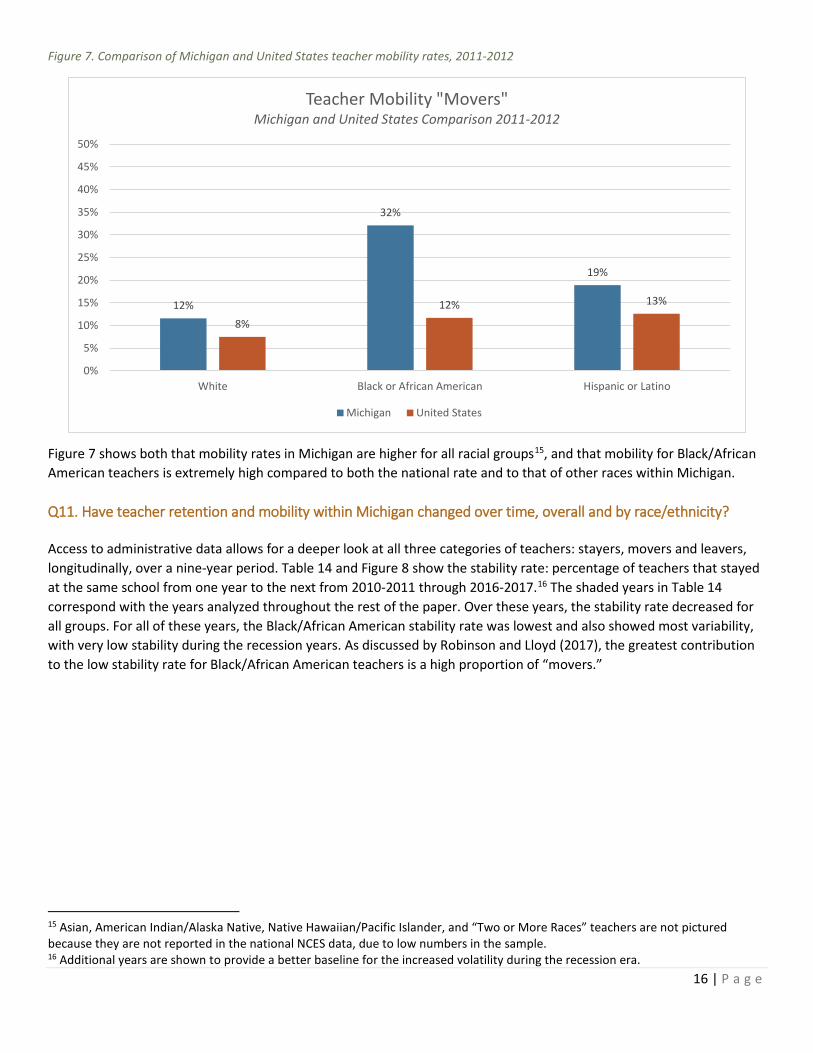
Figure 7. Comparison of Michigan and United States teacher mobility rates, 2011-2012
Figure 7 shows both that mobility rates in Michigan are higher for all racial groups15, and that mobility for Black/African American teachers is extremely high compared to both the national rate and to that of other races within Michigan.
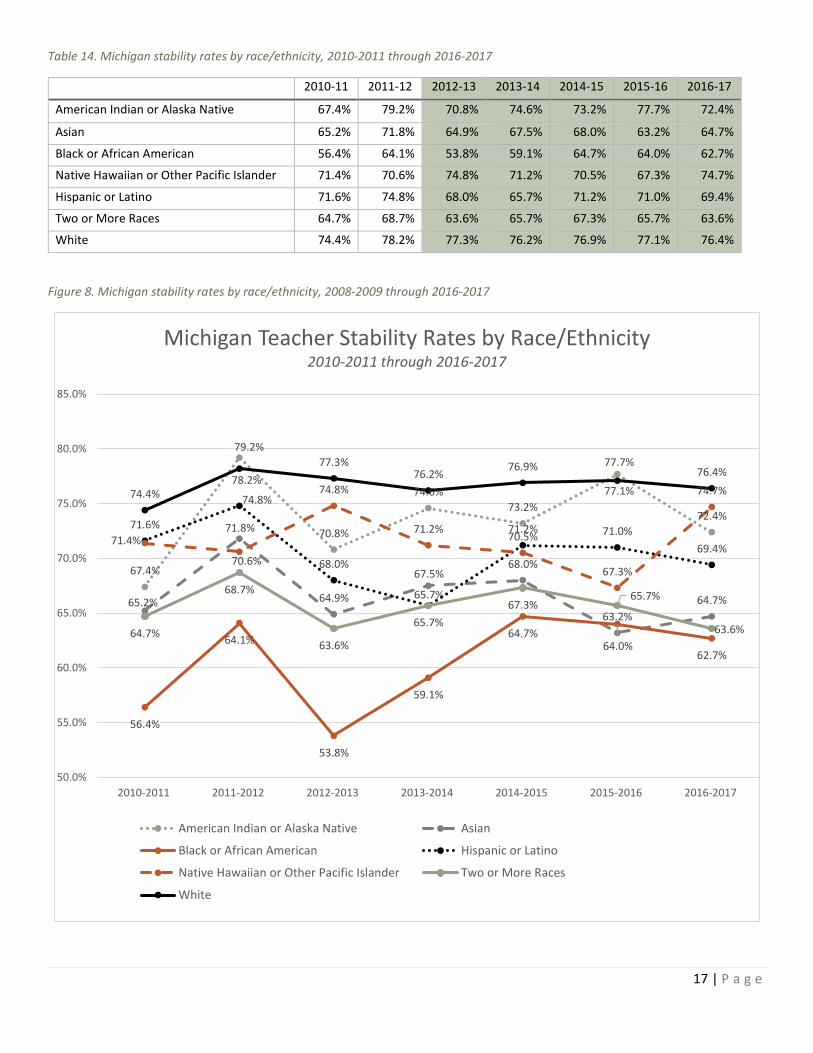
Q11. Have teacher retention and mobility within Michigan changed over time, overall and by race/ethnicity?
Access to administrative data allows for a deeper look at all three categories of teachers: stayers, movers and leavers, longitudinally, over a nine-year period. Table 14 and Figure 8 show the stability rate: percentage of teachers that stayed at the same school from one year to the next from 2010-2011 through 2016-2017.16 The shaded years in Table 14 correspond with the years analyzed throughout the rest of the paper. Over these years, the stability rate decreased for all groups. For all of these years, the Black/African American stability rate was lowest and also showed most variability, with very low stability during the recession years. As discussed by Robinson and Lloyd (2017), the greatest contribution to the low stability rate for Black/African American teachers is a high proportion of “movers.”
15 Asian, American Indian/Alaska Native, Native Hawaiian/Pacific Islander, and “Two or More Races” teachers are not pictured because they are not reported in the national NCES data, due to low numbers in the sample. 16 Additional years are shown to provide a better baseline for the increased volatility during the recession era.
12%
32%
19%
8%
12% 13%
0%
5%
10%
15%
20%
25%
30%
35%
40%
45%
50%
White Black or African American Hispanic or Latino
Teacher Mobility "Movers"Michigan and United States Comparison 2011-2012
Michigan United States
17 | P a g e
Table 14. Michigan stability rates by race/ethnicity, 2010-2011 through 2016-2017
2010-11 2011-12 2012-13 2013-14 2014-15 2015-16 2016-17
American Indian or Alaska Native 67.4% 79.2% 70.8% 74.6% 73.2% 77.7% 72.4%
Asian 65.2% 71.8% 64.9% 67.5% 68.0% 63.2% 64.7%
Black or African American 56.4% 64.1% 53.8% 59.1% 64.7% 64.0% 62.7%
Native Hawaiian or Other Pacific Islander 71.4% 70.6% 74.8% 71.2% 70.5% 67.3% 74.7%
Hispanic or Latino 71.6% 74.8% 68.0% 65.7% 71.2% 71.0% 69.4%
Two or More Races 64.7% 68.7% 63.6% 65.7% 67.3% 65.7% 63.6%
White 74.4% 78.2% 77.3% 76.2% 76.9% 77.1% 76.4%
Figure 8. Michigan stability rates by race/ethnicity, 2008-2009 through 2016-2017
67.4%
79.2%
70.8%
74.6%73.2%
77.7%
72.4%
65.2%
71.8%
64.9%
67.5%68.0%
63.2%64.7%
56.4%
64.1%
53.8%
59.1%
64.7%64.0%
62.7%
71.6%
74.8%
68.0%
65.7%
71.2% 71.0%69.4%
71.4%
70.6%
74.8%
71.2%70.5%
67.3%
74.7%
64.7%
68.7%
63.6%
65.7%67.3%
65.7%
63.6%
74.4%78.2%
77.3%76.2%
76.9%
77.1%
76.4%
50.0%
55.0%
60.0%
65.0%
70.0%
75.0%
80.0%
85.0%
2010-2011 2011-2012 2012-2013 2013-2014 2014-2015 2015-2016 2016-2017
Michigan Teacher Stability Rates by Race/Ethnicity2010-2011 through 2016-2017
American Indian or Alaska Native Asian
Black or African American Hispanic or Latino
Native Hawaiian or Other Pacific Islander Two or More Races
White
18 | P a g e
Summary of Findings • The State of Michigan teaching force in 2016 was 92% White compared with an 82% White adult general
population and a 69% White student population, a proportion that has held up for all the years highlighted inthis brief and increased in the final two years.
• In addition to the racial/ethnic disparities within the current workforce, the number of minority teachers andtheir overall representation within the workforce is decreasing:
o Compared with a 4% decrease in White teachers between 2012-2013 and 2016-2017, Michiganexperienced an 18% decrease in the number of Black/African American teachers.
o The representation of other minority groups has been extremely small, at 1% or less.o Despite increases in the percentage of minority students, the percentage of minority teachers has
declined over the years highlighted in the paper.• Compared with the United States, Michigan had a similar or smaller gap between the percentage of White
teachers and students, but a larger discrepancy between the percentage of Black/African American students andteachers in 2011-2012, the most recent year for which comparison data are available.
• In comparison to the overall Michigan population and civilian workforce, all minority populations areunderrepresented in the field of teaching and the White population overrepresented.
Looking at other points along the teacher pipeline:
• EPI enrollment in 2016-2017 was predominantly White (83%), followed by Black/African American (7%).• Compared to a 39% decline in initial certifications over the period of focus, the number of initial certificates
issued to teaching candidates of several minority groups decreased by more than 50%: American Indian/AlaskaNative (56%), Black/African American (60%) and Native Hawaiian/Other Pacific Islander (89%).
• Regarding the placement of new teachers, in 2016-2017 there were 198 total new Black/African Americanteachers (4% of total), compared with 3,981 White teachers (89%). In addition to a reduction of Black/AfricanAmerican representation within the pool, the within-race percentage decrease was dramatic Michigan had 11%fewer new teachers hired overall in 2016-2017 than in 2012-2013, but 37% fewer Black/African American newteachers over the same period.
• The across pipeline analysis showed that for the 2010-2011 graduation (high school) class, representationincreased for White and decreased for Black/African American potential teaching candidates at every stage frompublic school attendance to certification, but rebounded slightly at the staffing stage.
• Lastly, with regards to retention, the analysis of stability data show differential rates for racial/ethnic groups,with Black/African American teachers exhibiting much lower rates of stability and higher rates of mobility, bothcompared with other groups within Michigan and compared with national rates for Black/African Americanteachers. These trends have persisted over several years.
Policy Implications and Next Steps The disparate trends across race/ethnicity in Michigan workforce data are troubling. First, the very small percentage of non- Black/African American minority teachers merits focused research. Second, the multitude of negative indicators of teacher workforce health for Black/African American teaching candidates and teachers in Michigan signal a need for deeper consideration. From a typical educational policy lens, the effects of various factors on student outcomes are of paramount importance. A recent study (Gershenson et al, 2017) suggests that in addition to benefits in standardized test-taking (e.g. Dee, 2004) low-income Black/African American students who have even one Black/African American
19 | P a g e
teacher are 39% more likely to graduate from high school than those who do not. Similarly, research into low educational attainment for American Indian students indicates that many of them perceive their classroom experiences as unrelated to them culturally (Martinez, 2014). A 2012 ASHE report attributed American Indian attrition rates to the lack of representation of American Indians in curriculum and among teachers (McKinley, 2012), corroborating prior findings by the U.S. Department of Education identifying the top reasons American Indian students drop out of school: (1) uncaring teachers, (2) curriculum designed for mainstream America, and (3) tracking into low achieving classes and groups. American Indian students with a strong sense of cultural identity are found more likely to persist in school, and increasing representation among the teaching force is thought to be an important factor in increasing the cohesion between the community and the school (Martinez, 2014).
From the perspective of equity, any profession in which the racial distribution differs markedly from the general population should cause one to investigate the mechanisms driving the difference. This would allow policymakers to better understand whether differential conditions, policies, and practices are disadvantaging candidates and/or practitioners of color. In addition to the benefits for students and general equity issues, research has shown that workplace diversity in general improves work outcomes.
The analysis in this paper shows that Michigan has room for improvement in developing and retaining diversity within the teaching workforce. The most pervasive themes in the Michigan data are that our teaching workforce is disproportionately White and that most indicators are worst for Black/African American teachers. The decreasing numbers of minority candidates in the certification and new hires phases indicate a need to shore up the front end of the pipeline as the diminishing of the minority teacher pipeline from the beginning will ultimately result in less diversity across the entire pipeline, especially as older minority teachers ultimately retire from the system without being replaced by new minority teachers.
Conversations with administrators suggest that some Michigan districts are attempting to increase the diversity of their schools, but some perceive that the recruitment of those minority teachers is difficult due to the small labor pool. Some recommendations to address the training and recruitment portions of the pipeline (Bireda & Chait, 2011; Morrison & Lightner, 2017; the Education Commission of the States) are:
• Create statewide initiatives to fund teacher preparation programs aimed at low-income and minority teachers.
• Strengthen federal financial aid programs for low-income students entering the teaching field. • Reduce the cost of becoming a teacher by creating more avenues to enter the field and increasing the
number of qualified credentialing organizations. • Offer forums for minority teachers to reflect on their pathways into teaching to generate new ideas for
recruiting future colleagues. • Ensure that alternative certification programs are affordable to nontraditional candidates. • Begin recruitment efforts for minority teachers no later than high school; students who develop aspirations
to teach by high school are more likely to enter the teaching profession. • Conduct research on the effects of changing cut scores on workforce diversity and teacher effectiveness to
determine whether there is differential impact on minority teachers, and if so, whether the impact on effectiveness is worth the trade-off.
• Fortify pathways from paraprofessional to teacher.
APA Consulting (2014) compiled components of successful minority recruitment programs that can be posed as additional recommendations:
• Focus on building relationships with community partners and organizations and between districts and teacher preparation programs.
20 | P a g e
• Seek a nontraditional talent pool—consisting of first generation college-goers, teacher assistants, substitute teachers without certification, and career changers, recognizing that this may require course schedules and additional academic supports to fit the needs of working adults.
• Recognize the institutional barriers to first-generation college or university students. • Offer support for students that struggle with certification exams. • Provide modified course offerings with an emphasis on multicultural education, working with linguistically
diverse populations, special education, and science and mathematics. • Provide financial incentives such as scholarships, loan forgiveness, teaching assistantships, and stipends as
well as creative housing plans. • Adopt a value-added philosophy for teaching in which importance is given to the addition of a multicultural
background and diverse school experiences (i.e. value diversity in hiring).
Beyond recruitment, retention in Michigan schools also differs by race/ethnicity. Michigan mobility data bear out research that recruitment of minority teachers is often reversed by greater mobility (e.g. Ingersoll, Sutcher et al). Thus, in addition to minority teacher recruitment, it is imperative to address turnover. Ingersoll and May (2016) suggested that school organization, management and leadership are most related to retention. Notably, they did not find that the demographics of the school-poverty, minority student enrollment, or proportion of minority teachers -had a consistently stronger effect on retention for minority teachers.
Specific to the consistently disparate staffing trends for Black/African American teachers, the Education Trust (Griffin & Tackie, 2016), in a national qualitative survey, found that:
Black teachers represent a small fraction of the workforce nationwide, but it’s not because they can’t or don’t want to teach. They face racial discrimination and stereotyping that leave them feeling alienated and restricted from participating in the school community, impacting their ability to be effective and ultimately their desire to remain in the profession. Despite their feelings of alienation, they take on extra responsibilities and are often assigned additional duties because of their unique strengths, leaving them burdened and taxed. These same abilities and attributes can often leave Black teachers stuck in such rigid positions as the school disciplinarian. These unyielding categorizations often limit their opportunities, advancement, and abilities to hone their craft. The issues that stifle the development and empowerment of Black teachers are so deep-seated that it will take honest and critical examinations of school cultures and systemic processes in order for school and district leaders to develop the trust, support, and collegial working environments needed to recruit and retain teachers of color. These critiques are imperative, not only for diversifying the workforce, but for building an educator workforce more representative of its population and more capable of serving an increasingly diverse population of students. How can our education system perform at its best when so much potential remains suppressed? (p. 11)
The slightly higher placement rate of Black/African American teachers compared to their percentage of certified teachers suggests that Michigan district personnel may be attempting to increase diversity in their schools. It could also be indicative of other factors: higher needs for staffing in areas typically served by Black/African American teachers; higher persistence rate or intention to serve by certified Black/African American candidates compared to the population at large; or stronger pipelines linking Black/African American candidates from preparation programs to schools. These
21 | P a g e
mechanisms should be investigated through future research alongside information about the current experience of Black/African American teachers to help inform both recruitment and retention among this population of teachers.
There are many aspects of the work presented in this paper that call for continued research to better understand what drives the observed disproportionality in the teaching workforce. In addition to the policy recommendations described in this section, immediate next research steps should include:
• In-depth qualitative research into the experiences of minority teachers in Michigan, to allow for a greater infusion of teacher voice in policy-making. MDE and partner researchers should conduct surveys, interviews and/or focus groups to learn more about the perspectives of current Michigan racial/ethnic minority teachers, college students, and high school students regarding the teaching profession, desirability, barriers to entry, and long-term prospects. Specific questions might include: Why do they teach in the schools they are teaching, in the subject areas they are teaching? Why did they initially entered the field to begin with? What has been their experience of teacher preparation? What is their daily lived experience in schools? How do these factors interact with plans and desire to stay in the profession?
• Comparison of qualitative data results among racial/ethnic groups, as well as with national data, to identify commonalities and differences.
• Qualitative research with individuals who earn teaching certificates, both those who enter the teaching profession and those who do not, to identify factors that influenced their decisions.
• Disaggregation and differential analysis of already-collected staffing survey data to identify factors that might contribute to any differences by race.
• Studies to determine the extent to which school closures and reorganization, as well as differential placement in charter schools, may be contributing to differences in racial patterns in staffing metrics.
22 | P a g e
References APA Consulting. (2014). Keeping Up with the Kids: Increasing Minority Teacher Representation in Colorado (report
prepared for Colorado Department of Education). Retrieved from: http://apaconsulting.net/wp-content/uploads/2015/07/Keeping-Up-with-the-Kids_12-17.pdf December 2017
Bireda, S. and Chait, R. (2011) Increasing Teacher Diversity: Strategies to Improve the Teacher Workforce. Center for American Progress. Retrieved from http://www.americanprogress.org/wpͲcontent/uploads/issues/2011/11/pdf/chait_diversity.pdf
Dee, Thomas. (2004) “Teachers, Race, and Student Achievement in a Randomized Experiment.” The Review of
Economics and Statistics, 86 (2004) 195 -210. Egalite, Anna, Brian Kisida, and Marcus A. Winters. (2015) “Representation in the Classroom: The Effect of Own-race
Teachers on Student Achievement,” Economics of Education Review, 45, 44–5 Gershenson, S., Hart, C., Lindsay, C. and Papageorge, N. (2017) The Long-Run Impacts of Same-Race Teachers. Institute
of Labor Economics (working paper).
Griffin, A. and Tackie, H. (2016) “Through Our Eyes: Perspectives and Reflections From Black Teachers,” The Education Trust. Retrieved from https://1k9gl1yevnfp2lpq1dhrqe17-wpengine.netdna-ssl.com/wp-content/uploads/2014/09/ThroughOurEyes.pdf March 2018
Hightower, A., Delgado, R., Lloyd, S., Wittenstein, R., Sellers, K. and Swanson, C. (2011). Improving Student Learning by
Supporting Quality Teaching: Key Issues, Effective Strategies. Editorial Projects in Education Research Center. Hong, Lu, and Scott E. Page. “Groups of diverse problem solvers can outperform groups of high ability problem solvers.”
Paper edited by William J. Baumol, New York University (2014). Hunt, V., Layton, D., and Prince, S. (2015) “Why diversity matters” McKinsey Quarterly (January 2015). Retrieved from
https://www.mckinsey.com/business-functions/organization/our-insights/why-diversity-matters November 2017. Ingersoll, R. and May, H. (2016). Minority Teacher Recruitment, Employment, and Retention: 1987 to 2013 (research
brief). Palo Alto, CA: Learning Policy Institute. Martinez, D. (2014). School Culture and American Indian Educational Outcomes. Social and Behavioral Sciences, 116
(199 – 205). Retrieved from: https://www.researchgate.net/publication/260758836_School_Culture_and_American_Indian_Educational_Outcomes March 2018.
McKinley, B. ed. (2012). Special Issue: Postsecondary Education for American Indian and Alaska Natives: Higher
Education for Nation Building and Self-Determination. ASHE Higher Education Report, 37, 5, 1-154.
Robinson, J. and Lloyd, B. (2017). Teacher Turnover in Michigan: A Look at Teacher Mobility and Attrition Rates (research brief). Michigan Department of Education, Office of Educator Talent.
Stackhouse, S. (2017). Trends in Michigan Teacher Certification: Initial Certificates Issued 1996-2016 (research brief).
Michigan Department of Education. Sutcher, L., Darling-Hammond, L., and Carver-Thomas, D. (2016). A Coming Crisis in Teaching? Teacher Supply, Demand,
and Shortages in the U.S. Palo Alto, CA: Learning Policy Institute.
23 | P a g e
U.S. Department of Education, Office of Planning, Evaluation, and Policy Development, Policy and Program Studies Service. (2016). “The State of Racial Diversity in the Educator Workforce” Retrieved from: http://www2.ed.gov/rschstat/eval/highered/racial-diversity/state-racial-diversity-workforce.pdf February 2018
Villegas, Ana María, and Jacqueline Jordan Irvine. “Diversifying the Teaching Force: An Examination of Major
Arguments.” The Urban Review, 42 (2010) 175–192.