radar level measurement - wwoa.org conference...radar has advantages over other level measurement...
TRANSCRIPT
Radar Level Measurement
Greg Tischler Product Manager VEGA Americas
Goal and Roadmap
The goal of this presentation is for you to understand the basics of non-contact radar operation and why it is an appealing technology for making many different types of level measurements. History Types of Radar
Antennas Frequency
Application Advantages Summary

History of Radar (Radio Detecting and Ranging) Heinrich Hertz experiments reflecting radio waves off of metal
plates were first manifestation of Radar (1886) 1904 Christian Hülsmeyer patented the Telemobilescope that
projected and received Hertzian waves to detect or give warning of the presence of a metallic body such as a ship or train.

History
Mid 1930’s development continued independently around the world.
WWII saw the first widely used Radar that provided tangible
benefits.

Radar Today

Radar for Level Measurement
In the 1970’s radar was first used to measure level in large, ocean-going crude oil tankers.

Radar for Level Measurement
Today non contact radar is used for a wide array of measurements. – not just storage
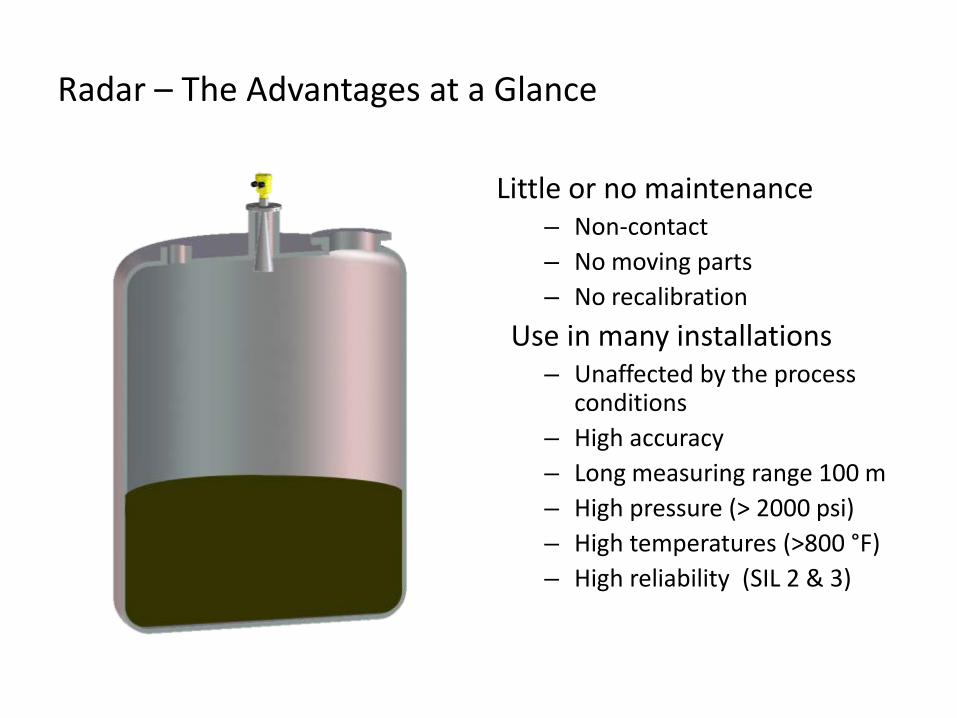
Radar – The Advantages at a Glance
Little or no maintenance – Non-contact – No moving parts – No recalibration
Use in many installations – Unaffected by the process
conditions – High accuracy – Long measuring range 100 m – High pressure (> 2000 psi) – High temperatures (>800 °F) – High reliability (SIL 2 & 3)
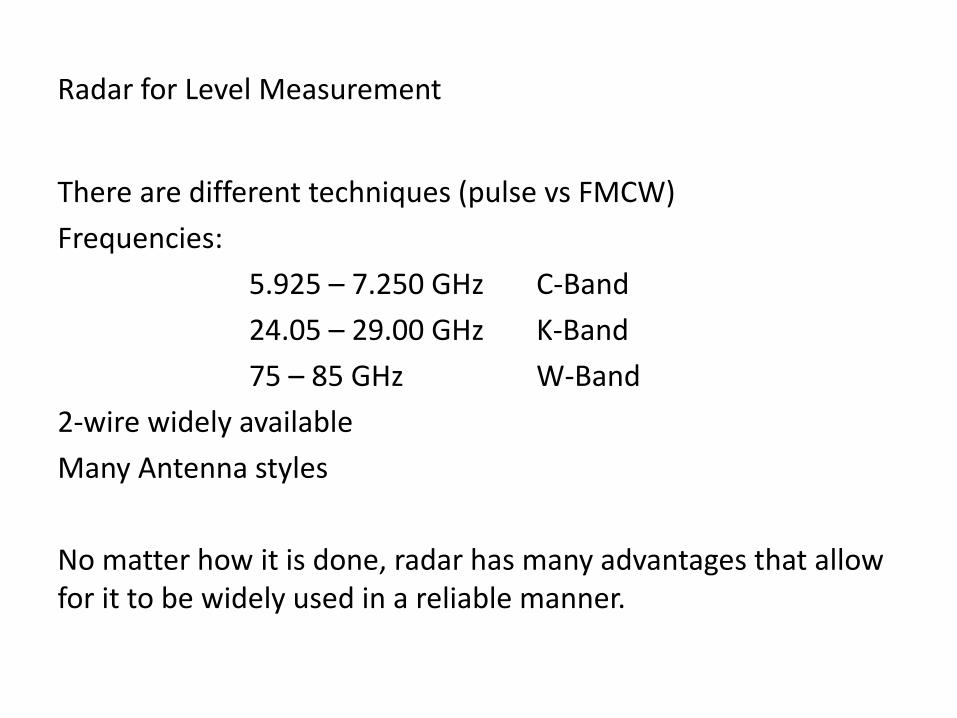
There are different techniques (pulse vs FMCW) Frequencies: 5.925 – 7.250 GHz C-Band 24.05 – 29.00 GHz K-Band 75 – 85 GHz W-Band 2-wire widely available Many Antenna styles No matter how it is done, radar has many advantages that allow for it to be widely used in a reliable manner.
Radar for Level Measurement
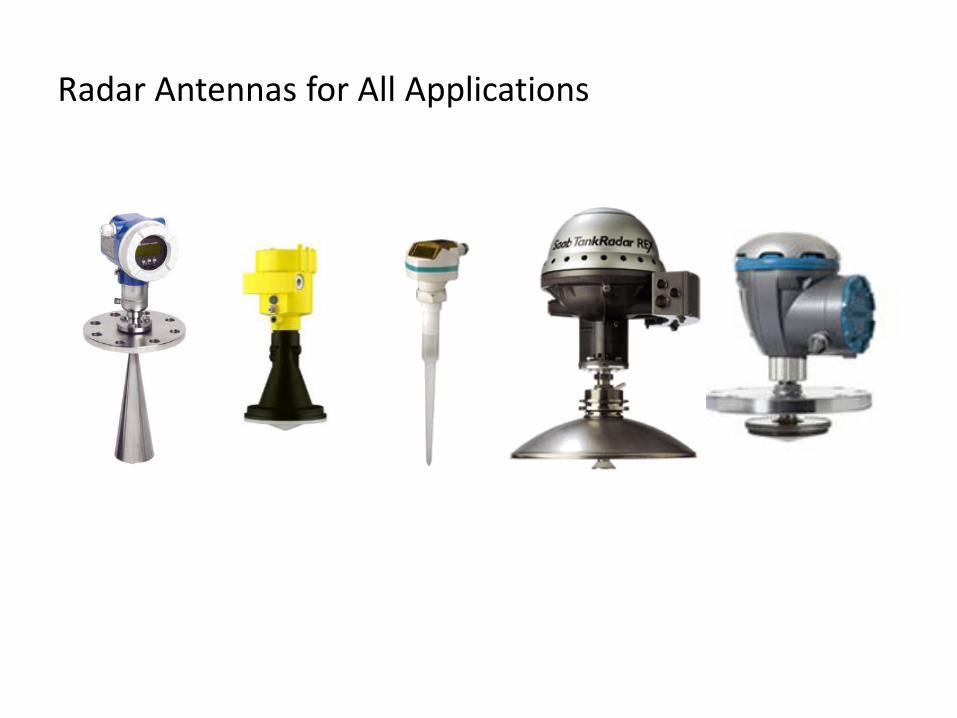
Radar Antennas for All Applications
Process Influences – Dielectric Constant Value/Conductivity
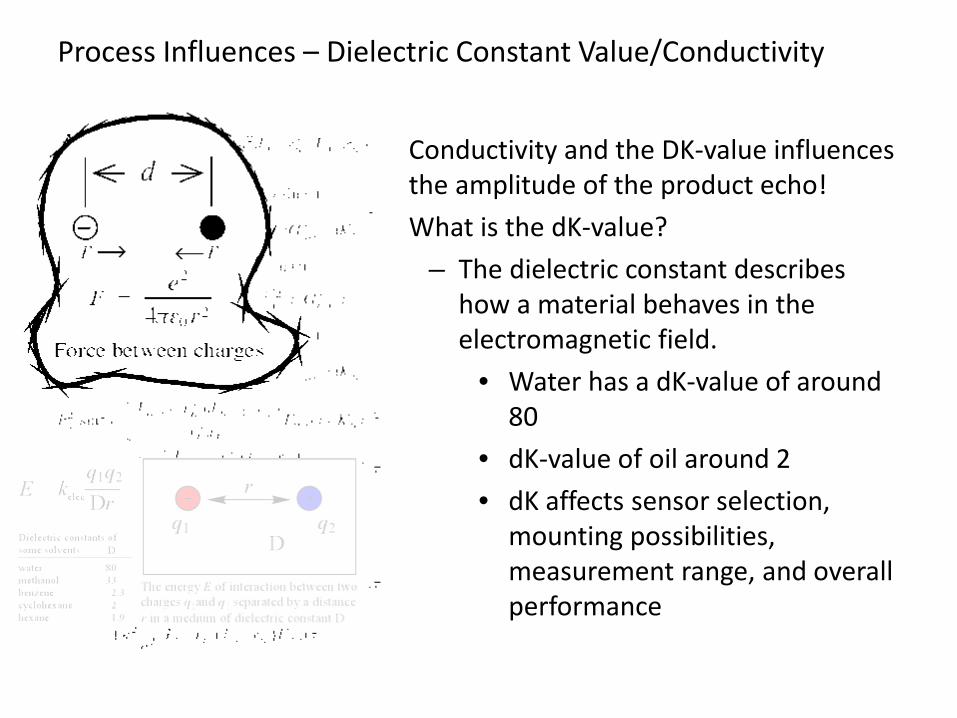
• Conductivity and the DK-value influences the amplitude of the product echo!
• What is the dK-value? – The dielectric constant describes
how a material behaves in the electromagnetic field.
• Water has a dK-value of around 80
• dK-value of oil around 2 • dK affects sensor selection,
mounting possibilities, measurement range, and overall performance
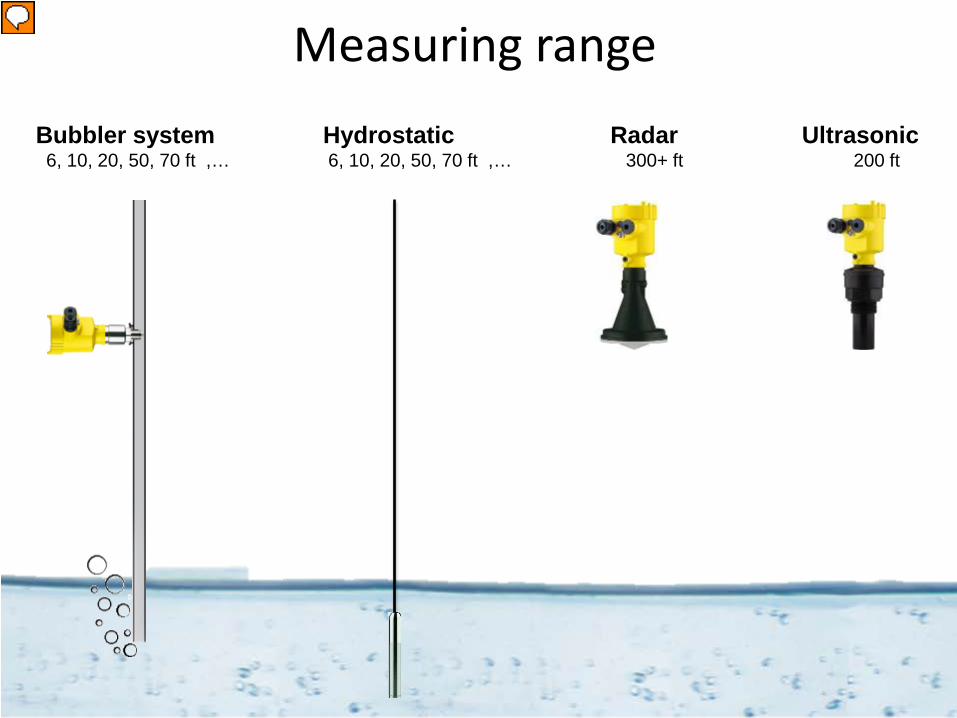
Measuring range Bubbler system Hydrostatic Radar Ultrasonic 6, 10, 20, 50, 70 ft ,… 6, 10, 20, 50, 70 ft ,… 300+ ft 200 ft

Sun and Temperature Influence Bubbler system Hydrostatic Radar Ultrasonic

VEGA hydroelectric power station

Comparison in practice
3810
3820
3830
3840
3850
3860
3870
3880
6:01
6:23
6:45
7:07
7:29
7:51
8:13
8:35
8:57
9:19
9:41
10:0
310
:25
10:4
711
:09
11:3
111
:53
12:1
512
:37
12:5
913
:21
13:4
314
:05
14:2
714
:49
15:1
115
:33
15:5
516
:17
16:3
917
:01
17:2
317
:45
18:0
718
:29
18:5
119
:13
19:3
519
:57
20:1
920
:41
21:0
321
:25
21:4
7
Dist
ance
Time
Ultrasonic Radar
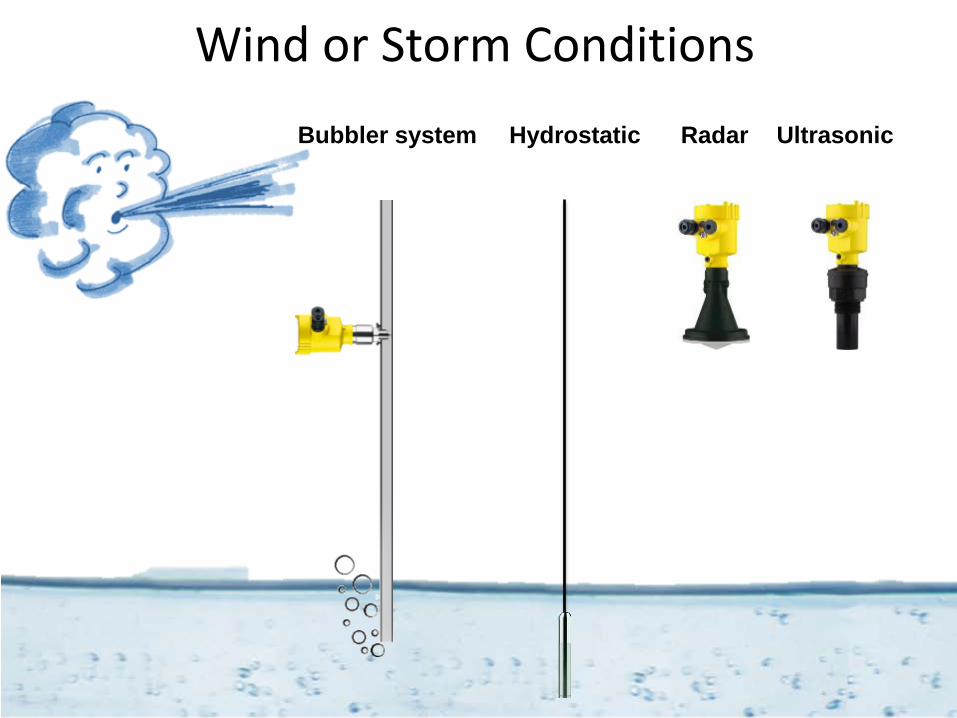
Wind or Storm Conditions Bubbler system Hydrostatic Radar Ultrasonic
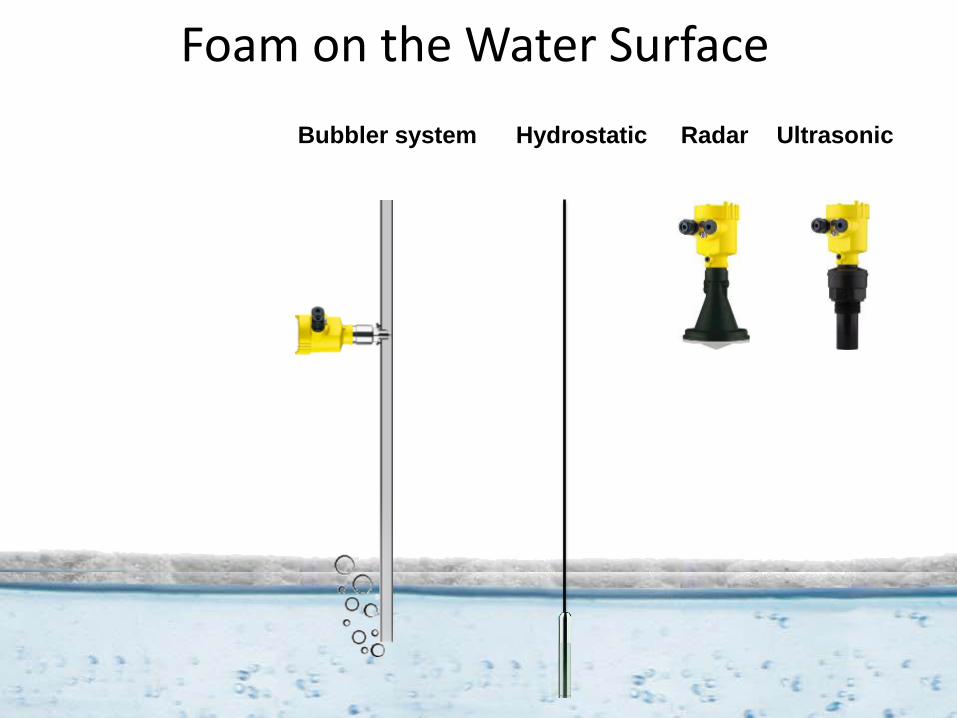
Foam on the Water Surface Bubbler system Hydrostatic Radar Ultrasonic
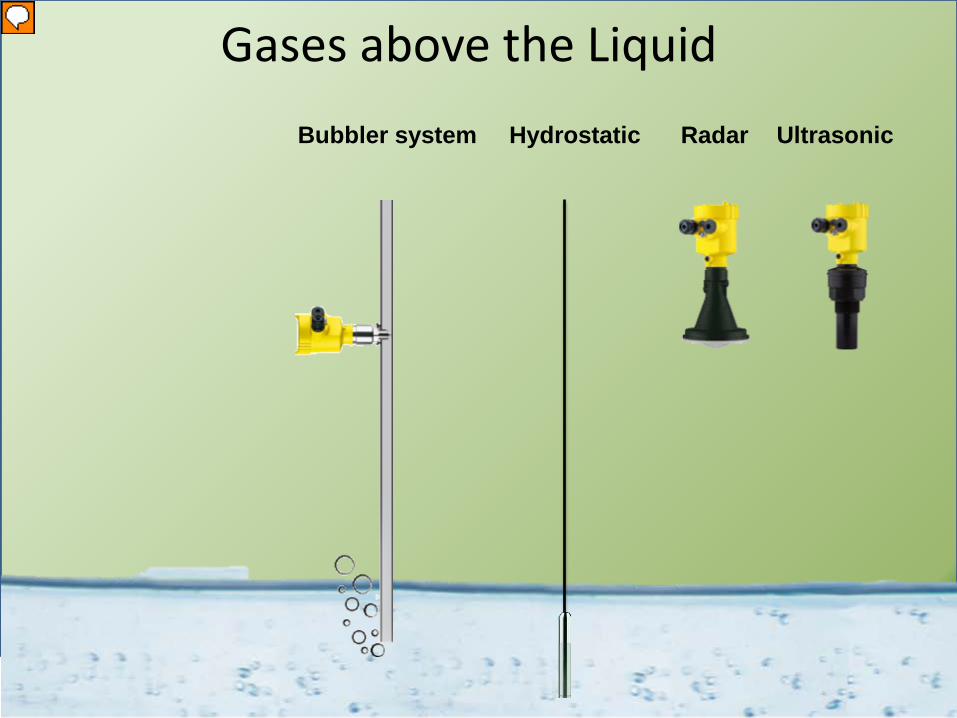
Gases above the Liquid Bubbler system Hydrostatic Radar Ultrasonic
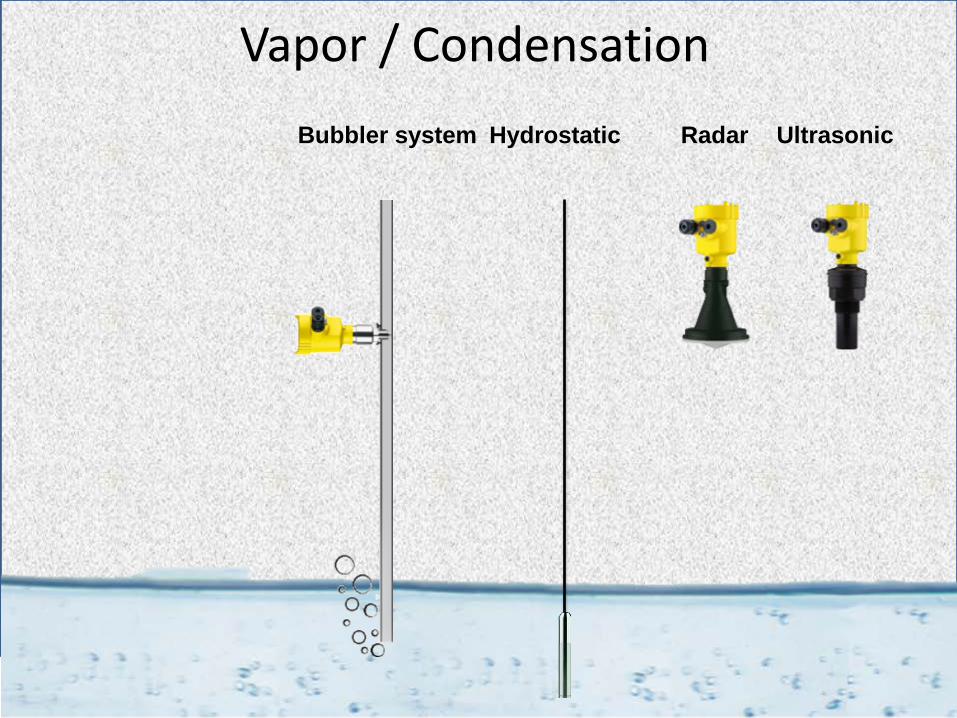
Vapor / Condensation Bubbler system Hydrostatic Radar Ultrasonic
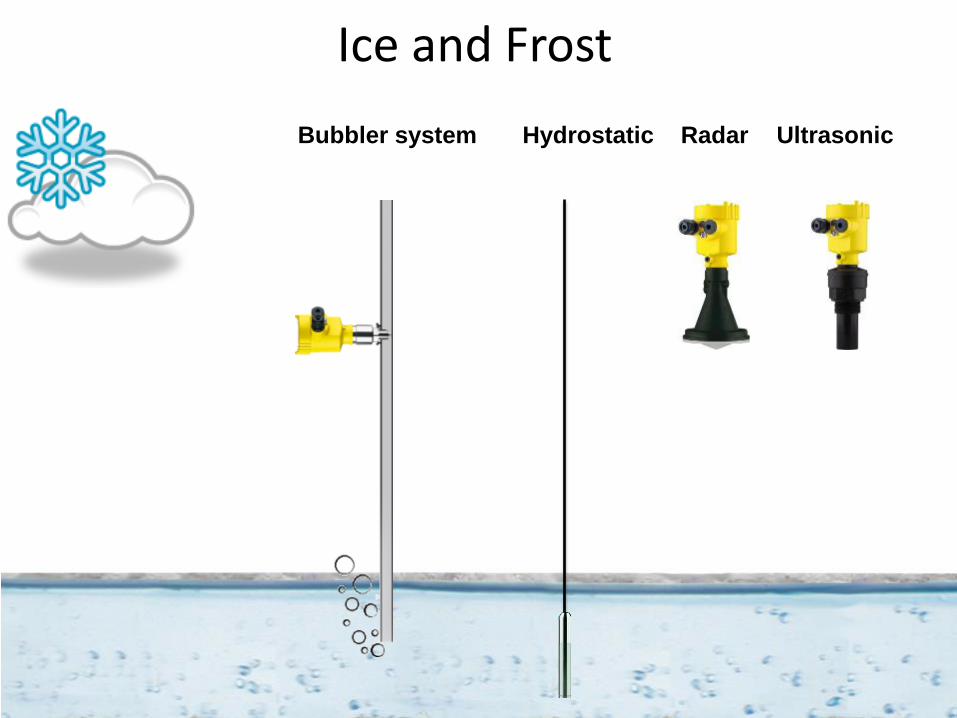
Ice and Frost Bubbler system Hydrostatic Radar Ultrasonic
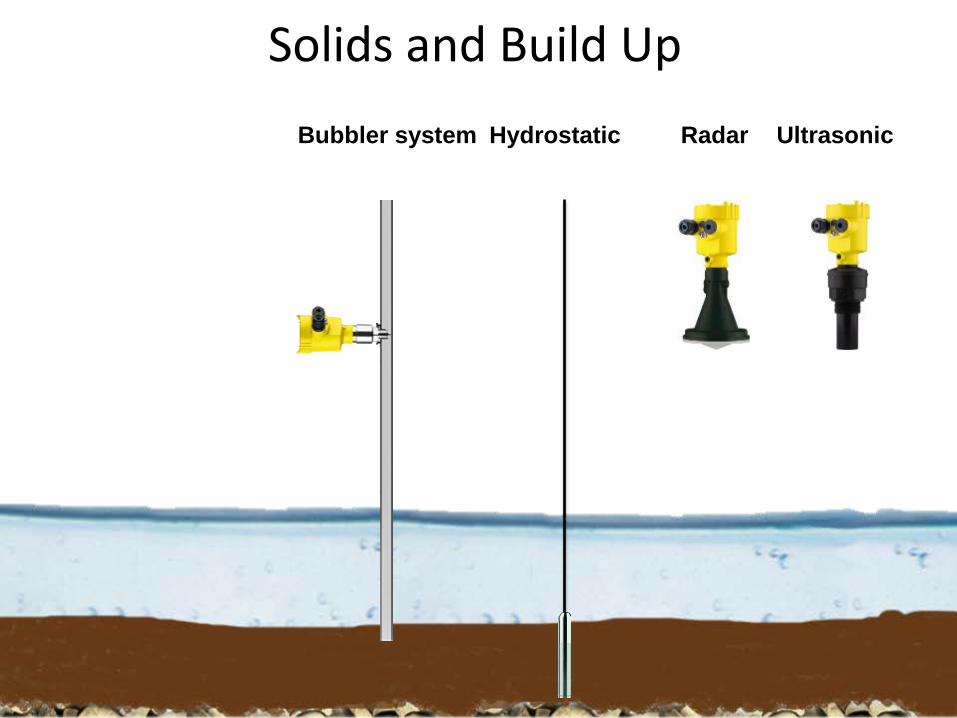
Solids and Build Up Bubbler system Hydrostatic Radar Ultrasonic

Biological effect of microwaves
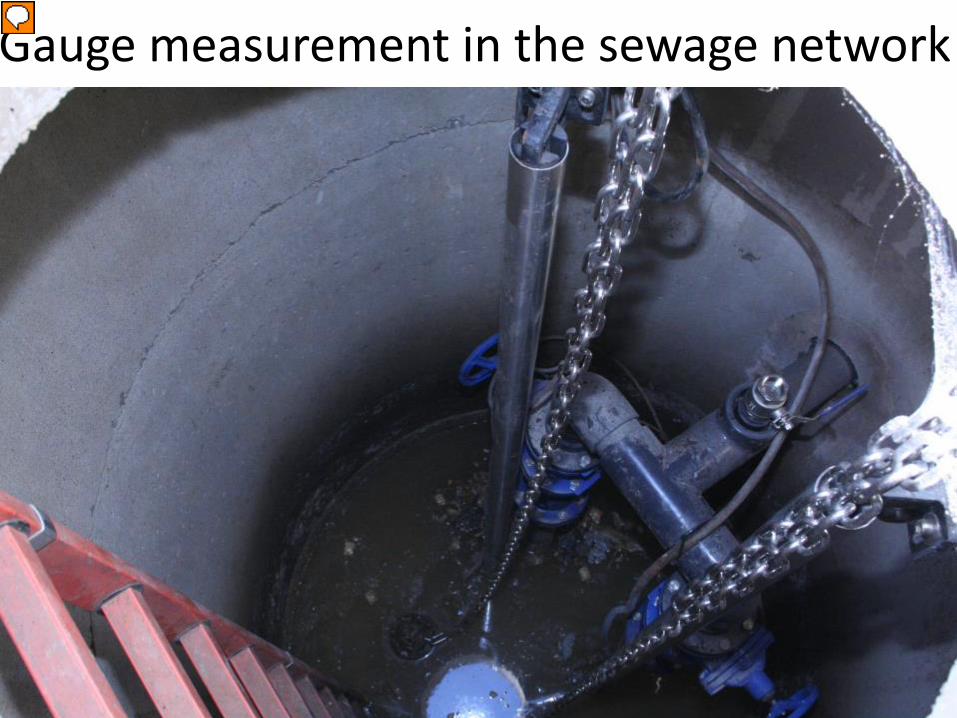
Gauge measurement in the sewage network
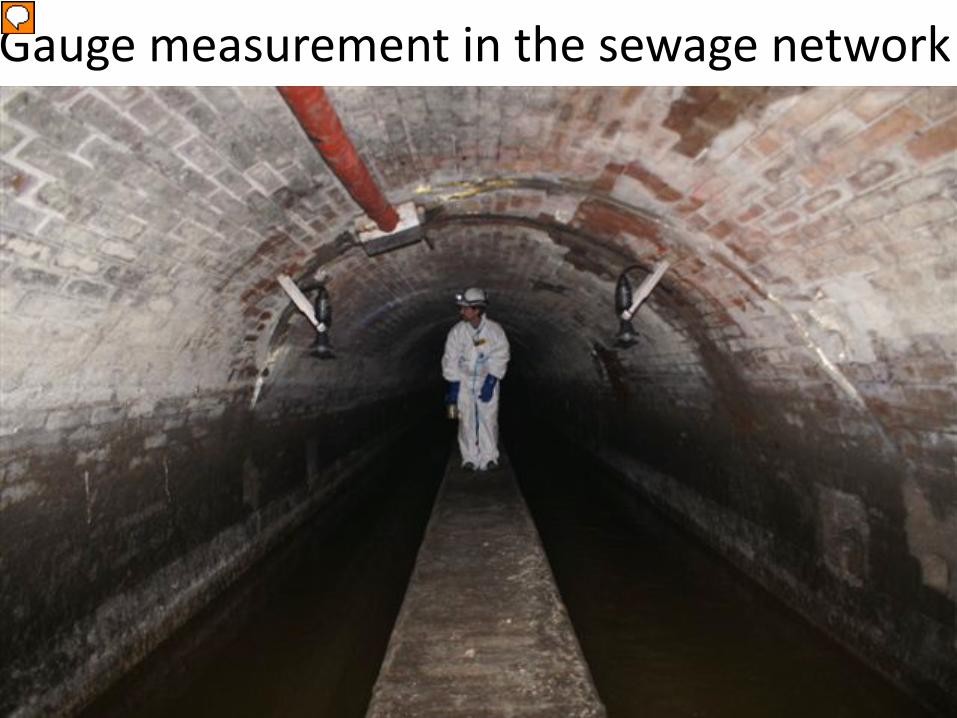
Gauge measurement in the sewage network

Pump control in a wastewater shaft
• A lot of obstructions in the lower pump shaft
• Very agitated surface • Different foam generation
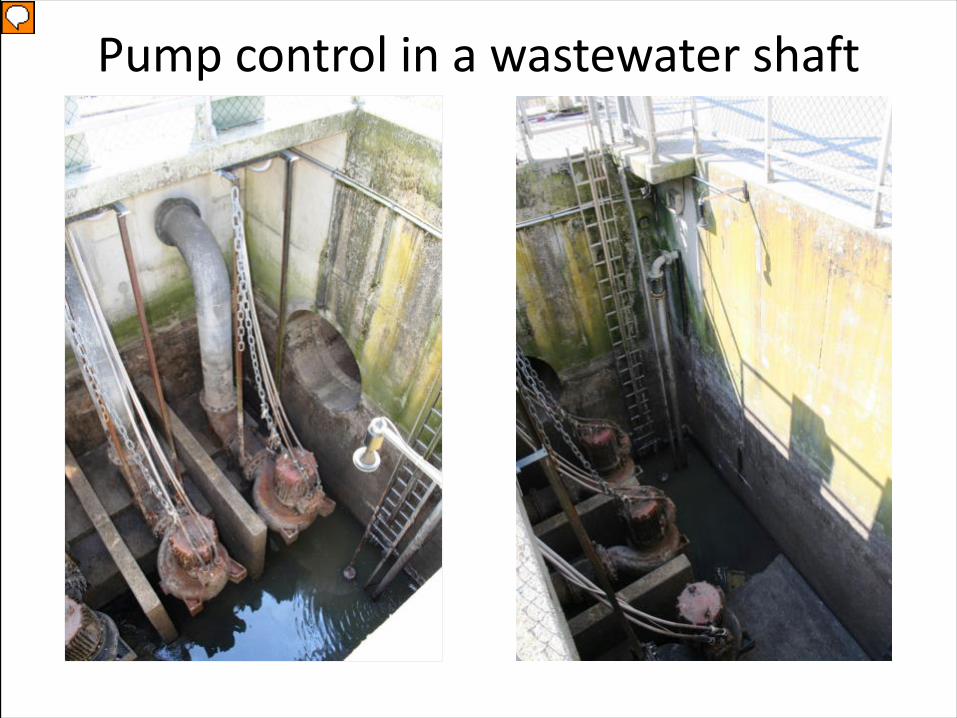
Pump control in a wastewater shaft
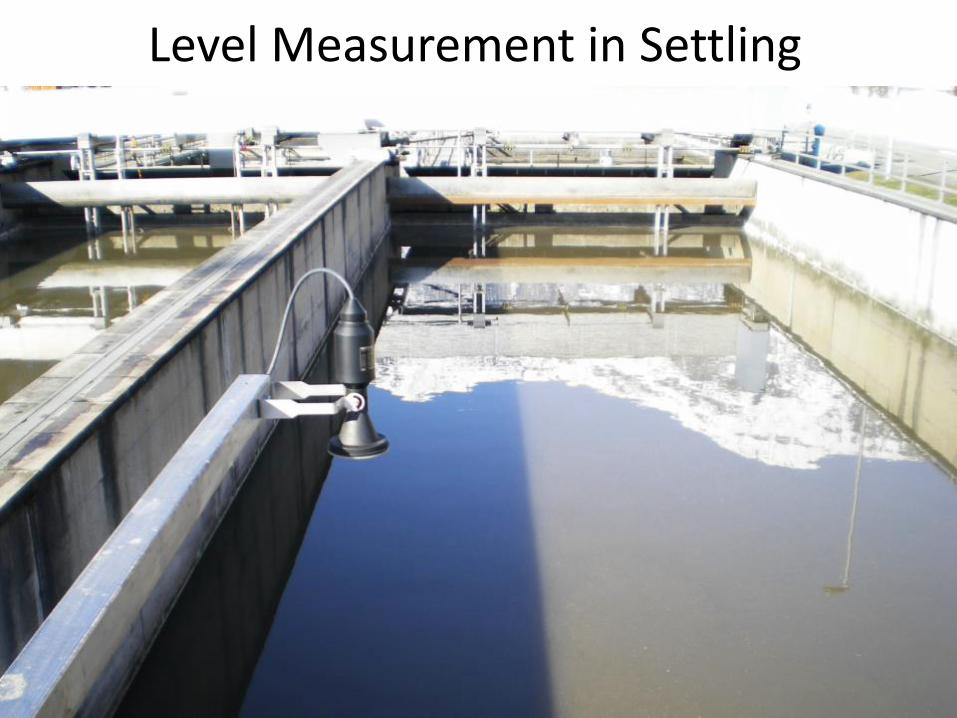
Level Measurement in Settling
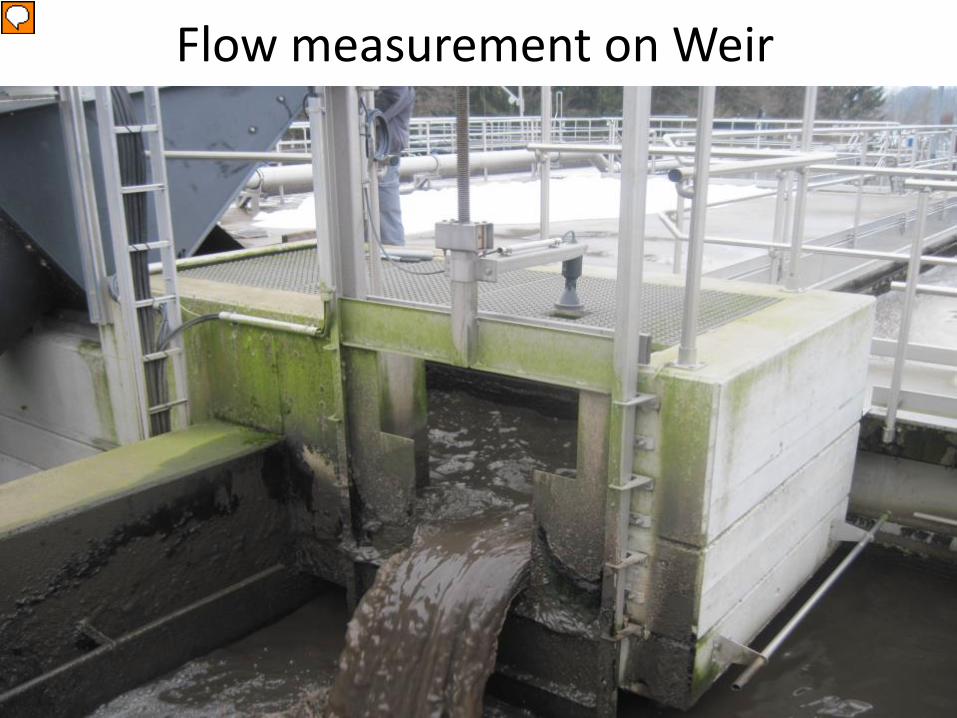
Flow measurement on Weir
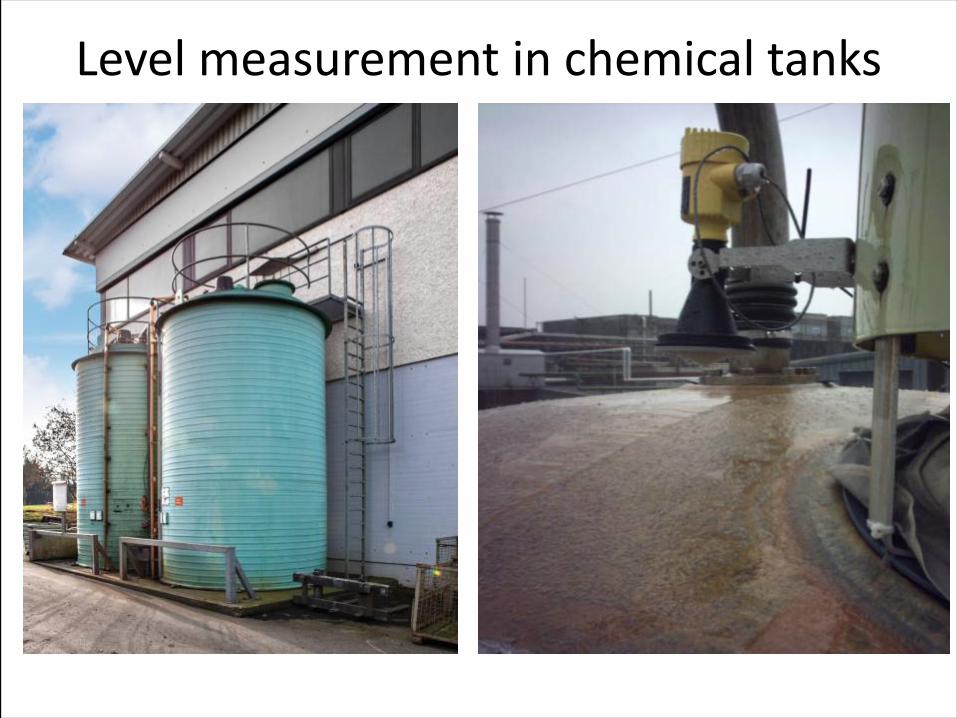
Level measurement in chemical tanks
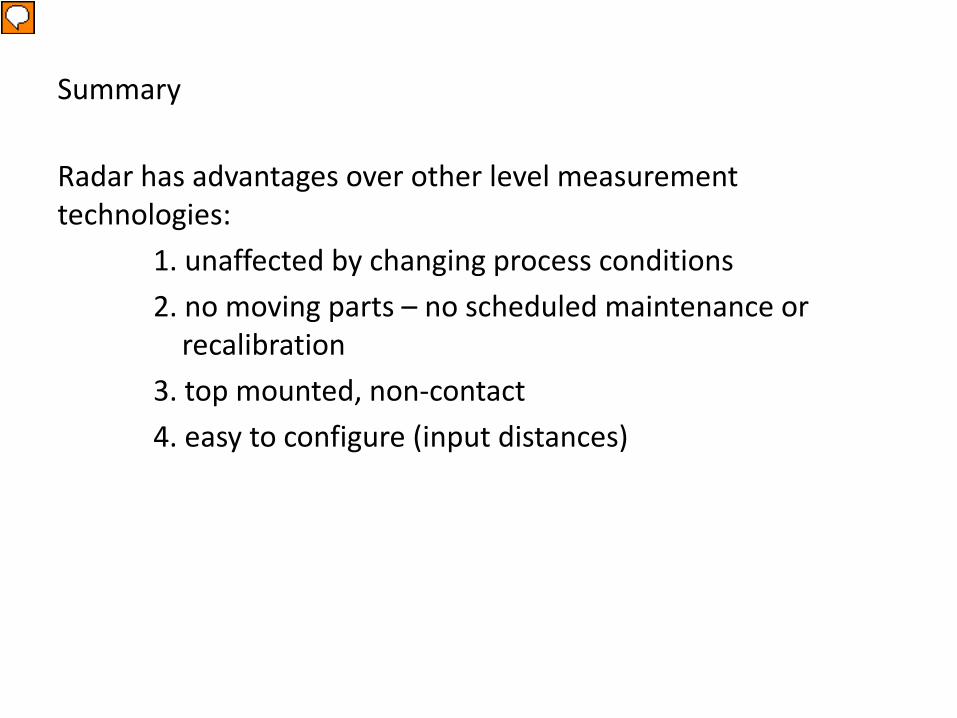
Radar has advantages over other level measurement technologies: 1. unaffected by changing process conditions 2. no moving parts – no scheduled maintenance or recalibration 3. top mounted, non-contact 4. easy to configure (input distances)
Summary