radar remote sensing - technical university of denmarkjmca/02501/lectures/02501_radar.pdf · radar...
TRANSCRIPT

1
Radar Remote SensingHenning Skriver
02501 Digital Image Analysis, Vision and Computer GraphicsFall 2008
Contents of Presentation
• SAR Techniques
• SAR
• Polarimetric SAR
• Interferometric SAR
• Image Processing Techniques
• Speckle reduction
• Classification
• Edge Detection
• Segmentation
• Change detection

2
Contents of Presentation
• SAR Techniques
• SAR
• Polarimetric SAR
• Interferometric SAR
• Image Processing Techniques
• Speckle reduction
• Classification
• Edge Detection
• Segmentation
• Change detection
Earth Observation - Principles

3
Absorption in the atmosphere

4
Side-Looking Airborne Radar
Antenna
Flight track
x (Along-track direction)!nr (Near-range incidence)
angle)
y (Across-track direction)
v (Antenna velocity)direction)
RS (Slant-range swath)
Pulse radar

5
SLAR - azimuth
Radar
Radar
Radar
Radar
EMISAR

6
ENVISAT
• Dimensions Launch configuration: length 10.5 m envelope diameter 4.6 m In-Orbit configuration: 26m x 10m x 5m• Mass Total satellite 8140 Kg Payload 2050 Kg• Power Solar array power: 6.5 kW (EOL) Average power demand: Sun Eclipse (watts) (watts) Payload 1700 1750 Satellite 3275 2870• Orbit 800 km as ERS, sun synchronous 10:00, i.e. 30 minutes before ERS-2

7
Surface scattering
Specular reflection Rough surface scattering

8

9
Flooding by radar
NOAA AVHRR

10
Contents of Presentation
• SAR Techniques
• SAR
• Polarimetric SAR
• Interferometric SAR
• Image Processing Techniques
• Speckle reduction
• Classification
• Edge Detection
• Segmentation
• Change detection

11
Polarimetric SAR
Scattering matrix
Svv
Svh
Shv
Shh
!
" #
$
% &
Polarimetric SAR

12

13
EMISAR C- and L-band Multitemporal
HH HV VVC-band
L-band
March May July
Contents of Presentation
• SAR Techniques
• SAR
• Polarimetric SAR
• Interferometric SAR
• Image Processing Techniques
• Speckle reduction
• Classification
• Edge Detection
• Segmentation
• Change detection

14
Interferometric SAR
H
1
2 Elevation
mapping
R
R + !R
EMISAR

15
Interferometric SAR
H
1
2 Elevation
mapping
R
R + !R
H
1/2 Displacement/
velocity
R
!R
"12

16
Terrain Motionin L.A., USA:1992 - today

17
Contents of Presentation
• SAR Techniques
• SAR
• Polarimetric SAR
• Interferometric SAR
• Image Processing Techniques
• Speckle reduction
• Classification
• Edge Detection
• Segmentation
• Change detection
Speckle
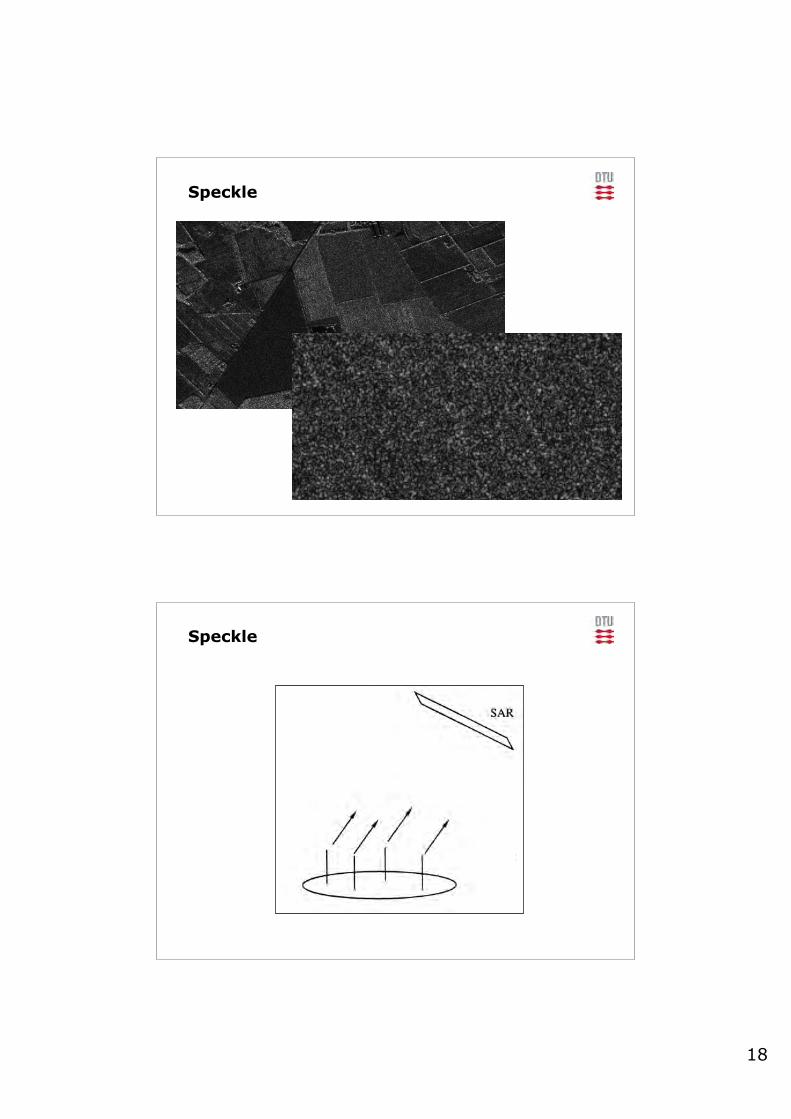
18
Speckle
Speckle

19
Speckle
Speckle

20
Speckle Reduction
Speckle Reduction

21
Contents of Presentation
• SAR Techniques
• SAR
• Polarimetric SAR
• Interferometric SAR
• Image Processing Techniques
• Speckle reduction
• Classification
• Edge Detection
• Segmentation
• Change detection
Polarimetric SAR
Scattering matrix
Svv
Svh
Shv
Shh
!
" #
$
% &

22
EMISAR C- and L-band Multitemporal
HH HV VVC-band
L-band
March May July
EMISAR L-band Multitemporal
Correlation coefficient
Phase difference
March May July
01
-180180

23
Polarimetric SAR - pdf’s
Scattering matrix
!
S =S
hhS
hv
Svh
Svv
"
# $ $
%
& ' '
!
Z = Shh
Shv
Svv[ ]
T
Covariance matrix
!
X = ZZT*
=
Shh
Shh
*S
hhS
hv
*S
hhS
vv
*
Shv
Shh
*S
hvS
hv
*S
hvS
vv
*
Svv
Shh
*S
vvS
hv
*S
vvS
vv
*
"
#
$ $ $ $ $
%
&
' ' ' ' '
Complex Gaussian
!
Z " NC(0,#)
!
u(z) =1
" p #exp $tr (#
$1zz
*T){ }
Complex Wishart Gamma
!
X " WC(p,N,#)
!
w(x) =1
"p (N)#N
xN$p
exp $tr (#$1x){ }
!
I " G(N,#)
!
v(I) =1
"(N)#NI
N$1exp $
I
#
% & ' (
) * + (
Complex Wishart classification
Multidimensional ML classification
!
˜ u = u1
u2
L un[ ]
!
p u( ) =1
2"nC
12
exp(# 12( ˜ u # ˜ u )C
#1(u# u ))
!
d1(u,classm ) = 12( ˜ u " ˜ u )C
"1(u" u )
+ 12ln C " ln P(classm )[ ]
Complex Wishart classification
!
x = zzT*
=
ShhShh
*ShhShv
*ShhSvv
*
ShvShh
*ShvShv
*ShvSvv
*
SvvShh
*SvvShv
*SvvSvv
*
"
#
$ $ $
%
&
' ' '
!
w(x) =1
"p (N)#NxN$pexp $tr(#
$1x){ }
!
d3(x,classm ) = n Tr("#1x)
+n ln " # ln P(classm )[ ]

24
Land cover from radar
Contents of Presentation
• SAR Techniques
• SAR
• Polarimetric SAR
• Interferometric SAR
• Image Processing Techniques
• Speckle reduction
• Classification
• Edge Detection
• Segmentation
• Change detection

25
Edge Detection Scheme
What is edge detection?
Statistical test of the hypothesis:
Mean[RED area] = Mean[BLUE area]?
If hypothesis is rejected: We have an edge!
SW-NE W-E
Edge Detection Scheme
X11
X12
X13
X21
X22
X23
X31
X32
X33
Test for edge using test statistic f:
N-S edge: EN-S = f(X11+X21+X31, X13+X23+X33)NW-SE edge: ENW-SE = f(X12+X13+X23, X13+X23+X33)W-E edge: EW-E = f(X11+X12+X13, X31+X32+X33)SW-NE edge: ESW-NE = f(X21+X11+X12, X32+X33+X23)
Edge enhancement and direction:
Is the hypothesis of equal means rejected by 1 of E’s
Examples
SW-NE W-E

26
Edge Detection - Gaussian
X11
X12
X13
X21
X22
X23
X31
X32
X33
Test statistic when pixels are Gaussian distributed:
Xi ∈ N(µi,σi)
!
f (X,Y)" Xi # Yi$$
Sum[RED area] - Sum[BLUE area]
Polarimetric SAR - pdf’s
Scattering matrix
!
S =S
hhS
hv
Svh
Svv
"
# $ $
%
& ' '
!
Z = Shh
Shv
Svv[ ]
T
Covariance matrix
!
X = ZZT*
=
Shh
Shh
*S
hhS
hv
*S
hhS
vv
*
Shv
Shh
*S
hvS
hv
*S
hvS
vv
*
Svv
Shh
*S
vvS
hv
*S
vvS
vv
*
"
#
$ $ $ $ $
%
&
' ' ' ' '
Gamma
!
I " G(N,#)
!
v(I) =1
"(N)#NI
N$1exp $
I
#
% & ' (
) * + (

27
Edge Detection - Gamma
X11
X12
X13
X21
X22
X23
X31
X32
X33
Test statistic when pixels are Gamma distributed:
Xi ∈ G(N,βi)
!
f (X,Y)"Xi#
Yi#
!
Sum[RED area]
Sum[BLUE area]
Polarimetric SAR - pdf’s
Scattering matrix
!
S =S
hhS
hv
Svh
Svv
"
# $ $
%
& ' '
!
Z = Shh
Shv
Svv[ ]
T
Covariance matrix
!
X = ZZT*
=
Shh
Shh
*S
hhS
hv
*S
hhS
vv
*
Shv
Shh
*S
hvS
hv
*S
hvS
vv
*
Svv
Shh
*S
vvS
hv
*S
vvS
vv
*
"
#
$ $ $ $ $
%
&
' ' ' ' '
Complex Wishart Gamma
!
X " WC(p,N,#)
!
w(x) =1
"p (N)#N
xN$p
exp $tr (#$1x){ }
!
I " G(N,#)
!
v(I) =1
"(N)#NI
N$1exp $
I
#
% & ' (
) * + (

28
Wishart Edge Detector
X11 X12 X13
X21 X22 X23
X31 X32 X33
Test statistic for complex Wishart pdf
Xi ∈ WC(p,N,Σi)
!
f (X, Y)"Xi#
$ N
Yi#$ M
Xi# + Yi#$ N + $ M
!
Sum[RED area]N
Sum[BLUE area]M
Sum[RED area]+Sum[BLUE area]N+M
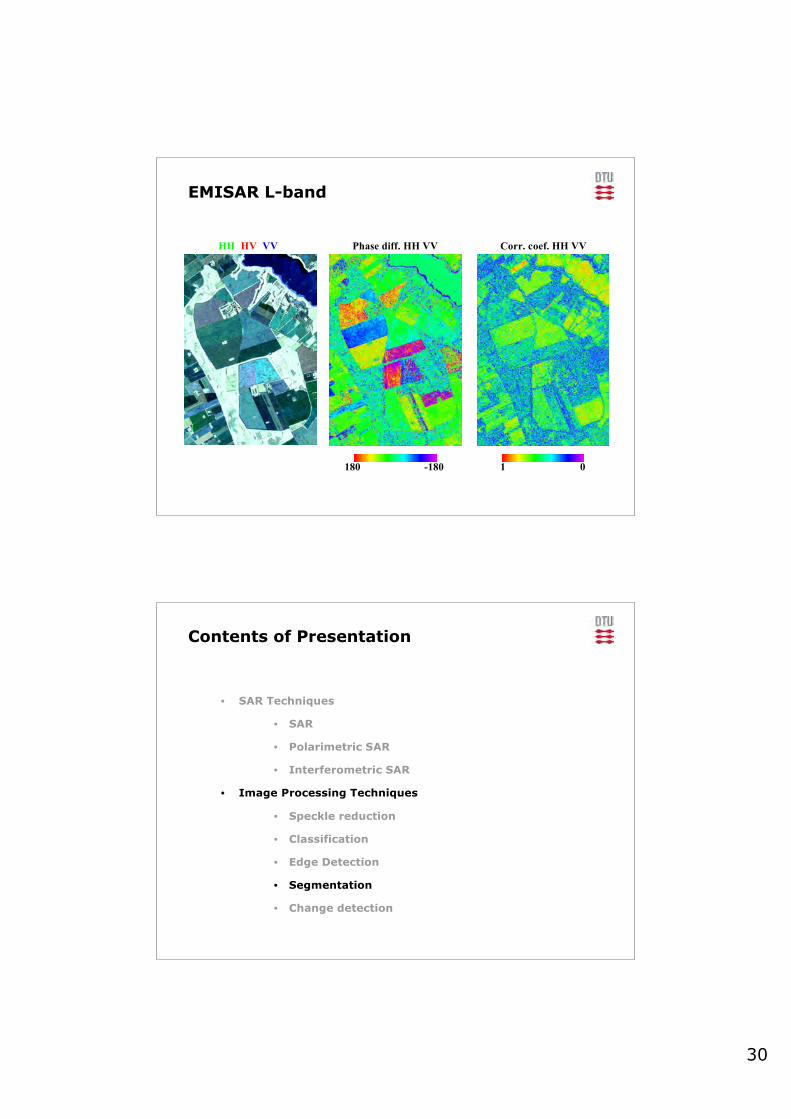
EMISAR L-band
HH HV VV Phase diff. HH VV Corr. coef. HH VV
-180180 01

29
Wishart Edge Detector - L-band diagonal
L-band L-band diagonal
Wishart Edge Det. - L-band az. sym.
L-band L-band azimuthal symmetric
30
EMISAR L-band
HH HV VV Phase diff. HH VV Corr. coef. HH VV
-180180 01
Contents of Presentation
• SAR Techniques
• SAR
• Polarimetric SAR
• Interferometric SAR
• Image Processing Techniques
• Speckle reduction
• Classification
• Edge Detection
• Segmentation
• Change detection

31
Segmentation
Merge Red and Blue regions if hypothesisof equal means is accepted
Segments for Polarimetric SAR

32
Azimuthal Symmetric - Diagonal
Contents of Presentation
• SAR Techniques
• SAR
• Polarimetric SAR
• Interferometric SAR
• Image Processing Techniques
• Speckle reduction
• Classification
• Edge Detection
• Segmentation
• Change detection

33
Change Detection
Change has occurred between acq. 1 andacq. 2, if hypothesis of equal means forred and blue areas is rejected
Acquisition 1 Acquisition 2
June 98, XP, L-band June 99, XP, L-band

34
June 98, XP, L-band Difference detector
June 98, XP, L-band Ratio detector

35
June 98, L-band June 99, L-band
June 98, XP, L-band Ratio detector

36
Wishart detectorJune 98, L-band
Segmentation af 2 images separately
Acquisition 1 Acquisition 2
Cov. matrix X1 Cov. matrix X2

37
Segmentation af 2 images jointly
Acquisition 1 Acquisition 2
!
X =X
10
0 X2
"
# $
%
& ' Covariance matrix for 2 images:
June 98, L-band June 99, L-band

38
June 98, L-band June 98 + 99, L-band
Pixel-based test statistics Segment-based test statistics

39
Pixel-based test statistics Segment-based test statistics
Freeman and Durden decomposition

40
Only double-bounce scattering
Only double-bounce scattering

41

42

43
DTU - courses
30350 Remote Sensing
30340 Radar and Radiometer Systems