radford university’s 2016 greenhouse gas … university’s 2016 greenhouse gas inventory july 1,...
TRANSCRIPT
Radford University’s 2016 Greenhouse Gas Inventory
July 1, 2015 – June 30, 2016
Summary
Radford University conducts an annual inventory of its greenhouse gas emissions. The process
collects data about emissions sources related to university operations and calculates the
association between these operations and greenhouse gas emissions. The inventory described
here encompasses Fiscal Year 2016 (July 1, 2015 through June 30, 2016). During this time,
Radford University’s estimated net greenhouse gas emissions totaled 38,160 metric tons of
carbon dioxide equivalent (MTCO2e).
This report summarizes the 2016 Greenhouse Gas Inventory (GGI), provides important
information pertaining to certain measured criteria, and benchmarks Radford University’s 2016
performance against university inventories conducted since 2010 (the baseline year for RU’s
greenhouse gas inventory).
Introduction
In 2009, Radford University became a signatory of the American College & University
President’s Climate Commitment (ACUPCC). As such, the University pledges to pursue carbon
neutrality and to provide students with the knowledge and skills they need to be successful in
meeting the challenges of the 21st Century. (See Appendix B). The ACUPCC requires that
signatories conduct a GGI during the first year of participation to establish a baseline emissions
calculation; the participant then submits a GGI annually, as it enables the university to analyze
emissions sources, track progress towards target goals, and ultimately reduce the campus’s
contribution to climate change. Radford University has conducted a GGI each year since 2010,
with the exception of 2015.
Methods
For the initial GGI in 2010, Radford University selected the Clean Air-Cool Planet Campus
Carbon Calculator (CCC) as the tool for calculating and analyzing its emissions, as it is the
preferred tool of the ACUPCC (the University of New Hampshire now manages the CCC).
Designed specifically for campuses, the CCC is consistent with greenhouse gas protocol
standards and is commonly used by universities. Radford University used the CCC for each GGI
since 2010 and the most recently updated version (V.9.0) for the 2016 inventory. All data from
previous inventories was transferred to and evaluated by this tool.
Organizational Boundary: The 2016 GGI included emissions data for all Radford University
buildings under operational control of the university. If the university paid the utility bills for a
building, it was included in the inventory.
Data Collection: The GGI process requested information and support from many individuals,
departments, offices, and the Sustainability Steering Committee. The data included in the
inventory is the most up-to-date and accurate information available and provides a
comprehensive snapshot of the University’s greenhouse gas emissions. Some assumptions and
estimations were necessary due to limitations in the data. These assumptions and estimations
are accepted industry standards and are outlined below.
Faculty, Staff, & Student Commuting: The Sustainability Office oversaw a new
commuter survey for the 2015 – 2016 fiscal year. A senior Geo-Spatial Science major,
under direct supervision of the department chair, ran a GIS model using the home
address data of each commuter parking pass holder. The model calculated the shortest
driving distance between each address and the Radford University campus. The student
then extrapolated the daily mileage for the entire year by estimating the number of
commuting days per year for each classification of permit holder – students, faculty, and
staff.
Directly Financed Air Travel: Total air travel mileage was calculated using the 2016
Average Cost per Mile of commercial air travel ($0.15). This figure, calculated by Airlines
for America, is adjusted annually and accounts for all domestic and international flights.
Radford University Accounts Payable and the local travel agency, Christian Travel,
provide the total cost of directly financed air travel. The total cost is divided by the
average cost per mile to calculate the estimated total miles of directly financed air
travel.
Study Abroad Air Travel: The Director of International Education provided the air travel
mileage, which includes both student and university employee air travel related to study
abroad programs.
Solid Waste: Radford University hauls all of its trash to the Cloyd’s Mountain Landfill in
Pulaski County, VA. The landfill weighs all trash per load delivered; this provides us a
very accurate measurement of our landfilled trash. At the landfill, Ingenco Distributed
Energy is operating a landfill gas capture and electricity production operation. This
greatly reduces the greenhouse gas emissions of our organic landfilled trash and is
reflected by the calculations in the CCC.
Paper: Radford University Procurement and Contracts provided the data on purchased
paper. The paper figure is limited to general purpose/copier paper purchases from
different suppliers and does not include every type of paper utilized within a year by the
University. General use and copier paper are delivered in reams, and single ream of
paper weighs 4.75 pounds. This weight is used to estimate the total pounds of paper
used.
Radford University’s Sustainability Manager worked with the university’s Energy Manager to
initiate the GGI process. Radford University’s Energy Manager collected most of the data
related to facilities and operations, Scopes 1 and 2, by reaching out to the appropriate manager
or department contact from each category. The Sustainability Manager managed the collection
of the Scope 3 data and demographic information.
During the data collection phase, the Sustainability Manager entered the raw data the CCC
where appropriate and processed other data into units that are compatible with the tool. When
the data collection was complete, the Sustainability Manager and other university employees
began analyzing the results for any omissions or unusual discrepancies.
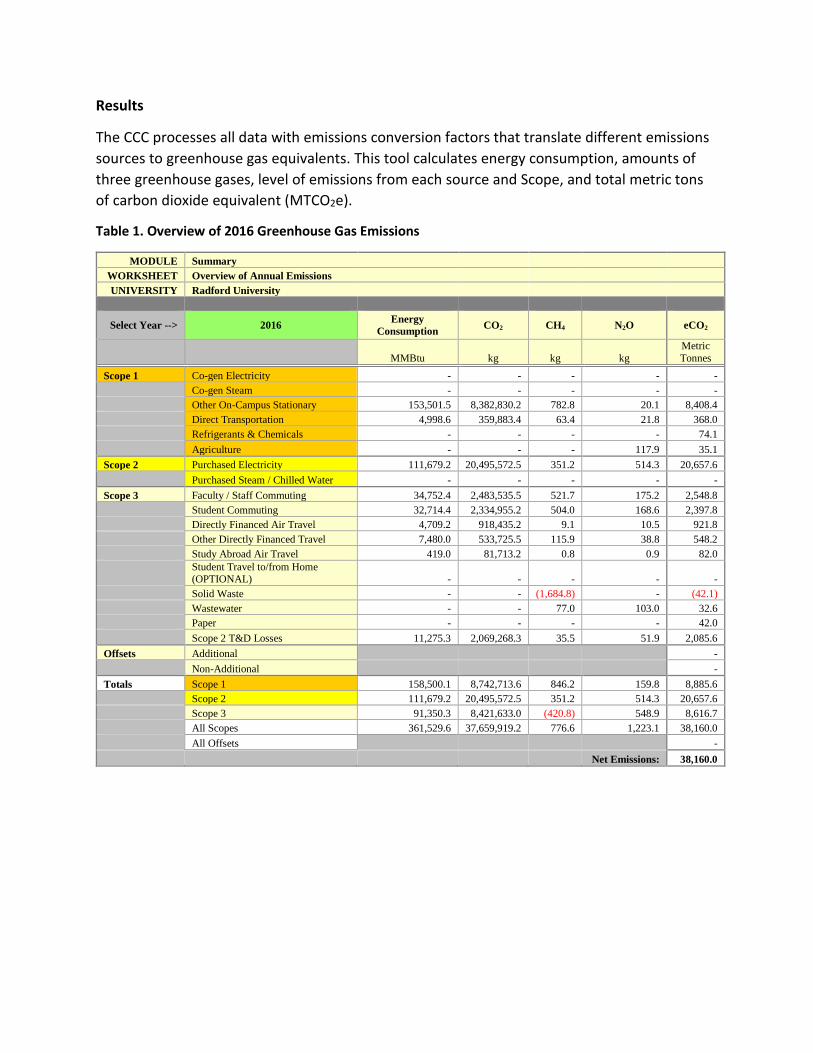
Results
The CCC processes all data with emissions conversion factors that translate different emissions
sources to greenhouse gas equivalents. This tool calculates energy consumption, amounts of
three greenhouse gases, level of emissions from each source and Scope, and total metric tons
of carbon dioxide equivalent (MTCO2e).
Table 1. Overview of 2016 Greenhouse Gas Emissions
MODULE Summary
WORKSHEET Overview of Annual Emissions
UNIVERSITY Radford University
Select Year --> 2016 Energy
Consumption CO2 CH4 N2O eCO2
MMBtu kg kg kg
Metric
Tonnes
Scope 1 Co-gen Electricity - - - - -
Co-gen Steam - - - - -
Other On-Campus Stationary 153,501.5 8,382,830.2 782.8 20.1 8,408.4
Direct Transportation 4,998.6 359,883.4 63.4 21.8 368.0
Refrigerants & Chemicals - - - - 74.1
Agriculture - - - 117.9 35.1
Scope 2 Purchased Electricity 111,679.2 20,495,572.5 351.2 514.3 20,657.6
Purchased Steam / Chilled Water - - - - -
Scope 3 Faculty / Staff Commuting 34,752.4 2,483,535.5 521.7 175.2 2,548.8
Student Commuting 32,714.4 2,334,955.2 504.0 168.6 2,397.8
Directly Financed Air Travel 4,709.2 918,435.2 9.1 10.5 921.8
Other Directly Financed Travel 7,480.0 533,725.5 115.9 38.8 548.2
Study Abroad Air Travel 419.0 81,713.2 0.8 0.9 82.0
Student Travel to/from Home (OPTIONAL) - - - - -
Solid Waste - - (1,684.8) - (42.1)
Wastewater - - 77.0 103.0 32.6
Paper - - - - 42.0
Scope 2 T&D Losses 11,275.3 2,069,268.3 35.5 51.9 2,085.6
Offsets Additional -
Non-Additional -
Totals Scope 1 158,500.1 8,742,713.6 846.2 159.8 8,885.6
Scope 2 111,679.2 20,495,572.5 351.2 514.3 20,657.6
Scope 3 91,350.3 8,421,633.0 (420.8) 548.9 8,616.7
All Scopes 361,529.6 37,659,919.2 776.6 1,223.1 38,160.0
All Offsets -
Net Emissions: 38,160.0
Discussion
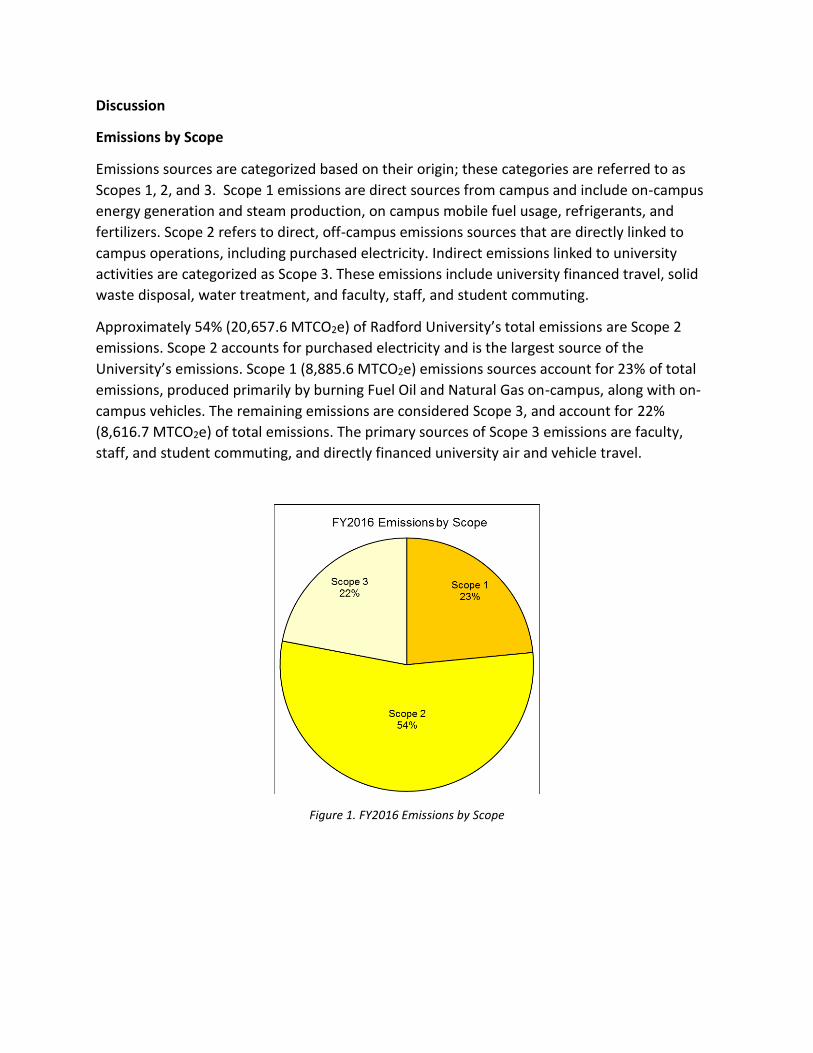
Emissions by Scope
Emissions sources are categorized based on their origin; these categories are referred to as
Scopes 1, 2, and 3. Scope 1 emissions are direct sources from campus and include on-campus
energy generation and steam production, on campus mobile fuel usage, refrigerants, and
fertilizers. Scope 2 refers to direct, off-campus emissions sources that are directly linked to
campus operations, including purchased electricity. Indirect emissions linked to university
activities are categorized as Scope 3. These emissions include university financed travel, solid
waste disposal, water treatment, and faculty, staff, and student commuting.
Approximately 54% (20,657.6 MTCO2e) of Radford University’s total emissions are Scope 2
emissions. Scope 2 accounts for purchased electricity and is the largest source of the
University’s emissions. Scope 1 (8,885.6 MTCO2e) emissions sources account for 23% of total
emissions, produced primarily by burning Fuel Oil and Natural Gas on-campus, along with on-
campus vehicles. The remaining emissions are considered Scope 3, and account for 22%
(8,616.7 MTCO2e) of total emissions. The primary sources of Scope 3 emissions are faculty,
staff, and student commuting, and directly financed university air and vehicle travel.
Figure 1. FY2016 Emissions by Scope

2016 Results: Top 5 Sources of Emissions
1. Purchased Electricity and T&D Losses – 60% of Total Emissions: Purchased electricity, a
Scope 2 emission source, continues to be the university’s largest emissions source
(54%). During FY2016, Radford University purchased 32,755,200 kilowatt hours of
electricity from Radford City. The approximate fuel mixture for producing electricity in
the university’s eGrid Subregion, RFC West, is used to calculate these emissions.
Electricity Transmission and Distribution Losses, or T&D Losses, account for the
electricity that is lost between the power station and the final user. The U.S. Energy
Information Administration (EIA) estimates that T&D losses average about 5% of the
electricity that is transmitted and distributed annually in the United States.1 T&D Losses
will increase or decrease based on the amount of electricity that the University
purchases and/or the sources from which it is produced, and is currently 6% of total
emissions.
Purchased Electricity and T&D Losses produced 22,743.2 MTCO2e in FY2016.
2. On-Campus Stationary – 22% of Total Emissions: This emissions source is a Scope 1
emission and represents fuel sources consumed on the Radford University campus. In
FY2016, the university used 84,739 gallons of distillate fuel oil, 439 gallons of propane,
and 141,817 MMBtu of natural gas. During this time period, fuel oil was the primary fuel
source used to generate steam for heating on-campus buildings. Propane and natural
gas are heat sources for several on-campus and off-campus university-owned or
operated buildings.
On-campus Stationary produced 8,408.4 MTCO2e in FY2016.
3. Faculty, Staff, and Student Commuting – 13% of Total Emissions: In FY2016 Faculty,
Staff, & Students logged an estimated 13,210,064 miles in their personal vehicles during
their regular daily commute to campus. This is a Scope 3 emission source.
Faculty, Staff, and Student commuting produced 4,946.6 MTCO2e in FY2016.
4. Directly Financed Air Travel – 2% of Total Emissions: Faculty and Staff accumulated
approximately 1.9 million miles of air travel directly related to university business during
FY2016. This is down slightly from last year and has been decreasing since 2013.
Directly Financed Air Travel produced 921.8 MTCO2e in FY2016.
1. Frequently Asked Questions. How much electricity is lost in transmission and distribution in the United States. U.S. Energy Information
Administration: Independent Statistics & Analysis. https://www.eia.gov/tools/faqs/faq.php?id=105&t=3. Feb 16, 2017.
5. Other Directly Financed Travel – 2% of Total Emissions: Non-air travel that is directly
related to and financed by the University produces these emissions. Travel in rental
vehicles from Enterprise Holdings and in personal vehicles are the two primary sources,
at 780,839 miles and 722,368 miles, respectively.
Other Directly Financed Travel produced 548.2 MTCO2e in FY2016.
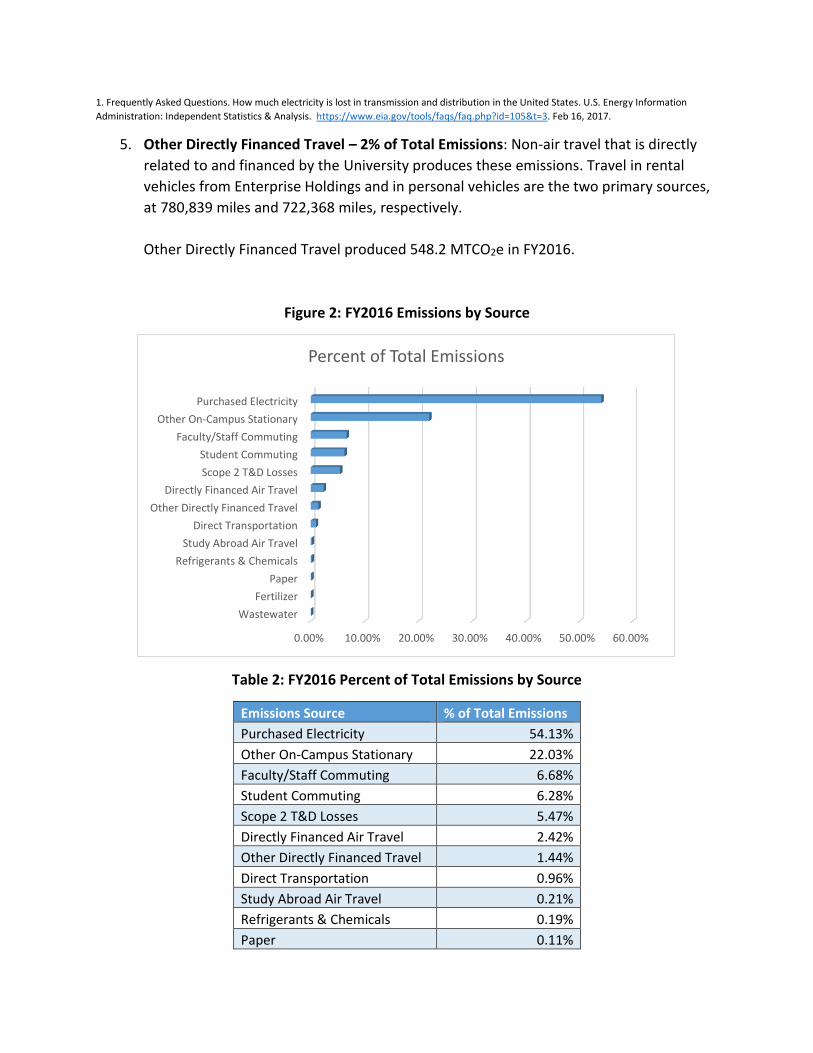
Figure 2: FY2016 Emissions by Source
Table 2: FY2016 Percent of Total Emissions by Source
Emissions Source % of Total Emissions
Purchased Electricity 54.13%
Other On-Campus Stationary 22.03%
Faculty/Staff Commuting 6.68%
Student Commuting 6.28%
Scope 2 T&D Losses 5.47%
Directly Financed Air Travel 2.42%
Other Directly Financed Travel 1.44%
Direct Transportation 0.96%
Study Abroad Air Travel 0.21%
Refrigerants & Chemicals 0.19%
Paper 0.11%
0.00% 10.00% 20.00% 30.00% 40.00% 50.00% 60.00%
Wastewater
Fertilizer
Paper
Refrigerants & Chemicals
Study Abroad Air Travel
Direct Transportation
Other Directly Financed Travel
Directly Financed Air Travel
Scope 2 T&D Losses
Student Commuting
Faculty/Staff Commuting
Other On-Campus Stationary
Purchased Electricity
Percent of Total Emissions
Fertilizer 0.09%
Wastewater 0.09%
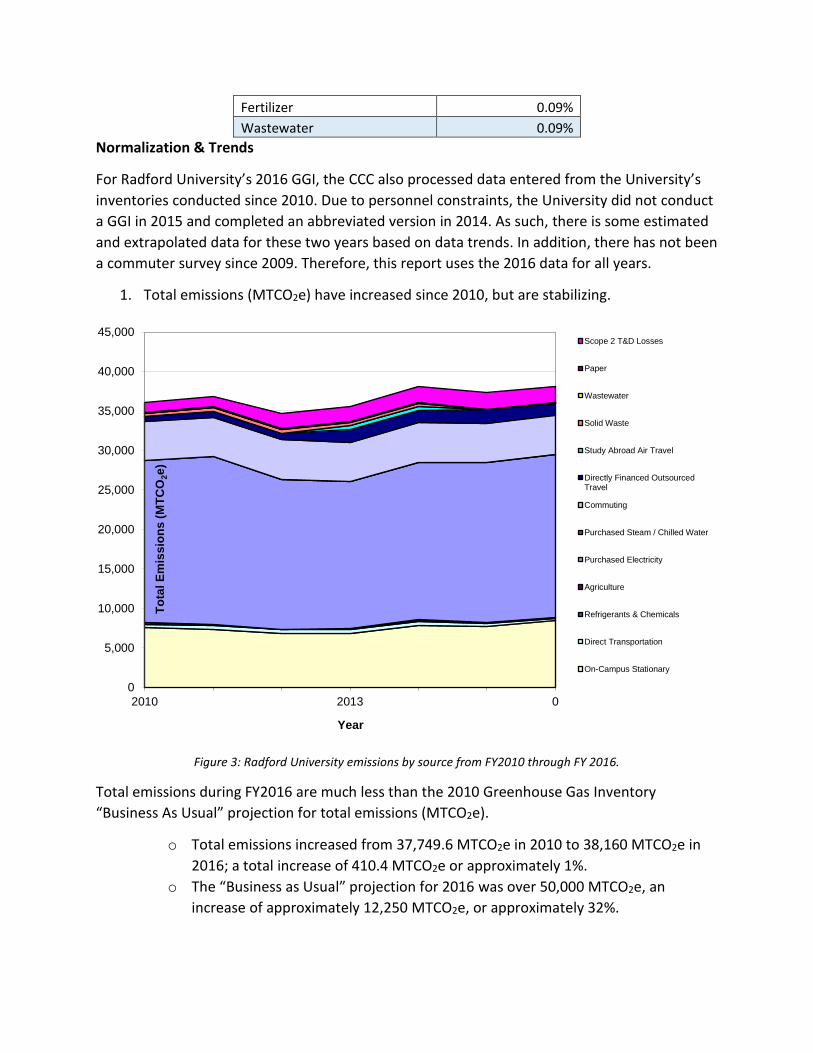
Normalization & Trends
For Radford University’s 2016 GGI, the CCC also processed data entered from the University’s
inventories conducted since 2010. Due to personnel constraints, the University did not conduct
a GGI in 2015 and completed an abbreviated version in 2014. As such, there is some estimated
and extrapolated data for these two years based on data trends. In addition, there has not been
a commuter survey since 2009. Therefore, this report uses the 2016 data for all years.
1. Total emissions (MTCO2e) have increased since 2010, but are stabilizing.
Figure 3: Radford University emissions by source from FY2010 through FY 2016.
Total emissions during FY2016 are much less than the 2010 Greenhouse Gas Inventory
“Business As Usual” projection for total emissions (MTCO2e).
o Total emissions increased from 37,749.6 MTCO2e in 2010 to 38,160 MTCO2e in
2016; a total increase of 410.4 MTCO2e or approximately 1%.
o The “Business as Usual” projection for 2016 was over 50,000 MTCO2e, an
increase of approximately 12,250 MTCO2e, or approximately 32%.
0
5,000
10,000
15,000
20,000
25,000
30,000
35,000
40,000
45,000
2010 2013 0
To
tal E
mis
sio
ns
(M
TC
O2e
)
Year
Scope 2 T&D Losses
Paper
Wastewater
Solid Waste
Study Abroad Air Travel
Directly Financed OutsourcedTravel
Commuting
Purchased Steam / Chilled Water
Purchased Electricity
Agriculture
Refrigerants & Chemicals
Direct Transportation
On-Campus Stationary
o The 2010 GGI “Building Space” square footage projection for 2016 was
approximately 2.8 million square feet. This was an accurate projection.
o The “Full Time Student Enrollment” in 2016 was 9,052. In the 2010 GGI, “Full
Time Student Enrollment” projections for 2016 approached 11,000.
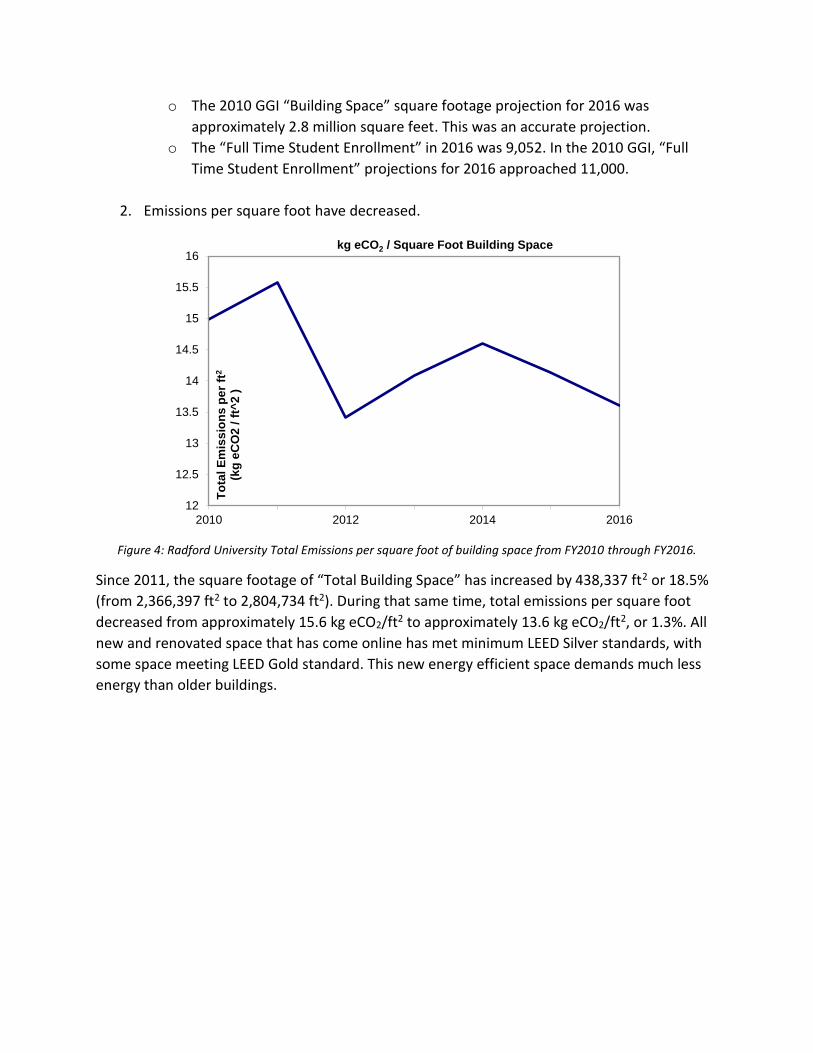
2. Emissions per square foot have decreased.
Figure 4: Radford University Total Emissions per square foot of building space from FY2010 through FY2016.
Since 2011, the square footage of “Total Building Space” has increased by 438,337 ft2 or 18.5%
(from 2,366,397 ft2 to 2,804,734 ft2). During that same time, total emissions per square foot
decreased from approximately 15.6 kg eCO2/ft2 to approximately 13.6 kg eCO2/ft2, or 1.3%. All
new and renovated space that has come online has met minimum LEED Silver standards, with
some space meeting LEED Gold standard. This new energy efficient space demands much less
energy than older buildings.
12
12.5
13
13.5
14
14.5
15
15.5
16
2010 2012 2014 2016
To
tal E
mis
sio
ns
pe
r ft
2
(kg
eC
O2
/ f
t^2
)kg eCO2 / Square Foot Building Space

3. Emissions Per Student are lower than in 2010, but have increased since 2013.
Figure 5: Total emissions per student from FY2010 through FY2016.
Emissions per student decreased approximately 5% from the 2010 level.
4. Emissions per operating dollar have gradually decreased since 2010, with the exception
of 2016, where there was a slight increase.
3.6
3.7
3.8
3.9
4
4.1
4.2
4.3
4.4
2010 2012 2014 2016
To
tal E
mis
sio
ns
pe
r S
tud
en
t (M
etr
ic
To
ns
eC
O2
/ S
tud
en
t F
TE
)
Metric Tons eCO2 / Student Full Time Equivalent

Figure 6: Radford University total emissions per operating dollar from FY2010 through FY2016.
Emissions per operating dollar estimates the overall emissions efficiency of the institution. For
every dollar that is spent, a certain amount of emissions are released. Between 2015 and 2016,
Radford University’s operating budget experienced the smallest percentage increase than it did
between any other years since 2010, which may explain the slight increase between 2015 and
2016.
Looking Ahead
Next year’s GGI (2016 – 2017), will include newly constructed square footage (Center for the
Sciences and College of Humanities & Behavioral Science). After the 2016 – 2017 year, there are
no new construction projects currently planned, thus no increase in square footage of new
building space is expected at this time. However, additional renovated square footage that was
not online in 2015 – 2016, will be functional and added to the GGI in 2016 – 2017 and again in
2017 – 2018. Once all new and renovated square footage is operational, energy consumption
related directly to functional building space will likely plateau and all subsequent efficiency
upgrades and renovations will be direct gains towards the ultimate goal. Furthermore, the
University is striving to increase enrollment. An increase in students will demand more energy,
though with efficiencies and conservation measures in place, a collaborative education and
outreach campaign could keep greenhouse gas emissions from increasing.
Radford University is committed to reducing greenhouse gas emissions and pursuing carbon
neutrality. In 2010, the university’s Sustainability Steering Committee set interim targets of a
30% reduction by 2020 and 60% reduction by 2030 from the 2010 baseline, and reaching net
zero emissions in 2040. There are three primary methods for reducing net greenhouse gas
0
50
100
150
200
250
2010 2012 2014 2016
Em
iss
ion
s p
er
Op
era
tin
g $
(G
ram
s e
CO
2 /
$)
Grams eCO2 / Operating $

emissions: employing energy efficiency and conservation practices; purchasing or producing
carbon-free energy, and purchasing offsets to carbon emissions. To achieve its emissions
reduction goals, the University will implement some combination of actions and strategies from
these three methods.
Radford University will benefit from an action plan for reducing greenhouse gases that
considers new data and all available options. This plan will outline specific reductions strategies,
their cost and impact on greenhouse gas emissions, and the most effective and feasible
combination of strategies for achieving the interim and final goals. Once complete, Radford
University, the community, and its partners will have a transparent roadmap for reaching its
emissions reduction targets. The plan should be a working document, as technology is
improving rapidly and the cost of renewable energy is now competitive with more traditional
fuel sources.
Acknowledgements
Completing a Greenhouse Gas Inventory is a collaborative effort and requires contributions
from every corner of the University. RU Sustainability is grateful to everyone for participating
and assisting the university in achieving its ambitious goals for reducing greenhouse gas
emissions.
A special thanks to Accounting Services, Christian Travel, Department of Geospatial Sciences,
Enterprise Holdings, Facilities Management, Institutional Research, Procurements and
Contracts, the Sustainability Steering Committee, and all others who collaborated during the
process.
Appendices
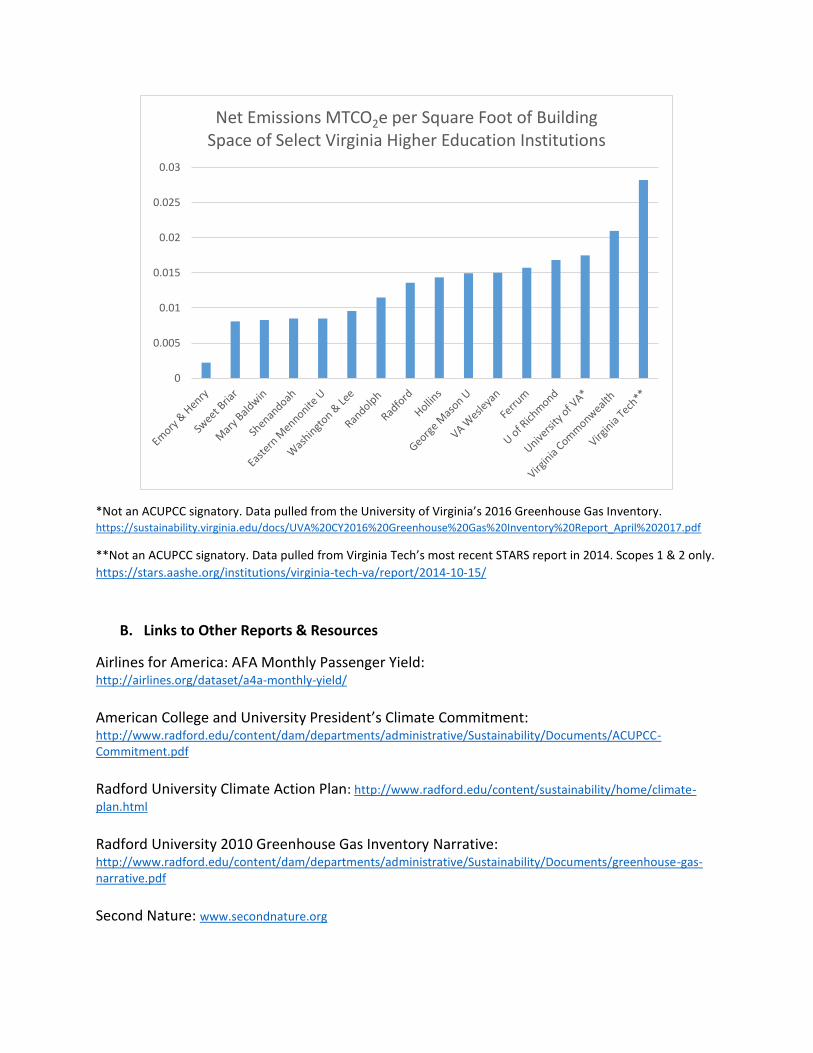
A. Normalization & Benchmarking with Other Virginia Institutions
Making meaningful comparisons between higher education institutions is a challenging
endeavor; each institution is unique, information is unverified, and unbiased normalization
metrics are not available. This data, unless otherwise noted, is from Second Nature’s online
reporting dashboard and is the most up to date information available. Second Nature is the
organization managing the implementation of the ACUPCC (now Carbon or Climate
Commitment) and there are currently 15 higher education institutions in Virginia that are
ACUPCC reporting signatories. Radford University is one of only three public higher education
institutions in this group (George Mason University and Virginia Commonwealth University).
Both the University of Virginia and Virginia Tech are public universities and are not signatories,
but recently reported their emissions; as such, they are included in this comparison.
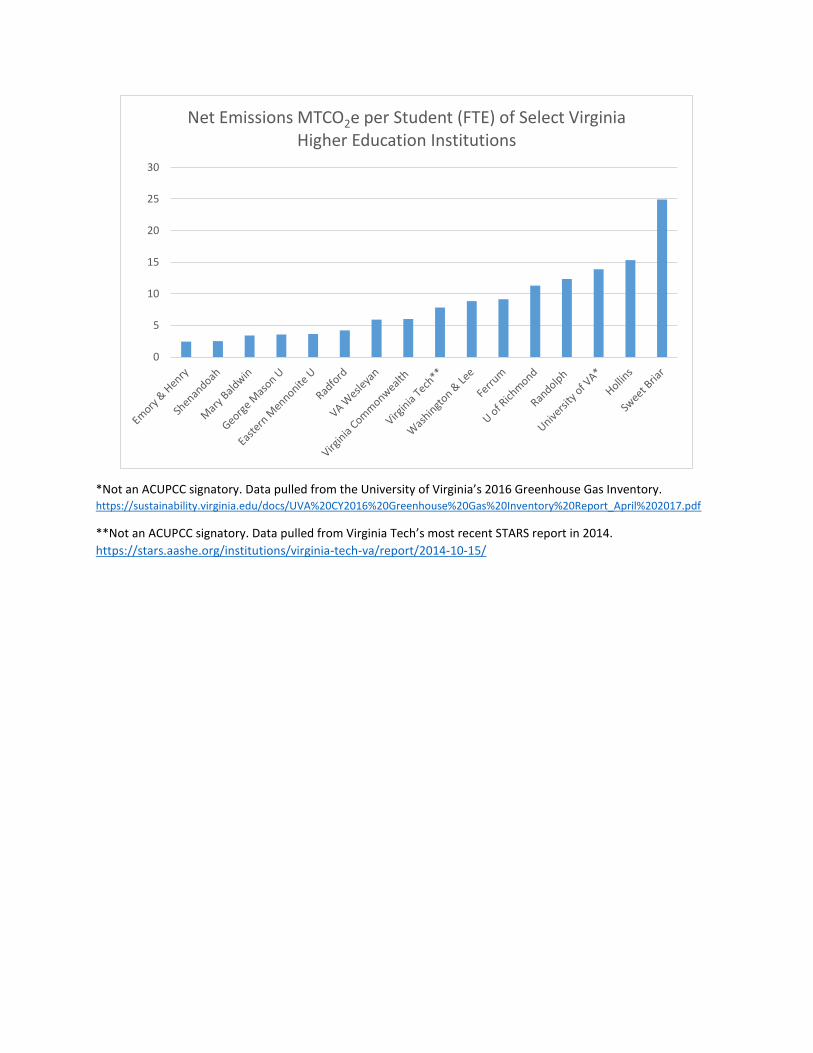
*Not an ACUPCC signatory. Data pulled from the University of Virginia’s 2016 Greenhouse Gas Inventory. https://sustainability.virginia.edu/docs/UVA%20CY2016%20Greenhouse%20Gas%20Inventory%20Report_April%202017.pdf
**Not an ACUPCC signatory. Data pulled from Virginia Tech’s most recent STARS report in 2014.
https://stars.aashe.org/institutions/virginia-tech-va/report/2014-10-15/
0
5
10
15
20
25
30
Net Emissions MTCO2e per Student (FTE) of Select Virginia Higher Education Institutions
*Not an ACUPCC signatory. Data pulled from the University of Virginia’s 2016 Greenhouse Gas Inventory. https://sustainability.virginia.edu/docs/UVA%20CY2016%20Greenhouse%20Gas%20Inventory%20Report_April%202017.pdf
**Not an ACUPCC signatory. Data pulled from Virginia Tech’s most recent STARS report in 2014. Scopes 1 & 2 only.
https://stars.aashe.org/institutions/virginia-tech-va/report/2014-10-15/
B. Links to Other Reports & Resources
Airlines for America: AFA Monthly Passenger Yield: http://airlines.org/dataset/a4a-monthly-yield/
American College and University President’s Climate Commitment: http://www.radford.edu/content/dam/departments/administrative/Sustainability/Documents/ACUPCC-Commitment.pdf Radford University Climate Action Plan: http://www.radford.edu/content/sustainability/home/climate-
plan.html
Radford University 2010 Greenhouse Gas Inventory Narrative: http://www.radford.edu/content/dam/departments/administrative/Sustainability/Documents/greenhouse-gas-narrative.pdf
Second Nature: www.secondnature.org
0
0.005
0.01
0.015
0.02
0.025
0.03
Net Emissions MTCO2e per Square Foot of Building Space of Select Virginia Higher Education Institutions