radial void fraction measurement of a randomly packed ... · clear reactors (pnr) of the faculty of...
TRANSCRIPT
Radial void fraction measurement of a randomly
packed pebble-bed
Vincent van Dijk
June 20, 2008

i
The research in this paper has been performed at the section Physics of Nu-clear Reactors (PNR) of the faculty of Applied Sciences (AP), Delft Universityof Technology, Mekelweg 15, 2629 JB Delft, The Netherlands. The research hasbeen supervised by dr. ir. J.L. Kloosterman and drs. ing. A. Winkelman.
Contents
Abstract iv
1 Introduction 11.1 Pebble-bed reactors . . . . . . . . . . . . . . . . . . . . . . . . . . 11.2 Outline of the thesis . . . . . . . . . . . . . . . . . . . . . . . . . 2
2 Theoretical background 32.1 Radiation basics . . . . . . . . . . . . . . . . . . . . . . . . . . . 32.2 Poisson distribution . . . . . . . . . . . . . . . . . . . . . . . . . 32.3 Pebble-bed reactors . . . . . . . . . . . . . . . . . . . . . . . . . . 42.4 Gamma-ray tomography experiment . . . . . . . . . . . . . . . . 5
3 ”Pebble-bed Experiment” 73.1 Reactor vessel . . . . . . . . . . . . . . . . . . . . . . . . . . . . . 73.2 Motors . . . . . . . . . . . . . . . . . . . . . . . . . . . . . . . . . 83.3 Signal . . . . . . . . . . . . . . . . . . . . . . . . . . . . . . . . . 83.4 Amplifiers and energy windows . . . . . . . . . . . . . . . . . . . 9
4 Experimental procedure 114.1 Focus of the research . . . . . . . . . . . . . . . . . . . . . . . . . 114.2 Strategy . . . . . . . . . . . . . . . . . . . . . . . . . . . . . . . . 114.3 Validating the theory . . . . . . . . . . . . . . . . . . . . . . . . . 114.4 Source angle . . . . . . . . . . . . . . . . . . . . . . . . . . . . . . 124.5 Detector management . . . . . . . . . . . . . . . . . . . . . . . . 124.6 The pebble-bed . . . . . . . . . . . . . . . . . . . . . . . . . . . . 124.7 Temperature measurements . . . . . . . . . . . . . . . . . . . . . 13
5 Results 145.1 Rotation of the Am-241 source . . . . . . . . . . . . . . . . . . . 145.2 Amplification and energy window settings . . . . . . . . . . . . . 165.3 Calibration measurements . . . . . . . . . . . . . . . . . . . . . . 175.4 Temperature measurements . . . . . . . . . . . . . . . . . . . . . 195.5 Radial porosity profile . . . . . . . . . . . . . . . . . . . . . . . . 21
ii
CONTENTS iii
6 Conclusions 236.1 Conclusions . . . . . . . . . . . . . . . . . . . . . . . . . . . . . . 236.2 Recommendations . . . . . . . . . . . . . . . . . . . . . . . . . . 24
6.2.1 Recommended changes . . . . . . . . . . . . . . . . . . . . 246.2.2 Follow-up research . . . . . . . . . . . . . . . . . . . . . . 24
Acknowledgements 26
Appendix A.1: Ortec 570 29
Appendix A.2: SCA 2030 31
Appendix B: X-ray mass attenuation PMMA 33
Abstract
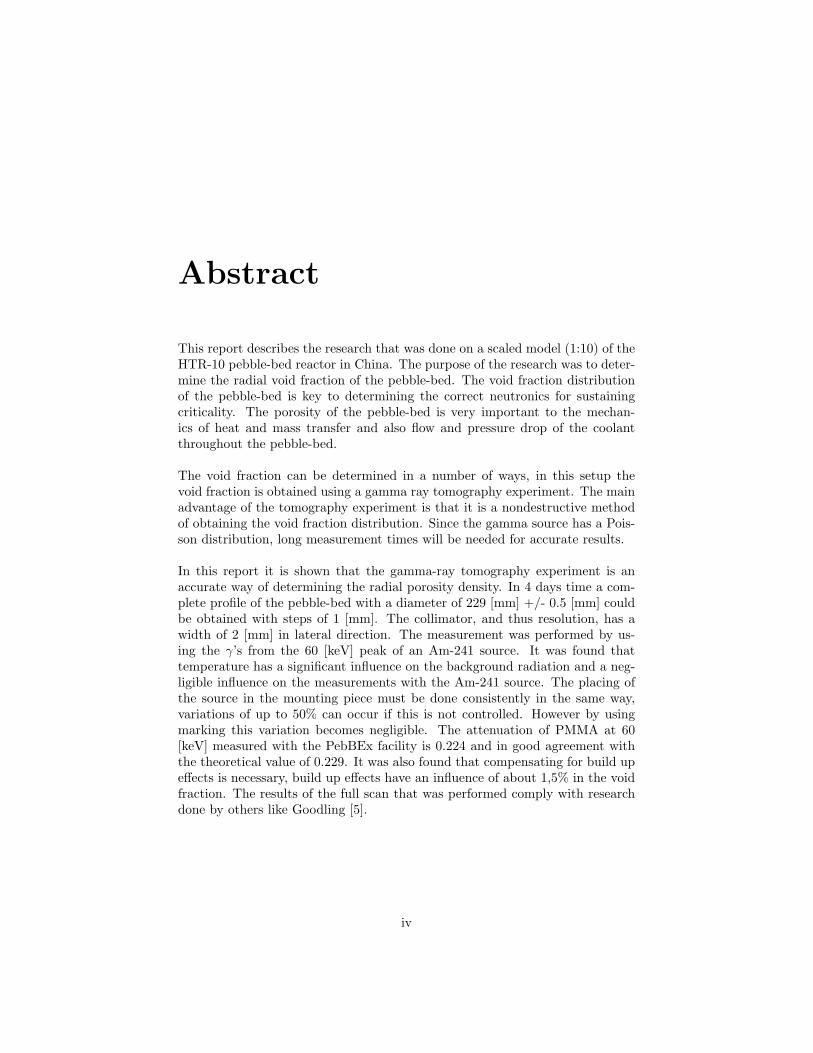
This report describes the research that was done on a scaled model (1:10) of theHTR-10 pebble-bed reactor in China. The purpose of the research was to deter-mine the radial void fraction of the pebble-bed. The void fraction distributionof the pebble-bed is key to determining the correct neutronics for sustainingcriticality. The porosity of the pebble-bed is very important to the mechan-ics of heat and mass transfer and also flow and pressure drop of the coolantthroughout the pebble-bed.
The void fraction can be determined in a number of ways, in this setup thevoid fraction is obtained using a gamma ray tomography experiment. The mainadvantage of the tomography experiment is that it is a nondestructive methodof obtaining the void fraction distribution. Since the gamma source has a Pois-son distribution, long measurement times will be needed for accurate results.
In this report it is shown that the gamma-ray tomography experiment is anaccurate way of determining the radial porosity density. In 4 days time a com-plete profile of the pebble-bed with a diameter of 229 [mm] +/- 0.5 [mm] couldbe obtained with steps of 1 [mm]. The collimator, and thus resolution, has awidth of 2 [mm] in lateral direction. The measurement was performed by us-ing the γ’s from the 60 [keV] peak of an Am-241 source. It was found thattemperature has a significant influence on the background radiation and a neg-ligible influence on the measurements with the Am-241 source. The placing ofthe source in the mounting piece must be done consistently in the same way,variations of up to 50% can occur if this is not controlled. However by usingmarking this variation becomes negligible. The attenuation of PMMA at 60[keV] measured with the PebBEx facility is 0.224 and in good agreement withthe theoretical value of 0.229. It was also found that compensating for build upeffects is necessary, build up effects have an influence of about 1,5% in the voidfraction. The results of the full scan that was performed comply with researchdone by others like Goodling [5].
iv
Chapter 1
Introduction
Since of couple of years back the political view on nuclear energy in the Nether-lands is changing. This change is driven by the need to reduce greenhouse gasemissions and also driven by the need to reduce the dependency on energy fromless stable countries to fuel our country. Below is the conclusion from the debateon nuclear power in the Netherlands on March 2008.
Tot 2020 worden geen nieuwe kerncentrales gebouwd, maar het denkproces overkernenergie staat niet stil. Nieuwe technologische ontwikkelingen kunnen ertoeleiden dat op termijn wel nieuwe centrales worden gebouwd. Deze boodschapdroegen de ministers van Economische Zaken Maria van der Hoeven (CDA) enminister van Milieubeleid Jacqueline Cramer (PvdA) woensdag gezamenlijk uitin de Tweede Kamer.[1]
There are still a couple of problems facing nuclear energy and one of themis the safety aspect. The fear of an accident happening either because of humanerror or due to a terrorist attack is large. Conventional nuclear power plantsstack defense systems one after the other to improve their ’defense-in-depth’.This brings along quite some problems besides increasing the cost of the plant,the complexity of multiple systems makes it difficult to assess as to how safethe plant really is and the chance for human error could be larger with thesecomplex systems. The pebble-bed reactor, which is one of the generation IVreactors [2], tries to solve this issue by being an inherently safe nuclear reactor.
1.1 Pebble-bed reactors
In pebble-bed reactors the fuel is contained in pebbles of graphite rather than inmetallic rods which are used in reactors like the BWR (Boiling-Water Reactor)and PWR (Pressurized Water Reactor). The graphite pebbles of typically 60[mm] in diameter contain about 5000 to 20.000 coated triso particles. Thesetriso particles contain a fuel kernel of UO2. The pebble-bed reactor has two
1
CHAPTER 1. INTRODUCTION 2
major benefits. The first one is because of the gas coolant, since the pebblescan moderate themselves (they are like minireactors) the reactor can be cooledwith an inert gas like helium. An inert gas is not reactive under normal cir-cumstances and the gas does not get radioactive as fast as water, which is usedin ’conventional’ PWR. Because of the higher working temperature of the reac-tor the energy conversion efficiency improves. The low power density and hightemperature resistance of the core materials ensure that any decay heat will bedissipated and transported to the environment without the decay heat causinga meltdown.
In Germany a pebble-bed reactor, the AVR (working group test reactor) wasbuild in the sixties to serve as a showcase experimental reactor and as a showcaseto how safe this new form of technology was. However in the year 1988, after 21years of service, the reactor was shutdown in the wake of the Chernobyl disasterand operating problems they had at the reactor. Currently there is one workingprototype of the pebble-bed reactor in China the so called HTR-10, standingfor High Temperature Reactor (10MW). Multiple pebble-bed reactors are beingdesigned for construction in South Africa to supply a large part of their energyneeds and accepting pebble-bed reactors as a solution to their growing energyconsumption.
1.2 Outline of the thesis
Chapter two will consist of the theoretical background regarding pebble-bedreactor technology as well as some basics on radiation and nuclear technology.In chapter three the facility used for the measurement will be explained. In thischapter the hardware will be reviewed as well as the possibilities of the facility.Chapter four will explain the approach to get accurate results. Chapter fivewill discuss the way data is interpreted and handled. After that, in chapter six,there will be room for conclusions and recommendations.
Chapter 2
Theoretical background
In this chapter certain key aspects of working with a gamma ray tomographyexperiment are explained in detail.
2.1 Radiation basics
Radioactive isotopes decay to stable isotopes by radioactive decay. The energyrelease of this process is accompanied by emission of radiation in the form of α-, β- and γ-rays. In γ-transmission sources emitting γ-rays are used to measurethe attenuation of materials.[3]
2.2 Poisson distribution
The emission of radiation is a statistical process which is a very important aspectwhile measuring radiation. The radioactive decay of a nucleus is a statisticalprocess where there are two possibilities, a chance p that the nucleus decays anda chance 1-p that the nucleus doesn’t decay. All of the nuclei in which this pro-cess can occur are independent from each other. Because of this independencethe total process can be viewed as a repeating decay process. The binomialchance distribution describes the process of k successes by n repeated processes,this is given by
P (k) =n!
k!(n− k)!pk(1− p)(n−k) (2.1)
The expected value of this process is µ = np with a spread of σ =√
np(1− p).While measuring with radioactive sources the number of possible nuclei n is usu-ally very large. This changes the distribution to the simpler Poisson distribution
P (k) =λk
k!e−λ (2.2)
3
CHAPTER 2. THEORETICAL BACKGROUND 4
With an expected value of µ = λ and a standard deviation of σ =√
λ. If ina single experiment a number N has been counted and the above distribution istrue then the standard deviation can be guessed as following
s =√
N (2.3)
2.3 Pebble-bed reactors
In the core of the pebble-bed reactor there might be two types of balls, namelygraphite and fuel balls. The graphite balls fill the cylindrical centre of thepebble-bed and fuel balls surround the graphite balls. Both the graphite andthe fuel balls are extracted from the bottom and reinserted (or replaced in caseof burn up) on the top of the pebble-bed. This extracting and reinserting givesrise to a ball velocity of about 4.5[mm/h] [4]. Since this flow is slow we canapproximate the pebble-bed as a fixed packed bed.
The porosity of the pebble-bed is very important to the mechanisms of heatand mass transfer and also flow and pressure drop of the coolant throughoutthe pebble-bed. Because of the sensitivity of those mechanisms to the porosity itbecomes important to know the porosity distribution inside the pebble-bed andknowledge of the porosity is necessary for any rigorous analysis of the transportphenomena in the bed.[5]
The geometry in the packing of a pebble-bed is interrupted at the wall andthis gives rise to large porosity variations near the wall. The flow through amedium depends on this porosity and because of the wall disturbance in theporosity profile of the pebble-bed the velocity profile (of the cooling gas) is alsodisturbed. This phenomenon is called wall-channeling.[6]
By researching the wall channeling effect, a better porosity profile can be ob-tained and this knowledge can lead to better and more efficient pebble-bedreactors. Both the bottom and the sides of a pebble-bed influence the pebble-bed porosity profile. Research has been done by Bedenig [7] and he discoveredthat up till five pebble diameters the effect of wall channeling (from the bottomplate) could be measured by filling the pebble-bed with water and checking thewater level.
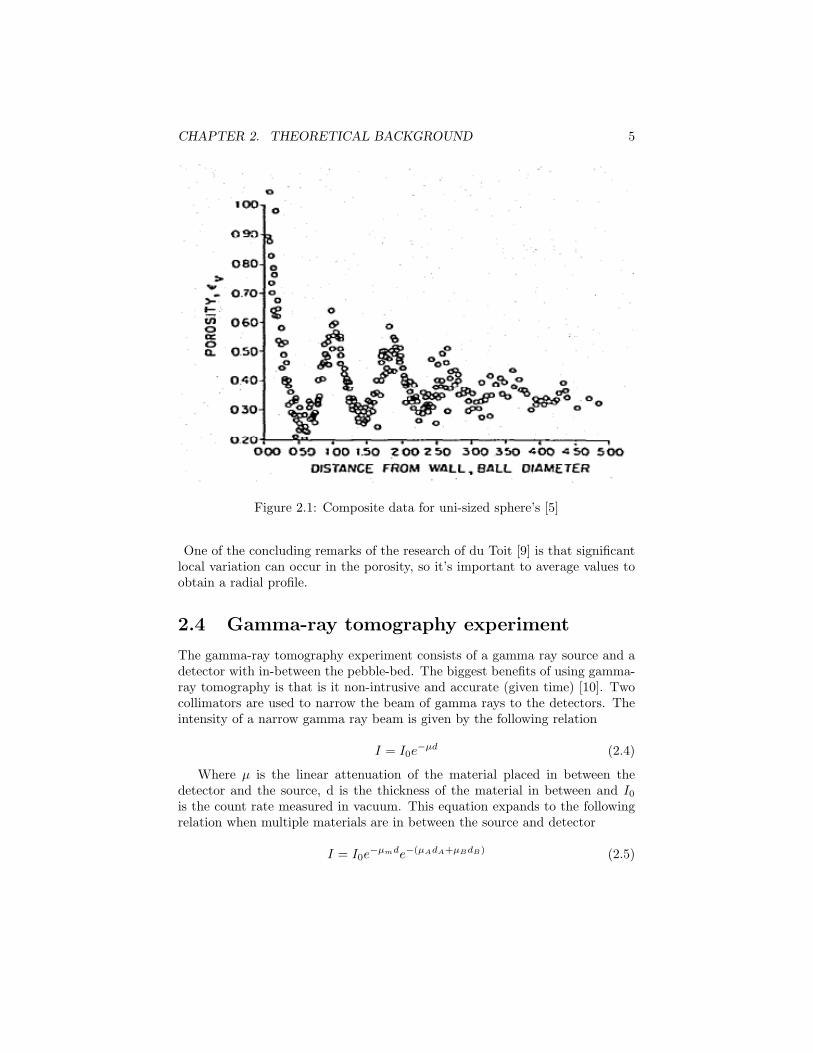
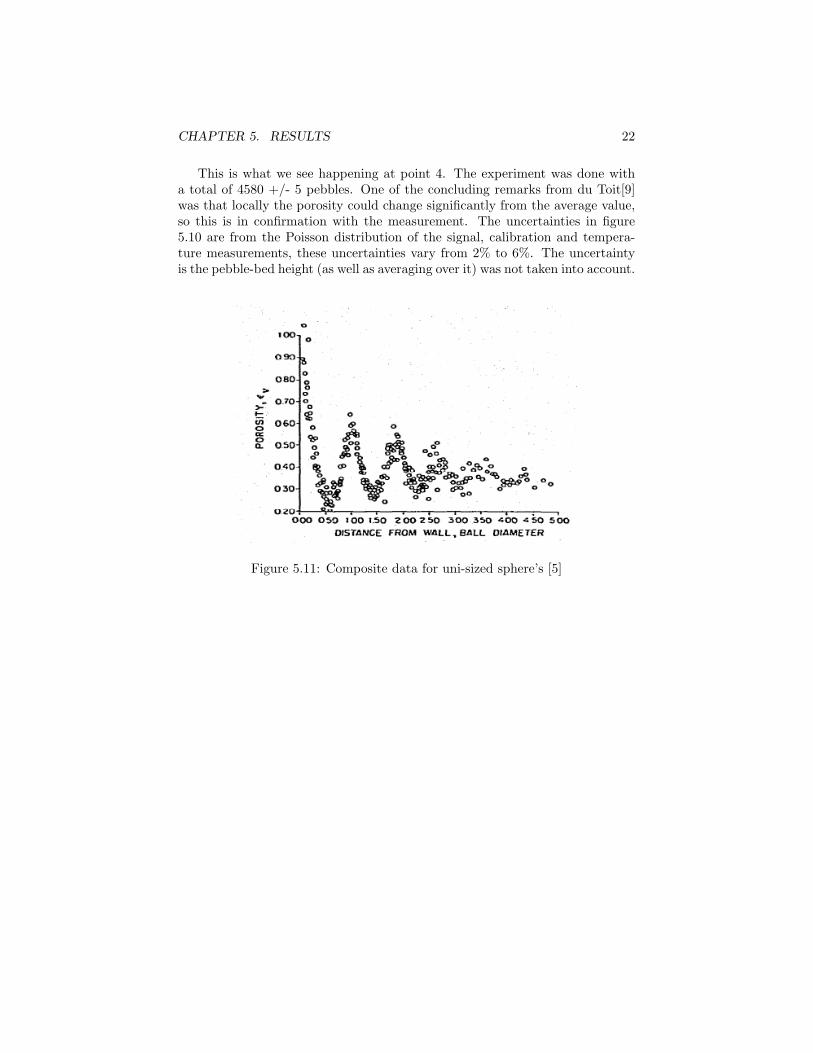
Goodling [5] used an epoxy harsh to fill the packed bed and weighted the amountof epoxy harsh to determine the void fraction. With his research he confirmedthe wall channeling effect was noticeable to around five pebble diameters deepmeasured from the sides. According to Goodling the void fraction oscillatedaround the mean value and reached unity at the wall, figure 2.1 shows this os-cillation. A mathematical expression was proposed by Cohen and Metzner [8]to describe the oscillatory variation.
CHAPTER 2. THEORETICAL BACKGROUND 5
Figure 2.1: Composite data for uni-sized sphere’s [5]
One of the concluding remarks of the research of du Toit [9] is that significantlocal variation can occur in the porosity, so it’s important to average values toobtain a radial profile.
2.4 Gamma-ray tomography experiment
The gamma-ray tomography experiment consists of a gamma ray source and adetector with in-between the pebble-bed. The biggest benefits of using gamma-ray tomography is that is it non-intrusive and accurate (given time) [10]. Twocollimators are used to narrow the beam of gamma rays to the detectors. Theintensity of a narrow gamma ray beam is given by the following relation
I = I0e−µd (2.4)
Where µ is the linear attenuation of the material placed in between thedetector and the source, d is the thickness of the material in between and I0
is the count rate measured in vacuum. This equation expands to the followingrelation when multiple materials are in between the source and detector
I = I0e−µmde−(µAdA+µBdB) (2.5)
CHAPTER 2. THEORETICAL BACKGROUND 6
The two calibration measurement are given by, where acry (short for acrylic)stands for a completely filled reactor and air stand for an empty (filled with air)reactor
Iair = I0e−µmde−µairdair (2.6)
Ipers = I0e−µmde−µacrydacry (2.7)
Combining equations (2.5),(2.6) and (2.7) and substituting A for air and Bfor acrylic we obtain
ln(I)− ln(Iair)ln(Iacry)− ln(Iair)
=dacry
d= α (2.8)
In Eq. 2.8, α is the chordal void fraction. Eq. 2.8 is independent of I0
which in turn depends on the source strength, detector efficiency and a numberof other variables. Simply by using two calibration measurements (filled andempty) there will be enough information to determine the thickness at all of thecount rates measured. To ensure that the height of the pebble-bed is equal tothe height used for the air and the acrylic layer a calculation of the number ofgrams needed to fill the pebble-bed to a height of h is made. This gives a totalmass Mpebble of
Mpebble =ρ(1− ε)πD2h
4(2.9)
Where ρ is the density of the acrylic pebbles, πD2
4 is the cross-sectional areaof the cylinder and ε is the average void fraction for a certain d/D ratio, this isthe ratio of the diameter of the pebbles to the diameter of the cylinder. Thisaverage void fraction is given by [11]
ε = 0.375 + 0.34dpebble
Dcylinder(2.10)
A perfectly uniform surface cannot be obtained, however when placing thepebbles in the experimental setup great care is taken to make the surface as flatas possible. Using pressure on the surface will influence the total positioning ofthe pebbles and thus potentially spoiling the experiment.
Chapter 3
”Pebble-bed Experiment”
The PebBEx facility has been built in Q4 of 2007 and Q1 of 2008 at the R3department of Delft University of Technology. The facility is a scaled downversion of the HTR-10, which is currently active in China. The PebBEx facilityhas been build to research the stacking behavior of packed beds and to get abetter understanding of wall channeling effects. The setup was made in sucha way that accurate measurements of the radial void fraction/porosity profilecould be obtained. The setup consists of a tomography experiment explainedin 2.4, a thermocouple setup and equipment for processing the data. A labviewcode was written to facilitate the long measurement times needed for accurateresults.
3.1 Reactor vessel
The facility is supposed to be a scale model of the HTR-10, ideally that wouldmean a diameter of 20 [cm] and a height of 30[cm]. In the setup an acryliccylinder is used with an outer diameter of 240 [mm], an inner diameter of 229[mm] +/- 0.5 [mm] and a height of 300 [mm]. By using acrylic the setup staystransparent which makes the positioning of the detector and the source easier.
The pebbles used, which are also made of acrylic, have a diameter of 12.7[mm]so that
Diameterreactorvessel(D)Diameterpebbles(d)
= 18.03 (3.1)
which is chosen based on publication in pebble-bed measurements. TheHTR-10 has a diameter of 180 [cm] and pebbles with a diameter of 6 [cm] whichresults in a D/d ratio of 30. [12]
7
CHAPTER 3. ”PEBBLE-BED EXPERIMENT” 8
3.2 Motors
The setup uses two step motors of the same type with both a unique function.One of the motors translates the reactor vessel, while the other motor rotatesthe complete setup. The rotation of the pebble-bed during measurements isvery important because (as has been stated earlier) there is a large variationin the void fraction locally. The rotation is low geared by an o-ring belt toaccommodate very low rotation speeds.
3.3 Signal
One of the challenges while creating an experimental setup is making sure theefficiency is maximized. Meaning the best possible result is a short as possibletime window. One of the largest limitations in the PebBEx facility is that thedecay of nuclei is Poisson distributed. A low amount of total (decay) countswill mean high uncertainty in the result. For the course of the measurementthe minimum amount of 10.000 counts had to be passed for a measurement wasfound useful, this gives a standard deviation of
√N , 100 counts. Because of the
effects of background radiation the actual uncertainty for each measurement isa bit higher than 1% depending on the background/signal ratio.
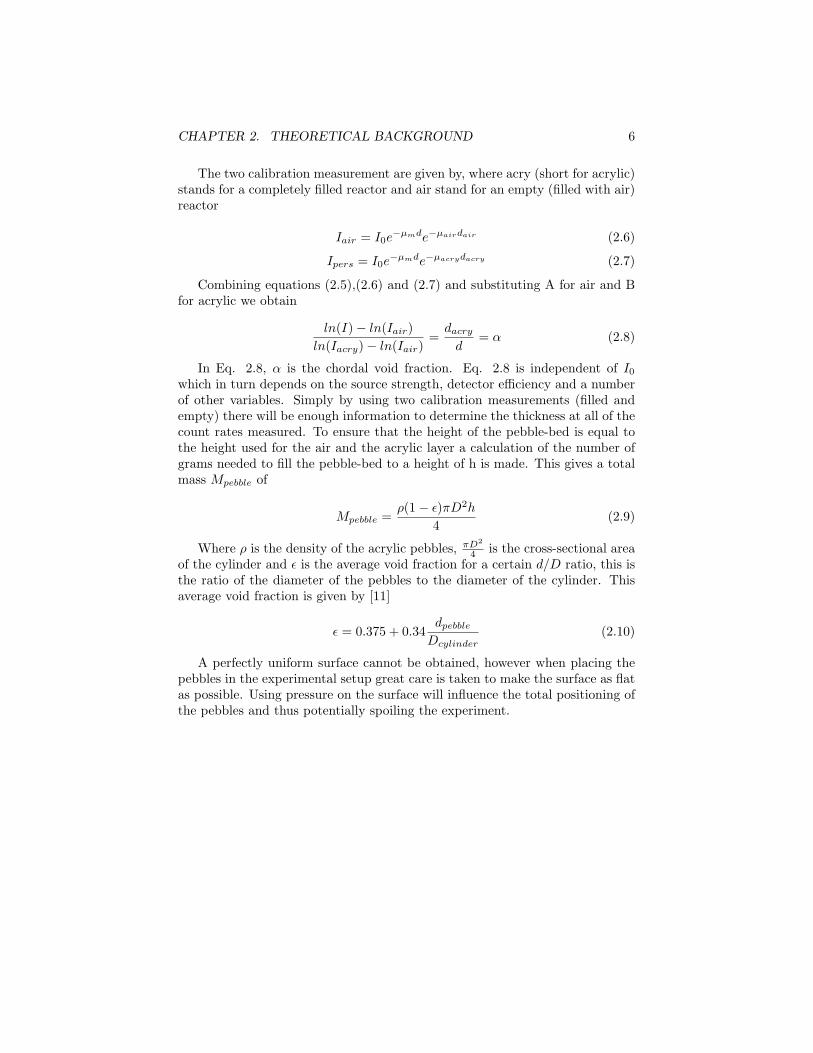
Using a strong source will allow us to reduce the measurement time, increasethe accuracy of the data and decrease the width of the collimator giving us afiner grid of measurement points. The source used in this experiment is anAm-241 source which had an activity of 11,1 GBq on 01-01-1968 with a half-lifeof 432,6 year. The Am-241 source has an intensity distribution shown in figure3.1.
Figure 3.1: The intensity distribution of the Am-241 source
CHAPTER 3. ”PEBBLE-BED EXPERIMENT” 9
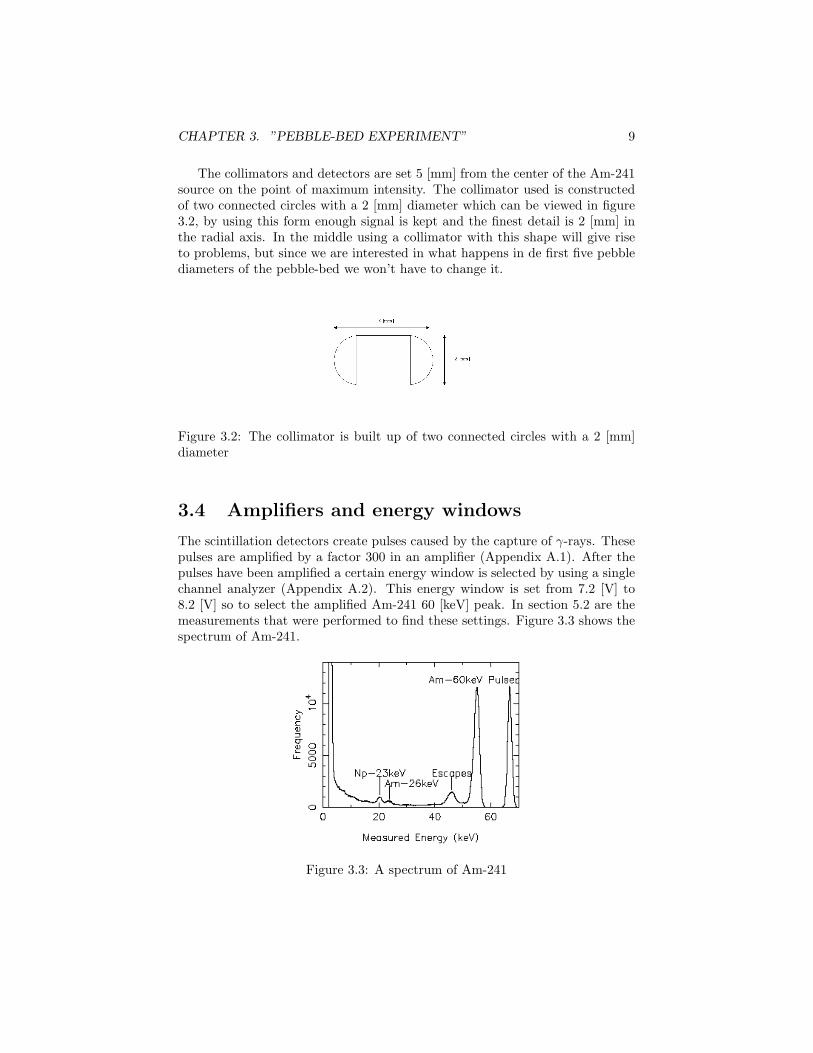
The collimators and detectors are set 5 [mm] from the center of the Am-241source on the point of maximum intensity. The collimator used is constructedof two connected circles with a 2 [mm] diameter which can be viewed in figure3.2, by using this form enough signal is kept and the finest detail is 2 [mm] inthe radial axis. In the middle using a collimator with this shape will give riseto problems, but since we are interested in what happens in de first five pebblediameters of the pebble-bed we won’t have to change it.
Figure 3.2: The collimator is built up of two connected circles with a 2 [mm]diameter
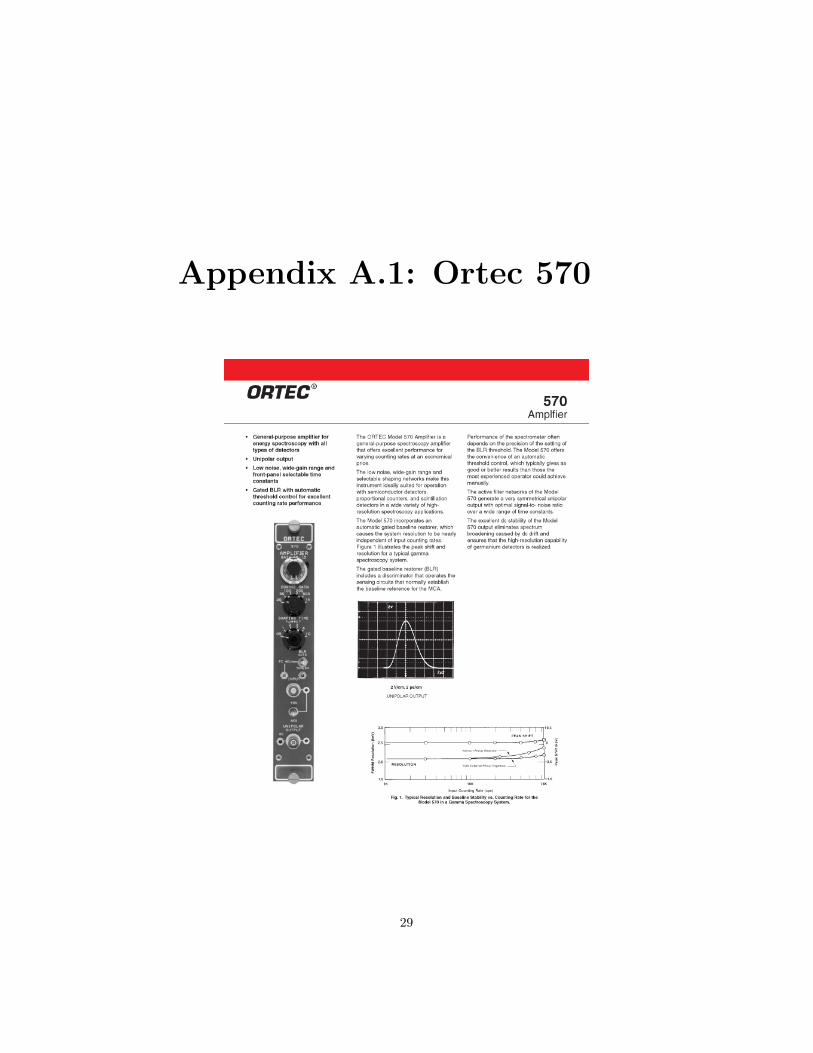
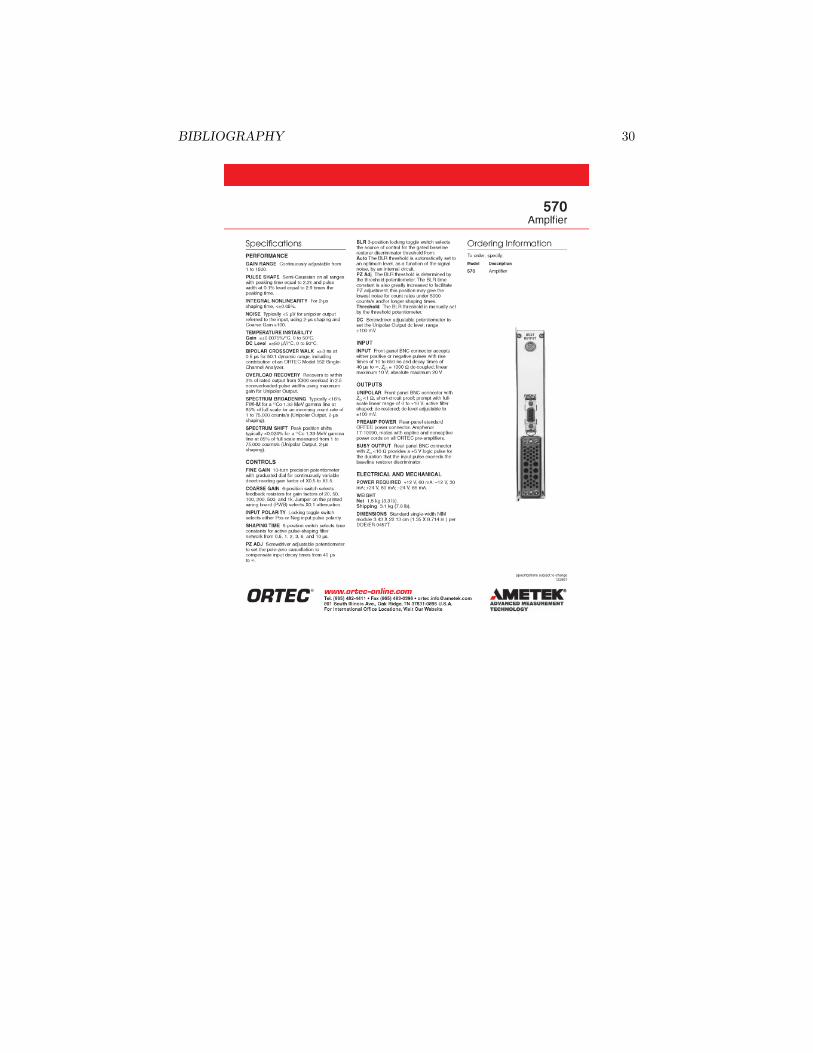
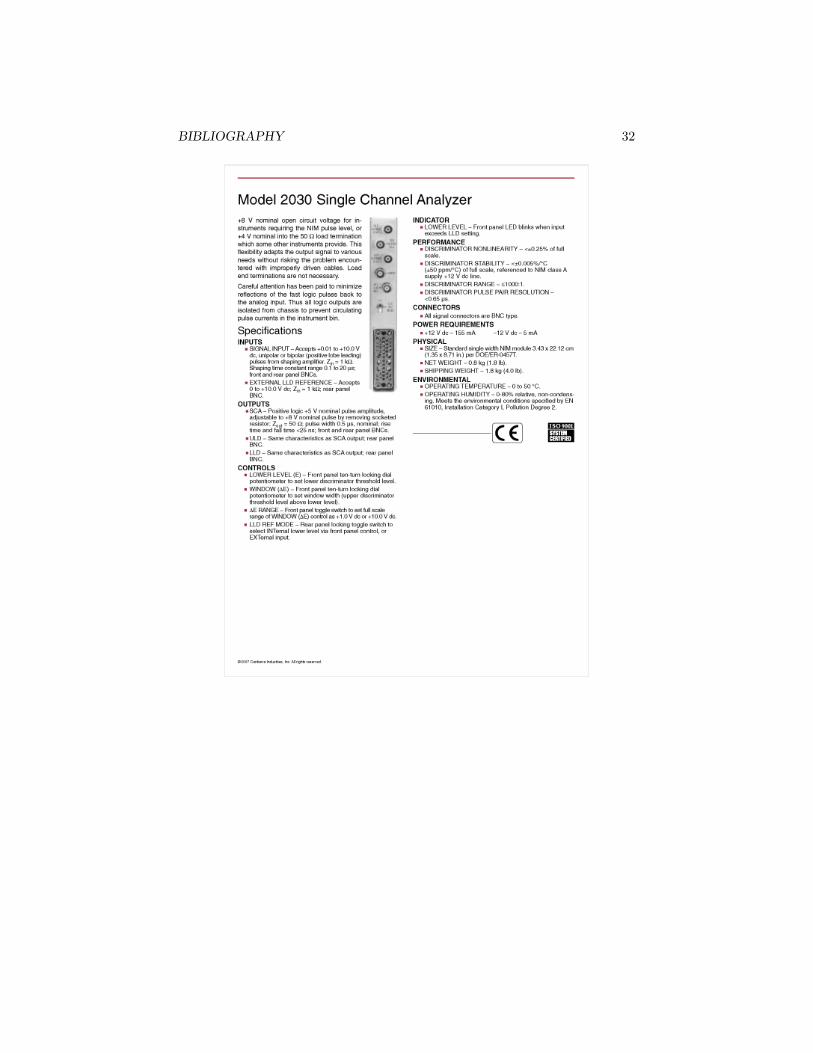
3.4 Amplifiers and energy windows
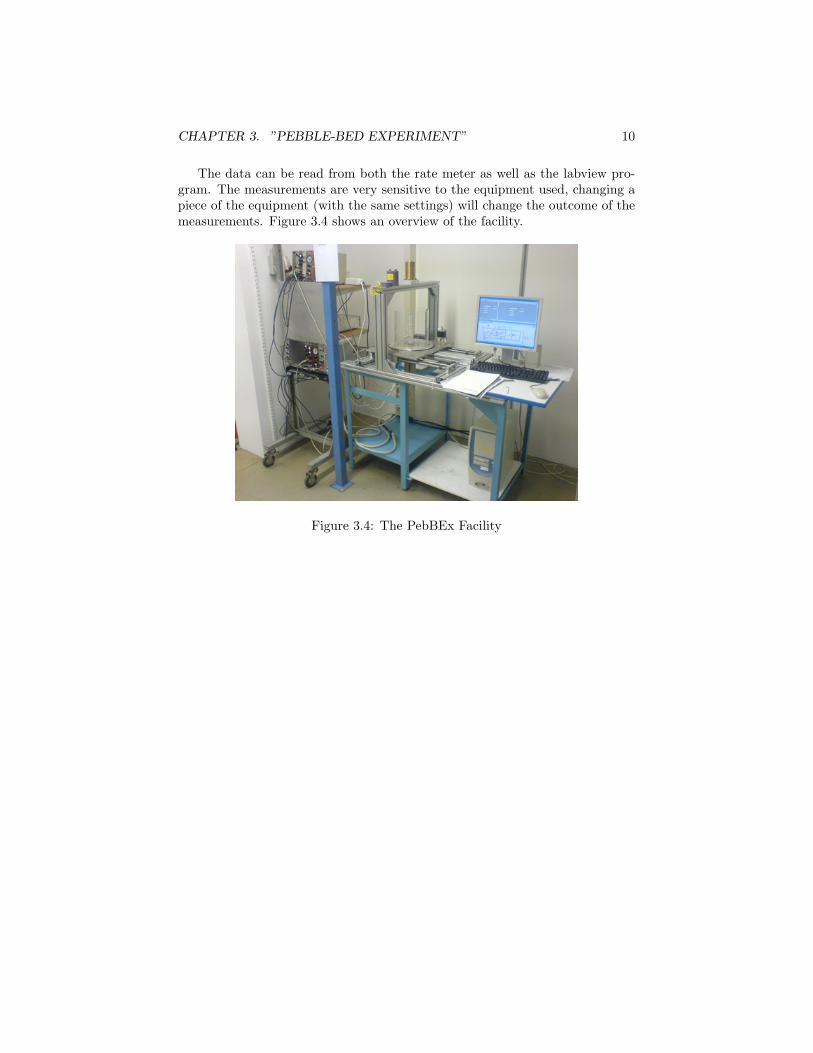
The scintillation detectors create pulses caused by the capture of γ-rays. Thesepulses are amplified by a factor 300 in an amplifier (Appendix A.1). After thepulses have been amplified a certain energy window is selected by using a singlechannel analyzer (Appendix A.2). This energy window is set from 7.2 [V] to8.2 [V] so to select the amplified Am-241 60 [keV] peak. In section 5.2 are themeasurements that were performed to find these settings. Figure 3.3 shows thespectrum of Am-241.
Figure 3.3: A spectrum of Am-241
CHAPTER 3. ”PEBBLE-BED EXPERIMENT” 10
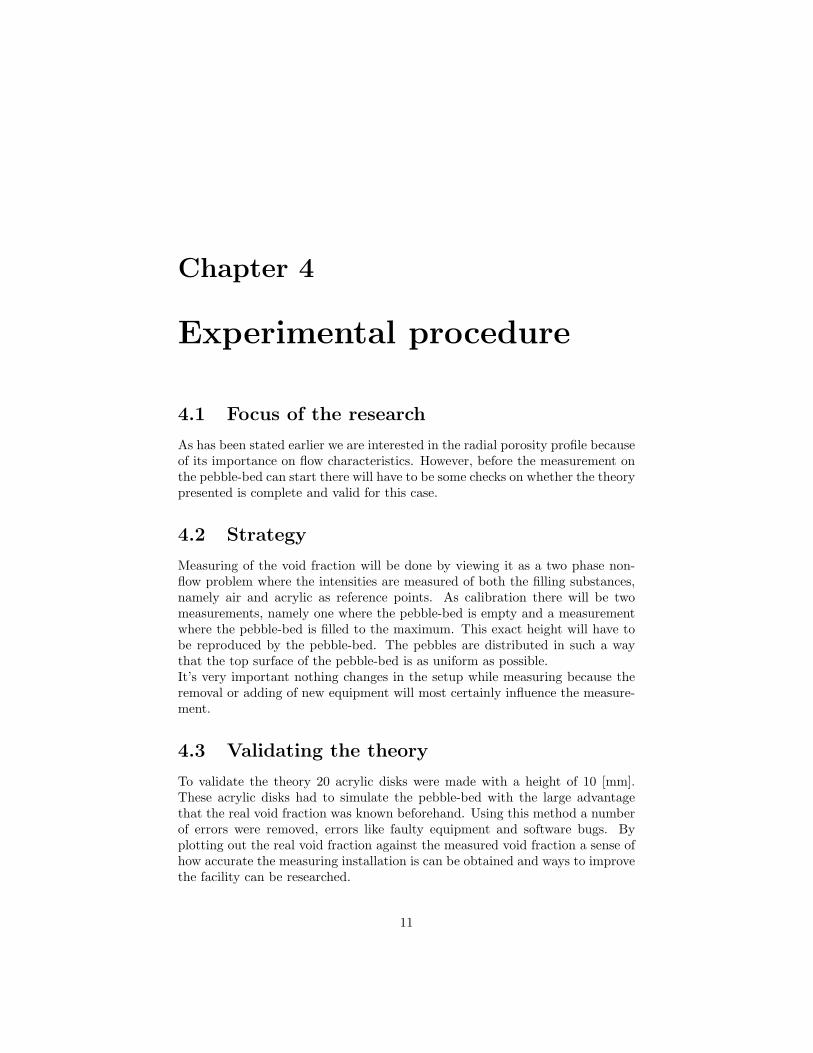
The data can be read from both the rate meter as well as the labview pro-gram. The measurements are very sensitive to the equipment used, changing apiece of the equipment (with the same settings) will change the outcome of themeasurements. Figure 3.4 shows an overview of the facility.
Figure 3.4: The PebBEx Facility
Chapter 4
Experimental procedure
4.1 Focus of the research
As has been stated earlier we are interested in the radial porosity profile becauseof its importance on flow characteristics. However, before the measurement onthe pebble-bed can start there will have to be some checks on whether the theorypresented is complete and valid for this case.
4.2 Strategy
Measuring of the void fraction will be done by viewing it as a two phase non-flow problem where the intensities are measured of both the filling substances,namely air and acrylic as reference points. As calibration there will be twomeasurements, namely one where the pebble-bed is empty and a measurementwhere the pebble-bed is filled to the maximum. This exact height will have tobe reproduced by the pebble-bed. The pebbles are distributed in such a waythat the top surface of the pebble-bed is as uniform as possible.It’s very important nothing changes in the setup while measuring because theremoval or adding of new equipment will most certainly influence the measure-ment.
4.3 Validating the theory
To validate the theory 20 acrylic disks were made with a height of 10 [mm].These acrylic disks had to simulate the pebble-bed with the large advantagethat the real void fraction was known beforehand. Using this method a numberof errors were removed, errors like faulty equipment and software bugs. Byplotting out the real void fraction against the measured void fraction a sense ofhow accurate the measuring installation is can be obtained and ways to improvethe facility can be researched.
11
CHAPTER 4. EXPERIMENTAL PROCEDURE 12
4.4 Source angle
One of the early problems was the fact that the source had to be remountedeach time a new measurement was to be made. In this mounting of the sourcethere was quite a bit of space to put the source. After measurements it becameclear that the source strength was dependent on the angle and position of thesource. The obvious solution would be to make sure the source stayed at thesame location during all measurements. Since not removing the source was notan option due to the refilling of the reactor the source mount was marked so thatthe placing of the source would not influence the end result, this measurementwill be visible in section 5.1.
4.5 Detector management
At the start of the PebBEx facility there were two detectors used. The ideawas that while using two detectors, twice as much data could be obtained whilekeeping a small resolution. Gathering the same amount of data with one de-tector would mean an increase in resolution. However a choice had to be madewhether to give one detector high amount of signal, by turning the source in theappropriate angle or to give both detectors less signal. The measurement timeof a full scan is what is important while measuring, so one detector with a lotof signal was more beneficial then two with a lower signal. The two detectorsdidn’t behave in the exact same way and it wouldn’t be possible to add theinformation given by both detectors, the information would have to be split.Finally the reason for using only one detector came from the way the labviewprogram and facility was build. It is not possible to measure two detectorsapart from each other with the amount of equipment available meaning thatthe slowest detector would set the pace of the measurement.
4.6 The pebble-bed
In the theory there are two calibration points namely a filled bed and an emptyone. Creating a certain height h with the acrylic cylinders is no problem. How-ever recreating this exact height with the pebble-bed is impossible due to thefact that the pebble-bed surface layer will never be flat. Techniques could beused to flatten the surface but this would have an effect on the pebble-bed pack-ing and potentially mess up the measurements.As has been shown by Kose [13] earthquakes can have an impact on the packingfraction of a pebble-bed. This introduces another problem, since an earthquakehas such an influence on the pebble-bed we should also be careful as to howwe fill the pebble-bed in the first place. Reactors are filled with pebbles one byone and this strategy is partly adopted for filling the PebBEx facility. The first95% of the pebbles where placed in roughly at the same time and the last 5%where done one by one by hand. This way a (by approximation) flat surfacewas created.

CHAPTER 4. EXPERIMENTAL PROCEDURE 13
4.7 Temperature measurements
Since temperature effects can have an influence on the equipment used in thesetup, namely the amplifier and energy window, measurements were made todiscover the influence of the temperature on the overall system. This is done byadding a thermocouple to the installation and letting labview read the thermo-couple measurements.
Chapter 5
Results
5.1 Rotation of the Am-241 source
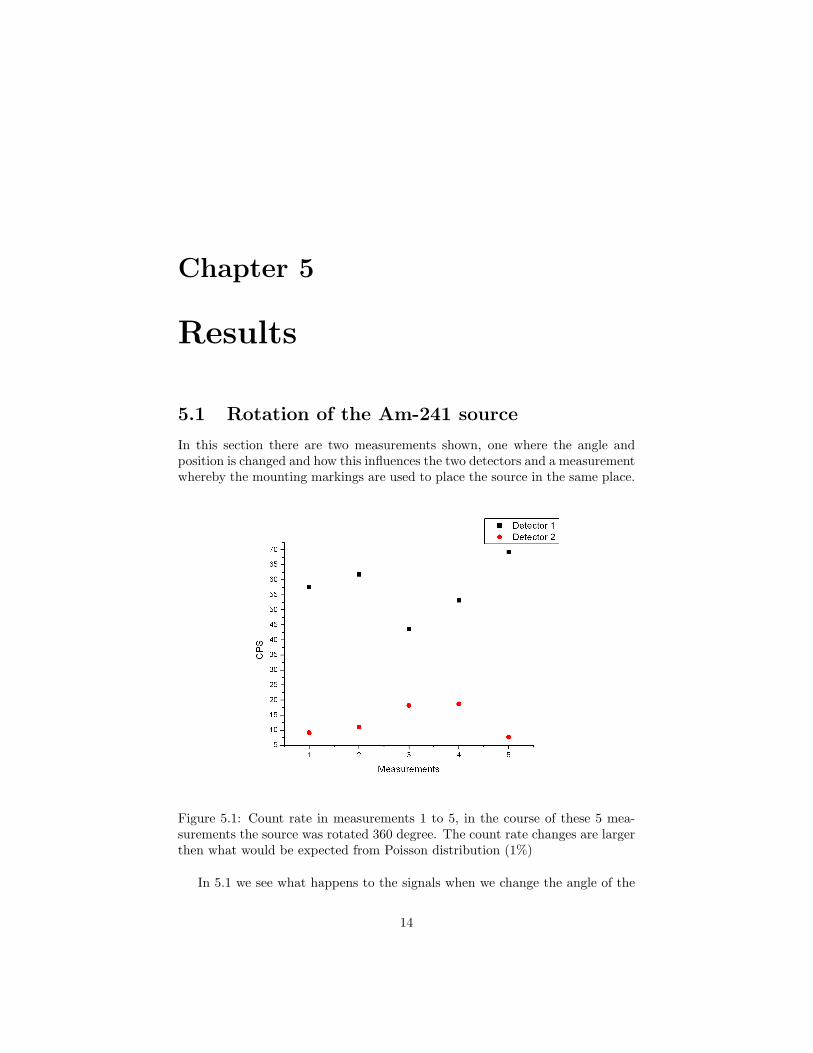
In this section there are two measurements shown, one where the angle andposition is changed and how this influences the two detectors and a measurementwhereby the mounting markings are used to place the source in the same place.
Figure 5.1: Count rate in measurements 1 to 5, in the course of these 5 mea-surements the source was rotated 360 degree. The count rate changes are largerthen what would be expected from Poisson distribution (1%)
In 5.1 we see what happens to the signals when we change the angle of the
14
CHAPTER 5. RESULTS 15
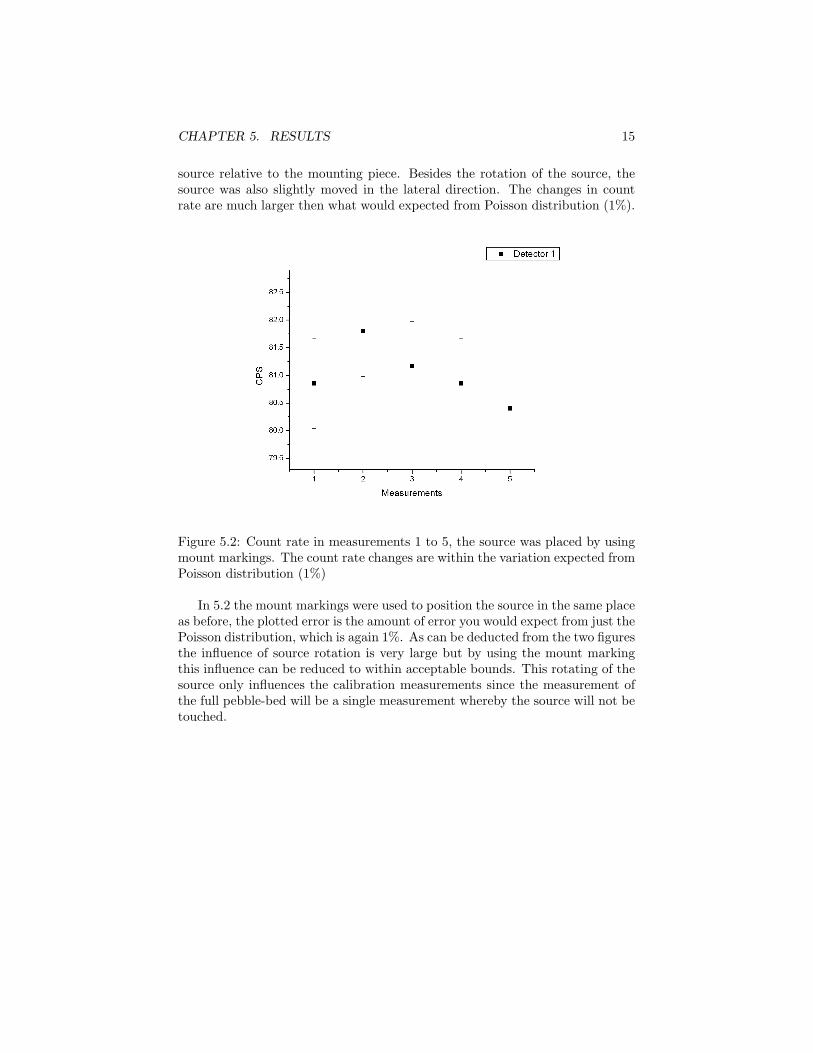
source relative to the mounting piece. Besides the rotation of the source, thesource was also slightly moved in the lateral direction. The changes in countrate are much larger then what would expected from Poisson distribution (1%).
Figure 5.2: Count rate in measurements 1 to 5, the source was placed by usingmount markings. The count rate changes are within the variation expected fromPoisson distribution (1%)
In 5.2 the mount markings were used to position the source in the same placeas before, the plotted error is the amount of error you would expect from just thePoisson distribution, which is again 1%. As can be deducted from the two figuresthe influence of source rotation is very large but by using the mount markingthis influence can be reduced to within acceptable bounds. This rotating of thesource only influences the calibration measurements since the measurement ofthe full pebble-bed will be a single measurement whereby the source will not betouched.
CHAPTER 5. RESULTS 16
5.2 Amplification and energy window settings
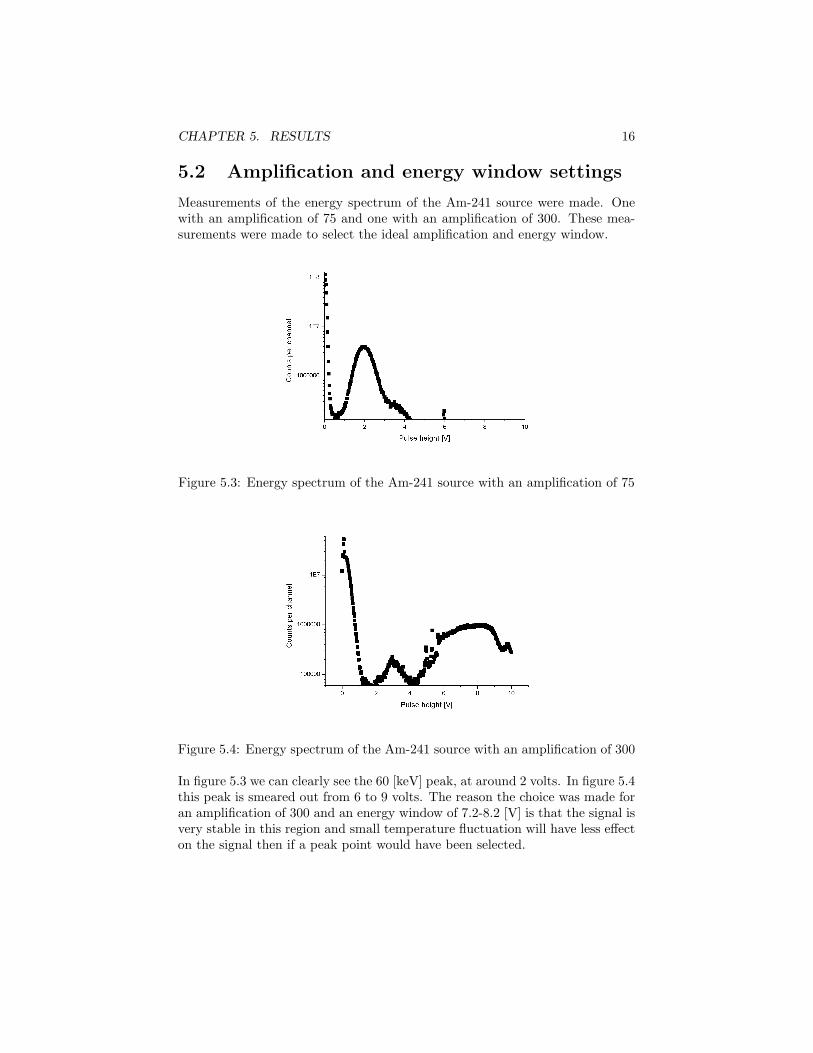
Measurements of the energy spectrum of the Am-241 source were made. Onewith an amplification of 75 and one with an amplification of 300. These mea-surements were made to select the ideal amplification and energy window.
Figure 5.3: Energy spectrum of the Am-241 source with an amplification of 75
Figure 5.4: Energy spectrum of the Am-241 source with an amplification of 300
In figure 5.3 we can clearly see the 60 [keV] peak, at around 2 volts. In figure 5.4this peak is smeared out from 6 to 9 volts. The reason the choice was made foran amplification of 300 and an energy window of 7.2-8.2 [V] is that the signal isvery stable in this region and small temperature fluctuation will have less effecton the signal then if a peak point would have been selected.
CHAPTER 5. RESULTS 17
5.3 Calibration measurements
Calibration measurements were preformed to validate our measuring setup.
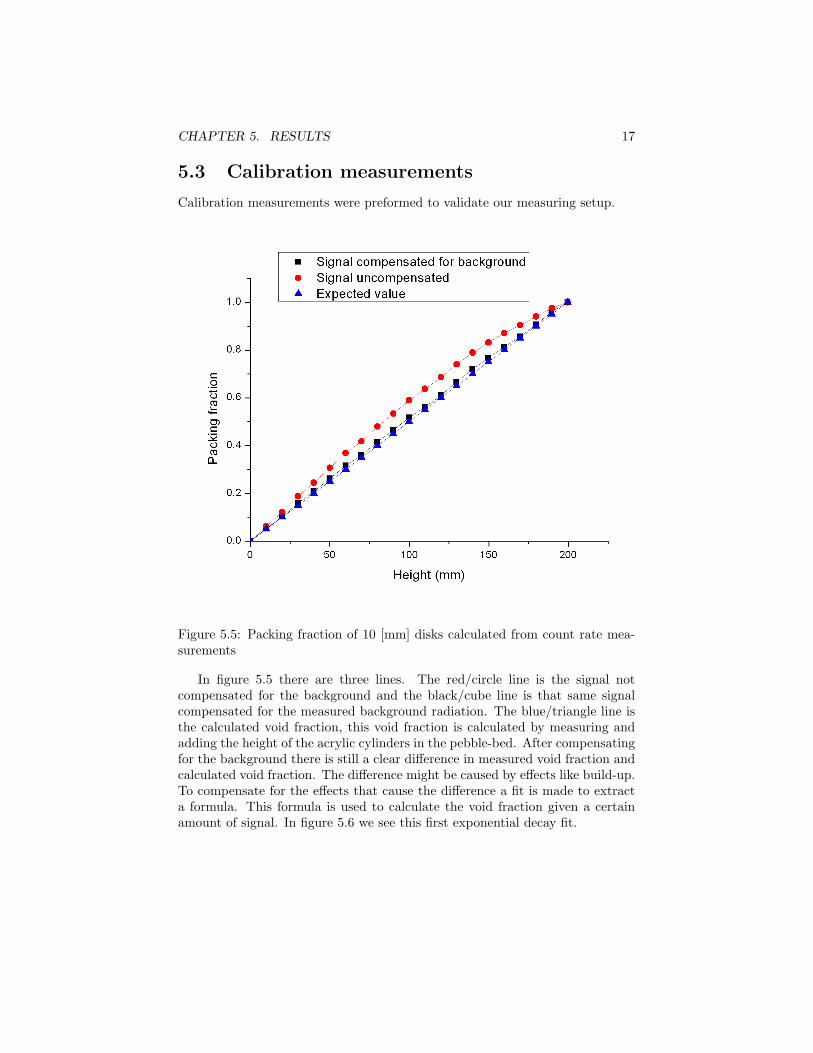
Figure 5.5: Packing fraction of 10 [mm] disks calculated from count rate mea-surements
In figure 5.5 there are three lines. The red/circle line is the signal notcompensated for the background and the black/cube line is that same signalcompensated for the measured background radiation. The blue/triangle line isthe calculated void fraction, this void fraction is calculated by measuring andadding the height of the acrylic cylinders in the pebble-bed. After compensatingfor the background there is still a clear difference in measured void fraction andcalculated void fraction. The difference might be caused by effects like build-up.To compensate for the effects that cause the difference a fit is made to extracta formula. This formula is used to calculate the void fraction given a certainamount of signal. In figure 5.6 we see this first exponential decay fit.
CHAPTER 5. RESULTS 18
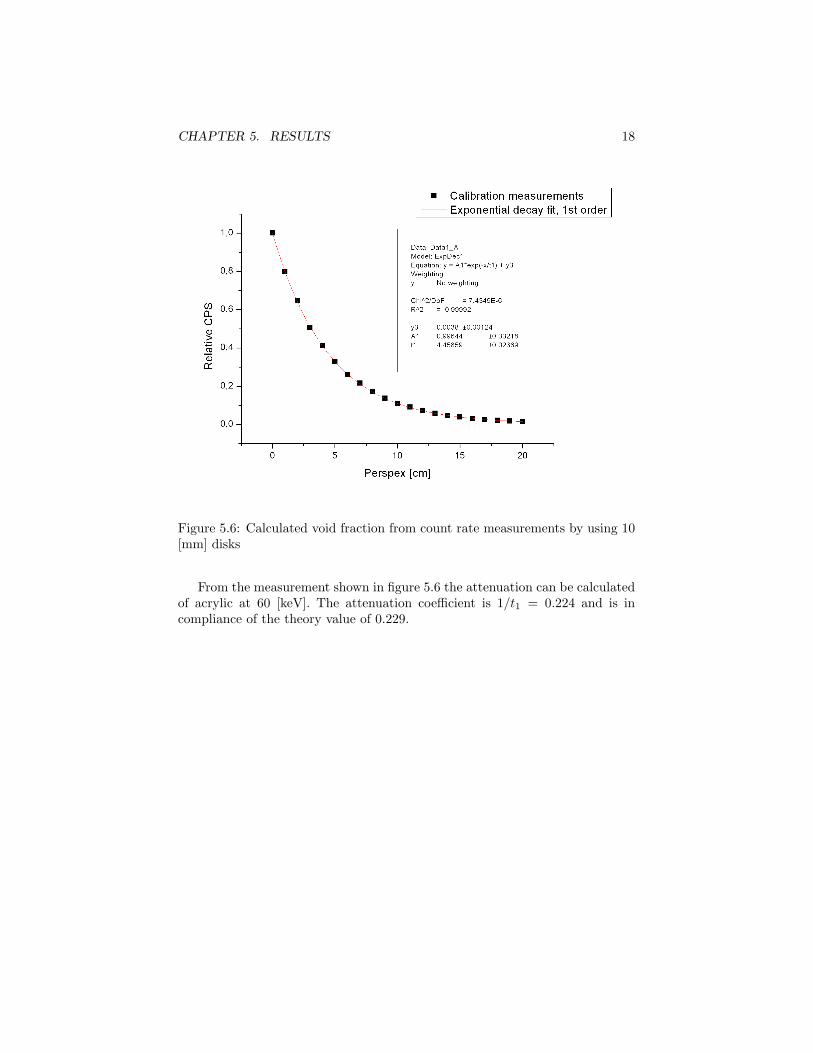
Figure 5.6: Calculated void fraction from count rate measurements by using 10[mm] disks
From the measurement shown in figure 5.6 the attenuation can be calculatedof acrylic at 60 [keV]. The attenuation coefficient is 1/t1 = 0.224 and is incompliance of the theory value of 0.229.
CHAPTER 5. RESULTS 19
5.4 Temperature measurements
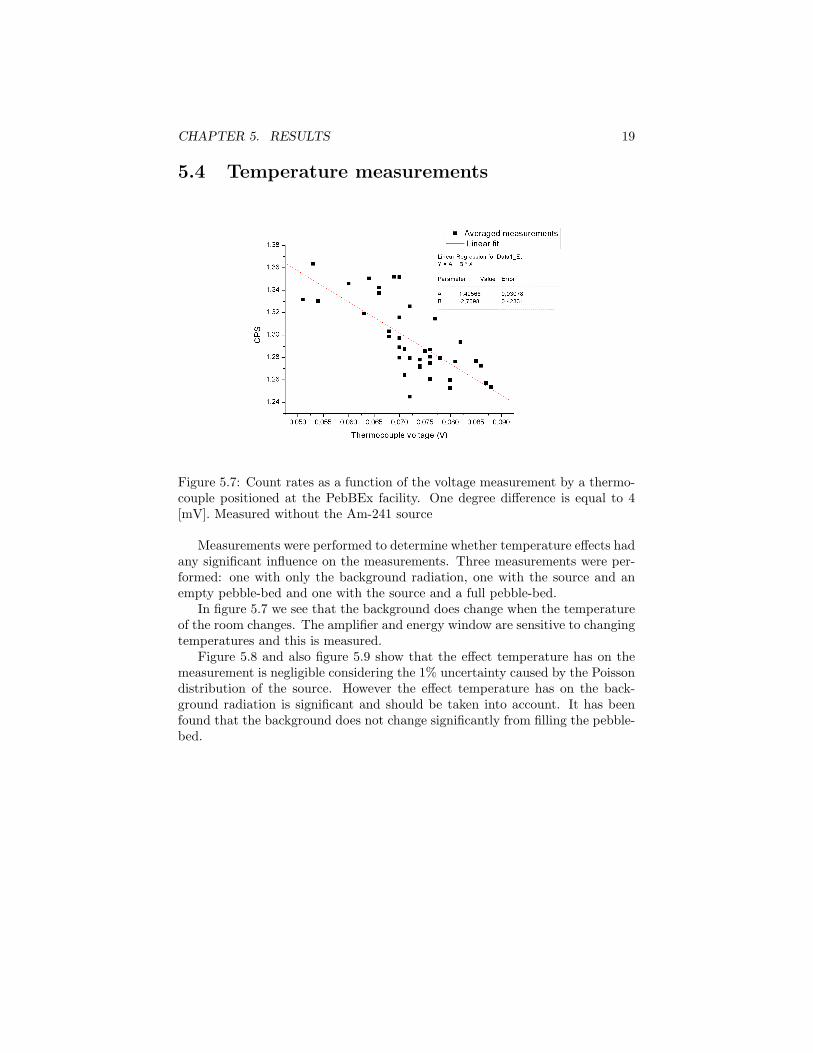
Figure 5.7: Count rates as a function of the voltage measurement by a thermo-couple positioned at the PebBEx facility. One degree difference is equal to 4[mV]. Measured without the Am-241 source
Measurements were performed to determine whether temperature effects hadany significant influence on the measurements. Three measurements were per-formed: one with only the background radiation, one with the source and anempty pebble-bed and one with the source and a full pebble-bed.
In figure 5.7 we see that the background does change when the temperatureof the room changes. The amplifier and energy window are sensitive to changingtemperatures and this is measured.
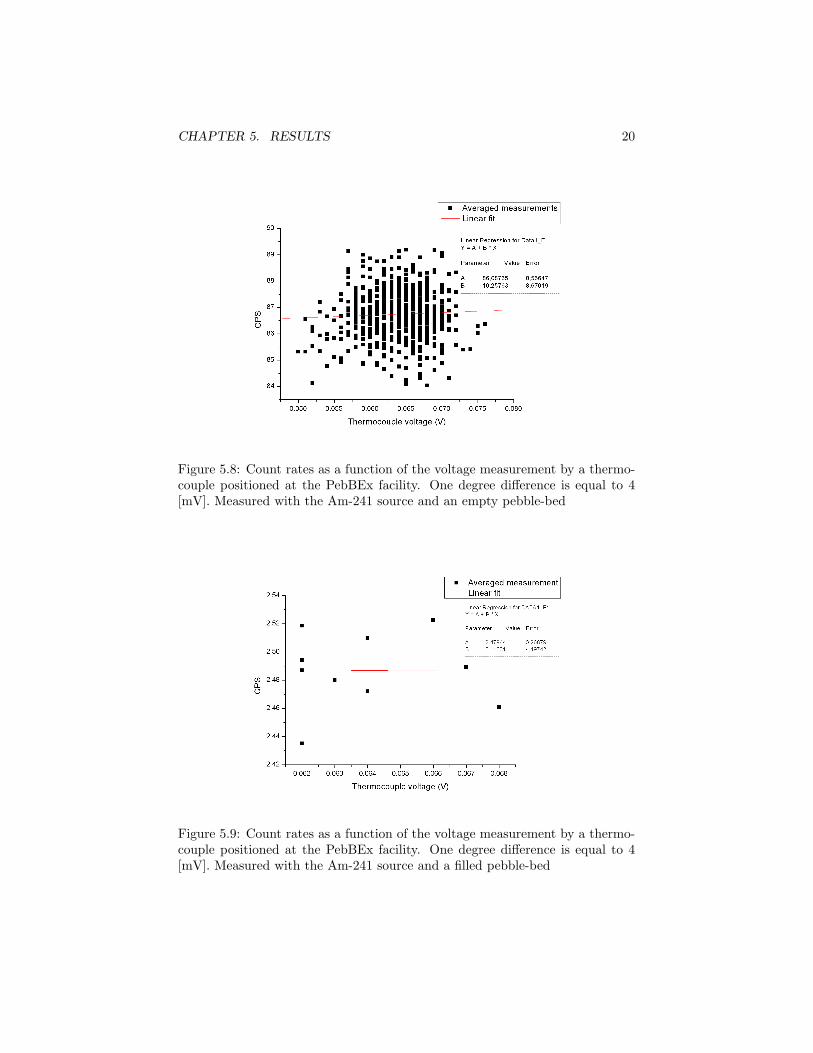
Figure 5.8 and also figure 5.9 show that the effect temperature has on themeasurement is negligible considering the 1% uncertainty caused by the Poissondistribution of the source. However the effect temperature has on the back-ground radiation is significant and should be taken into account. It has beenfound that the background does not change significantly from filling the pebble-bed.
CHAPTER 5. RESULTS 20
Figure 5.8: Count rates as a function of the voltage measurement by a thermo-couple positioned at the PebBEx facility. One degree difference is equal to 4[mV]. Measured with the Am-241 source and an empty pebble-bed
Figure 5.9: Count rates as a function of the voltage measurement by a thermo-couple positioned at the PebBEx facility. One degree difference is equal to 4[mV]. Measured with the Am-241 source and a filled pebble-bed
CHAPTER 5. RESULTS 21
5.5 Radial porosity profile
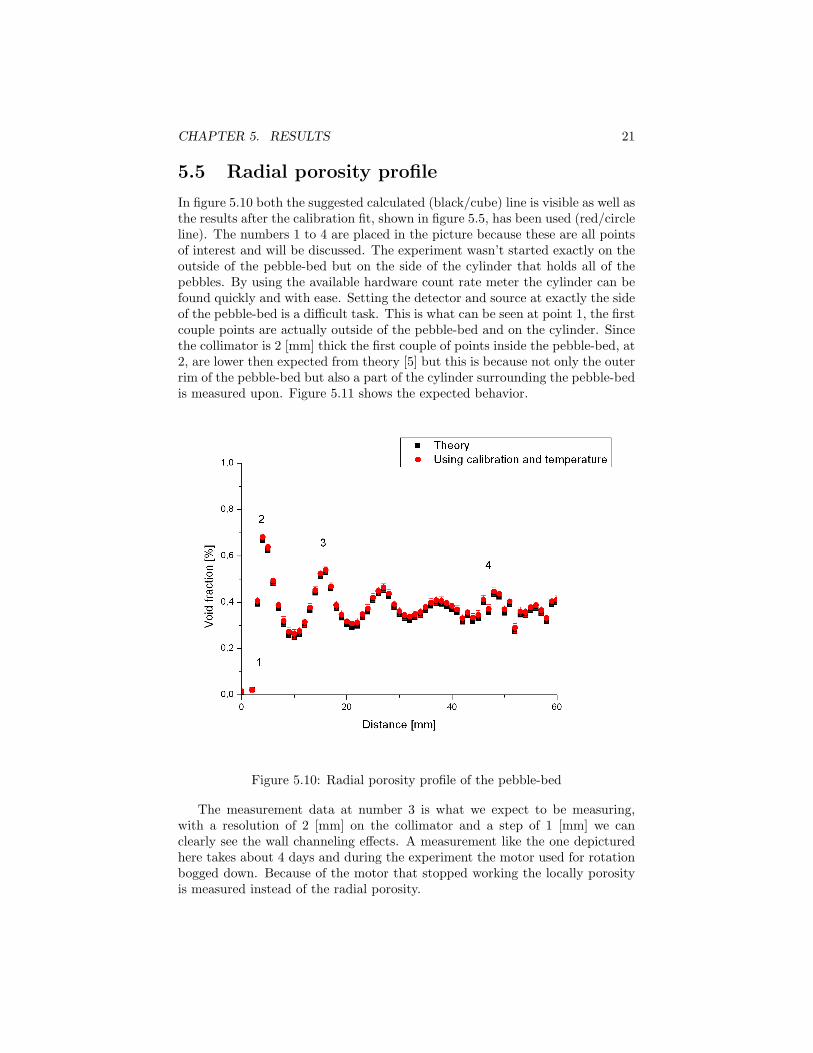
In figure 5.10 both the suggested calculated (black/cube) line is visible as well asthe results after the calibration fit, shown in figure 5.5, has been used (red/circleline). The numbers 1 to 4 are placed in the picture because these are all pointsof interest and will be discussed. The experiment wasn’t started exactly on theoutside of the pebble-bed but on the side of the cylinder that holds all of thepebbles. By using the available hardware count rate meter the cylinder can befound quickly and with ease. Setting the detector and source at exactly the sideof the pebble-bed is a difficult task. This is what can be seen at point 1, the firstcouple points are actually outside of the pebble-bed and on the cylinder. Sincethe collimator is 2 [mm] thick the first couple of points inside the pebble-bed, at2, are lower then expected from theory [5] but this is because not only the outerrim of the pebble-bed but also a part of the cylinder surrounding the pebble-bedis measured upon. Figure 5.11 shows the expected behavior.
Figure 5.10: Radial porosity profile of the pebble-bed
The measurement data at number 3 is what we expect to be measuring,with a resolution of 2 [mm] on the collimator and a step of 1 [mm] we canclearly see the wall channeling effects. A measurement like the one depicturedhere takes about 4 days and during the experiment the motor used for rotationbogged down. Because of the motor that stopped working the locally porosityis measured instead of the radial porosity.
CHAPTER 5. RESULTS 22
This is what we see happening at point 4. The experiment was done witha total of 4580 +/- 5 pebbles. One of the concluding remarks from du Toit[9]was that locally the porosity could change significantly from the average value,so this is in confirmation with the measurement. The uncertainties in figure5.10 are from the Poisson distribution of the signal, calibration and tempera-ture measurements, these uncertainties vary from 2% to 6%. The uncertaintyis the pebble-bed height (as well as averaging over it) was not taken into account.
Figure 5.11: Composite data for uni-sized sphere’s [5]

Chapter 6
Conclusions
6.1 Conclusions
The gamma-ray tomography experiment that was used has proven useful in de-termining the radial density profile of a packed bed. The results are accurateand the characteristics of wall channeling are clearly visible. In 4 days time acomplete profile of the pebble-bed with a diameter is 229 [mm] +/- 0.5 [mm]could be obtained with steps of 1 [mm]. The collimator, and thus resolution,has a width of 2 [mm] in lateral direction. The measurement was performedby using the γ’s from the 60 [keV] peak of an Am-241 source. It was foundthat temperature has a significant influence of the background radiation and anegligible influence on the measurements with the Am-241 source. The plac-ing of the source in the mounting piece must be done consistently in the sameway, variations of up to 50% can occur if this is not controlled. However byusing marking the variation becomes negligible. The attenuation of PMMA at60 [keV] measured with the PebBEx facility is 0.224 and in good complianceof the theoretical value of 0.229. There were a couple of problems with themeasurement method used. First it’s not possible to create a flat surface onthe pebble-bed which is required by the theory. The collimator used is stillquite large (2 [mm]) meaning that at the place where the wall channeling isat its strongest point the measurement data is not accurate. Having a smallercollimator will increase the resolution of the measurement but increase the mea-surement time for the same amount of uncertainty. Since everything is averagedover the 2 [mm] of the collimator the observed peaks and valleys are likely moreextreme. The local fluctuation in porosity profile will become more and moreof an issue when center measurement are being made, however this is solvableby using smaller pebbles or a large pebble-bed reactor cylinder.
23
CHAPTER 6. CONCLUSIONS 24
6.2 Recommendations
The section recommendations will be split up in two subsection namely onesubsection that addresses changes on the PebBEx facility that would be benefi-cial to any type of measurement. The other subsection will consist of topics forfollow-up research.
6.2.1 Recommended changes
Mounting of the source The mounting of the source is very important tothe amount of signal received. Building a better mounting device so that thesource will be easy to place at the same location would be very beneficial tothe measurement. The placing is doable without any extra help (using themarkings) but it is probably easier and better to build a new mounting device.
Rotational motor When the pebble-bed is loaded it weights over five kilo-grams making it hard on the motor in place to turn the around. When starting apebble-bed measurement the cylinder bogs down and further measurements areruined because of the high local difference in void fraction. Changing the motorbelt so that the experiment doesn’t stop turning would be highly recommended.
The adding of an additional card As has been stated earlier currently itis not possible to let the rotation motor stop when enough signal is received.They way it is handled now is that beforehand the maximum amount of timeneeded to measure the required amount of signal is given as input to how longthe motor should be rotating. This to make sure the motor is always rotatingwhen the facility is measuring. This could be solved by changing the labviewcode and letting the rotation motor run continuously on a second interface card.Changing this can reduce the total measurement time for 60% of the currentneeded time for a measurement.
Influence of temperature effects Since the background radiation is clearlyinfluenced by temperature it is recommended to keep the thermocouple instal-lation to measure the temperature during each measurement and correct thebackground for the temperature.
Collimators Using a smaller collimator will improve the resolution of thevoid fraction measurement. If the time allows for it, using a smaller collima-tor can improve the resolution and create more interesting results. If quickermeasurements need to be made larger collimators can be used.
6.2.2 Follow-up research
Mixing different types of pebbles Using different types of pebbles willinfluence the wall channeling and it will be quite interesting to see how the wall
CHAPTER 6. CONCLUSIONS 25
channeling effects change when smaller pebbles are added. This might also bea way the porosity ’problem’ caused by wall channeling can be solved.
Variance of the pebble-bed Research can be done on how different ap-proaches to filling the pebble-bed influence the pebble stacking. Seeing if andhow wall channeling changes when the packed bed is filled in a different waymight be interesting to see. Moreover, research could also be done on the vari-ance of the pebble-bed after each filling, finding out what kind of variance canbe expected when filling the pebble-bed.
Earthquakes Earthquakes are said to have quite some impact on the pebble-bed reactors, in the PebBEx facility earthquakes could potentially be simulatedby using the two step motors or at least shake the pebble-bed severely. Discov-ering how this influence packed beds would be interesting.
Different forms With the setup at hand porosity measurements could bedone on a number of different shapes and forms. Wall effects of different shapescould be measured. Another possibility would be to simulate control rods orbuilding an annular reactor.
Pressurizing the pebble-bed The effects of trying to flatten the surface ofthe pebble-bed could be researched, the fears that were expressed in this reportabout pressurizing the packed bed could be confirmed or found unjustified.
Acknowledgements
I would like to thank the Multi Scale Physics department for supplying thescintillation detectors and acrylic cylinder for the PebBEx facility.
26
Bibliography
[1] De Pers: Ministers eensgezind over kernenergie (2008), www.depers.nl
[2] Generation-IV international forum : Very-High-Temperature Reactor,www.gen-4.org (2007).
[3] Bos e.a.: Inleiding to de stralingshygiene (2000)
[4] C.G. du Toit: The pebble-bed reactor: effect of wall channeling on the flowin the core, Kruger Park, South Africa (2002).
[5] J.S. Goodling, R.I. Vachon, W.S Stelpflug, S.J. Ying: Radial porosity dis-tribution in cylindrical beds with packed spheres, Powder Technology, Vol.35, pp. 23-29 (1983).
[6] D.M. White, C.L. Tien du ToiT: Analysis of flow channeling near the wallin packed beds, Warme- und Stoffubertragung, Vol. 21, pp. 291-296 (1987).
[7] D. Bedenig: Experimentelle Untersuchungen in Stromungsverhalten einesKugelhaufens im Hinblick auf den Brennelementkreislauf im Core einesKugelhaufenreactor, Institut fur Reaktorentwickelung Kearnforschungsan-lage, Julich, Germany (1966).
[8] Y. Cohen, A.B. Metzner: Wall effects in laminar flow of fluids throughpacked beds, AIChE Journal 27, 705-714 (1981).
[9] C.G. du Toit: The numerical determination of the variation in the porosityof the pebble-bed core, Potchefstroom University for CHE, South Africa(2002).
[10] H.V. Kok, T.H.J.J. van der Hagen, R.F. Mudde : Subchannel void-fractionmeasurements in a 6x6 rod bundle using simple gamma-transmissionmethod.
[11] K. Kugeler, R. Schulten: Hochtemperaturreaktortechnik, Springer-Verlag,Berlin, Heidelberg (1989).
[12] Zongxin Wu, Dengcai Lin and Daxin Zhong : The design features of theHTR-10 (2002).
27

BIBLIOGRAPHY 28
[13] Kose Serhat, Kilic Ihsan: Analysis of reactivity induced accidents for HTR-10, Turkisch atomic energy authority, Turkey (2004).
Appendix A.1: Ortec 570
29
BIBLIOGRAPHY 30

Appendix A.2: SCA 2030
31
BIBLIOGRAPHY 32
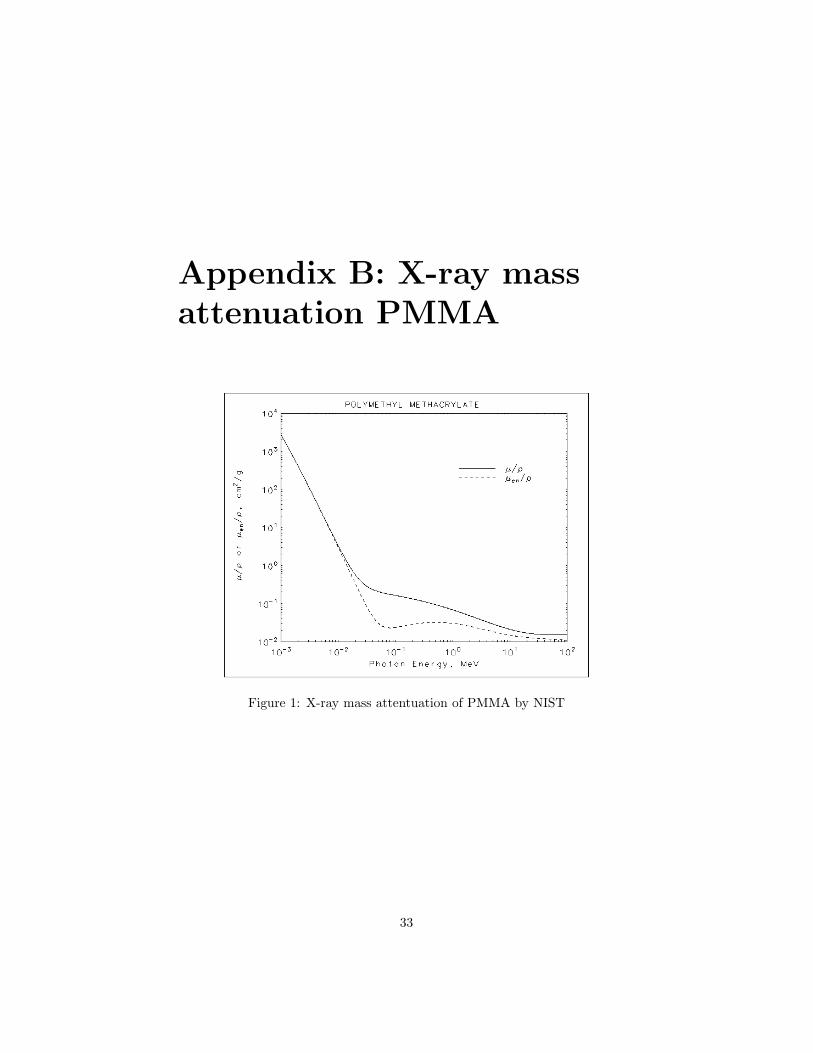
Appendix B: X-ray massattenuation PMMA
Figure 1: X-ray mass attentuation of PMMA by NIST
33