radiation induced corrosion of copper - diva-portal.se862125/fulltext01.pdf · in this study gamma...
TRANSCRIPT

Radiation induced
corrosion of copper
Åsa Björkbacka
KTH Royal Institute of Technology
School of Chemical Science and Engineering
Department of Chemistry
Applied Physical Chemistry
SE-100 44 Stockholm, Sweden

Copyright © Åsa Björkbacka, 2015. All rights reserved. No parts of this
thesis may be reproduced without permission from the author.
The following are reprinted with permission:
Paper I © Electrochemical Society, Inc. 2012. All rights reserved. Except
as provided under U.S. copyright law, this work may not be reproduced,
resold, distributed, or modified without the express permission of The
Electrochemical Society (ECS). The archival version of this work was
published in Electrochemical and Solid-State Letters, 2012, 15, C5-C7.
Paper II © 2013 Elsevier B.V.
Paper III © The Royal Society of Chemistry 2015
TRITA-CHE Report 2015:57
ISSN 1654-1081
ISBN 978-91-7595-710-4
Akademisk avhandling som med tillstånd av KTH i Stockholm framlägges
till offentlig granskning för avläggande av teknologie doktorsexamen
onsdagen den 18 november 2015 klockan 10.00 i Kollegiesalen, KTH,
Brinellvägen 8, Stockholm, Sverige. Avhandlingen försvaras på engelska.
Fakultetsopponent: Prof. Mehran Mostafavi, Université Paris-Sud, Orsay
Cedex, Frankrike.

“Success is going from failure to failure
without losing your enthusiasm”
Winston Churchill


i
Abstract
The process of radiation induced corrosion of copper is not well
understood. The most obvious situation where the knowledge of
this process is crucial is in a deep repository for high level spent
nuclear fuel where the fuel will be sealed inside copper canisters.
The radiation will penetrate the canisters and be absorbed by the
surrounding environment. In this study gamma irradiations of
polished and pre-oxidized copper cubes in anoxic pure water, air of
60-100 % RH and in humid argon were performed. The copper
surfaces were examined using IRAS, XPS, cathodic reduction,
SEM, AFM, and Raman spectroscopy. The concentration of copper
in the reaction solutions was measured using ICP-OES. Also the
formation of oxidative species caused by radiation absorption of
water was studied by numerical simulations using MAKSIMA
software. The corrosion of copper during gamma irradiation vastly
exceeds what is expected. The production of oxidative species
caused by radiation absorption of water is hundreds of times too
low to explain the amount of oxidized copper. A possible
explanation for this mismatch is an enhanced radiation chemical
yield of HO· on the copper surface. Another explanation is an
increased surface area due to oxidation of copper. One speculation
is that HO· interacting with the copper oxide can cause oxidation
of the metal. If the thermodynamic driving force is large enough
then electrons can be conducted from the metal through the oxide
to the oxidant. A dramatic increase in surface area together with an
increased interfacial yield of HO· might explain the radiation
enhanced corrosion process.

ii
Sammanfattning
Strålningsinducerad korrosion av koppar är en process somännu
inte är väl utredd. Ett exempel där förståelsen för den här
processen är av största vikt, är i ett framtida geologiskt djupförvar
av använt högaktivt kärnbränsle där det radiokativa bränslet ska
förseglas i kopparkapslar. Gammastrålningen som avges från
bränslet kommer passera igenom kapslarna och absorberas av
omgivningen. Studier av strålningsinducerade processer i
fasgränsytor mellan metalloxider och lösningar har visat att
bildandet av vissa radiolysprodukter såsom, H2, H2O2, HO· och e-,
är högre än förväntat precis vid ytan av det fasta materialet.
Gammabestrålning av polerad- och föroxiderad koppar i syrefritt
vatten, luft med 60-100 % relativ fuktighet samt i vattenmättad
argon har utförts. Efter bestrålning undersöktes kopparytorna med
IRAS, XPS, katodisk reduktion, SEM, AFM och Raman
spektroskopi. Koncentrationen av koppar i reaktionslösningen
undersöktes med ICP-OES. Produktionen av oxidanter ifrån
gammaradiolys av vatten beräknades med hjälp av mjukvaran
MAKSIMA. Korrosionen av koppar under gammabestrålning
överstiger kraftigt det förväntade. Produktionen av oxidanter ifrån
gammaradiolys är flera hundra gånger för låg för att kunna
förklara mängden oxiderad koppar. En möjlig förklaring är en
förhöjd produktion av HO· vid kopparytan, en annan förklaring är
en kraftigt ökad ytarea från oxidation av koppar. Genom
interaktion av HO·med oxiden kan metallen oxideras. Kopparoxid
skulle kunna leda elektroner från metallen till oxidanten om
oxidanten har tillräcklig oxidationskraft.

iii
List of papers
I. Björkbacka, Å.; Hosseinpour, S.; Leygraf, C.; Jonsson, M.
Radiation Induced Corrosion of Copper in Anoxic Aqueous
Solution. Electrochemical and Solid-State Letters 2012, 15
(5), C5-C7.
II. Björkbacka, Å.; Hosseinpour, S.; Johnson, M.; Leygraf, C.;
Jonsson, M. Radiation induced corrosion of copper for
spent nuclear fuel storage. Radiation Physics and
Chemistry 2013, 92 (0), 80-86.
III. Björkbacka, Å.; Yang, M.; Gasparrini, C.; Leygraf, C.;
Jonsson, M. Kinetics and Mechanisms of Reactions
between H2O2 and Copper and Copper Oxides. Dalton
Transactions 2015, 44, 16045-16051.
IV. Björkbacka, Å.; Johnson, M.; Leygraf, C.; Jonsson, M. The
role of the oxide layer in radiation induced corrosion of
copper in anoxic water. Manuscript.
V. Björkbacka, Å.; Johnson, M.; Johansson, B.; Ruthland, M.;
Leygraf, C.; Jonsson, M. Radiation induced corrosion of
copper in humid air and argon. Manuscript.

iv
Contribution to papers
I. Principal author. Planned and performed the experimental
work, except IRAS-, AFM- and Confocal Raman-analyses.
Major part in writing.
II. Principal author. Planned and performed the numerical
simulations and the experimental work, except IRAS-, XPS-
and cathodic reduction-analyses. Major part in writing.
III. Principal author. Planned the experimental work.
Performed the kinetics part of the experimental work.
Major part in writing.
IV. Principal author. Planned and performed the experimental
work, except IRAS-analyses. Major part in writing.
V. Principal author. Planned and performed the experimental
work, except IRAS- and AFM-analyses. Major part in
writing.

v
Table of contents
Abstract ........................................................................................... i
Sammanfattning .............................................................................. ii
List of papers .................................................................................. iii
Contribution to papers .................................................................... iv
Table of contents ............................................................................ v
1. Introduction ................................................................................ 1
1.1 Repository for spent nuclear fuel in Sweden ........................ 1
1.2 The copper canister .............................................................. 3
1.2.1 Design of the copper canister ........................................ 3
1.2.2 From manufacturing to deposition ................................. 4
1.2.3 Initial state of the canister .............................................. 5
1.3 Atmospheric corrosion of copper .......................................... 6
1.4 Radiation chemistry .............................................................. 7
1.4.1 Gamma radiolysis .......................................................... 8
1.4.2 Radiation chemistry in heterogeneous systems ......... 9
1.4.3 Corrosive radiolysis products on the copper canister
surface .................................................................................. 11
1.4.4 Reactions between H2O2 and metal oxides ................. 11
1.5 Previous work on radiation induced corrosion of copper .... 12
1.6 Objectives ........................................................................... 13
2. Experimental details ................................................................. 15
2.1 Materials ............................................................................. 15
2.2 Kinetic study ....................................................................... 16
vi
2.3 Mechanistic study ................................................................ 17
2.4 Numerical simulations ......................................................... 17
2.5 Instrumentation ................................................................... 19
3. Results and discussion ............................................................. 23
3.1 Gamma radiation experiments ............................................ 23
3.1.1 Polished copper cubes in anoxic water ........................ 23
3.1.1.1 Measured concentration of copper in solution after
irradiation of polished copper cubes ...................................... 23
3.1.1.2 Oxide formation during irradiation of polished copper
cubes ..................................................................................... 25
3.1.1.3 Formation of local corrosion features during irradiation
of polished copper cubes ....................................................... 28
3.1.2 Pre-oxidized copper cubes in anoxic water .................. 33
3.1.2.1 Measured concentration of copper in solution after
irradiation of pre-oxidized copper cubes ................................ 33
3.1.2.2. Oxide formation during irradiation of pre-oxidized
copper cubes ......................................................................... 34
3.1.2.3 Formation of local corrosion features during irradiation
of pre-oxidized copper cubes ................................................ 37
3.1.3 Impact of homogeneous water radiolysis on the
corrosion of copper ................................................................ 39
3.1.4 Polished copper cubes in humid argon ........................ 42
3.1.4.1 Oxide formation during irradiation of polished copper
cubes in humid argon ............................................................ 42
3.1.4.2 Formation of local corrosion features during irradiation
of polished copper cubes in humid argon .............................. 44

vii
3.1.5 Humid air ...................................................................... 45
3.1.5.1 Oxide formation during irradiation of polished copper
cubes in humid air ................................................................. 46
3.2 Kinetics and mechanisms between H2O2 and copper and
copper oxides ........................................................................... 56
3.2.1 Kinetics of the reactions between H2O2 and copper and
copper oxides ........................................................................ 56
3.2.2 Mechanisms of the reactions between H2O2 and copper
and copper oxides ................................................................. 62
3.2.3 Reactions between H2O2 and copper cubes ................ 64
3.3 Direct impact of radiation induced corrosion of copper on the
integrity of copper canisters for spent nuclear fuel storage ...... 66
4. Conclusions .............................................................................. 68
5. Future work .............................................................................. 70
6. List of abbreviations ................................................................. 71
7. Acknowledgements .................................................................. 72
8. References ............................................................................... 73


1. Introduction
1
1. Introduction
Nuclear power plants in 30 countries are generating 11 % of the
world’s electricity today. There are 440 commercially operating
reactors, 250 research reactors and 180 reactors powering ships
and submarines. The nuclear energy production generates almost
no emission of greenhouse gasses but do generate highly
radioactive waste.1 The radioactivity of the fuel material will reach
natural levels after approximately 100 000 years and during this
time it must be isolated from the biosphere.2 Geological disposal of
spent nuclear fuel is being considered the main method for long
term storage of high level spent nuclear fuel by many countries.1
1.1 Repository for spent nuclear fuel in Sweden
The most developed method today is the Swedish KBS-3 multi-
barrier deep geological repository concept, which is planned to be
used in Finland and in Sweden.3 According to this concept, copper
canisters with cast iron inserts containing spent nuclear fuel
elements will be deposited at 500 meters depth in ground water
saturated granitic bedrock, see Figure 1.2 The canisters will be
deposited individually in vertical bore holes drilled in the floor of a
tunnel system. After deposition the canisters will be embedded in
compacted bentonite clay and the tunnels will be sealed with
bentonite backfill, see Figure 2.3 The engineered barriers in the
deep repository will consist of naturally occurring materials.

1. Introduction
2
Fig 1. The KBS-3 multi-barrier deep geological repository concept.
© SKB AB
The copper will provide corrosion resistance to the canisters and
the bentonite clay will absorb groundwater and protect the canister
from movements in the bedrock. The bedrock itself will act as the
last barrier as it is mechanically, thermally and chemically stable.2
Fig 2. Emplacement of a canister in compacted bentonite clay with
bentonite backfill in the KBS-3 concept. © SKB AB

1. Introduction
3
1.2 The copper canister
The purpose of the copper canister is to isolate the spent nuclear
fuel from the biosphere until the radioactivity of the fuel material
has reached natural levels, approximately after 100 000 years. The
maximum allowed temperature of the canister surface is set to
100°C and the maximum allowed radiation dose rate on the
canister surface is set to 1 Gy·h-1 (1 Gy = 1 J·kg-1).3 These
requirements must be fulfilled in the design of the canisters.
1.2.1 Design of the copper canister
The cast iron inserts will provide radiation shielding and
mechanical strength to the canisters to withstand the loads at
disposal depths around 500 meters. Steel channels in the insert
will keep the spent nuclear fuel elements in place. Depending on
the type of fuel that will be encapsulated there will be either 4
(PWR-type insert) or 10 (BWR-type insert) steel channels.4 The
copper is chosen for its resistance to the chemical environment
prevailing in a future deep geological repository. To prevent
corrosion damage of the canisters the thickness of the copper shell
has been set to 50 mm. The height of the copper shell will be 4.835
meters and the outer radius will be 0.525 meters.5 The weight of
the copper shell will be 7500 kg and the total weight of a canister
(spent fuel elements included) will be 24600-26800 kg,4
depending on the fuel type. A canister with an insert for BWR-type
spent fuel can be seen in Figure 3.3

1. Introduction
4
Fig 3. A BWR-type spent nuclear fuel canister, both the cast iron insert
and the outer copper shell is shown. © SKB AB
1.2.2 From manufacturing to deposition
Before deposition in the deep repository the copper canisters will
be exposed to different media that will initiate atmospheric
corrosion. After manufacturing the canisters will first be
transported to the encapsulation plant located near the interim
storage for high level spent nuclear fuel. There, the fuel assemblies
will be encapsulated inside the canisters before sealing them by
friction stir welding. The fuel assemblies are selected due to their
burnup and age to prevent dose rates of above 1 Gy·h-1 on the outer
canister surface. The assemblies are dried before they are
encapsulated to reduce the amount of water inside the canisters.
The maximum allowed water content is 600 g. Before the
mounting of the copper lids onto the canisters the atmosphere
inside is replaced by argon to at least 90 %.6 The canisters are then
placed in transportation casks which are either moved to a parking
bay or directly to the harbor from where the canisters will be

1. Introduction
5
transported by boat to the deep repository. After arrival to the
location of the deep repository the canisters are inspected and
parked in a parking bay until deposition.4 The procedure is
summarized in Figure 4.
1.2.3 Initial state of the canister
Initially in the deep repository there will be air trapped in the
bentonite clay and the backfill surrounding the canisters.
Depending on the volumes and porosity of the buffer and backfill
the amount of trapped oxygen per canister is approximately 475
moles. However, due to slow diffusion, oxygen consumption by
reactions with accessory minerals and by microbial activity, only a
small part is expected to reach the canister.5 The bentonite clay
surrounding the copper canisters will be 85 % water saturated at
deposition in the repository.7 It is estimated that complete water
saturation will take approximately fifteen years and anoxic
conditions are likely to be reached right after.2

1. Introduction
6
Fig 4. Canister pathway from production to deposition.
1.3 Atmospheric corrosion of copper
When copper is exposed to the outdoor atmosphere water in the
air will adsorb on to the metal surface. Depending on actual
exposure conditions it may take a few hours to reach steady state at
a constant relative humidity (RH). The water film, with a thickness
depending on the RH of the air, can act as an electrolyte and a
corrosion process can be initiated. At 30 °C in 60 % and 90 % RH
the adsorbed water films consists of approximately 8 and 18
monolayers respectively.8, 9 At 100 % RH the numbers of
monolayers are no longer meaningful to measure as they increase
continuously due to condensation of the moisture. The main
Manufacturing of canister
components and assembly of
canisters
Transport of empty canisters to the
encapsulating plant, Clink
Encapsulation of spent nuclear fuel
elements
Copper lid welded to canister and placement of canister in a
transport cask
Road transport to harbour Sea transport
Road transport to repository facility
Transportation of canisters to
deposition tunnels
Reloading of canister to deposition
machine/vehicle
Deposition of canister

1. Introduction
7
corrosion product formed during atmospheric corrosion of copper
is cuprite (Cu2O) and it is always the corrosion product in contact
with the copper surface.10 Depending on the pH of the adsorbed
water film both the formation and solubility of the corrosion film
changes. At pH 5 a thick and porous corrosion layer consisting of
cubic Cu2O crystals forms on the copper surface while at pH 10 the
formed corrosion film is thin, dense and protective.11 The
solubilities of crystalline Cu2O in water at pH 5 and 6 are 1 – 10 µM
respectively.12 Nitric acid (HNO3) can be formed from pollutants in
air. When copper is exposed to HNO3 at 65 % RH and 25 °C the
main corrosion products are Cu2O and gerhardtite
(Cu4(NO3)2(OH)6).13
1.4 Radiation chemistry
The amount of radiation energy absorbed per mass unit is
recognized as absorbed dose (D). The SI unit for absorbed dose is
Gray (Gy) and it is defined as 1 Gy = 1 J·kg-1. The dose rate is the
absorbed dose per time (Gy·s-1). The consequences of absorbing
radiation energy depend on the radiation source and the absorbing
material. For example little influence is caused by gamma
irradiation of metals while irradiation by heavy particles causes
displacements in the metal lattice. When gamma radiation is
absorbed by water, instead ionizations and excitations of the water
molecules occur. The radiation chemical yield, or the G-value
(G(x)), is described as the number of molecules of a product or
reactant, (x), formed or consumed per Joule absorbed radiation
energy. The G-value (mol·J-1) is expressed as in Equation 1:

1. Introduction
8
( ) = (1)
where G(x) is the radiation chemical yield for a certain product (x),
nx is the number of moles of x formed per absorbed energy unit
(δE) (J). The G-value together with the dose rate and the density of
the irradiated medium can be used to determine the rate of
formation (mol·dm-3·s-1) of a certain radiolysis product.14
1.4.1 Gamma radiolysis
Radiolysis of water occurs when water absorbs radiation. H2O+ is
formed through ionization and will react further with H2O and
form HO· and H3O+. H2O* dissociates into H2, O·, H· and HO·.
Recombination reactions form molecular and secondary radical
products for example hydrogen peroxide (H2O2). In Figure 5, the
time scale of events during the radiolysis of neutral water is shown.
The G-values for the radiolysis products formed in pure water
under gamma irradiation are well established and they are given in
Table 1.15
Table 1. Product yields (G-values) (µmol·J-1) in gamma irradiated
neutral water.
G(-H2O) G(H2) G(H2O2) G(e-aq) G(H·) G(HO2·) G(HO·) G(H3O+)
0.430 0.047 0.073 0.280 0.062 0.0027 0.280 0.280

1. Introduction
9
Fig 5. Time scale for the radiolysis of neutral water.
Radiolysis of humid air results in the production of HNO3.15 In
radiolysis of saline aqueous solutions the HO· reacts with Cl- to
form of HClO- which can react further with H+ to form Cl·.14
1.4.2 Radiation chemistry in heterogeneous systems
Homogeneous radiolysis of pure water is well established and the
radiation chemical yields are generally accepted. The aqueous
radiation chemistry at solid surfaces on the other hand is still not
well understood and it can be very different from that in bulk
water. It is practically very difficult to study the radiation induced
processes occurring at solid-liquid interfaces. Important
parameters that needs to be understood are the dose distribution
in a heterogeneous system, kinetics and mechanisms for reactions

1. Introduction
10
between radiolysis products in solution at the solid surface,
adsorption, dissolution and effects of energy absorption by the
solid material.16 Several earlier studies have confirmed an increase
in the radiation chemical yield of hydrogen (G(H2)) in water-metal
oxide systems of high solid surface-area-to-solution-volume
ratios.17-21 The exact mechanism for this surface enhanced
production is still unknown but an excess of electrons in the water
phase has been observed.
At low solid surface-area-to-solution-volume ratios the surface
reactions will not influence the concentration of radiolysis
products in the bulk and the heterogeneous system should behave
more like a homogeneous system in terms of concentrations of
aqueous radiolysis products. It has been shown that in such
systems numerical simulations of homogeneous water radiolysis
can be used to calculate the concentration of radiolysis products in
the system.22 This study showed that the dissolution of pure
uranium dioxide powder (UO2) in anoxic water under continuous
gamma irradiation could be estimated in excellent agreement with
experimental results. In this particular case, corrosion of the
uranium dioxide powder was shown to be completely governed by
the aqueous radiation chemistry. The rate of oxidation at a given
time during irradiation is calculated from the oxidant
concentrations at that given time using Equation 2. = = ∑ [ ] (2)
In Equation 2, is the solid surface area (m2), is the rate
constant for the reaction between a given oxidant and the solid

1. Introduction
11
surface (m·s-1), [ ] is the time dependent concentration of a given
oxidant (mol·m-3) and is the number of electrons involved in
the redox process.16 To calculate the total amount of oxidized solid,
Equation 2 must be integrated over time taking the concentration
time dependence into account.
1.4.3 Corrosive radiolysis products on the copper canister surface
Two oxidants, H2O2 and HO·, from aqueous gamma radiolysis have
significantly higher standard reduction potentials
(E°(H2O2/2H2O)=1.77 V and E°(HO·aq/H2O)=2.59 V) than copper
(E°(Cu+/Cu(s))=0.520 V or E°(Cu2+/Cu(s))=0.341 V) and are
therefore able to corrode copper.23-25 If gamma radiation is instead
absorbed by humid air, HNO3 which is also able to oxidize
copper,13 is formed.14
1.4.4 Reactions between H2O2 and metal oxides
The most important oxidant in radiation induced dissolution of
UO2-based nuclear fuel has been identified as H2O2 and for this
reason it has been studied quite extensively in recent years.22, 26-29
It has been shown that H2O2 can react with metal oxides in two
different ways; by catalytic decomposition and by electron-
transfer.30, 31 The catalytic decomposition consumes H2O2 but
leaves the oxide in its original state while the electron-transfer
leads to corrosion. The mechanism for catalytic decomposition of
H2O2 on a surface is summarized in Equations 3-5 ((ads)
represents a surface adsorbed state):28, 30

1. Introduction
12
H2O2 (ads) → 2 HO· (ads) (3)
H2O2 (ads) + HO· (ads) → H2O (ads) + HO2· (ads) (4)
2 HO2· (ads) → H2O2 + O2 (5)
To confirm the formation of surface bound HO· a radical
scavenger, such as methanol (CH3OH),32-34 must be used since it is
not possible to detect HO· directly due to its very high reactivity.
The main product from the reaction between CH3OH and HO· is
the hydroxymethyl radical (·CH2OH) which accounts for
approximately 93% of the products.35 In deoxygenated solution
·CH2OH reacts further, to form mainly ethylene glycol (CH2OH)2
and formaldehyde (CH2O), via disproportionation.36, 37 CH2O can
be detected via a modified version of the Hantzsch method.38 There
are several possible reaction pathways for ·CH2OH with metal and
metal ions to further form CH2O and therefore the yield of CH2O
obtained must be considered a relative measurement of HO·.39-41
An experimental study of the reaction between CH3OH and HO·,
initiated by gamma irradiation of anoxic CH3OH-solution,
confirmed the formation of CH2O. The yield was found to be quite
low, only 14%.34
1.5 Previous work on radiation induced corrosion of copper
Despite the importance of understanding the process behind the
radiation induced corrosion of copper, relatively few previous
studies on this topic have been reported. Some studies indicate the
occurrence of radiation induced copper corrosion while other
studies indicate no such effect.

1. Introduction
13
Electrochemical studies of the influence of gamma radiation on
copper have been performed in saline solutions with different
outcome.42-44 In two cases using total doses of 1.4 kGy, in
temperatures of 30 and 150 °C under anoxic conditions no
corrosion effects could be seen compared to unirradiated reference
cases. In the third case, using a total dose of 13.6 kGy, in room
temperature under oxic conditions, a significantly higher corrosion
rate was observed in the presence of gamma irradiation than
without. Studies of gamma radiation induced corrosion of copper
in moist air have also been performed. Using total doses of 107 -
510 kGy, RH of 40 - 100 % and temperatures of 90 - 150 °C, both
Cu2O and tenorite (CuO) could be detected on the copper
surfaces.45, 46 Radiation experiments on copper under oxic
conditions in water at 42 °C and groundwater at 95 °C using total
doses of 720 – 5 016 kGy resulted in pitting corrosion47 and
corrosion rates 30 times higher than in similar experiments
without radiation.48 The differences in experimental conditions
between these studies, i.e. several oxic/anoxic solution
compositions exposed to dose rates and total doses which vary by
several orders of magnitude, makes it impossible to draw
meaningful conclusions.
1.6 Objectives
The aim of this work is to elucidate the mechanisms and dynamics
of radiation induced corrosion of copper in aqueous environments
since, despite its importance, fairly few systematic studies on this
topic are reported.

1. Introduction
14
The main reason for studying this system is the soon-to-be-built
deep geological repository for high level spent nuclear fuel in
Finland and in Sweden. Beside this reason an increased
understanding of the radiation induced processes occurring at
solid-liquid interfaces is desirable.

2. Experimental details
15
2. Experimental details
For all solutions water from a Millipore Milli-Q system (18.2
MΩ·cm-1) of pH 5.5 was used. All H2O2-solutions were prepared
from a 30 % standard solution (CAS [7722-84-1], Merck). All
experiments were performed at ambient temperature (19-22 °C).
All powder samples were weighted on a Mettler Toledo AT261
Delta Range Microbalance. All aqueous particle suspensions were
stirred using a magnetic stirrer at 750 rpm and purged with N2
(Strandmøllen AB, purity of 99.999%) for at least 30 minutes prior
to the experiments.
All anoxic samples were prepared in an Ar filled (Strandmøllen AB,
purity of 99.995 %) glovebox and all oxic samples were prepared in
indoor air with a RH of approximately 60 %. All reaction vessels
were covered with aluminum foil to avoid absorption of UV-light.
The pH was measured using a 713 pH Meter from Metrohm or pH-
paper from Merck.
2.1 Materials
Copper cubes, originating from a SKB copper canister wall,
(99.992% Cu, major impurities are P and Ag) of the sizes 10×10×10
mm were grinded on all sides with SiC abrasive papers of 1200
grit. One side was further polished with 3 μm polycrystalline
diamond paste (Struers). All polishing steps were made in 99.5%
ethanol. After polishing, the copper pieces were sonicated in 99.5
% ethanol for five minutes and then dried under N2 (AGA Gas AB,
purity of 99.996%) in a glovebox.
All experiments were performed with at least two separate pieces

2. Experimental details
16
of copper simultaneously. A reference sample, not irradiated but
otherwise treated the exact same way as the irradiated samples,
was also included in every experiment.
Cu-powder (CAS [7440-50-8], spherical, -100/+325 mesh, 99,9 %,
Alfa Aesar), copper(I)oxide (Cu2O), (CAS [1317-39-1], powder,
anhydrous, 99,9 %, Sigma-Aldrich), copper(II)oxide (CuO): (CAS
[1317-38-0], powder, 99,99 %, Aldrich) were used without further
purification. The B.E.T surface areas of the three different powders
were: Cu-powder (0.1 m2·g-1); Cu2O (0.5 m2·g-1); CuO (17.9 m2·g-1).
2.2 Kinetic study
The concentration of H2O2 as a function of time was determined
using the Ghormley triiodide method. In this method, I- is oxidized
to I3- by H2O2. The absorbance of the product I3
- was measured
spectrophotometrically at a wavelength of 355 nm. There is a linear
correlation between the absorbance of I3- and the H2O2
concentration 27. An extracted sample volume of 0.2 ml was filtered
through a Gema Medical Cellulose Acetate syringe filter 0.2 µm/13
mm and further used for the measurement of the H2O2
concentration. The pH of the oxide suspensions was approximately
6 before, during and after the reactions. The initial experimental
conditions for the reactions between H2O2 and powders were 50 ml
0.5 mM of H2O2 and the amounts of powders were varied between
0.007 and 1.5 g. Two sets of experimental conditions were used for
the study of the reactions between H2O2 and Cu-cubes. Initial
experimental conditions were 50 ml 0.5 mM of H2O2 and 100 mM
of CH3OH in 100 ml 5 mM of H2O2. No change in absorbance was

2. Experimental details
17
spectrophotometrically detected for possible background reactions
between copper and H2O/CH3OH/ CH2O.
2.3 Mechanistic study
The reaction between CH3OH (HPLC grade CH3OH, (CAS [67-56-
1]), Aldrich, 99,9 %) and HO· producing CH2O 34 was monitored
using a modified version of the Hantzsch reaction to quantify the
amount of CH2O.38 The CH2O reacts further with Acetoacetanilide
AAA (CAS[102-01-2], Alfa Aeser, 98%) and Ammonium acetate
(CAS[631-61-8], 98 %, Lancaster) to form a dihydropyridine
derivative with maximum absorbance wavelength at 368 nm. An
extracted sample volume of 1.5 ml was filtered through a Gema
Medical Cellulose Acetate syringe filter 0.2 µm/13 mm and further
used for the measurement of the CH2O concentration. The initial
experimental conditions for the reactions between H2O2 and
powders were 100 mM of CH3OH in 50 ml 5 mM of H2O2 and the
amounts of powders were varied between 0.0125 and 3 g. The
initial experimental conditions for the reactions between H2O2 and
Cu-cubes were 100 mM of CH3OH in 100 ml 5 mM of H2O2. No
change in absorbance was spectrophotometrically detected for
possible background reactions between copper and H2O/CH3OH/
CH2O.
2.4 Numerical simulations
Numerical simulations of homogeneous radiation chemistry of
water were performed using the software MAKSIMA-chemist.49
The radiation chemical yields, G-values, for the water radiolysis

2. Experimental details
18
products used in the simulations are presented in Table 1. The
reactions and corresponding rate constants are presented in Table
2.50
Table 2. Reaction scheme used in the MAKSIMA simulations.
Reactions Rate constants (M-1·s-1)
HO· + HO· = H2O2 4.0×10⁹ HO· + e- = HO- + H2O 2.0×10¹⁰ HO· + H· = H2O 2.5×10¹⁰ HO· + O2- = HO- + O2 1.0×10¹⁰ HO· + H2O2 = H2O + O2- + H+ 2.3×10⁷ HO· + H2 = H2O + H· 4.0×10⁷ e- + e- = HO- + HO- + H2 5.0×10⁹ e- + H· = HO- + H2 2.0×10¹⁰ e- + HO2· = HO2- + H2O 2.0×10¹⁰ e- + O2- = HO2- + HO- 1.2×10¹⁰ e- + H2O2 = HO· + HO- + H2O 1.6×10¹⁰ e- + H+ = H· + H2O 2.2×10¹⁰ e- + O2 = O2- + H2O 2.0×10¹⁰ e- + H2O = H· + HO- + H2O 2.0×101 H· + H· = H2 1.0×10¹⁰ H· + HO2· = H2O2 2.0×10¹⁰ H· + O2- = HO2- 2.0×10¹⁰ H· + H2O2 = HO· +H2O 6.0×10⁷ H· + HO- = e- 2.0×10⁷ H· + O2 = O2- + H+ 2.0×10¹⁰ HO2·+ = O2- + H+ 8.0×10⁵ HO2· + HO2· = O2 + H2O2 7.5×10⁵ HO2· + O2- = O2 + HO2- 8.5×10⁷ O2- + H+ = HO2· 5.0×1010 H2O2 + HO- = HO2- + H2O 5.0×10⁸ HO2- + H2O = H2O2 + HO- 5.7×10⁴

2. Experimental details
19
2.5 Instrumentation
Gamma irradiations were performed using a MDS Nordion 1000
Elite Cs-137 gamma source. The dose rates employed varied
between 0.02 and 0.3 Gy·s-1 depending on shielding and the
position of the samples inside the gamma source. The dose rates
were determined using Fricke dosimetry.51
UV/vis spectra were collected using a WPA Biowave II or a Jasco
V-630 UV/vis spectrophotometer.
Trace elemental analysis was performed on all solutions using
inductively coupled plasma optic emission spectroscopy (Thermo
Scientific iCAP 6000 series ICP spectrometer (ICP-OES)). The
analysis for copper was performed at wavelengths of 219.9 and
217.8 nm using ICP multi element standard IV from Merck.
Filtrations were performed using filters from Gema Medical (0.2
µm) and from Whatman (0.02 µm).
Surface characterization of the polished sides of the copper cubes
was performed using a Digilab FTS 40 Pro infrared reflection
absorption spectrometer (IRAS) with P-polarized light with an
incident angle of 78° using 512 or 1024 scans with a resolution of 4
cm-1. As background sample an unirradiated polished copper cube
was used.
XPS spectra were recorded with a Kratos Axis Ultra electron
spectrometer with a delay line detector. A monochromated Al Kα

2. Experimental details
20
source operated at 150 W, a hybrid lens system with a magnetic
lens, providing an analyzed area of 0.3×0.7 (mm)2, and a charge
neutralizer were used for the measurements. The base pressure in
the analysis chamber is below 3·10-9 Torr. The binding energy (BE)
scale was referenced to the C 1s of aliphatic carbon, set at 285.0 eV.
Processing of the spectra was accomplished with Kratos software
using Gaussian and Lorenzian functions in ratio of about 70% to
30%. Shirley background subtraction is applied. The depth of
analysis for metal oxides/hydroxides is about 6 nm. The element
detection limit is typically 0.1 atomic %.
Surface examinations were performed using a FEG-SEM Zeiss
Sigma VP with a Gemini field emission column scanning electron
microscope or a Jeol JSM-6490LV scanning electron microscope
with a Jeol EX-230 energy dispersive X-ray spectrometer.
Nitrogen adsorption–desorption isotherms were recorded at
liquid nitrogen temperature (77 K) for all powders using a
Micromeritics ASAP2020 volumetric adsorption analyser. The
samples were treated under near-vacuum conditions (< 10-5 Torr)
at a temperature of 300°C for 10 h. The specific surface areas of the
materials were calculated from the recorded data according to the
B.E.T. isotherm in the range of relative pressures of 0.05 - 0.15.
The total pore volume was calculated at a relative pressure of 0.99.
Surface topography was obtained using an Agilent 5500 atomic
force microscope (AFM) in static mode with a commercially
obtained cantilever or a Bruker Dimension Icon (Bruker®, Santa

2. Experimental details
21
Barbara, CA) AFM operating in standard tapping mode in air.
Silicon tips, RTESPA (Veeco) were cleaned in UV chamber for 20
min, rinsed with ethanol (99,6%) and dried with nitrogen gas prior
to use. The surface height profiles of the scanned areas were then
obtained using the line scan on the created AFM image.
Cathodic reductions were conducted following the procedure in
ASTM B825-13,52 using an EG &G Princeton Applied Research
potentiostat/galvanostat model 263A to quantify the amount of
oxide formed on the copper samples. 0.1 M KCl was used as the
electrolyte solution with a SCE reference electrode and a platinum
counter electrode. The cathodic current density was 0.05 mA·cm-2.
To perform the experiments in oxygen-free electrolyte, the solution
was purged with N2 (AGA Gas AB, purity of 99.996 %) 30 min
prior to the experiment. The correlated time for the point of
hydrogen evolution was used to provide the amount of electrons
needed to reduce the oxidized copper back to metallic copper. If
the composition of the oxide layer is known, then, according to
Faraday’s law, the equivalent thickness of the oxide formed on the
surface can be obtained using Equation 6. = ( × × )/( × × × ) (6)
In Equation 6, is the oxide thickness (m), is the time required
to reduce the oxide (s), is the applied current (A), is the molar
mass of the oxide (g·mol-1), is the sample area in contact with the
electrolyte (m2), is the number of electrons required to reduce a
unit of molecular weight of oxide, is the specific weight of the

2. Experimental details
22
reduced oxide (g·m-3), and is Faraday’s constant (9.65×10⁴
C·mol-1). The densities used for calculations of the oxide thickness
for CuO and Cu2O are 6.315 and 6 g·(cm3)-1 respectively.53
Confocal Raman imaging was performed on a 40 × 40 µm area of
the irradiated sample using a WITEC alpha 300 system Confocal
Raman Microscope equipped with a 532 nm laser source and a 50
X Nikon objective.
A Memmert oven was used for pre-oxidation of copper cubes in
90°C for 24 h under unlimited amount of air.

3. Results and discussion
23
3. Results and discussion
3.1 Gamma radiation experiments
Copper cubes were irradiated under different conditions by gamma
radiation. Duplicates were made in each irradiation experiment as
well as a reference sample. The reference sample was treated under
the same conditions as the irradiated samples with the exception of
exposure to gamma radiation.
3.1.1 Polished copper cubes in anoxic water
Polished copper cubes were irradiated in 10 ml of anoxic pure
water for 2-168 hours. The dose rates varied between 0.02 and 0.3
Gy·s-1 and the maximum total dose absorbed was 95 kGy. Already
by visual inspection it is obvious that the irradiated copper
samples are more corroded than the reference samples.
3.1.1.1 Measured concentration of copper in solution after
irradiation of polished copper cubes
A series of gamma radiation exposures were performed to study
the effect of the absorbed total dose on the corrosion behavior of
polished copper in anoxic pure water. When measuring the
concentration of copper in solution using ICP-OES, the radiation
enhanced corrosion is detected already at very low total doses of
1.5 kGy. At absorbed total doses of 0.75-1.5 kGy no detectible
difference was found between irradiated and unirradiated copper
samples. Both for irradiated (total doses up to 1.5 kGy) and
unirradiated samples, the copper concentration in solution was
approximately 2 µM. When increasing the absorbed total dose

3. Results and discussion
24
gradually up to 74 kGy there is a significant difference in
concentration of copper in solution between irradiated and
unirradiated copper samples. When comparing the three different
dose rates in terms of copper release to the aqueous solution, it can
be concluded that the concentration of copper varies depending on
the dose rate used. The results are presented in Figure 6 together
with photographs of copper cubes exposed to different total doses.
It is quite clear that the two copper cubes exposed to the two
highest total doses are more corroded than the one exposed to the
lowest total dose. The concentration of copper in solution is
increasing with increasing absorbed total dose. 54
Fig 6. Measured concentrations of copper (µM) in aqueous solution as a
function of absorbed total dose (Gy). Corrections for the unirradiated
reference samples are made. © Elsevier B.V.
0
10
20
30
40
50
60
70
80
2.50 3.00 3.50 4.00 4.50 5.00 5.50
Co
nce
ntr
atio
n o
f co
pp
er in
so
luti
on
(µM
)
log10(total dose) (Gy)
Corrosion detection limit
Estimated total dose absorbed
by an outer canister
surface after 100 years in a
deep repository
0.02 Gy·s-1
0.1 Gy·s-1 0.2 Gy·s
-1

3. Results and discussion
25
There is a statistically significant difference in the yield of copper
in solution, between the dose rates of 0.02 and 0.2 Gy·s-1. For the
dose rate of 0.2 Gy·s-1 the yield of copper in solution is
0.0005±0.0002 µmol·J-1 while for the dose rate of 0.02 Gy·s-1 the
yield of copper in solution is 0.0023±0.0002 µmol·J-1.
3.1.1.2 Oxide formation during irradiation of polished copper cubes
When examining the oxide layer formed during irradiation of
copper samples using IRAS, the first sign of radiation enhanced
corrosion was detected at higher total doses than when using ICP-
OES, approximately at a total dose of 20 kGy. An unirradiated
reference sample was used as background in the IRAS
examinations. An IRAS spectrum of a copper surface exposed to
26.7 kGy at a dose rate of 0.1 Gy·s-1 is shown in Figure 7.
Fig 7. IRAS spectra of an irradiated copper surface. The dose rate was
0.1 Gy·s-1 and the total dose absorbed was 26.7 kGy. © Elsevier B.V.
0.00
0.10
0.20
0.30
0.40
500 600 700 800 900 1000
Ab
sorb
ance
Wavenumber (cm-1)
3. Results and discussion
26
Cu2O was detected as the main corrosion product on all copper
surfaces exposed to total doses higher than 20 kGy.
An obvious Cu2O peak is seen at ~652 cm-1 and at ~610 cm-1 a
weaker peak is seen which also originates from Cu2O.55 Close to the
cutoff frequency, CuO has a wide peak at ~520-560 cm-1,56 and as
can be seen in Figure 7, it cannot be ruled out that there are low
amounts of CuO present on the surface. No other peaks were
observed in the scanning range between 500 and 4000 cm-1.54
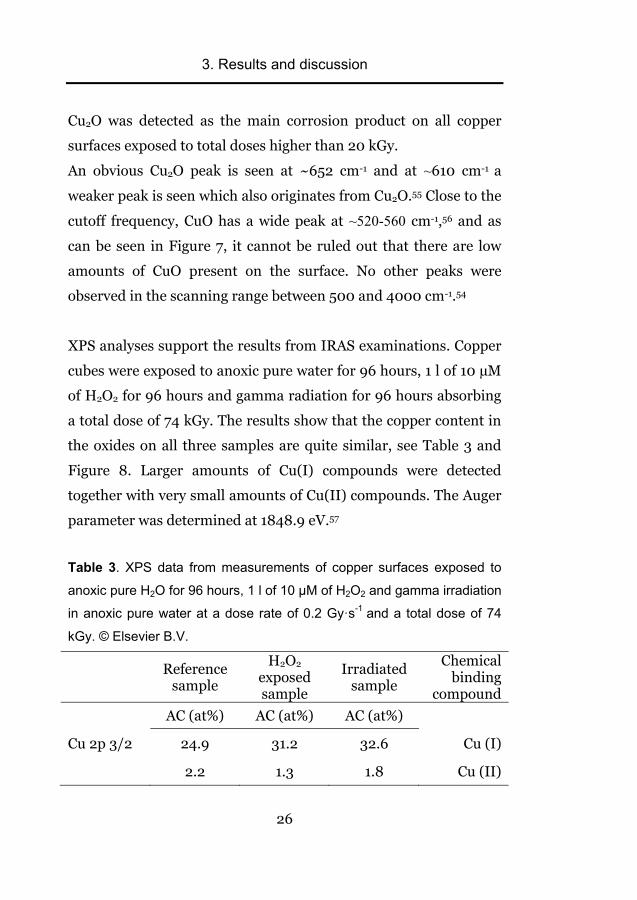
XPS analyses support the results from IRAS examinations. Copper
cubes were exposed to anoxic pure water for 96 hours, 1 l of 10 µM
of H2O2 for 96 hours and gamma radiation for 96 hours absorbing
a total dose of 74 kGy. The results show that the copper content in
the oxides on all three samples are quite similar, see Table 3 and
Figure 8. Larger amounts of Cu(I) compounds were detected
together with very small amounts of Cu(II) compounds. The Auger
parameter was determined at 1848.9 eV.57
Table 3. XPS data from measurements of copper surfaces exposed to
anoxic pure H2O for 96 hours, 1 l of 10 µM of H2O2 and gamma irradiation
in anoxic pure water at a dose rate of 0.2 Gy·s-1 and a total dose of 74
kGy. © Elsevier B.V.
Reference
sample
H2O2 exposed sample
Irradiated sample
Chemical binding
compound AC (at%) AC (at%) AC (at%)
Cu 2p 3/2 24.9 31.2 32.6 Cu (I)
2.2 1.3 1.8 Cu (II)

3. Results and discussion
27
Fig 8. XPS spectra of copper surfaces exposed to anoxic pure H2O for 96
hours, 1 l of 10 µM of H2O2 and gamma irradiation in anoxic pure water at
a dose rate of 0.2 Gy·s-1 and a total dose of 74 kGy.
In Figure 9, the results from electrochemical measurements,
cathodic reductions, are presented. After irradiation of a copper
cube, at a dose rate of 0.2 Gy·s-1 and a total dose of 74 kGy, the
amount of electrons required to reduce the oxidized copper back to
metallic copper is 0.52 µmol·cm-2. On the reference sample,
exposed only to anoxic pure water for 96 hours, the amount of
electrons required to reduce the oxidized copper back to metallic
copper is only 0.07 µmol·cm-2. Assuming that the oxide layer is
pure Cu2O then the oxide thickness on the surface of the irradiated
sample is estimated to approximately 100 nm while the oxide layer

3. Results and discussion
28
thickness on the surface of the unirradiated reference sample is
only 4 nm. The amount of oxidized copper, calculated from the
results from cathodic reduction, must be considered as an average
value due to the heterogeneity of the oxide layer formed during
gamma irradiations.54 The major part of the oxidized copper, after
irradiation at a dose rate of 0.2 Gy·s-1 for 96 hours, is situated in
the oxide layer while less than 0.5 % is released into solution.
Fig 9. Results from cathodic reduction measurements of an irradiated
copper surface and a reference copper surface. © Elsevier B.V.
3.1.1.3 Formation of local corrosion features during irradiation of
polished copper cubes
SEM images from surface examinations of reference and irradiated
copper surfaces are presented in Figure 10 a, b and c.
Examinations of the reference samples reveal a homogeneous
surface only with markings from polishing, as can be seen in
Figure 10 a. The examinations of irradiated copper samples reveal
-1.30
-1.10
-0.90
-0.70
0 400 800 1200 1600
E (V
)
Time (s)
Reference sample
Irradiated sample

3. Results and discussion
29
Fig 10 a, b and c. SEM-images of a) a reference copper surface
exposed to anoxic pure water for 96 hours , b) an irradiated copper
surface using a dose rate of 0.1 Gy·s-1 and a total dose of 62 kGy and c)
a close-up on one of the local corrosion features.
c)
a)
b)

3. Results and discussion
30
a crystalline oxide layer with local corrosion features embedded
within the oxide. The corrosion features are frequently circular in
shape; they are of different sizes and are spread all over the
surface, as can be seen in Figure 10 b. In the close-up image of a
local corrosion feature in Figure 10 c, it can be seen that the
crystalline oxide layer is surrounding a quite flat and ring-shaped
surface with a rougher surface in the center.
Neither distribution nor size of the local corrosion features seems
to be dependent on the dose rate or the total absorbed dose.54
SEM-EDS imaging shows that the oxygen content is higher within
the local corrosion features than outside them, see Figure 11.
Fig 11. SEM-EDS images of a local corrosion feature where it clearly can
be seen that the oxygen content is higher within the feature than outside.

3. Results and discussion
31
In Figure 12 the result from an AFM measurement of a local
corrosion feature is displayed.
Fig 12. AFM topographic image of a local corrosion feature.
© Electrochemical Society, Inc. 2012
The corrosion feature in the AFM image is divided into three
different areas; the crystalline oxide layer, x, the flat ring, y, and
the rough center, z. The two outer areas, x and y, have similar
heights while the center area, z, is approximately 800 nm deep.58
A Confocal Raman spectrum of a local corrosion feature is shown
in Figure 13. Also in this figure the corrosion feature is divided into
three different areas. It can be seen that the intensities of Cu2O is
highest in the outside crystalline oxide area, x’, and lowest in the
smoother ring-shaped area, y’.58

3. Results and discussion
32
Fig 13. Confocal Raman image and spectra of a local corrosion feature.
© Electrochemical Society, Inc. 2012
The mechanism behind the occurrence of the corrosion features is
not fully understood but is presumably of electrochemical nature.
Galvanic actions caused by ennoblement of the copper oxide can
give rise to anodic and cathodic areas.59 Slight ennoblement of
copper oxide in dilute saline solution has been observed under
irradiation by UV-light.60 A possible formation of electron-hole
pairs in the copper oxide can modify the electronic structure of the
oxide and create a potential difference between the copper oxide
and the copper metal. With water acting as the electrolyte anodic
reactions can take place in the metallic copper while the cathodic
reactions can take place in the copper oxide.

3. Results and discussion
33
3.1.2 Pre-oxidized copper cubes in anoxic water
Polished copper cubes were oxidized in air of 90 °C for 24 hours or
oxidized in 10 ml of 2.5 mM of H2O2 for 36 hours. After the
oxidation the copper cubes were irradiated in 10 ml of anoxic pure
water for 25-145 hours. The dose rates varied between 0.1 and 0.3
Gy·s-1 and the maximum total dose absorbed was 110 kGy.
3.1.2.1 Measured concentration of copper in solution after
irradiation of pre-oxidized copper cubes
A series of exposures of copper cubes to different total doses of
gamma radiation was performed. The concentration of copper in
solution was measured after the exposures and the results are
presented in Figure 14 together with previously presented results
from Figure 6.
It can be seen in Figure 14 that the concentration of copper in
solution is higher when pre-oxidized copper cubes are exposed to
total doses from 9-110 kGy in anoxic pure water, than when
polished copper cubes are exposed to gamma radiation under
similar conditions. Admittedly the data is scattered but the trend is
confirmed both for copper cubes pre-oxidized in dry, warm air and
in H2O2. The yield of copper in solution after irradiations of
polished copper cubes is 0.0006±0.0001 µmol·J-1 while after
irradiations of pre-oxidized copper cubes the yield of copper in
solution is 0.0011±0.0003 µmol·J-1. The concentration of copper
in solution after reference pre-oxidized copper samples were
exposed to 10 ml anoxic pure water for 96 hours was only 0.5 µM.
The horizontal line in Figure 14 corresponds to the concentration

3. Results and discussion
34
of copper in solution measured after oxidation of copper cubes in
25 µmoles of H2O2 for 36 hours, approximately 4 µM.
Fig 14. Measured concentrations of copper in solution after irradiations of
polished and pre-oxidized copper cubes.
3.1.2.2. Oxide formation during irradiation of pre-oxidized copper
cubes
Already by visual inspection it can be seen that the irradiated pre-
oxidized copper cubes are more corroded than the reference pre-
oxidized copper cubes.
The oxide formed on pre-oxidized copper cubes during gamma
irradiation was studied using IRAS. In Figure 15 an IRAS spectrum
from a pre-oxidized copper surface irradiated at a dose rate of 0.25
Gy·s-1 for 96 hours is shown. The peak at ~650 cm-1 corresponds to
0
40
80
120
160
200
2 2.5 3 3.5 4 4.5 5 5.5
Co
nce
ntr
atio
n o
f co
pp
er in
so
luti
on
(µ
M)
log10(total dose) (Gy)
H2O2-oxidized cubes
Pre-oxidized cubesexposed to gammaradiationPolished cubes exposed togamma radiation
H2O2-oxidized cubesexposed to gammaradiation

3. Results and discussion
35
Cu2O.55 No other peaks were observed in the scanning range
between 2000 and 4000 cm-1.
Fig 15. IRAS spectrum of a pre-oxidized copper cube (90°C dry air for 24
hours) exposed to gamma radiation using a dose rate of 0.25 Gy·s-1 for
96 hours.
The amount of oxidized copper on the irradiated pre-oxidized
copper cubes was measured using cathodic reduction. The
expected corrosion products, CuO and Cu2O, have reduction
potentials in the ranges of -0.60 to near -0.80 V (vs. SCE) and
from -0.85 to -0.95 V (vs. SCE), respectively.61 The results from the
measurements can be seen in Figure 16. There is almost no
difference between the two reference samples exposed to 90 °C air
for 24 hours and exposed to 90 °C in air for 24 hours followed by
exposure to anoxic water for 145 hours. Judging by the potentials
in Figure 16, the main corrosion product formed on the pre-
oxidized copper surfaces, both before and after exposure to gamma
0
0.02
0.04
0.06
500 1000 1500 2000
Ab
sorb
ance
Wavenumber (cm-1)

3. Results and discussion
36
radiation, is Cu2O. This is in agreement with the results from IRAS
measurements in Figure 15.
Fig 16. Results from cathodic reduction measurements of irradiated pre-
oxidized copper surfaces and reference pre-oxidized copper surfaces.
The amounts of electrons required to reduce the oxidized copper
back to metallic copper, for the different exposures in Figure 16,
are given in Table 4. On the copper cube exposed to 25 µmoles of
H2O2 the oxide layer seems to contain both Cu2O and CuO. From
the results presented in Table 4, it can be concluded that only 18 %
of the H2O2 contributes to oxide formation. The remaining 82 %
were consumed via catalytic decomposition and solution
reactions.62
-1.4
-1.2
-1
-0.8
-0.6
0 1000 2000 3000 4000 5000
E (
V)
Time (s)
Reference sample
Reference sample exposedto anoxic H2O 145hH2O2 (25 µmoles) exposedsampleGamma radiation, 0.2 Gy/s,45 hGamma radiation, 0.2 Gy/s,95 h

3. Results and discussion
37
Table 4. 1) Pre-oxidized in 90 °C air 24 h; 2) Pre-oxidized in 90 °C air 24
h + anoxic water 145 h; 3) H2O2 exposed sample (25 µmol); 4) Pre-
oxidized in 90 °C air 24 h + gamma radiation 0.2 Gy·s-1 in anoxic water
45 h; 5) Pre-oxidized in 90 °C air 24 h + gamma radiation 0.2 Gy·s-1 in
anoxic water 95 h. The differences between the reference sample and
other samples are given within parentheses (no comparison is given for
H2O2-oxidation).
Experimental conditions
1) 2) 3) 4) 5)
Amount of e- required to reduce Cu(ox) back to Cu0
(µmol·cm-2)
0.39
(0)
0.61
(0.22)
0.74
0.88
(0.49)
2.6
(2.21)
Interestingly, the amount of oxide formed on pre-oxidized copper
cubes during irradiation is larger than the amount of oxide formed
on polished copper cubes under similar conditions, see also Table
5. The major part of the oxidized copper, after irradiation at a dose
rate of 0.2 Gy·s-1 for 95 hours, is situated in the oxide layer while
less than 0.1 % is released into solution.
3.1.2.3 Formation of local corrosion features during irradiation of
pre-oxidized copper cubes
A SEM image from examinations of a reference pre-oxized copper
surface, exposed to 90 °C in air for 24 hours, is shown in Figure 17
a. In the SEM image a quite homogeneous oxide layer can be seen.
Markings from polishing and small particles are visible on the
surface.

3. Results and discussion
38
Fig 17 a, b and c. SEM-images of a reference pre-oxidized copper (a)
and irradiated pre-oxidized copper (b and c).
a)
b)
c)

3. Results and discussion
39
SEM images of an irradiated pre-oxidized copper cube reveal
widely spread local corrosion features embedded in the oxide layer,
see Figure 17 b) and c). Irradiation was performed at 0.25 Gy·s-1 in
10 ml of pure anoxic water for 96 hours.
3.1.3 Impact of homogeneous water radiolysis on the corrosion of
copper
To evaluate the impact of radiolysis products formed when gamma
radiation is absorbed by anoxic pure water, numerical simulations
were performed using MAKSIMA software. When using the
reaction scheme given in Table 2, the concentrations of radiolytic
species as a function of irradiation time in homogenous aqueous
solution can be fairly accurately predicted. The surface area of a
copper cube is only 6 cm2 and therefore the solid surface-area-to-
solution-volume-ratio is sufficiently low for surface reactions not
to influence the bulk reactions.22
The concentrations of H2O2 and HO·, obtained at a given time for a
given dose rate from numerical simulations, are used in Equation 2
and the amount of oxidized copper is obtained by integrating
Equation 2 over the reaction time. Since the rate constants for
interfacial oxidation of a copper cube is not known the diffusion
controlled rate constant is used (10-6 m·s-1).16 This will provide the
maximum possible amount of oxidized copper and is most
probably an overestimation. The results from numerical
simulations together with experimental results are given in Table
5.54

3. Results and discussion
40
Table 5. 1) Numerical simulations, irradiation time: 96 h; 2) Experimental
value polished cubes: irradiation time: 96 h; 3) Experimental value pre-
oxidized cubes, irradiation time: 95 h. The dose rate used in all
experiments is 0.2 Gy·s-1.
Experimental conditions
1) 2) 3)
Amount of e- required to reduce Cu(ox) back to Cu0
(µmol·cm-1)
0.0014 0.52 2.21
As can be seen in Table 5, the experimental values of oxidized
copper vastly exceed the theoretical values. The difference between
theory and experimental values for polished copper cubes is more
than 350 times and for pre-oxidized copper cubes the difference is
even larger, more than 1500 times.
However, it should be noted that the surface area used when
performing the calculations using Equation 2, is the geometrical
surface area of a copper cube, 6 cm2. For a polished copper cube
this value is probably quite close to the actual surface area. Once
the oxidation of the copper surface proceeds during irradiation, an
oxide layer is formed and the surface area will increase.
When oxidizing the copper cube using H2O2 there is no observation
of enhanced corrosion. Instead the oxidized copper corresponds to
only a fraction of the consumed oxidant. The only other radiolysis
product that can be responsible for the corrosion then is the HO·.
One speculation could be that the HO·, which is a very strong
oxidant, is able to oxidize the copper metal through the oxide. If
the thermodynamic driving force would be large enough then

3. Results and discussion
41
electrons could be conducted through the oxide to the oxidant. Due
to its very high reactivity, only HO· produced on or very near the
copper surface, will be able to react with the surface. Hence, the
surface area of the oxide would have strong influence on the rate of
the oxidation.
Preliminary data show that when exposing metallic copper powder
to different oxidants the yield of oxidized copper increases with
increasing oxidizing power of the oxidants used. Results from
another preliminary study which also support the theory presented
above, is that when copper cubes are irradiated in saline solution,
much less corrosion is observed compared to irradiations in pure
water. The reason for this can be that the HO· will be scavenged
rapidly by Cl- and HCO3- to form other, less oxidative, radical
species.
Studies of metal oxide-liquid systems have confirmed an increase
in the radiation chemical yield of hydrogen (G(H2)).17-21 The exact
mechanism for this enhanced production is still unknown but it is
most probably due to energy transfer from the solid phase into the
liquid phase. The effect depends on the type of oxide, the surface
morphology and the solid surface-area-to-solution-volume-ratio.
The G(H2) increases with decreasing water film thickness. Some
studies have also confirmed increased radiation chemical yields of
hydroxyl radicals (G(HO·)) and hydrogen peroxide (G(H2O2)) in
these type of systems.63-65 Nanoporous stainless steel, nickel based
alloy or gold were impregnated with a HO· scavenger. During
irradiation of systems containing water and the nanoporous
materials, the HO· formation at the solid surfaces was 2-6 times

3. Results and discussion
42
higher compared to the formation of HO· in pure bulk water. The
increase of the HO· production during irradiation can be used to
explain the detected increase of H2O2 production under similar
conditions. If the HO· is not scavenged it can recombine to form
H2O2. The increase of H2O2 formation is greater under low dose
rate irradiations and at high solid surface-area-to-solution-
volume-ratios.
It is interesting to note that neither CuO nor Cu2O belong to the
group of metal oxides which enhance the production of H2.19, 66 If
the radiation chemical yield of HO· would be higher than expected
on the surface, than this would in turn reduce the yield of H2.
To conclude, a dramatic increase in specific surface area together
with a higher radiation chemical yield of HO· could be major
phenomena when explaining the observed radiation enhanced
corrosion process.
3.1.4 Polished copper cubes in humid argon
Polished copper cubes were irradiated for 96 hours at a dose rate
of 0.13 Gy·s-1 in water-saturated argon (100 % RH) at ambient
temperature.
3.1.4.1 Oxide formation during irradiation of polished copper cubes
in humid argon
After irradiations the exposed copper surfaces were examined
using IRAS. In Figure 18 an IRAS spectrum is shown. There is a
characteristic Cu2O peak at wavenumber ~650 cm-1 and this is the
only peak observed within the scanning range (500-4000 cm-1).

3. Results and discussion
43
The very strong peak indicates a quite thick Cu2O layer present on
the copper surface.
Fig 18. IRAS spectrum of a sample exposed to gamma radiation in
water-saturated Argon at a dose rate of 0.13 Gy·s-1 for 96 hours.
Reference experiments were also performed where copper cubes
were irradiated in dry argon at a dose rate of 0.13 Gy·s-1 and, as
expected, no corrosion products were detected.
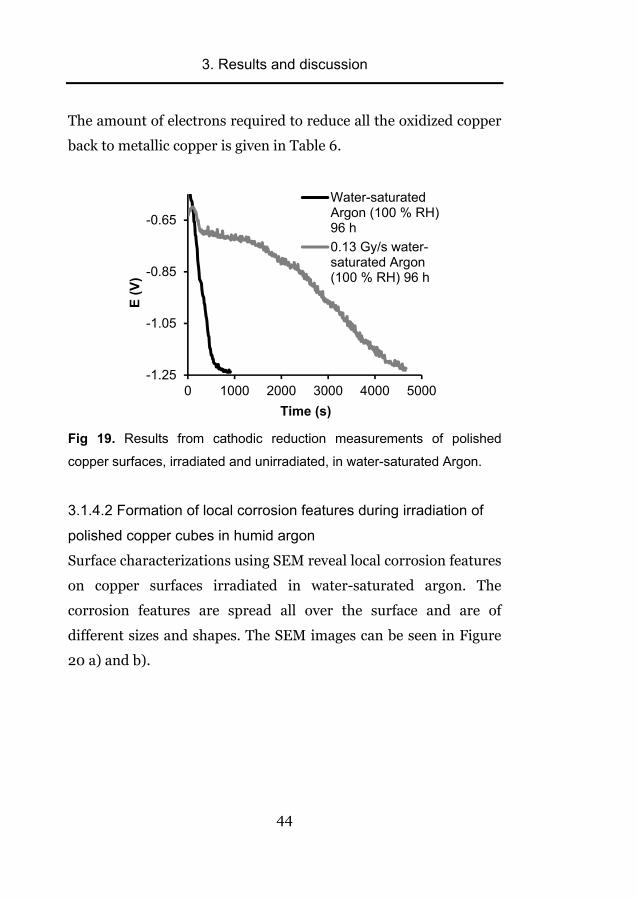
The oxide formation during irradiations in water-saturated argon
was also studied using cathodic reduction. It can be seen clearly in
Figure 19 that the amount of oxidized copper is many times higher
on the irradiated copper surface than on the unirradiated reference
copper surface. Also, judging by the potential range, the oxide
layer contains a small amount of CuO but the main part is Cu2O.
0
0.05
0.1
0.15
0.2
0.25
500 600 700 800 900 1000
Ab
sorb
ance
Wavenumber (cm-1)
3. Results and discussion
44
The amount of electrons required to reduce all the oxidized copper
back to metallic copper is given in Table 6.
Fig 19. Results from cathodic reduction measurements of polished
copper surfaces, irradiated and unirradiated, in water-saturated Argon.
3.1.4.2 Formation of local corrosion features during irradiation of
polished copper cubes in humid argon
Surface characterizations using SEM reveal local corrosion features
on copper surfaces irradiated in water-saturated argon. The
corrosion features are spread all over the surface and are of
different sizes and shapes. The SEM images can be seen in Figure
20 a) and b).
-1.25
-1.05
-0.85
-0.65
0 1000 2000 3000 4000 5000
E (
V)
Time (s)
Water-saturatedArgon (100 % RH)96 h
0.13 Gy/s water-saturated Argon(100 % RH) 96 h

3. Results and discussion
45
Fig 20 a) and b). SEM images of a polished copper surface irradiated in
water-saturated argon at a dose rate of 0.13 Gy·s-1 for 96 hours.
3.1.5 Humid air
Copper cubes were irradiated at dose rates of 0.1-0.3 Gy·s-1 for 96
hours in air of 60 % or 100 % RH. The water films on copper in air
of 60 % and 90 % RH consist of approximately 8 and 18
a)
b)

3. Results and discussion
46
monolayers respectively. At 100 % RH the number of monolayers
is not meaningful to measure as they increase continuously due to
condensation of the moisture.8, 9
3.1.5.1 Oxide formation during irradiation of polished copper cubes
in humid air
Surface examination of a copper cube exposed to water-saturated
air, using IRAS, can be seen in Figure 21.
Fig 21. IRAS spectrum of a copper surface irradiated at a dose rate of
0.13 Gy·s-1 in air of 100 % RH for 96 hours.
Several different peaks can be seen in the IRAS spectrum from a
copper surface irradiated in water-saturated air compared to the
IRAS spectrum of a copper surface exposed to water-saturated
argon. The peak at wavenumbers ~650 cm-1 corresponds to Cu2O55
while the peaks at wavenumbers ~1320-1440cm-1, ~3555 cm-1 and
0
0.02
0.04
0.06
500 1500 2500 3500
Ab
sorb
ance
Wavenumber (cm-1)
3. Results and discussion
47
~1590 cm-1 correspond to copper nitrates, Cu4(NO3)2(OH)6 and
Cu(NO3)2 respectively.67, 68 CuO has a wide peak close to the cutoff
frequency at wavenumbers ~520-560 cm-1 and as can be seen in
Figure 21 the presence of CuO cannot be ruled out.56
In Figure 22 an IRAS spectrum of a copper surface exposed to
gamma radiation at a dose rate of 0.14 Gy·s-1 for 96 hours in air of
60 % RH, can be seen. This spectrum is quite similar to the
spectrum in Figure 21, with the exception of the peak
corresponding to Cu2O. There is no indication of the presence of
Cu2O on the copper surface. Also the peak at wavenumbers ~1590
cm-1 corresponding to Cu(NO3)2 is smaller and wider than in the
previous spectrum. The sharp peak at wavenumber ~1050 cm-1
may correspond to a copper carbonate, Cu2(OH)2(CO3).69
An IRAS spectrum of a copper surface exposed to gamma
irradiation in air of 60 % RH at a dose rate of 0.14 Gy·s-1 for 96
hours followed by immersion in anoxic pure water under gamma
irradiation at a dose rate of 0.2 Gy·s-1 for 96 hours, is shown in
Figure 23.

3. Results and discussion
48
Fig 22. IRAS spectrum of a sample exposed to gamma radiation in air of
60 % RH at a dose rate of 0.14 Gy·s-1 for 96 hours.
Fig 23. IRAS spectrum of a copper surface irradiated at a dose rate of
0.14 Gy·s-1 in air of 60 % RH for 96 hours followed by exposure to anoxic
water under gamma radiation at a dose rate of 0.2 Gy·s-1 for 96 hours.
0
0.02
0.04
0.06
0.08
0.1
0.12
500 1500 2500 3500
Ab
sorb
ance
Wavenumber (cm-1)
0
0.05
0.1
0.15
500 1000 1500 2000
Ab
sorb
ance
Wavenumber (cm-1)

3. Results and discussion
49
The strong peak at wavenumbers ~650 cm-1 corresponds to Cu2O55
and the high intensity indicates a thick copper oxide layer present
at the surface. No signs of copper nitrates are detected and the
reason for this is probably the high solubility of copper nitrates in
water.70 The formation of Cu2O during gamma irradiation in
anoxic pure water is in agreement with earlier presented results.
The phenomenon of the formation of copper nitrates during
irradiation followed by dissolution during water exposure might be
something to take into consideration in the handling of copper
canisters for spent nuclear fuel. Copper nitrates can be formed on
the canister surface when the canister is exposed to air. If the
canister is later exposed to water the copper nitrates can be washed
off and a loss of material can occur.
Results from cathodic reduction measurements from copper
surfaces exposed to air of 60 % RH, air of 60 % RH followed by
immersion in anoxic water, irradiated in air of 60 % RH, irradiated
in air of 60 % RH followed by immersion in anoxic water and
irradiated in air of 60 % RH followed by irradiation in anoxic water
can be seen in Figure 24.

3. Results and discussion
50
Fig 24. Results from cathodic reduction measurements of polished
copper surfaces, irradiated and unirradiated, in humid air.
On both reference copper samples, exposed to air of 60 % RH for
96 hours and exposed to air followed by immersion in pure anoxic
water for 96 hours, the corrosion layers are quite thin. A
significantly thicker corrosion layer is formed on the copper cube
exposed to gamma irradiation in air of 60 % RH at a dose rate of
0.25 Gy·s-1 for 96 hours. This is most probably due to the
formation of nitric acid originating from the gamma radiolysis of
humid air.14 The thickness of the corrosion layer formed on copper
cubes exposed to gamma irradiation in air of 60 % RH followed by
immersion in anoxic pure water is similar as on copper cube
irradiated in air of 60 % RH. When exposing copper cubes to
gamma irradiation in air of 60 % RH at a dose rate of 0.14 Gy·s-1
-1.35
-1.15
-0.95
-0.75
-0.55
0 2000 4000 6000 8000
E (
V)
Time (s)
Air 96 h
Air 96 h + anox H2O 96 h
0.25 Gy_s air 96 h
0.14 Gy_s air 96 h + anoxH2O 96 h0.14 Gy_s air 96 h + 0.2 Gy_sanox H2O 96 h

3. Results and discussion
51
for 96 hours followed by irradiation in anoxic pure water at a dose
rate of 0.2 Gy·s-1 for 96 hours, the corrosion layer is even thicker
than on all previous samples. A summary of the results from
cathodic reductions is given in Table 6.
Table 6. 1) Air 60 % RH 96 h; 2) Irradiation in air 60 % RH 96 h 0.25
Gy·s-1; 3) Air 60 % RH 96 h + anoxic H2O 96 h; 4) Irradiation in air 60 %
RH 0.14 Gy·s-1 96 h + anoxic H2O 96 h; 5) Irradiation in air 60 % RH 0.14
Gy·s-1 96 h + irradiation in anoxic H2O 0.2 Gy·s-1 96 h; 6) Water-saturated
argon 96 h; 7) Irradiation in water-saturated argon 96 h 0.13 Gy·s-1; 8)
Water-saturated air 96 h; 9) Irradiation in water-saturated air 96 h 0.13
Gy·s-1;
Experimental conditions
1) 2) 3) 4) 5) 6) 7) 8) 9)
Amount of e- required to reduce Cu(ox) to Cu0 (µmol·cm-2)
0.25 2.3 0.27 2.1 3.8 0.29 2.3 0.4 2.9
The radiation induced corrosion of copper is more efficient in
humid atmosphere than in bulk water. The amount of oxidized
copper after irradiation in water-saturated argon is several times
higher than after irradiation in anoxic water. This can be explained
to some extent if considering the HO· to be the main oxidant, as
proposed in previous section. Due to the high reactivity of the HO·
it can only diffuse a very short distance before it is consumed and
therefore it will never take part in surface reactions if produced in
bulk water. By less shielding due to the absence of bulk water
more energy can be absorbed by the thin water film on the copper

3. Results and discussion
52
surface. Also fewer amounts of stable molecular radiolysis
products, such as H2O2, will accumulate in a thin water film than in
bulk water e.g. less scavenging of HO· by H2O2 will occur. Another
reason why H2O2 might decrease the rate of oxidation of copper is
that H2O2 can occupy sites on the surface during catalytic
decomposition preventing HO· to reach the surface. Only a small
contribution to the oxidation of copper comes from H2O2, most of
it is consumed by catalytic decomposition or solution reactions.62
This might explain the increased efficiency of radiation induced
corrosion of copper in water-saturated argon compared to
radiation induced corrosion of copper in anoxic pure water. The
rate of corrosion will probably increase with increasing water film
thickness up to a certain point corresponding to a very thin water
film. Beyond this point the HO· produced in the water film will no
longer be able to reach the copper surface.
In Figure 25 SEM images of two copper surfaces can be seen.
Copper cubes were exposed to gamma irradiation at a dose rate of
0.25 Gy·s-1 for 96 hours in air and to gamma irradiation at a dose
rate of 0.16 Gy·s-1 for 96 hours followed by immersion in anoxic
pure water for 96 hours.

3. Results and discussion
53
Fig 25 a) and b). SEM images of a) a copper surface irradiated at a dose
rate of 0.25 Gy·s-1 for 96 hours in air and b) a copper surface irradiated in
air at followed by exposure to anoxic water.
When comparing the two images it can be noted that the copper
surface in image a) looks quite homogeneous whiles the copper
surface in image b) looks more heterogeneous. In both SEM
a)
b)

3. Results and discussion
54
images small pits and particles can be seen together with markings
from polishing. The more heterogeneous appearance of the copper
surface in Figure 25 b) might be caused by dissolution of copper
nitrates, formed under irradiation in humid air, during the
exposure to water.
As a complement to the SEM images AFM surface profiles were
used to confirm the presence of pits and particles on the copper
surface. Figure 26 shows an AFM surface profile following one of
the lines from polishing over an area with what appears to be pits
in the surface. The profile shows small pits of approximately 0.05–
0.1 µm depth.
Fig 26. AFM image and surface profile of small pits in a copper surface
irradiated at a dose rate of 0.11 Gy·s-1 for 96 hours in air of 60 % RH.
In Figure 27 surface profiles crossing over two particles on the
copper surface are shown. The heights of the particles are
approximately 0.5-0.7 µm.

3. Results and discussion
55
Fig 27. AFM image and surface profiles of particles on a copper surface
irradiated at a dose rate of 0.11 Gy·s-1 for 96 hours in air of 60 % RH
The concentration of copper in solution was measured using ICP-
OES and the results are presented in Figure 28.
Fig 28. Concentration of copper in solution. 1) Oxidation in air for 96
hours followed by exposure to anoxic pure H2O for 96 hours; 2) γ-
irradiation in air for 96 hours, 0.1 Gy·s-1, followed by exposure to anoxic
pure H2O for 96 hours; 3) γ-irradiation in air for 96 hours, 0.14 Gy·s-1,
followed by exposure to γ-irradiation in anoxic pure H2O for 96 hours, 0.2
Gy·s-1.
0
10
20
30
40
50
60
70
1 2 3
Co
nce
ntr
atio
n o
f co
pp
er
in s
olu
tio
n (
µM
)

3. Results and discussion
56
When a copper cube was first irradiated at a dose rate of 0.14 Gy·s-1
for 96 hours in air of 60 % RH followed by irradiation at a dose
rate of 0.2 Gy·s-1 for 96 hours in 10 ml of anoxic pure water, the
concentration of copper in solution was approximately 65 µM
(solution 3 in Figure 28). The concentration of copper in
unirradiated solutions (solution 1 and 2 in Figure 28) was only 0.5-
5 µM. The concentration of copper in solution 2 might originate
from dissolved copper nitrates.
3.2 Kinetics and mechanisms between H2O2 and copper and
copper oxides
To further understand the interfacial processes between copper
and the stable radiolysis product, H2O2, the consumption of H2O2
in the presence of metallic copper and copper oxides were studied.
Also the formation of formaldehyde (CH2O) from the reaction
between methanol (CH3OH) and HO· was studied. The
concentration of copper in solution was measured using ICP-OES
after the consumption of H2O2 was complete. From XPS-
measurements presented in a previous section, Cu2O is expected to
be the main corrosion product forming on metallic copper powder
during the reaction with H2O2.
3.2.1 Kinetics of the reactions between H2O2 and copper and
copper oxides
The consumption of H2O2 on various amounts of metallic copper
powder (Cu-powder), Cu2O-powder and CuO-powder was
monitored using spectrophotometry as a function of reaction time.

3. Results and discussion
57
Initial experimental conditions were 50 ml of 0.5 mM of H2O2 of
ambient temperature, with continuous N2 purging. The pH for all
solutions was approximately 6 before, during and after the
reactions. In Figure 29 – 31, the concentration of H2O2 as a
function of reaction time is given for reactions with Cu-powder,
Cu2O-powder and CuO-powder.
As can be seen in Figures 29-31 the rate of consumption of H2O2 is
increasing with increasing amount of powders. To be able to
compare the reactivity towards H2O2 of the three powders, the
second-order rate constants (k2 (m·s-1)) are determined. The
slopes, of the first-order rate constants for the reactions between
H2O2 and the three powders plotted against solid surface-area-to-
solution-volume ratios, are calculated to obtain the second-order
rate constants.
Fig 29. The concentration of H2O2 as a function of reaction time on Cu-
powder. © The Royal Society of Chemistry 2015
0
0.1
0.2
0.3
0.4
0.5
0 1 000 2 000 3 000 4 000 5 000
[H2O
2]
(mM
)
Time (s)
Cu-powder
1.5 g 1 g 0.5 g 0.125 g

3. Results and discussion
58
Fig 30. The concentration of H2O2 as a function of reaction time on Cu2O-
powder. © The Royal Society of Chemistry 2015
Fig 31. The concentration of H2O2 as a function of reaction time on CuO-
powder. © The Royal Society of Chemistry 2015
0
0.1
0.2
0.3
0.4
0.5
0 500 1000 1500 2000 2500 3000
[H2O
2]
(mM
)
Time (s)
Cu2O
0.105 g 0.079 g 0.059 g 0.044 g 0.018 g
0
0.05
0.1
0.15
0.2
0.25
0.3
0.35
0.4
0.45
0.5
0 500 1000 1500 2000 2500 3000
[H2O
2]
(mM
)
Time (s)
CuO
0.054 g 0.037 g 0.021 g 0.011 g

3. Results and discussion
59
Admittedly, the reaction order of the reactions presented in
Figures 29-31 is not always one and to circumvent this problem,
only the initial parts of the plots are used for determination of the
first-order rate constants.
In Figure 32, the first-order rate constants for the reactions
between H2O2 and Cu-, Cu2O- and CuO-powder are plotted against
solid surface-area-to-solution-volume ratios. The slopes of the
three curves are calculated to obtain the second-order rate
constants. Judging from Figure 32, Cu2O is the powder which
displays the highest reactivity towards H2O2.
Fig 32. First-order rate constants (k1 (s-1)) as a function of solid surface-
area-to-solution-volume ratios. © The Royal Society of Chemistry 2015
0
0.001
0.002
0.003
0.004
0.005
0 5000 10000 15000 20000
k 1(s
-1)
SA/V (m-1)
Cu-powder Cu2O CuO
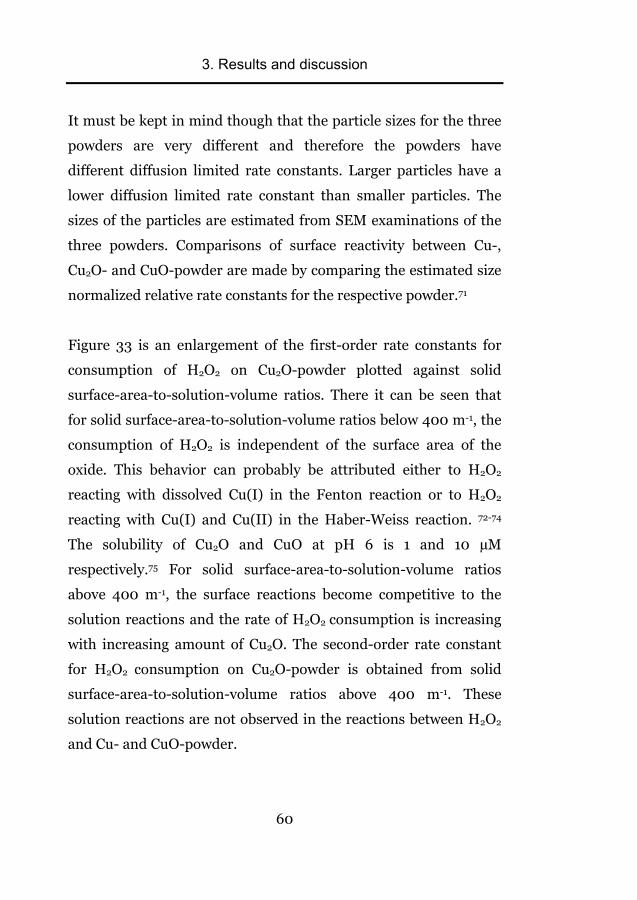
3. Results and discussion
60
It must be kept in mind though that the particle sizes for the three
powders are very different and therefore the powders have
different diffusion limited rate constants. Larger particles have a
lower diffusion limited rate constant than smaller particles. The
sizes of the particles are estimated from SEM examinations of the
three powders. Comparisons of surface reactivity between Cu-,
Cu2O- and CuO-powder are made by comparing the estimated size
normalized relative rate constants for the respective powder.71
Figure 33 is an enlargement of the first-order rate constants for
consumption of H2O2 on Cu2O-powder plotted against solid
surface-area-to-solution-volume ratios. There it can be seen that
for solid surface-area-to-solution-volume ratios below 400 m-1, the
consumption of H2O2 is independent of the surface area of the
oxide. This behavior can probably be attributed either to H2O2
reacting with dissolved Cu(I) in the Fenton reaction or to H2O2
reacting with Cu(I) and Cu(II) in the Haber-Weiss reaction. 72-74
The solubility of Cu2O and CuO at pH 6 is 1 and 10 µM
respectively.75 For solid surface-area-to-solution-volume ratios
above 400 m-1, the surface reactions become competitive to the
solution reactions and the rate of H2O2 consumption is increasing
with increasing amount of Cu2O. The second-order rate constant
for H2O2 consumption on Cu2O-powder is obtained from solid
surface-area-to-solution-volume ratios above 400 m-1. These
solution reactions are not observed in the reactions between H2O2
and Cu- and CuO-powder.

3. Results and discussion
61
Fig 33. An enlargement of the first-order rate constants k1 (s-1) for
consumption of H2O2 on Cu2O-powder plotted against solid surface-area-
to-solution-volume ratios. © The Royal Society of Chemistry 2015
The diffusion limited rate constant for a reaction between
reactants in a solution and reactants at a particle surface is
inversely proportional to the particle size. By multiplying the
second-order rate constants, calculated from the slopes of the plots
in Figure 32, with each particle size and comparing them with each
other, the estimated size normalized relative rate constants are
obtained.71 In Table 7 the constants are given together with powder
characteristics. It can be concluded that CuO is less reactive
towards H2O2 than Cu and Cu2O. Cu2O appears to be the most
reactive of the three powders. This is most probably due to the fact
that H2O2 is catalytically decomposed on CuO, while on Cu-powder
and Cu2O, electron-transfer is an additional possibility.
0.000
0.001
0.002
0.003
0.004
0.005
0 200 400 600 800 1000
k 1(s
-1)
SA/V (m-1)
Cu2O

3. Results and discussion
62
Table 7. 2nd-order rate constants, k2 (m·s-1), and the estimated size
normalized relative rate constants (Arb.) for the consumption of H2O2 on
Cu-, Cu2O- and CuO-powder. Also B.E.T.-surface areas (m2·g-1) and
estimated particle sizes (µm) are presented. © The Royal Society of
Chemistry 2015
Powders
Estimated particle
size (µm)
B.E.T.-surface area
(m2·g-1)
2nd-order rate constant, k2
(m·s-1)
Estimated sizenormalized rateconstant (Arb.)
Cu 10-100 0.1 (2.2±0.6)·10-7 100-1000Cu2O 0.5-15 0.5 (5.8±0.8)·10-6 130-4000CuO 0.1-10 17.9 (2.2±0.3)·10-7 1-100
3.2.2 Mechanisms of the reactions between H2O2 and copper and
copper oxides
CH3OH was used as a radical scavenger to quantify the impact of
catalytic decomposition of H2O2 on Cu-, Cu2O- and CuO-powder.
The amount of CH2O formed in the reaction between HO· and
CH3OH can be determined by spectrophotometry. When H2O2 is
consumed on the surface of CuO-powder the only pathway for
H2O2 to react is via catalytic decomposition. The other two
powders can also be oxidized by H2O2. The yield of CH2O from
CH3OH and HO· under homogeneous anoxic conditions is only 14
%34 and therefore the concentrations of CH2O detected in this work
are expected to be quite low. In Figure 34-36 the production of
CH2O and the consumption of H2O2 are plotted against reaction
time. The solid surface-area-to-solution-volume ratios are the
same for all three powders, 4600 ± 200 m-1.

3. Results and discussion
63
Fig 34. The consumption of H2O2 and the production of CH2O as a
function of reaction time for Cu-powder. © The Royal Society of
Chemistry 2015
Fig 35. The consumption of H2O2 and the production of CH2O as a
function of reaction time for Cu2O-powder. © The Royal Society of
Chemistry 2015
0
0.05
0.1
0.15
0.2
0
1
2
3
4
5
6
0 1000 2000 3000 4000 5000
[CH
2 O] (m
M)[H
2O
2]
(mM
)
Time (s)
Cu
H2O2 CH2O
0
0.01
0.02
0.03
0.04
0.05
0.06
0.07
0
1
2
3
4
5
6
0 500 1000 1500 2000 2500 3000
[CH
2 O] (m
M)[H
2O
2]
(mM
)
Time (s)
Cu2O
H2O2 CH2O

3. Results and discussion
64
Fig 36. The consumption of H2O2 and the production of CH2O as a
function of reaction time for CuO-powder. © The Royal Society of
Chemistry 2015
As expected, it can be seen that the yield of CH2O is clearly highest
for CuO because the only pathway for H2O2 consumption is trough
catalytic decomposition. The lower yield of CH2O for Cu and Cu2O
is probably due to the competition between surface reactions and
solution reactions.
3.2.3 Reactions between H2O2 and copper cubes
XPS-measurements show that the main corrosion product formed
on a copper cube after exposure to H2O2 is Cu2O with only a small
contribution from CuO.54 Cu2O will be the oxide closest to the
copper metal with CuO on top. In Figure 37 the consumption of
0
0.1
0.2
0.3
0.4
0.5
0.6
0.7
0
1
2
3
4
5
6
0 5000 10000 15000 20000 25000
[CH
2 O] (m
M)[H
2O
2]
(mM
)
Time (s)
CuO
H2O2 CH2O

3. Results and discussion
65
H2O2 and the production of CH2O from the reactions between
H2O2 and copper cubes are given. The reactions are monitored
both for polished copper cubes and pre-oxidized (by 10 ml of 2.5
mM H2O2) copper cubes. The solid surface-area-to-solution-
volume ratios are «400 m-1 in the reactions with copper cubes.
Therefore the consumption of H2O2 should be governed mainly by
solution Fenton- or Haber-Weiss-reactions. Hence, the results
given in Figure 37 can only be attributed to surface reactivity to a
small extent.
Fig 37. The consumption of H2O2 and the production of CH2O as a
function of reaction time for copper cubes. © The Royal Society of
Chemistry 2015
It can be seen that the consumption of H2O2 on the pre-oxidized
copper cube is slightly faster than on the polished copper cube.
This is probably due to a larger surface area and immediate
0
0.04
0.08
0.12
0.16
0.2
0 20000 40000 60000
[CH
2O
] (m
M)
Time (s)
0
1
2
3
4
5
0 20000 40000 60000
[H2O
2]
(mM
)
Time (s)
Polished Cu-cube Pre-oxidized Cu-cube

3. Results and discussion
66
dissolution of copper ions from the already present oxide layer.
Also the yield of CH2O is higher for the pre-oxidized copper cube
and this too can probably be attributed to the presence of the oxide
layer from the very beginning.
As already mentioned in a previous section, when measuring the
concentration of copper in solution after 50 ml of 0.5 mM of H2O2
was consumed on a polished copper cube, it is not at all in
agreement with the concentrations of copper in solution after
copper cubes were exposed to gamma irradiation in anoxic pure
water. Consequently, the H2O2 produced in gamma radiolysis
cannot be the responsible oxidant for the radiation enhanced
corrosion of copper. In the mechanistic study when using CH3OH
as a radical scavenger it is proved that HO· species are formed in
the unirradiated system with H2O2 and copper. Hence, this system
should provide an environment similar as the one occurring during
irradiations of copper in anoxic water. Still, it is obvious that the
surface bound HO· species formed from catalytic decomposition of
H2O2 do not influence the release of copper into solution as
observed in irradiated systems.
3.3 Direct impact of radiation induced corrosion of copper on
the integrity of copper canisters for spent nuclear fuel storage
Oxidation of copper in aqueous environment during exposure to
total gamma doses, equivalent to the total doses expected to be
absorbed by an outer canister surface during the initial hundred
years in a deep repository, will not directly threaten the integrity of

3. Results and discussion
67
the canister. Average oxide layer thicknesses between 0.5 and 1 µm
were obtained after irradiations of copper in humid air, humid
argon and anoxic water. Also local corrosion features with pit
depths of 0.8-0.9 µm were detected after irradiations in anoxic
water.
A dose rate dependence was discovered where a lower dose rate
during longer irradiation times, gives a higher yield of copper in
solution, compared to a higher dose rate and shorter irradiation
time, ending up at the same total dose. The dose rates expected on
an outer copper canister surface in a repository for spent nuclear
fuel are 10 000 times lower and the radiation exposure times will
be 10 000 times longer, compared to the conditions in this work.
Interactions between the process of radiation induced corrosion of
copper and other copper corrosion processes, such as corrosion by
sulfur, atmospheric corrosion, stress corrosion or microbial
corrosion, are not taken into consideration in this work.

4. Conclusions
68
4. Conclusions
• Gamma irradiated copper samples are always significantly
more corroded than corresponding reference samples.
• Exposure of polished copper samples to gamma radiation
in anoxic pure water enhances the corrosion process by
several hundred times compared to what is expected from
the formation of oxidative radiolysis products.
• No enhanced corrosion of copper is observed when
exposing copper samples to hydrogen peroxide. The
hydroxyl radical species formed on copper oxide surfaces
from decomposition of hydrogen peroxide does not
influence the release of copper into solution.
• If the polished copper sample is covered by a thin water
film the radiation induced corrosion process is more
efficient than if the polished copper sample is submerged in
water.
• The main corrosion product formed during gamma
irradiation of copper in anoxic pure water is Cu2O together
with a small amount of CuO. During exposure of copper to
gamma radiation in humid air also copper nitrates are
formed.
• Exposure of pre-oxidized copper samples to gamma
radiation in anoxic pure water enhances the corrosion
process further. Both the oxide growth and the release of
copper into solution are greater on pre-oxidized copper
samples compared to polished copper samples.

4. Conclusions
69
• The main part of the oxidized copper is present as an oxide
layer on the copper surface and a minor part is released
into the aqueous environment.
• Both the concentration of copper in solution and amount of
oxidized copper after exposure of copper to gamma
radiation is increasing with increasing absorbed total dose.
There is a dose rate dependence for the release of copper
into solution where a lower dose rate during a longer
irradiation time gives a slightly higher amount of copper in
solution compared to a higher dose rate during a shorter
time to reach the same absorbed total dose.
• A suggested mechanism behind the radiation induced
corrosion of copper is attributed to interactions between
hydroxyl radicals and the copper oxide on the copper metal
surface. The result is a greatly increased relative surface
area and enhanced G-values for hydroxyl radicals at the
copper oxide surface.
• The process of radiation induced corrosion of copper in
aqueous environment, where the total doses absorbed by
copper are equivalent to the total doses expected to be
absorbed by the outer canister surfaces during the initial
hundred years in a deep repository, is not a direct threat to
the integrity of a copper canister for spent nuclear fuel
storage.

5. Future work
70
5. Future work
Based on the results from this study of radiation induced corrosion
of copper in anoxic pure water and humid air and argon, some
further studies are suggested.
One type of copper was used in this study. It would be interesting
to do similar experiments using different purities of copper.
Copper metal become oxidized immediately when in contact with
oxygen and therefore further experiments of radiation exposures of
pre-oxidized copper samples in humid air and argon will provide
data more applicable to reality. Also irradiations of copper in
solutions containing chloride, sulfur and carbonates would provide
data more related to a deep geologic repository for spent nuclear
fuel where copper will be in contact with groundwater.

6. List of abbreviations
71
6. List of abbreviations
Ads. – Adsorbed
AFM – Atomic force microscopy
Arb. – Arbitrary unit
AS – Solid surface area
BE – Binding energy
B.E.T. – Brunauer-Emmert-Teller
BWR – Boiling water reactor
D – Absorbed total dose (Gy)
E° - Standard reduction potential (V)
G(x) (or G-value) – Radiation chemical yield of product x (mol·J-1)
Gy – Gray (J·kg-1)
ICP-OES – Inductively coupled plasma-optical emission
spectroscopy
IRAS – Infrared reflection absorption spectrometry
k1 – First-order reaction rate constant
k2 – Second-order reaction rate constant
PWR – Pressurized water reactor
RH – Relative humidity
SCE – Saturated calomel electrode
SEM – Scanning electron microscopy
UV-Vis – Ultraviolet – visible
XPS – X-ray photoelectron spectroscopy

7. Acknowledgements
72
7. Acknowledgements
The Swedish Nuclear Fuel and Waste Management Co., SKB AB is
gratefully acknowledged for financial support.
To both my supervisors, Prof. Mats Jonsson and Prof. Christofer
Leygraf, who have been very encouraging, supportive and
enthusiastic throughout this project.
To all my colleagues at Nuclear Chemistry: Karin, Claudio,
Veronica, Yang, Martin, Sara, Alex, Björn, Helena, Mats, Susanna,
Johan, Gabor, Inna, Kristina, Annika and Elin. We’ve had a lot of
fun together!
To my collaborators: Saman, Magnus, Yang, Maddo, Claudia, Billie
and Mark. Thank you for the scientific input and the interesting
discussions.
To all my friends: you know who you are!
To my family: Thank you for always being there for me.
To Henrik: You are my team mate, computer technician, chef, dry
cleaner, concert buddy, cat-daddy, photographer, travel
companion and best friend.

8. References
73
8. References
1 www.world-nuclear.org, World Nuclear Association, (accessed 9th of October, 2015).
2 SKB, Long-term safety for the final repository for spent nuclear fuel at Forsmark. Main report of the SR-Site project., Report TR-11-01, Swedish Nuclear Fuel and Waste Management Co., Stockholm, 2011.
3 SKB, An update of the state-of-the-art report on the corrosion of copper under expected conditions in a deep geologic repository, Report TR-10-67, Swedish Nuclear Fuel and Waste Management Co., Stockholm, 2010.
4 SKB, Design, production and initial state of the canister, Report TR-10-14, Swedish Nuclear Fuel and Waste Management Co., Stockholm, 2010.
5 SKB, Corrosion calculations report for the safety assessment SR-site, Report TR-10-66, Swedish Nuclear Fuel and Waste Management Co., Stockholm, 2010.
6 SKB, Spent nuclear fuel for disposal in the KBS-3 repository, Report TR-10-13, Swedish Nuclear Fuel and Waste management Co., Stockholm, 2010.
7 F. King, L. Ahonen, C. Taxén, U. Vuorinen and L. Werme, Copper corrosion under expected conditions in a deep geologic repository, Report TR-01-23, Swedish Nuclear Fuel and Waste Management Co., Stockholm, 2001.
8 J. Dante and R. Kelly, Journal of The Electrochemical Society, 1993, 140, 1890-1897.
9 S. Lee and R. Staehle, Corrosion, 1997, 53, 33-42. 10 K. P. FitzGerald, J. Nairn, G. Skennerton and A. Atrens, Corrosion
Science, 2006, 48, 2480-2509. 11 Y. Feng, K.-S. Siow, W.-K. Teo, K.-L. Tan and A.-K. Hsieh,
Corrosion, 1997, 53, 389-398. 12 D. A. Palmer, Journal of solution chemistry, 2011, 40, 1067-1093. 13 F. Samie, J. Tidblad, V. Kucera and C. Leygraf, Atmospheric
Environment, 2006, 40, 3631-3639. 14 G. R. Choppin, J. O. Liljenzin and J. Rydberg, Radiochemistry and
nuclear chemistry, Butterworth-Heinemann, Oxford, U.K., 2nd edn., 1995.
15 J. W. T. Spinks and R. J. Woods, An introduction to radiation chemistry, Wiley, 1990.
16 M. Jonsson, in Recent Trends in Radiation Chemistry eds. J. F. Wishart and B. S. M. Rao, World Scientific Publishing Co. Pte. Ltd., Singapore, 2010, p. 301.
17 T. Schatz, A. R. Cook and D. Meisel, The Journal of Physical Chemistry B, 1998, 102, 7225-7230.

8. References
74
18 N. M. Dimitrijevic, A. Henglein and D. Meisel, The Journal of Physical Chemistry B, 1999, 103, 7073-7076.
19 N. G. Petrik, A. B. Alexandrov and A. I. Vall, The Journal of Physical Chemistry B, 2001, 105, 5935-5944.
20 E. Chelnokov, V. Cuba, D. Simeone, J. M. Guigner, U. Schmidhammer, M. Mostafavi and S. Le Caër, The Journal of Physical Chemistry C, 2014, 118, 7865-7873.
21 J. A. LaVerne and L. Tandon, The Journal of Physical Chemistry B, 2003, 107, 13623-13628.
22 E. Ekeroth, O. Roth and M. Jonsson, Journal of Nuclear Materials, 2006, 355, 38-46.
23 R. R. Conry, in Encyclopedia of Inorganic Chemistry, ed. R. B. King, Wiley, New York, Second edn., 2005, pp. 940-958.
24 W. H. Koppenol and J. F. Liebman, Journal of Physical Chemistry, 1984, 88, 99-101.
25 F. A. Cotton and G. Wilkinson, Advanced inorganic chemistry, Wiley Interscience, New York, 3rd edn., 1972.
26 O. Roth and M. Jonsson, cent.eur.j.chem., 2008, 6, 1-14. 27 C. M. Lousada and M. Jonsson, Journal of Physical Chemistry C, 2010,
114, 11202-11208. 28 C. M. Lousada, A. J. Johansson, T. Brinck and M. Jonsson, The Journal
of Physical Chemistry C, 2012, 116, 9533-9543. 29 C. M. Lousada, M. Trummer and M. Jonsson, Journal of Nuclear
Materials, 2013, 434, 434-439. 30 A. Hiroki and J. A. LaVerne, Journal of Physical Chemistry B, 2005,
109, 3364-3370. 31 V. M. Goldschmidt, Naturwissenschaften, 1932, 20, 947-948. 32 A. Monod, A. Chebbi, R. Durand-Jolibois and P. Carlier, Atmospheric
Environment, 2000, 34, 5283-5294. 33 H. A. Headlam and M. J. Davies, Free Radical Biology and Medicine,
2002, 32, 1171-1184. 34 M. Yang and M. Jonsson, The Journal of Physical Chemistry C, 2014,
118, 7971-7979. 35 K. D. Asmus, H. Moeckel and A. Henglein, The Journal of Physical
Chemistry, 1973, 77, 1218-1221. 36 D. W. Johnson and G. A. Salmon, Journal of the Chemical Society,
Faraday Transactions 1: Physical Chemistry in Condensed Phases, 1975, 71, 583-591.
37 D. Meyerstein and H. A. Schwarz, Journal of the Chemical Society, Faraday Transactions 1: Physical Chemistry in Condensed Phases, 1988, 84, 2933-2949.
38 Q. Li, P. Sritharathikhun and S. Motomizu, Analytical Sciences, 2007, 23, 413-417.

8. References
75
39 K. Kishore, P. N. Moorthy and K. N. Rao, International Journal of Radiation Applications and Instrumentation. Part C. Radiation Physics and Chemistry, 1987, 29, 309-313.
40 M. Masarwa, H. Cohen, D. Meyerstein, D. L. Hickman, A. Bakac and J. H. Espenson, Journal of the American Chemical Society, 1988, 110, 4293-4297.
41 I. Rusonik, H. Polat, H. Cohen and D. Meyerstein, European Journal of Inorganic Chemistry, 2003, 2003, 4227-4233.
42 J. P. Simpson, Experiments on container materials for Swiss high-level waste disposal projects. Part II, Report Nagra Technical Report 84-01, National Cooperative for the Disposal of Radioactive Waste, Wettingen, 1984.
43 C. Corbel, in Prediction of Long Term Corrosion Behaviour in Nuclear Waste Systems, eds. D. D. Macdonald and D. Féron, Maney Publishing, London 2003, p. 484.
44 C. D. Litke and F. King, The corrosion of copper in synthetic groundwater at 150 C. Part 1. The results of short term electrochemical tests, Report Technical record TR-428, Atomic Energy of Canada Limited, Ontario, 1987.
45 D. T. Reed, V. Swayambunathan, B. S. Tani and R. A. Van Konynenburg, Materials Research Society Symposium Proceedings, 1990, 176, Medium: ED; Size: Pages: (16 p).
46 D. T. Reed and R. A. Van Konynenburg, Materials Research Society Symposium Proceedings, 1991, 212, Medium: ED; Size: 11 p.
47 W. H. Yunker and R. S. Glass, in Scientific basis for nuclear waste management X: symposium held in Boston, Massachusetts, USA, 1-4 December 1986., eds. J. K. Bates and W. B. Seefeldt, PA: Materials Research Society, Pittsburgh, 1986, pp. 579-590.
48 N. G. Petrik, M. N. Petrov and V. G. Fomin, High Energy Chem., 1997, 31, 308-311.
49 B. M. Carver, D. V. Hanley and K. R. Chaplin, Maksima-Chemist - a Program For Mass Action Kinetics Simulation by Automatic Chemical Equation Manipulation and Integration Using Stiff Techniques, Chalk River Nuclear Laboratories, Ontario, 1979.
50 E. A. B. Ross, B. H. J. Bielski, G. V. Buxton, D. E. Cabelli, C. L. Greenstock, W. P. Helman, R. E. Huie, J. Grodkowski and P. Neta, Journal, 1992.
51 H. Fricke and E. J. Hart, in Radiation Dosimetry, eds. F. H. Attix and W. C. Roesch, Academic Press, New York, 2nd edn., 1966, vol. II, ch. 12, pp. 167-239.
52 ASTM B825 - 13, Standard Test Method for Coulometric Reduction of Surface Films on Metallic Test Samples, American Society for Testing and Materials, West Consohocken, PA, USA, 2013.

8. References
76
53 D. L. Perry, Handbook of Inorganic Compounds, Second Edition, Taylor & Francis, 2011.
54 Å. Björkbacka, S. Hosseinpour, M. Johnson, C. Leygraf and M. Jonsson, Radiation Physics and Chemistry, 2013, 92, 80-86.
55 B. Lefez, R. Souchet, K. Kartouni and M. Lenglet, Thin Solid Films, 1995, 268, 45-48.
56 G. W. Poling, Journal of The Electrochemical Society, 1969, 116, 958-963.
57 C. D. Wagner, A. V. Naumkin, A. Kraut-Vass, J. W. Allison, C. J. Powell and J. R. J. Rumble, NIST Standard Reference Database 20, Version 3.4 (web version), 2003.
58 Å. Björkbacka, S. Hosseinpour, C. Leygraf and M. Jonsson, Electrochemical and Solid-State Letters, 2012, 15, C5-C7.
59 J. A. Duffy, Bonding, energy levels, and bands in inorganic solids, Longman Scientific & Technical, New york, 1990.
60 C. B. Breslin and D. D. Macdonald, Electrochimica Acta, 1998, 44, 643-651.
61 Y.-Y. Su, S. Nakayama and T. Osakai, corrrev, 2011, 29, 51. 62 Å. Bjorkbacka, M. Yang, C. Gasparrini, C. Leygraf and M. Jonsson,
Dalton Transactions, 2015, 44, 16045-16051. 63 R. Musat, S. Moreau, F. Poidevin, M. H. Mathon, S. Pommeret and J. P.
Renault, Physical Chemistry Chemical Physics, 2010, 12, 12868-12874. 64 S. Le Caër, J. P. Renault and J. C. Mialocq, Chemical Physics Letters,
2007, 450, 91-95. 65 S. Moreau, M. Fenart and J. P. Renault, Corrosion Science, 2014, 83,
255-260. 66 S. C. Reiff and J. A. LaVerne, The Journal of Physical Chemistry C,
2015, 119, 8821-8828. 67 F. A. Miller and C. H. Wilkins, Analytical Chemistry, 1952, 24, 1253-
1294. 68 E. A. Secco and G. G. Worth, Canadian Journal of Chemistry, 1987,
65, 2504-2508. 69 R. A. Nyquist and R. O. Kagel, Infrared Spectra of Inorganic
Compounds (3800-45cm−1), Academic Press, 1971. 70 H. W. Richardson, Handbook of Copper Compounds and Applications,
Taylor & Francis, 1997. 71 R. Astumian and Z. Schelly, Journal of the American Chemical Society,
1984, 106, 304-308. 72 P. Wardman and L. P. Candeias, Radiation Research, 1996, 145, 523-
531. 73 R. A. Sheldon and J. K. Kochi, in Metal-catalyzed Oxidations of
Organic Compounds, ed. R. A. S. K. Kochi, Academic Press, 1981, pp. 33-70.

8. References
77
74 I. C. M. S. Santos, F. A. A. Paz, M. M. Q. Simões, M. G. P. M. S. Neves, J. A. S. Cavaleiro, J. Klinowski and A. M. V. Cavaleiro, Applied Catalysis A: General, 2008, 351, 166-173.
75 D. A. Palmer, P. Benezeth and J. M. Simonson, in Water, steam and aqueous solutions for electric power: Advances in science and technology. Proc. 14th Int. Conf. on the Properties of Water and Steam, 29 August–3 September 2003, eds. M. Nakahara, N. Matubayasi, M. Ueno, K. Yasuoka and K. Watanabe, Kyoto, Japan, 2004 (2005), pp. 491–496.