radiative heat transfer for pools of ethanol and cask ... · the low burning rate and surface...
TRANSCRIPT
Measurements of burning rate and radiative heat transfer for pools of ethanol and cask-strength whisky
Prepared by the Health and Safety Executive
RR1144 Research Report

© Crown copyright 2019 Prepared 2019 First published 2019 You may reuse this information (not including logos) free of charge in any format or medium, under the terms of the Open Government Licence. To view the licence visit www.nationalarchives.gov.uk/doc/open-government-licence/, write to the Information Policy Team, The National Archives, Kew, London TW9 4DU, or email [email protected]. Some images and illustrations may not be owned by the Crown so cannot be reproduced without permission of the copyright owner. Enquiries should be sent to [email protected]. This report and the work it describes were funded by the Health and Safety Executive (HSE). Its contents, including any opinions and/or conclusions expressed, are those of the authors alone and do not necessarily reflect HSE policy.
Large storage sites for alcoholic spirits are regulated under the COMAH Regulations by HSE, and the site operators require Hazardous Substance Consent to permit them to store these flammable liquids. HSE needs to consider the magnitude and extent of harm to people from potential incidents involving these substances, including that caused by thermal radiation from spirit fires. Data from scientific sources on the thermal output of fires involving ethanol is limited, reporting high strength ethanol only. This is not representative of fires in industry involving spirit beverages with a range of alcohol by volume (ABV) strengths in large pools, suggesting that use of this sparse data could lead to overly conservative results in the estimation of harm from potential events. To address this, fire specialists at HSE’s laboratory carried out a range of pool fire tests with pool areas up to 16 m² of various ethanol/water mixtures and waste whisky, which was supplied by the Scotch Whisky Association. The data collected from these tests will assist HSE in producing more appropriate, lower estimates of harm from spirit fires. It may also assist risk management by companies in the alcoholic beverage sector and specialist consultants they may engage.
2
Lorem ipsum dolor sit amet consectetuer adipiscing elit
Graham Atkinson Health and Safety Executive Harpur Hill Buxton Derbyshire SK17 9JN
Measurements of burning rate and radiative heat transfer for pools of ethanol and cask-strength whisky
3

4
KEY MESSAGES
Large storage sites for alcoholic spirits are regulated under the Control of Major Hazards (COMAH)
Regulations by HSE, and site operators require Hazardous Substance Consent (HSC) to permit them
to store these flammable liquids. When providing advice on HSC and when considering COMAH
demonstrations HSE needs to assess the magnitude and extent of harm to people from potential
incidents from these substances, including that caused by thermal radiation from spirit fires. Reliable
experimental data on the combustion characteristics of cask strength whisky spirit are important in
the proper assessment of risk around large storage sites.
HSE uses a mathematical model known as POOLFIRE6 for such assessments. The model uses input
data for ethanol based on very small test fires; there were no specific data available for assessment
of whisky spirit. The model is designed to provide conservative estimates of the intensity of whisky
fires in terms of energy radiated: in other words, the model errs on the side of caution and may
overestimate the intensity of potential fires.
This report describes a programme of experimental pool fire tests which was undertaken with the
aim of providing data that can be used to improve the reliability of assessments of the consequences
of alcohol and whisky spirit fires. The fire tests used pure ethanol, ethanol-water mixtures, and
waste whisky spirit for three pool fire sizes with area: 0.355, 4 and 16 metres2. The data was
analysed and compared to estimates from the POOLFIRE6 model. The analysis also used data from
much larger Swedish ‘ETANKFIRE’ tests on 97% ethanol/3% gasoline which were published in 2015.
Overall, the experiments confirm that the POOLFIRE6 model errs on the side of caution and may
overestimate the energy radiated in potential fires. The new experimental data from these tests will
assist HSE in producing more appropriate, lower estimates of potential harm from spirit fires.
Detailed findings include:
For pure ethanol fires, the POOLFIRE6 model gives good results for radiation in the far field
and is somewhat conservative closer to the flame.
The observed burning rates on cask strength whisky fires were about 2.5 times lower than
for 100% ethanol pools of a similar size. The surface emissive power was also less than half
that observed for 100% ethanol. These test findings only apply to large unconfined releases
of cask strength whisky burning outdoors as a large pool unaffected by any other
combustible material. Other fire situations involving this material (e.g. inside maturation
warehouses) are more complex because they might include burning casks or burning
building materials.
5
EXECUTIVE SUMMARY
Background
Large storage sites for alcoholic spirits are regulated under the Control of Major Hazards (COMAH)
Regulations by HSE, and site operators require Hazardous Substance Consent (HSC) to permit them
to store these flammable liquids. When providing advice on HSC and when considering COMAH
demonstrations HSE needs to assess the magnitude and extent of harm to people from potential
incidents from these substances, including that caused by thermal radiation from spirit fires. Reliable
data on the combustion characteristics of cask strength whisky spirit are important in the proper
assessment of risk around large storage sites. Important quantities are:
1. Mass burning rate (g/m2/s)
2. Heat release rate (kW/m2/s)
3. Flame shape
4. Flame height
5. Flame surface emissive power
6. The proportion of flame shrouded by soot
HSE uses the POOLFIRE6 mathematical model in consequence assessment for pool fires including
those at whisky storage sites. The model uses input data for ethanol based on very small test fires.
Additionally, there has been no specific data available for assessment of whisky spirit. Given this lack
of experimental data, the model is designed to provide conservative estimates of the energy
radiated by fires: in other words, the model errs on the side of caution and may overestimate the
energy radiated in potential fires.
Aim
An experimental programme of pool fire tests was carried out to provide data that can be used to
improve the reliability of assessments of the consequences of alcohol and whisky spirit fires.
Method
Five fluids were used in the pool fire test programme:
1. Ethanol (>99%) - referred to below as 100% ethanol
2. Ethanol/water 90% ABV
3. Ethanol/water 65% ABV
4. Ethanol/water 45% ABV
5. Whisky spirit 61.8% ABV
where ABV stands for alcohol by volume. Waste whisky was provided for the tests by a member of
the Scottish Whisky Association. Three pool sizes were included in the programme:
Small pool 600 x 590 mm 0.354 m2
Medium pool 2000 x 2000 mm 4 m2
Large pool 4000 x 4000 mm 16 m2

6
The data was analysed and compared to estimates from the POOLFIRE6 model. The analysis also
used data from a much larger Swedish ‘ETANKFIRE’ test on 97% ethanol/3% gasoline published in
20151.
Results
Measured burning rates in the HSE tests on 100% ethanol and ethanol solution 65% ABV are
summarised on the diagram below together with a measurement ‘E97’ from the Swedish test.
Measurements of surface emissive power (the energy radiated by the flames) were made in the
tests and are shown below.
Fuel
Surface emissive power of flames (kW/m2)
HSE tests (4m x 4m fire)
100 % ethanol 70
61.8% ABV whisky spirit 30
65% ethanol solution 30
Swedish test on 97% ethanol/3% gasoline (18 m diameter fire)
97% ethanol 130
1 Johan Sjöström, Glenn Appel,Francine Amon, Henry Persson (2015) ETANKFIRE –Experimental results of large
ethanol fuel pool fires. SP Report 2015:12 [Online] SP Technical Research Institute of Sweden. Available at http://www.diva-portal.org/smash/get/diva2:962885/FULLTEXT01.pdf (accessed 8th March 2019).
0
10
20
30
40
50
60
70
80
0.1 1 10 100 1000
Eth
ano
l bu
rnin
g ra
te (
g/m
2/s
)
Pool area (m2)
100% Ethanol or E97
Ethanol solution 65% ABV 97%
7
Discussion
Overall, the experiments confirm that the POOLFIRE6 model errs on the side of caution and may
overestimate the energy radiated in potential fires. The new experimental data from these tests will
assist HSE in producing more appropriate, lower estimates of harm from spirit fires.
Burning rates for 100% ethanol increased steadily with pool size, but burning rates for cask strength
whisky did not increase so rapidly, at least not for the range of sizes used in this work. The reason for
this can be understood by considering heat transfer from flames to the fuel surface: in general this is
a combination of both convection and radiation. Burning whisky spirit has a low soot yield, which
means that radiative heat transfer rates to the fuel surface are small compared with convection –
and convective heating controls the rate of burning. Since convection is relatively insensitive to
scale, the burning rate only increases slowly with pool diameter. In contrast radiation from 100%
ethanol flames makes an important contribution to fuel vaporisation even at smaller scales. For large
pools radiation effectively controls the fuel vaporisation rate. Beyond a certain size all of the pool
sees a flame that is sufficiently thick that its emissivity is close to 1, the rate of burning per square
metre then reaches a limiting level.
In the POOLFIRE6 model the flame is assumed to be cylindrical whereas in reality (for ethanol fires) it
is approximately conical. In the far field this leads to an overestimate of flame area and radiation by
a factor of 2. Large scale test results suggest that the current version of POOLFIRE6 underestimates
the burning rate for a large 100% ethanol pool fires by a factor of around 3.5. For this reason the
flame height is underestimated by a factor of about 2. Consequently, when POOLFIRE 6 is applied to
100% ethanol fires it gives good results for radiation in the far field (because of error cancellation)
and is somewhat conservative closer to the flame.
The low burning rate and surface emissive power of whisky spirt compared with ethanol mean that
the radiation hazards for whisky spirit are much less that for ethanol – for the same sized pool.
These test findings only apply to large unconfined releases of cask strength whisky burning outdoors
as a large pool unaffected by any other combustible material. Other fire situations involving this
material (e.g. inside maturation warehouses) are more complex because they might include burning
casks or burning building materials. A number of videos were produced that illustrate the differences
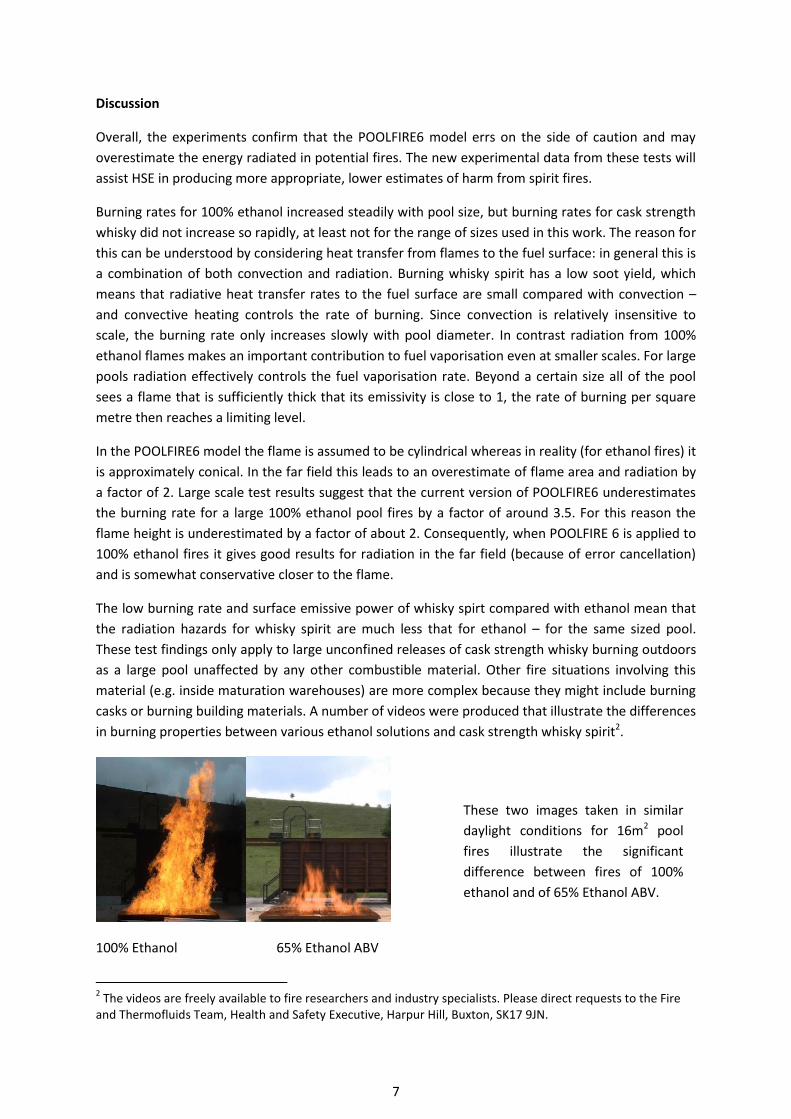
in burning properties between various ethanol solutions and cask strength whisky spirit2.
100% Ethanol 65% Ethanol ABV
2 The videos are freely available to fire researchers and industry specialists. Please direct requests to the Fire
and Thermofluids Team, Health and Safety Executive, Harpur Hill, Buxton, SK17 9JN.
These two images taken in similar
daylight conditions for 16m2 pool
fires illustrate the significant
difference between fires of 100%
ethanol and of 65% Ethanol ABV.

8
CONTENTS
KEY MESSAGES ......................................................................................................... 4
EXECUTIVE SUMMARY .............................................................................................. 5
1 INTRODUCTION ............................................................................................... 10 1.1 Current data assumptions ..................................................................................................... 10
2 TEST DATA AVAILABLE AT THE TIME OF DEVELOPMENT OF POOLFIRE6 ............ 13
3 MORE RECENT TEST DATA – ETANK PROJECT ................................................... 14 3.1 Qualitative findings ............................................................................................................... 14
3.1.1 Shrouding of the flame by soot ..................................................................................... 14
3.1.2 Flame shape .................................................................................................................. 14
3.2 Quantitative findings............................................................................................................. 14
3.2.1 Burning rate .................................................................................................................. 14
3.2.2 Flame height.................................................................................................................. 15
3.2.3 Flame radiation ............................................................................................................. 16
3.3 Summary ............................................................................................................................... 18
4 EXPERIMENTAL METHODS ............................................................................... 20 4.1 Test fluids .............................................................................................................................. 20
4.2 Burning trays ......................................................................................................................... 20
4.3 Ignition .................................................................................................................................. 23
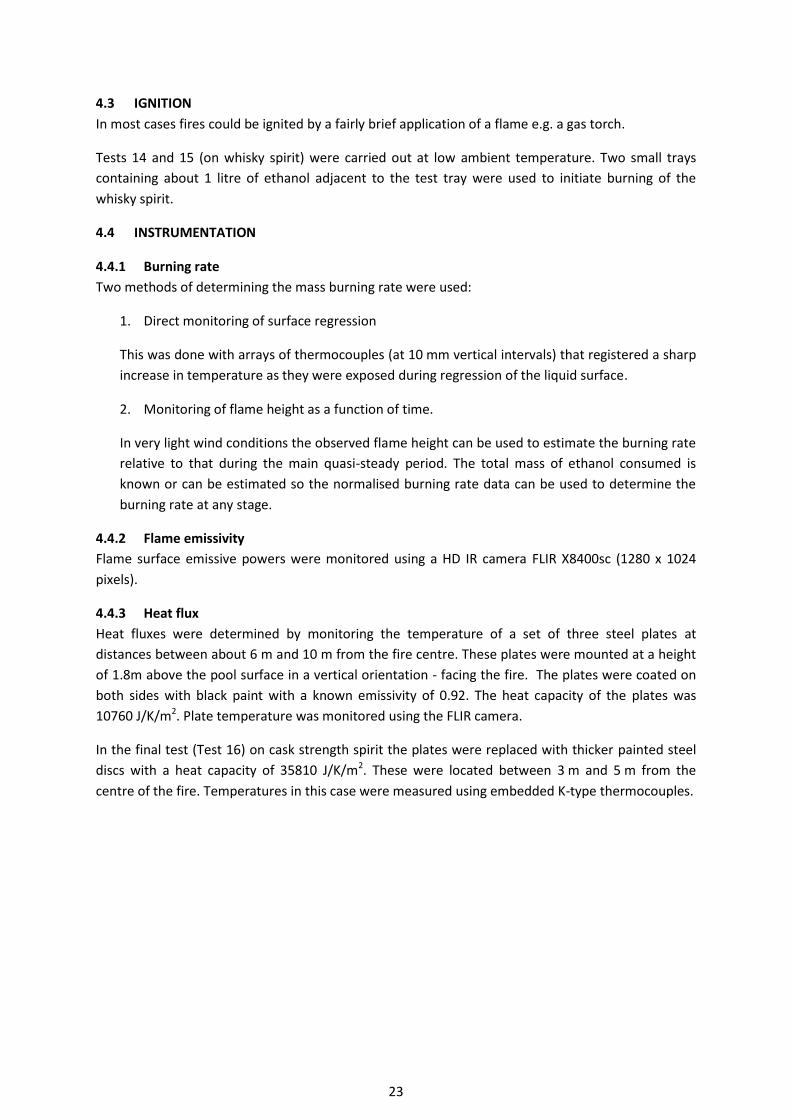
4.4 Instrumentation .................................................................................................................... 23
4.4.1 Burning rate .................................................................................................................. 23
4.4.2 Flame emissivity ............................................................................................................ 23
4.4.3 Heat flux ........................................................................................................................ 23
5 RESULTS .......................................................................................................... 24 5.1 Burning rates calculated from fire duration and flame height ............................................. 24
5.2 Burning rates calculated from thermocouple rakes ............................................................. 28
5.3 Measurements of heat flux ................................................................................................... 30
5.4 Flame emissivity .................................................................................................................... 35
6 DISCUSSION ..................................................................................................... 38 6.1 Summary of available combustion data ............................................................................... 38
6.2 Summary of implications ...................................................................................................... 39
9
6.2.1 Ethanol .......................................................................................................................... 39
6.2.2 Cask strength whisky ..................................................................................................... 39
7 REFERENCES .................................................................................................... 41
8 APPENDIX 1: RADIATION FROM CONICAL AND CYLINDRICAL FLAMES ............... 42
9 APPENDIX 2: IMAGES FROM THE FIRE TEST PROGRAMME ............................... 44
10 APPENDIX 3: THERMODYNAMICS OF ETHANOL/WATER FIRES .......................... 47
11 APPENDIX 4: THERMAL IMAGES FROM THE TEST PROGRAMME ....................... 50
10
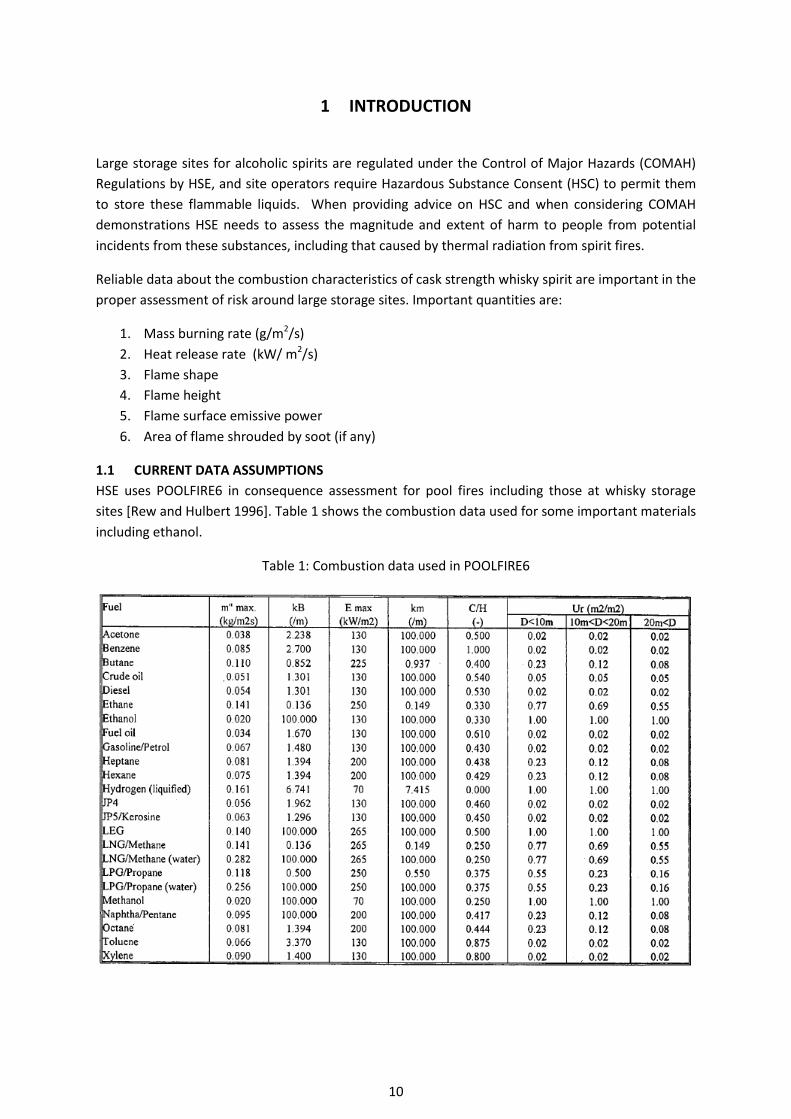
1 INTRODUCTION
Large storage sites for alcoholic spirits are regulated under the Control of Major Hazards (COMAH)
Regulations by HSE, and site operators require Hazardous Substance Consent (HSC) to permit them
to store these flammable liquids. When providing advice on HSC and when considering COMAH
demonstrations HSE needs to assess the magnitude and extent of harm to people from potential
incidents from these substances, including that caused by thermal radiation from spirit fires.
Reliable data about the combustion characteristics of cask strength whisky spirit are important in the
proper assessment of risk around large storage sites. Important quantities are:
1. Mass burning rate (g/m2/s)
2. Heat release rate (kW/ m2/s)
3. Flame shape
4. Flame height
5. Flame surface emissive power
6. Area of flame shrouded by soot (if any)
1.1 CURRENT DATA ASSUMPTIONS
HSE uses POOLFIRE6 in consequence assessment for pool fires including those at whisky storage
sites [Rew and Hulbert 1996]. Table 1 shows the combustion data used for some important materials
including ethanol.
Table 1: Combustion data used in POOLFIRE6

11
Currently assessments assume that the combustion properties of cask strength whisky spirit (60-65%
ABV) are similar to those of pure ethanol – in the absence of any other data.
The significance of the various data columns in Table 1 is discussed below:
1. �̇�”max - Mass burning rate
The mass burning rate is used to determine the flame height using the Thomas correlation [Rew and
Hulbert 1996]
Firstly a dimensionless mass burning rate �̇�∗is calculated from the mass burning rate per unit area
(�̇�”), pool diameter (D), ambient density (𝜌𝑎) and gravitational acceleration (g).
�̇�∗ =𝑚"̇
𝜌𝑎(𝑔𝐷)12
[1]
The ratio of flame height to pool diameter is then a function of this dimensionless burning rate
𝐿
𝐷= 42[𝑚∗̇ ]0.61 [2]
The predicted flame heights for various ethanol pool diameters are shown in Table 2.
Table 2: Predicted flame heights in POOLFIRE6 (ethanol)
Pool diameter (m)
Flame height (m)
1 1.64
2 2.65
3 3.52
5 5.02
10 8.12
15 10.77
20 13.15
50 24.87
75 32.96
100 40.26
2. kB - Pool size burning parameter
This defines how the mass burning rate �̇�" varies with pool size
�̇�" = �̇�"𝑚𝑎𝑥(1 − 𝑒−𝑘𝐵.𝐷) [3]
12
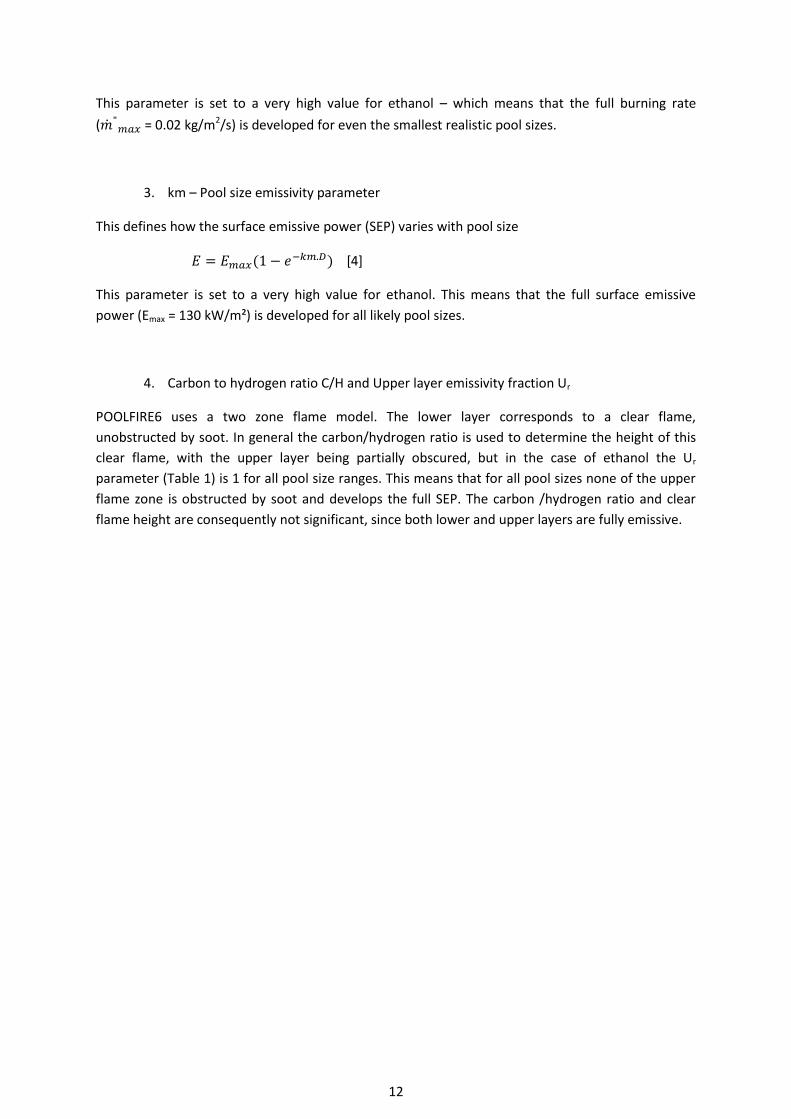
This parameter is set to a very high value for ethanol – which means that the full burning rate
(�̇�"𝑚𝑎𝑥 = 0.02 kg/m2/s) is developed for even the smallest realistic pool sizes.
3. km – Pool size emissivity parameter
This defines how the surface emissive power (SEP) varies with pool size
𝐸 = 𝐸𝑚𝑎𝑥(1 − 𝑒−𝑘𝑚.𝐷) [4]
This parameter is set to a very high value for ethanol. This means that the full surface emissive
power (Emax = 130 kW/m²) is developed for all likely pool sizes.
4. Carbon to hydrogen ratio C/H and Upper layer emissivity fraction Ur
POOLFIRE6 uses a two zone flame model. The lower layer corresponds to a clear flame,
unobstructed by soot. In general the carbon/hydrogen ratio is used to determine the height of this
clear flame, with the upper layer being partially obscured, but in the case of ethanol the Ur
parameter (Table 1) is 1 for all pool size ranges. This means that for all pool sizes none of the upper
flame zone is obstructed by soot and develops the full SEP. The carbon /hydrogen ratio and clear
flame height are consequently not significant, since both lower and upper layers are fully emissive.
13
2 TEST DATA AVAILABLE AT THE TIME OF DEVELOPMENT OF POOLFIRE6
The burning rate data for ethanol in Table 1 ( �̇�”max = 0.02 kg/m2/s) comes from an article on
burning rates in the SFPE Handbook of Fire Engineering [Babrauskas]. The experiments on ethanol
involved pool fires in pans up to 400 mm in diameter.
The value of kB (defining the variation of burning rate with fire size) also comes from experiments up
to a maximum diameter of 400mm. Apart from the small scale of the tests, the conclusion that
burning rates are independent of size is also only weakly supported by the original data.
There appear to have been no previous studies of the burning rate of whisky spirit. The assumption
that the material burns as ethanol made in the absence of any other data is precautionary.
14
3 MORE RECENT TEST DATA – ETANK PROJECT
The use of ethanol has increased significantly recently, principally as a means to fulfil climate goals
by substituting some fossil fuels with renewable alternatives. In response to the need for reliable
consequence assessment at storage sites, a programme of large scale fire testing (ETANK Project)
was carried out in Sweden by SP [Sjöström et al].
The work included two series of free-burning tests with ethanol contaminated with small amounts of
gasoline: one at laboratory scale with a pool area of 2.0 m2 and one at large scale with a pool area of
254 m2 (pool dimeter 18m). In both sets of tests the burning rate and flame height were measured
along with heat flux as a function of distance from the fire.
Two fuel mixtures were used in the large scale tests, E97 (97 % ethanol denatured with 3% gasoline)
and commercial E85 (85 % ethanol with 15 % gasoline).
3.1 QUALITATIVE FINDINGS
3.1.1 Shrouding of the flame by soot
A key qualitative finding from the SP work was that, at large scale (and even when ethanol is
contaminated with 3% gasoline) the flames are fully emissive i.e. there was no significant shrouding
of the flame by soot. This means that for large pool fire the radiation from ethanol fires may exceed
that of hydrocarbons. High values of Km assumed in POOLFIRE6 therefore appear to be justified.
Ethanol flames clearly do produce some soot on the fuel rich side of the flame and this plays an
important part in increasing emissivity. However the soot particles efficiently burn out in passing
through the flame front.
3.1.2 Flame shape
It is also apparent from photographs of large fires in the ETANK programme that the flame shape did
not generally correspond to a tilted circular cylinder (as assumed by POOLFIRE6). The flame shape
generally more closely resembled a circular cone3.
3.2 QUANTITATIVE FINDINGS
3.2.1 Burning rate
The measured burning rates are compared with those used in POOLFIRE6 in Table 3.
3 Large pools of most fuels produce strongly sooting flames; the tilted cylinder shape is more likely to be
appropriate in this case.

15
Table 3: Ethanol, E97 and E85 burning rates
Burning rate
g/s/m2
POOLFIRE6 (Ethanol) 20
ETANK 97% Ethanol - 18 m diameter 70
ETANK 85% Ethanol – 18 m diameter 72
It is not likely that the substitution of 3% ethanol with gasoline will change the rate of burning
significantly compared with pure ethanol. This judgement is supported by the fact that the
measured burning rate is only modestly changed when a much larger proportion of the ethanol was
substituted.
This data suggests that the mass burning rates for ethanol are significantly underestimated in the
inputs to POOLFIRE6.
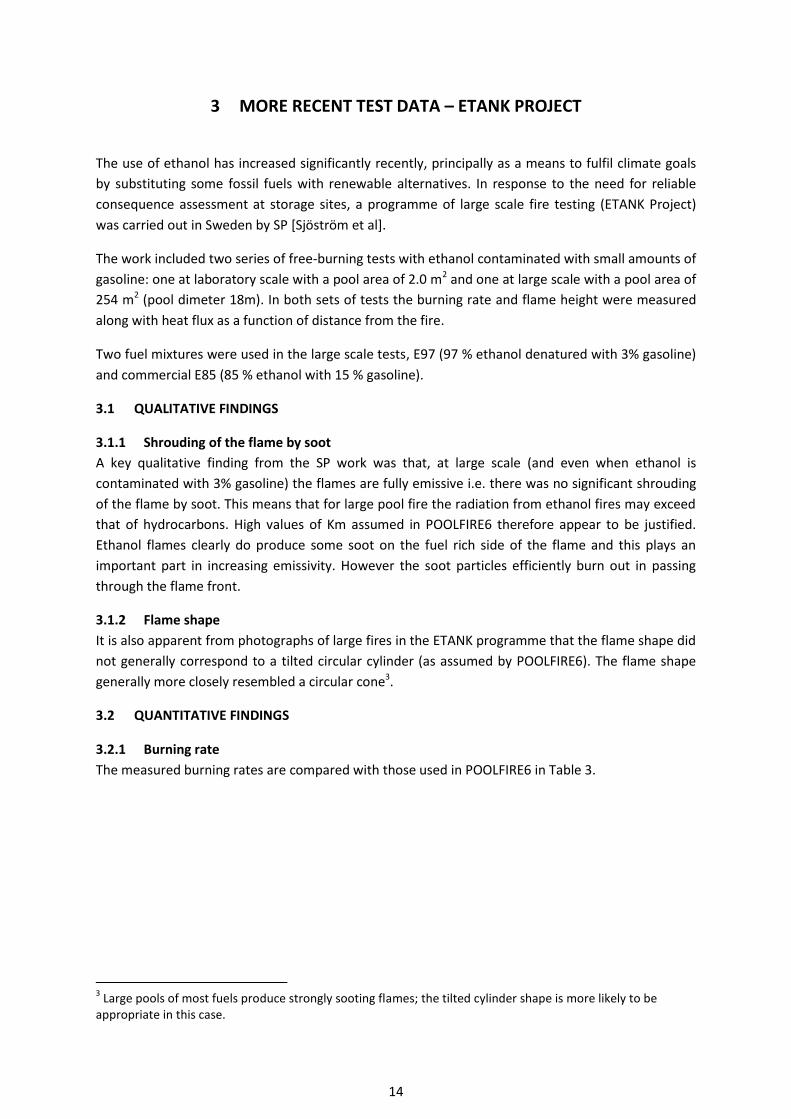
3.2.2 Flame height
Flame height was measured using an IR camera. The presence of flame was taken to correspond to a
radiative temperature of > 900°C (Surface Emissive Power > 107 kW/m²). Table 4 shows the
experimental results for 97% ethanol compared with predictions from POOLFIRE6. This data shows
that POOLFIRE6 significantly underestimates the flame height. However, the discrepancy is
substantially a direct consequence of the under prediction of burning rate. If this burning rate is
corrected (by using the measured value) then the Thomas correlation [Eqn2] for flame height
matches the observation to within experimental accuracy.
16
Table 4: Flame heights – measurements and predictions
Flame height
(m)
Measured burning
rate
(g/s/m²)
Assumed burning
rate
(g/s/m²)
Measured ETANK 97% Ethanol -
18 m diameter
25
70
-
Predicted by POOLFIRE6
(current burning rate)
12
-
20
Predicted by POOLFIRE6
(experimental burning rate)
26
70
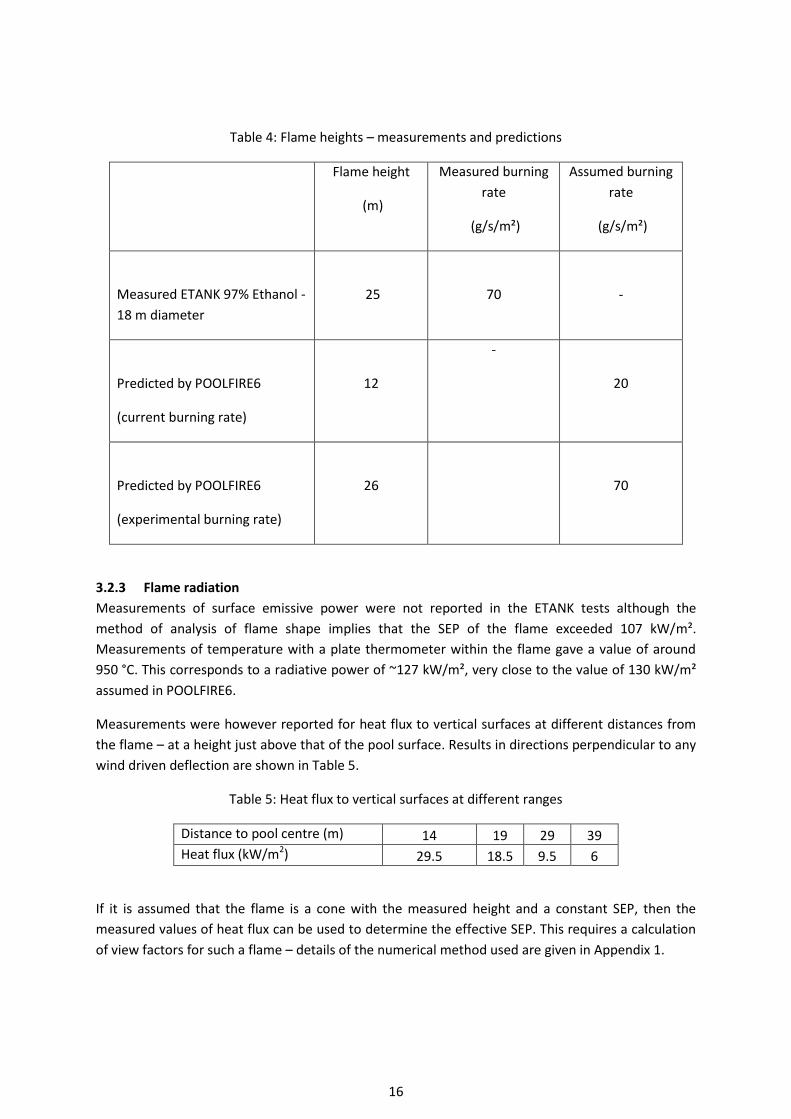
3.2.3 Flame radiation
Measurements of surface emissive power were not reported in the ETANK tests although the
method of analysis of flame shape implies that the SEP of the flame exceeded 107 kW/m².
Measurements of temperature with a plate thermometer within the flame gave a value of around
950 °C. This corresponds to a radiative power of ~127 kW/m², very close to the value of 130 kW/m²
assumed in POOLFIRE6.
Measurements were however reported for heat flux to vertical surfaces at different distances from
the flame – at a height just above that of the pool surface. Results in directions perpendicular to any
wind driven deflection are shown in Table 5.
Table 5: Heat flux to vertical surfaces at different ranges
Distance to pool centre (m) 14 19 29 39
Heat flux (kW/m2) 29.5 18.5 9.5 6
If it is assumed that the flame is a cone with the measured height and a constant SEP, then the
measured values of heat flux can be used to determine the effective SEP. This requires a calculation
of view factors for such a flame – details of the numerical method used are given in Appendix 1.
17
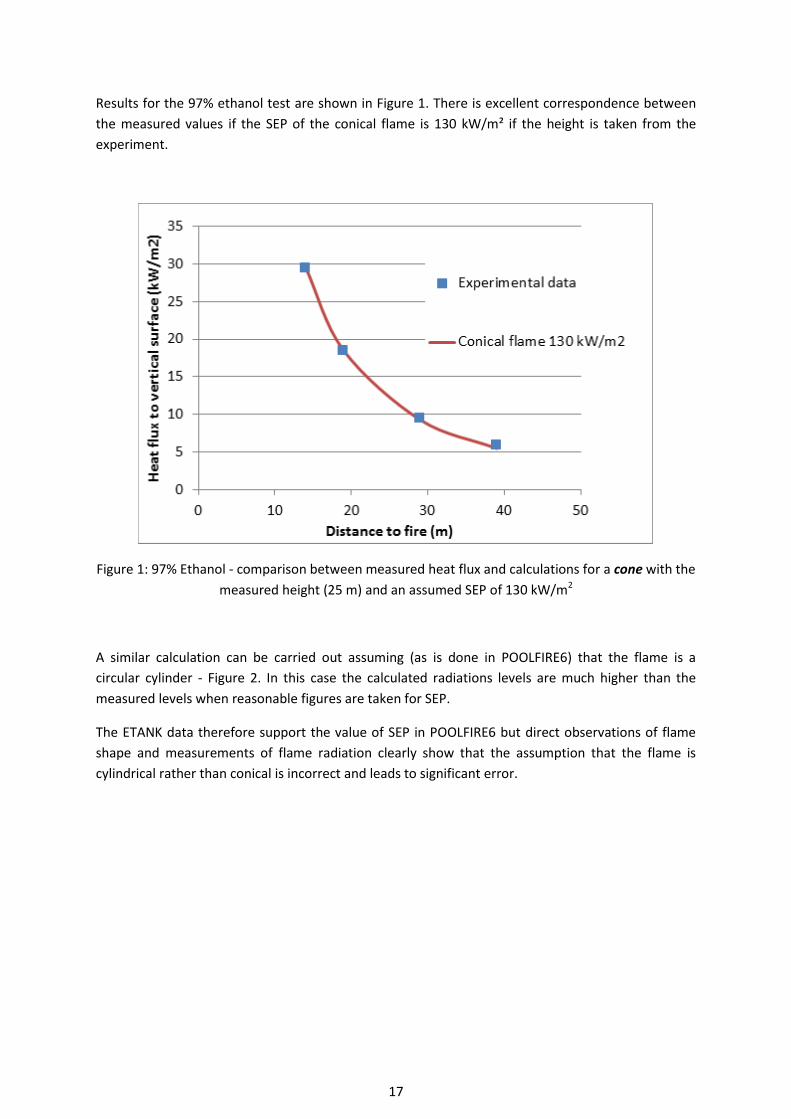
Results for the 97% ethanol test are shown in Figure 1. There is excellent correspondence between
the measured values if the SEP of the conical flame is 130 kW/m² if the height is taken from the
experiment.
Figure 1: 97% Ethanol - comparison between measured heat flux and calculations for a cone with the
measured height (25 m) and an assumed SEP of 130 kW/m2
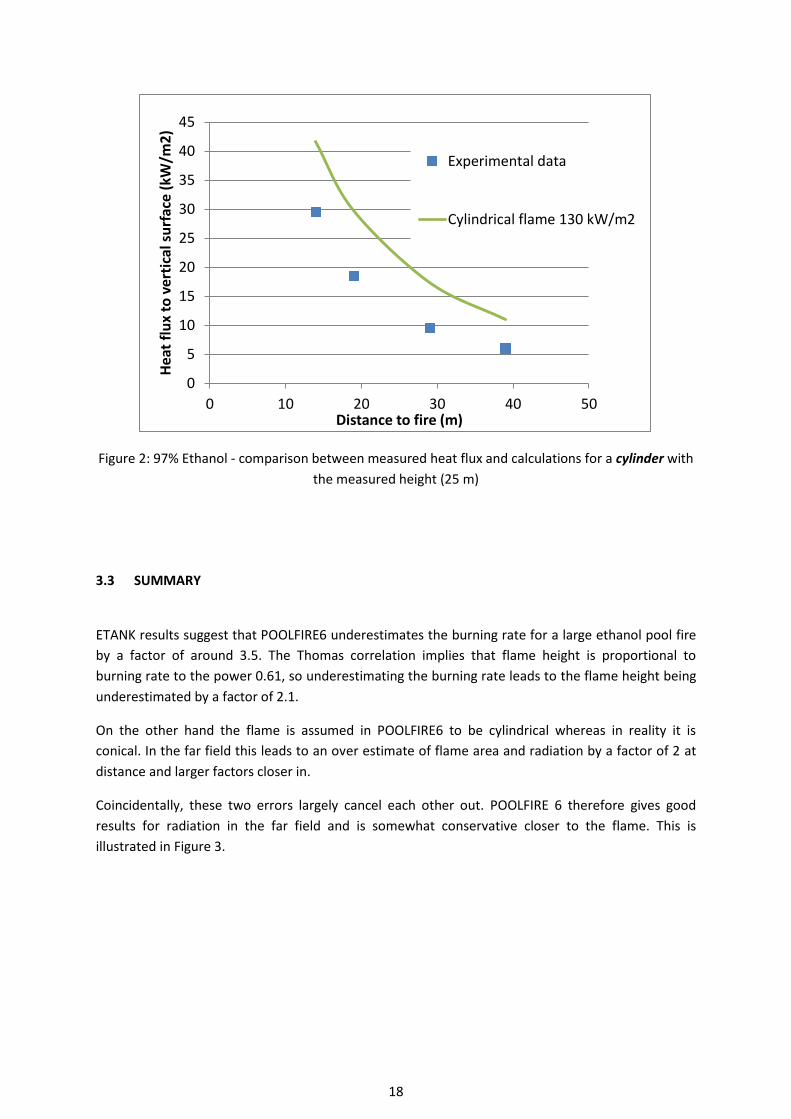
A similar calculation can be carried out assuming (as is done in POOLFIRE6) that the flame is a
circular cylinder - Figure 2. In this case the calculated radiations levels are much higher than the
measured levels when reasonable figures are taken for SEP.
The ETANK data therefore support the value of SEP in POOLFIRE6 but direct observations of flame
shape and measurements of flame radiation clearly show that the assumption that the flame is
cylindrical rather than conical is incorrect and leads to significant error.
18
Figure 2: 97% Ethanol - comparison between measured heat flux and calculations for a cylinder with
the measured height (25 m)
3.3 SUMMARY
ETANK results suggest that POOLFIRE6 underestimates the burning rate for a large ethanol pool fire
by a factor of around 3.5. The Thomas correlation implies that flame height is proportional to
burning rate to the power 0.61, so underestimating the burning rate leads to the flame height being
underestimated by a factor of 2.1.
On the other hand the flame is assumed in POOLFIRE6 to be cylindrical whereas in reality it is
conical. In the far field this leads to an over estimate of flame area and radiation by a factor of 2 at
distance and larger factors closer in.
Coincidentally, these two errors largely cancel each other out. POOLFIRE 6 therefore gives good
results for radiation in the far field and is somewhat conservative closer to the flame. This is
illustrated in Figure 3.
0
5
10
15
20
25
30
35
40
45
0 10 20 30 40 50
Hea
t fl
ux
to v
erti
cal s
urf
ace
(kW
/m2
)
Distance to fire (m)
Experimental data
Cylindrical flame 130 kW/m2

19
Figure 3: Comparison between POOLFIRE6 predictions and ETANK measurements

20
4 EXPERIMENTAL METHODS
4.1 TEST FLUIDS
Five fluids were used in the pool fire test programme:
1. Ethanol (>99%)
2. Ethanol/water 90% ABV
3. Ethanol/water 65% ABV
4. Ethanol/water 45% ABV
5. Whisky spirit4 61.8% ABV
The alcohol content of the spirit samples was submitted for chemical analysis by HSE’s analytical
chemistry unit. Results confirmed the concentration quoted by the supplier.
4.2 BURNING TRAYS
Three pool sizes were included in the programme
Small pool 600 mm x 590 mm (area 0.354 m²)
Medium pool 2000 mm x 2000 mm (area 4 m²)
Large pool 4000 mm x 4000 mm (area 16 m²)
All of the pool fires were contained in 100 mm deep trays made from 3 mm steel sheet reinforced
underneath with box section to minimise heat distortion. The largest pool consisted of four
2000 mm x 2000 mm trays fitted together in a square.
Alcohol solutions were made up in 1000 litre lots and then dispensed with a metred pump. The
quantities of fluid used in the various tests are shown in Table 6. This table also gives information
about the ambient conditions during the tests.
In many cases tests were repeated to make separate measurements of flame emissivity and heat
flux to targets at distance. This was necessary as a thermal camera was used for both sets of
measurements but different settings and orientation were required for target heat flux and flame
measurements.
4 Provided by a member of the Scotch Whisky Association

21
Table 6: Quantities of fluid used in various tests and weather conditions
Test
No.
Pool size Fluid Test purpose Quantity Ambient
temperature
Wind conditions
1 Small 100% ABV Heat flux 6.8 litres 17 °C Indoor test
2 Small 100% ABV Flame emissivity imaging/burning rate 4.5 litres 9 °C Indoor test
3 Small 90% ABV Flame emissivity imaging/burning rate 4.5 litres 9 °C Indoor test
4 Small 65% ABV Flame emissivity imaging/burning rate 4.5 litres 9 °C Indoor test
Small 45% ABV Flame emissivity imaging/burning rate 4.5 litres 9 °C Indoor test
6 Medium 100% ABV Flame emissivity imaging/burning rate 65 litres 10 °C Light
7 Medium 90% ABV Flame emissivity imaging/burning rate 80 litres 10 °C Light
8 Medium 65% ABV Flame emissivity imaging/burning rate 80 litres 10 °C Light
9 Medium 45% ABV Flame emissivity imaging/burning rate 80 litres 10 °C Light
10 Large 100% ABV Heat flux/burning rate 600 litres 10.5 °C Mostly Light
11 Large 100% ABV Flame emissivity 240 litres 10.5 °C Light
12 Large 65% ABV Heat flux/burning rate 600 litres 23 °C Initially fairly light then breezy

22
13 Large 65% ABV Flame emissivity 240 litres 23 °C Mostly Light
14 Large Whisky Spirit (61.8% ABV) Heat flux/burning rate 600 litres 0 °C Zero – strong inversion
15 Large Whisky Spirit (61.8% ABV) Flame emissivity 240 litres 0 °C Light
16 Large Whisky Spirit (61.8% ABV) Heat flux/burning rate 600 litres ~10 °C Breezy - variable
23
4.3 IGNITION
In most cases fires could be ignited by a fairly brief application of a flame e.g. a gas torch.
Tests 14 and 15 (on whisky spirit) were carried out at low ambient temperature. Two small trays
containing about 1 litre of ethanol adjacent to the test tray were used to initiate burning of the
whisky spirit.
4.4 INSTRUMENTATION
4.4.1 Burning rate
Two methods of determining the mass burning rate were used:
1. Direct monitoring of surface regression
This was done with arrays of thermocouples (at 10 mm vertical intervals) that registered a sharp
increase in temperature as they were exposed during regression of the liquid surface.
2. Monitoring of flame height as a function of time.
In very light wind conditions the observed flame height can be used to estimate the burning rate
relative to that during the main quasi-steady period. The total mass of ethanol consumed is
known or can be estimated so the normalised burning rate data can be used to determine the
burning rate at any stage.
4.4.2 Flame emissivity
Flame surface emissive powers were monitored using a HD IR camera FLIR X8400sc (1280 x 1024
pixels).
4.4.3 Heat flux
Heat fluxes were determined by monitoring the temperature of a set of three steel plates at
distances between about 6 m and 10 m from the fire centre. These plates were mounted at a height
of 1.8m above the pool surface in a vertical orientation - facing the fire. The plates were coated on
both sides with black paint with a known emissivity of 0.92. The heat capacity of the plates was
10760 J/K/m2. Plate temperature was monitored using the FLIR camera.
In the final test (Test 16) on cask strength spirit the plates were replaced with thicker painted steel
discs with a heat capacity of 35810 J/K/m2. These were located between 3 m and 5 m from the
centre of the fire. Temperatures in this case were measured using embedded K-type thermocouples.
24
5 RESULTS
5.1 BURNING RATES CALCULATED FROM FIRE DURATION AND FLAME HEIGHT
In all cases there was a relatively short period during which the fire spread across the pool surface followed by an extended period of reasonably steady rate of burning and finally a fairly short period during which the fire died away.
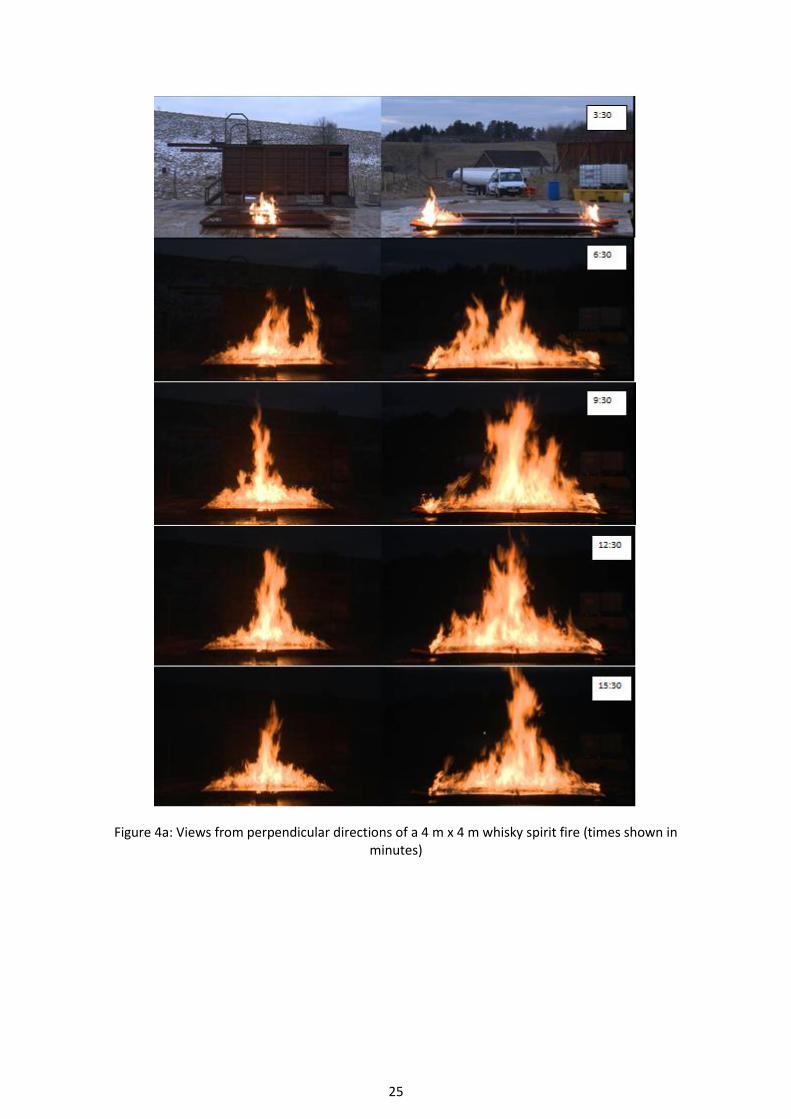
A sequence of images from Test 14 (61.8% ABV Whisky spirit) is shown in Figures 4a and 4b.
Representative images from other tests are shown in Appendix 2.
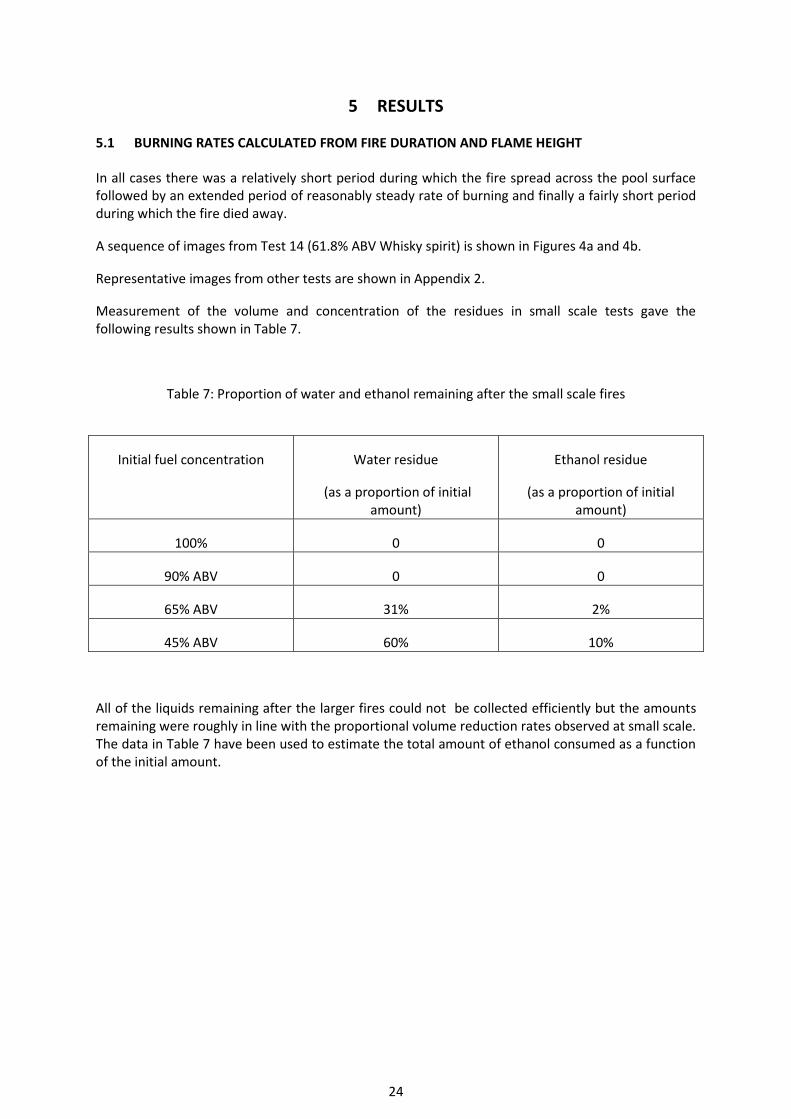
Measurement of the volume and concentration of the residues in small scale tests gave the following results shown in Table 7.
Table 7: Proportion of water and ethanol remaining after the small scale fires
Initial fuel concentration Water residue
(as a proportion of initial amount)
Ethanol residue
(as a proportion of initial amount)
100% 0 0
90% ABV 0 0
65% ABV 31% 2%
45% ABV 60% 10%
All of the liquids remaining after the larger fires could not be collected efficiently but the amounts remaining were roughly in line with the proportional volume reduction rates observed at small scale. The data in Table 7 have been used to estimate the total amount of ethanol consumed as a function of the initial amount.
25
Figure 4a: Views from perpendicular directions of a 4 m x 4 m whisky spirit fire (times shown in minutes)

26
Figure 4b: Views from perpendicular directions of a 4 m x 4 m whisky spirit fire (times shown in minutes. Note: the fire-to-camera distances are slightly different )
Flame height data for this Test 14 is shown in Figure 5. The cumulative rate of ethanol consumption towards the final amount, based on these flame heights and the Thomas correlation, is shown in Figure 6. The flame height is remarkably constant as the proportion of ethanol remaining declines. The reasons for this are discussed in Appendix 3.
The total amount of ethanol lost in this case was 289 kg. The ethanol mass loss rate in the quasi-steady period was 16.4 g/s/m2.
A summary of all of the burning rate data obtained by these means is shown in Table 8.

27
Figure 5: Flame heights in Test 14 as a function of time (variability between 5 and 10 minutes is due to sampling of an unsteady, pulsing flame)
Figure 6: Cumulative loss of ethanol during Test 14, as a proportion of the total
0
0.1
0.2
0.3
0.4
0.5
0.6
0.7
0.8
0.9
0 5 10 15 20 25 30
Flam
e h
eigh
t/p
oo
l wid
th
Time after ignition (minutes)
0
0.1
0.2
0.3
0.4
0.5
0.6
0.7
0.8
0.9
1
0 5 10 15 20 25 30
Mas
s lo
st a
s a
pro
po
rtio
n o
f fi
nal
mas
s lo
ss
Time after ignition (minutes)

28
Table 8: Summary of burning rates
Test
No.
Pool size Fluid Burning rate
(g/m2/s)
1 Small 100% ABV -
2 Small 100% ABV 23
3 Small 90% ABV 17
4 Small 65% ABV 12
5 Small 45% ABV 8
6 Medium 100% ABV 30
7 Medium 90% ABV 23
8 Medium 65% ABV 15
9 Medium 45% ABV Incomplete burning
10 Large 100% ABV 42
11 Large 100% ABV -
12 Large 65% ABV 16.4
13 Large 65% ABV -
14 Large Whisky Spirit (61.8% ABV) 16.4
16 Large Whisky Spirit (61.8% ABV) 16
These data are plotted and discussed in Sections 6 and 9.
5.2 BURNING RATES CALCULATED FROM THERMOCOUPLE RAKES
Reinforcement of the tray bases was not successful in eliminating all significant flexure of the tray
because of differential thermal expansion. This caused some relative vertical movement of parts of
the tray base, which in turn caused lateral movement of fluid and consequently disturbed the
operation of the thermocouple rakes in monitoring the average rate of surface regression.
29
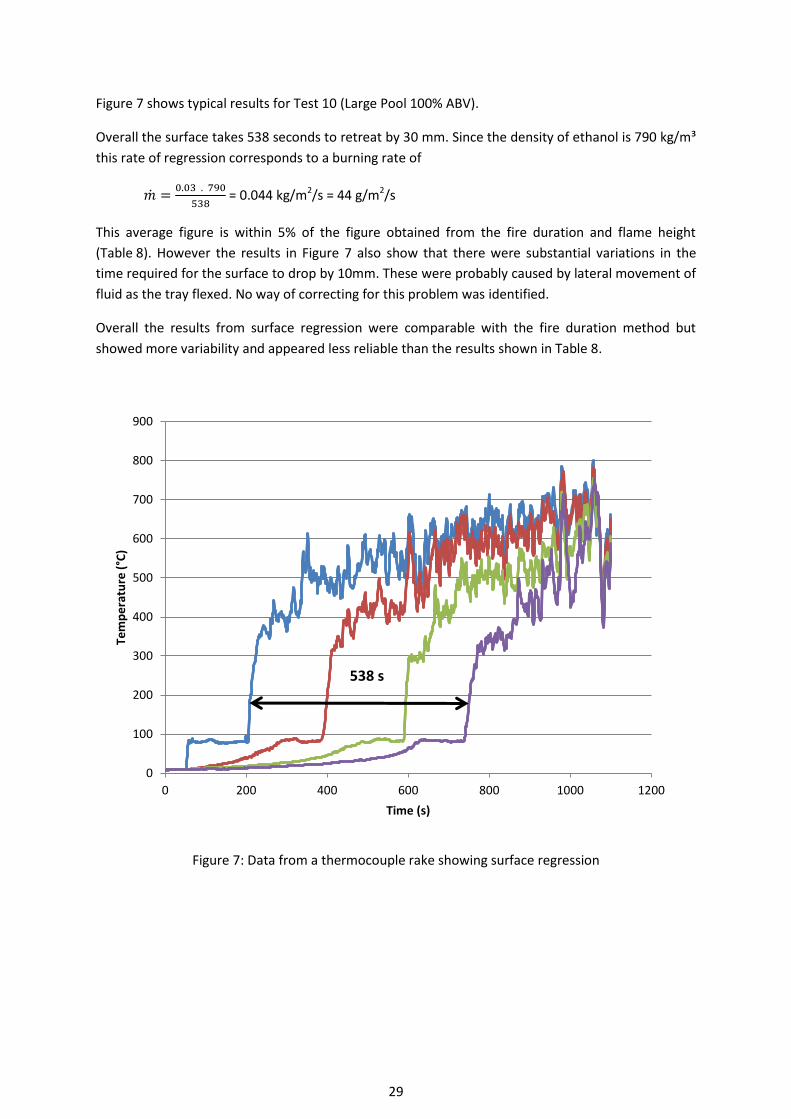
Figure 7 shows typical results for Test 10 (Large Pool 100% ABV).
Overall the surface takes 538 seconds to retreat by 30 mm. Since the density of ethanol is 790 kg/m³
this rate of regression corresponds to a burning rate of
�̇� =0.03 . 790
538 = 0.044 kg/m2/s = 44 g/m2/s
This average figure is within 5% of the figure obtained from the fire duration and flame height
(Table 8). However the results in Figure 7 also show that there were substantial variations in the
time required for the surface to drop by 10mm. These were probably caused by lateral movement of
fluid as the tray flexed. No way of correcting for this problem was identified.
Overall the results from surface regression were comparable with the fire duration method but
showed more variability and appeared less reliable than the results shown in Table 8.
Figure 7: Data from a thermocouple rake showing surface regression
0
100
200
300
400
500
600
700
800
900
0 200 400 600 800 1000 1200
Tem
pe
ratu
re (
°C)
Time (s)
538 s

30
5.3 MEASUREMENTS OF HEAT FLUX
Figure 8 shows typical measurements of target temperature (Test 14 61.8% ABV Whisky spirit).
Also shown are curves showing the expected variation in plate temperature T according to the
equation:
𝐶𝑑𝑇
𝑑𝑡= 𝜀𝐹 − 2ℎ(𝑇 − 𝑇𝑎𝑚𝑏) − 2𝜀𝜎(𝑇4 − 𝑇𝑎𝑚𝑏
4 ) [5]
T = Plate temperature , Tamb = Ambient temperature
t = Time (s)
F = Incident thermal flux (W/m2)
C = Plate heat capacity per unit area (J/m2/K)
ε = Plate surface emissivity (ε =0.92)
σ = Stefan Boltzmann constant (σ =5.67x 10⁻⁸ W/m2/K4)
h = average convective heat transfer coefficient - per side (W/m2/K)
Figure 8a: Target temperature and plate temperature rise modelling predictions for Test 14
(black lines show modelling results for incident fluxes of 1.8 kW/m2, 1.1 kW/m2 and 0.85 kW/m2)
0
5
10
15
20
25
30
35
40
45
50
300 400 500 600 700 800 900 1000
Tem
per
atu
re (
°C)
Time (s)

31
Figure 8b shows similar data for the thicker discs used in Test 16. The same values for the convective
heat transfer coefficient were used.
Figure 8b: Target temperature and plate temperature rise modelling predictions for Test 16
(dashed lines show modelling results for an incident flux of 8.0, 3.7 and 2.3 kW/m2)
0
20
40
60
80
100
120
140
160
180
200
0 500 1000
Targ
et t
emp
erat
ure
(°C
)
Time (s)
Measured 3m
Measured 4m
Measured 5m
Fit 8.0 kW/m2
Fit 3.7 kW/m2
Fit 2.3 kW/m2

32
Table 9 shows radiative fluxes (to a vertical surface) derived by this curve fitting method.
Table 9: Heat flux to vertical targets
Test 10, 100% ethanol
Distance to fire centre(m) 7.1 8.7 10.3
Heat flux to target (kW/m2) 4.8 3.3 2.6
Test 14, 61.8% ABV spirit
Distance to fire centre(m) 6.35 8.03 9.55
Heat flux to target (kW/m2) 1.8 1.1 0.85
Test 12, 65% ABV ethanol soln. 5
Distance to fire centre (m) 6.35 8.0 9.5
Heat flux to target (kW/m2) 1.6 1.1 0.8
Test 16, 65% ABV ethanol soln. 6
Distance to fire centre (m) 3 4 5
Heat flux to target (kW/m2) 8.0 3.7 2.3
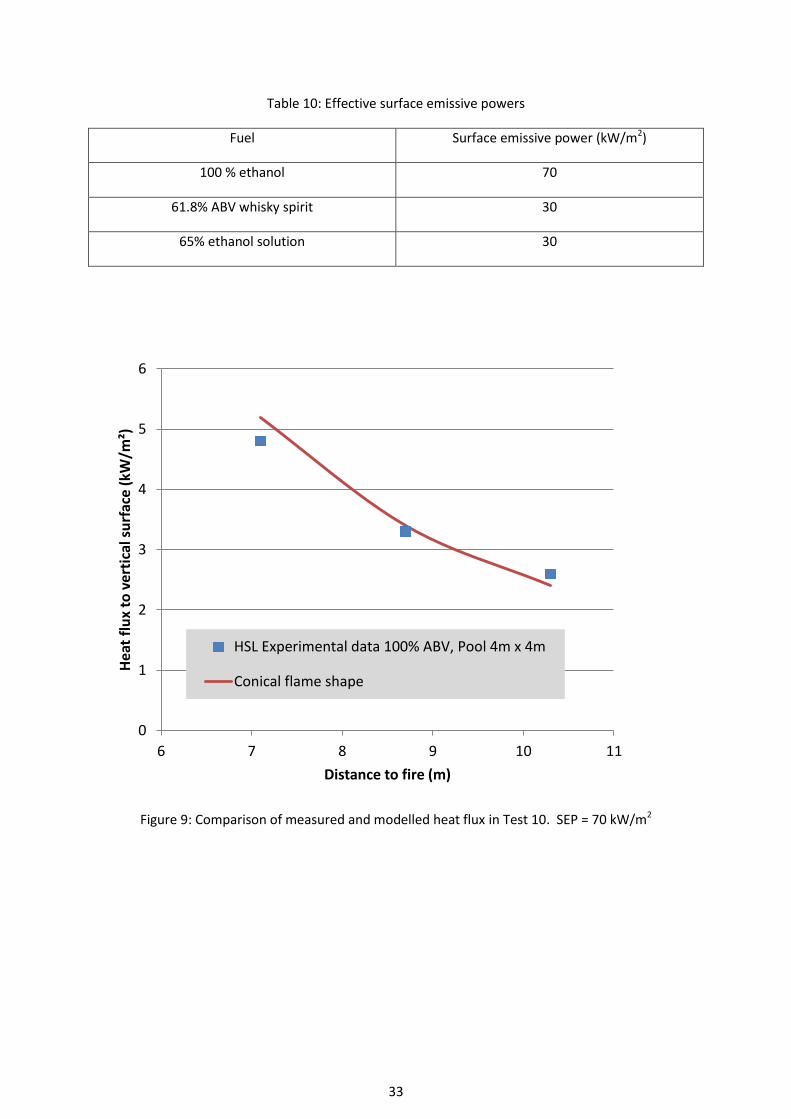
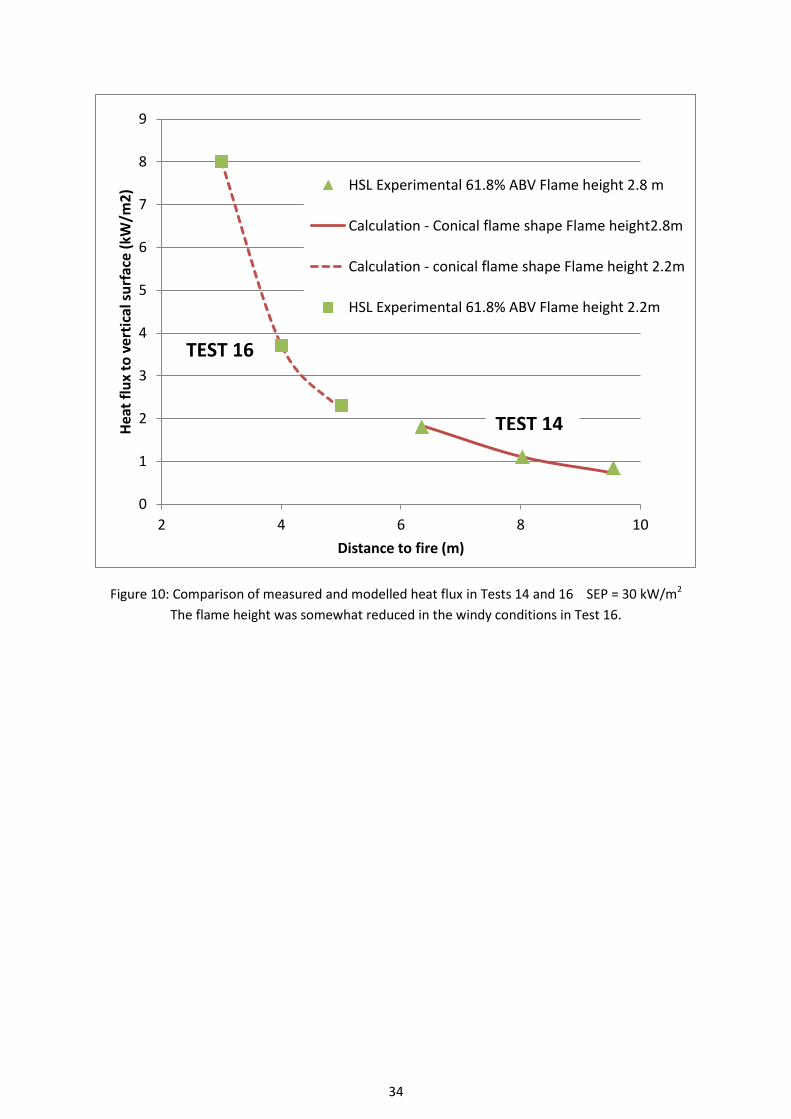
These results can be used to derive values for the average surface emissive power of the flames,
assuming a conical, untilted shape and the observed flame height.
The best fit values are shown in Table 10. Plots showing a comparison between modelled (assuming
a conical flame) and measured heat fluxes are shown in Figures 9, 10 and 11.
5 There is some uncertainty in specifying distances and fit parameters in this case because of variable wind
conditions 6 There is some uncertainty in specifying distances and fit parameters in this case because of variable wind
conditions
33
Table 10: Effective surface emissive powers
Fuel Surface emissive power (kW/m2)
100 % ethanol 70
61.8% ABV whisky spirit 30
65% ethanol solution 30
Figure 9: Comparison of measured and modelled heat flux in Test 10. SEP = 70 kW/m2
0
1
2
3
4
5
6
6 7 8 9 10 11
Hea
t fl
ux
to v
erti
cal s
urf
ace
(kW
/m²)
Distance to fire (m)
HSL Experimental data 100% ABV, Pool 4m x 4m
Conical flame shape
34
Figure 10: Comparison of measured and modelled heat flux in Tests 14 and 16 SEP = 30 kW/m2
The flame height was somewhat reduced in the windy conditions in Test 16.
0
1
2
3
4
5
6
7
8
9
2 4 6 8 10
Hea
t fl
ux
to v
erti
cal s
urf
ace
(kW
/m2
)
Distance to fire (m)
HSL Experimental 61.8% ABV Flame height 2.8 m
Calculation - Conical flame shape Flame height2.8m
Calculation - conical flame shape Flame height 2.2m
HSL Experimental 61.8% ABV Flame height 2.2m
TEST 14
TEST 16

35
Figure 11: Comparison of measured and modelled heat flux in Test 12 - SEP = 30 kW/m2
5.4 FLAME EMISSIVITY
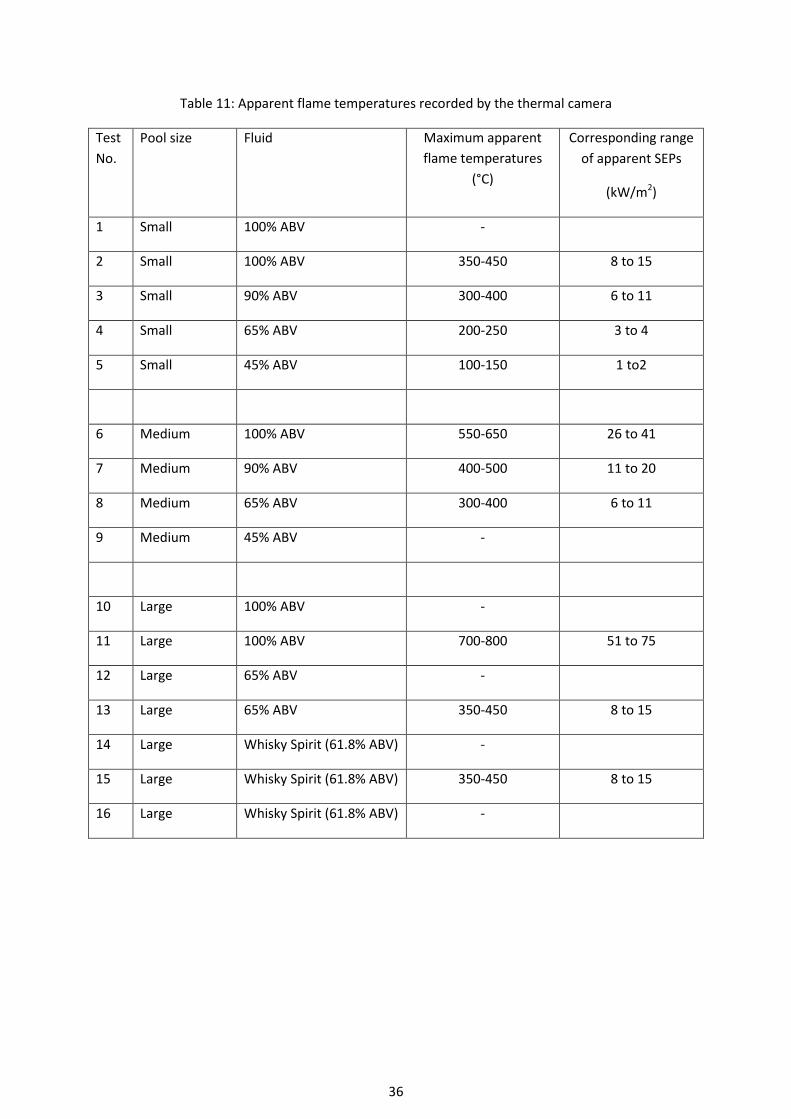
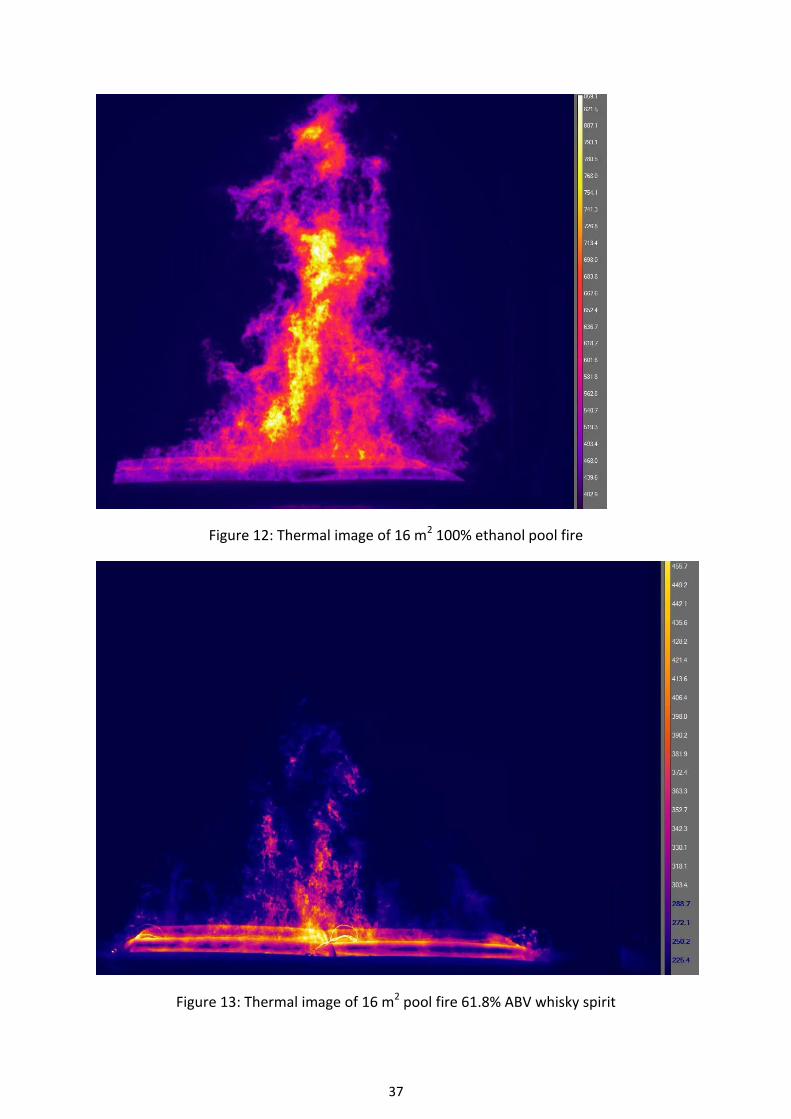
Typical thermal images for 100% ethanol and 61.8% ABV whisky spirit are shown in Figures 12 and
13. Additional thermal images are shown in Appendix 4.
The approximate maximum flame temperatures recorded in the various tests are shown in Table 11.
The camera is calibrated for emissions with a spectral intensity characteristic of a black body. For
strongly sooting flames this is not a problem as the radiation is dominated by soot emissions which
match the assumed power spectrum. Radiation from 100% alcohol flames is dominated by soot
emissions. The effective radiative temperature recorded by the camera (Figure 8), and the
corresponding surface emissive power of 51 kW/m² to 75 kW/m², approaches that determined by
measurements of the heating effect of the radiation (70 kW/m2).
For whisky spirit and diluted ethanol thermal radiation is not dominated by soot but includes a
significant contribution from infrared emissions of hot gases especially water and CO2. For example
the actual rate of radiative heat transfer for the large pools measured by the steel plate targets is
higher (30 kW/m2) than the camera indicates (8-15 kW/m2).
All of these effective radiative temperatures and corresponding surface emissive powers are less
than those for very large optically thick flames. The ETANK results suggest that around 950 °C and
130 kW/m2 would be appropriate in the limit of large pools.
0
0.2
0.4
0.6
0.8
1
1.2
1.4
1.6
1.8
2
5 6 7 8 9 10
Hea
t fl
ux
to v
erti
cal s
urf
ace
(kW
/m2
)
Distance to fire (m)
HSL Experimental 65% ABV, 4mx4m pool
Conical flame shape
36
Table 11: Apparent flame temperatures recorded by the thermal camera
Test
No.
Pool size Fluid Maximum apparent
flame temperatures
(°C)
Corresponding range
of apparent SEPs
(kW/m2)
1 Small 100% ABV -
2 Small 100% ABV 350-450 8 to 15
3 Small 90% ABV 300-400 6 to 11
4 Small 65% ABV 200-250 3 to 4
5 Small 45% ABV 100-150 1 to2
6 Medium 100% ABV 550-650 26 to 41
7 Medium 90% ABV 400-500 11 to 20
8 Medium 65% ABV 300-400 6 to 11
9 Medium 45% ABV -
10 Large 100% ABV -
11 Large 100% ABV 700-800 51 to 75
12 Large 65% ABV -
13 Large 65% ABV 350-450 8 to 15
14 Large Whisky Spirit (61.8% ABV) -
15 Large Whisky Spirit (61.8% ABV) 350-450 8 to 15
16 Large Whisky Spirit (61.8% ABV) -
37
Figure 12: Thermal image of 16 m2 100% ethanol pool fire
Figure 13: Thermal image of 16 m2 pool fire 61.8% ABV whisky spirit
38
6 DISCUSSION
6.1 SUMMARY OF AVAILABLE COMBUSTION DATA
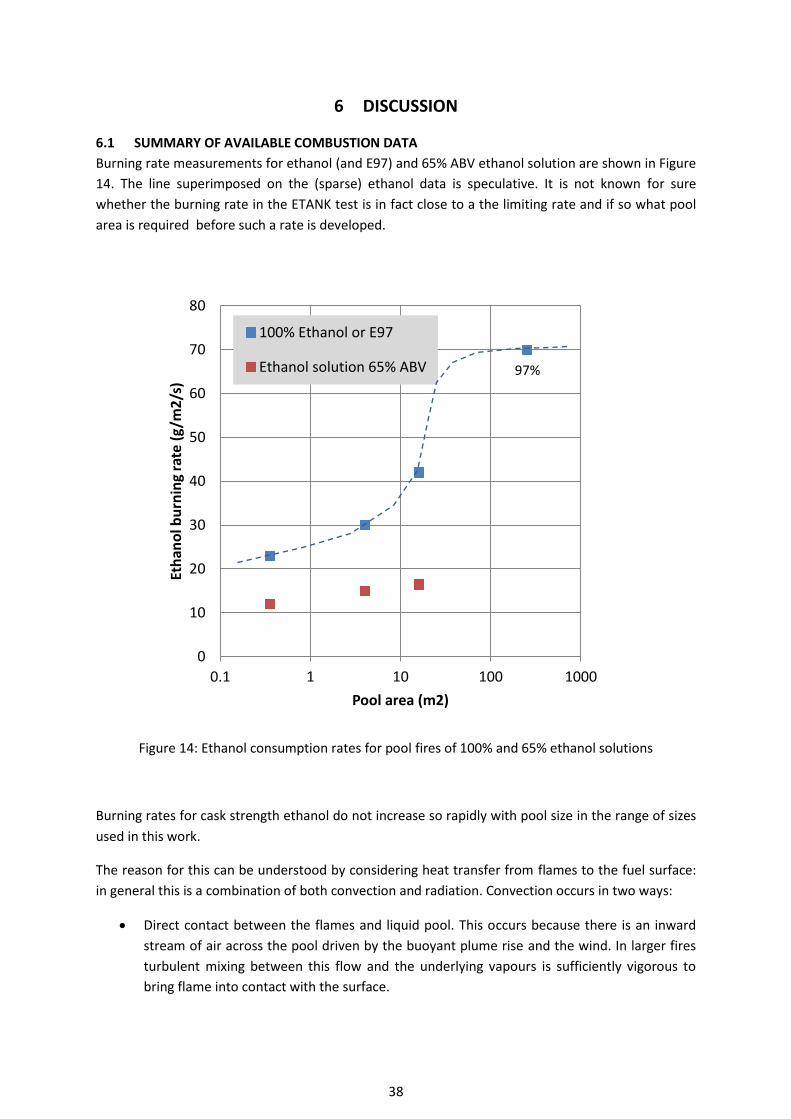
Burning rate measurements for ethanol (and E97) and 65% ABV ethanol solution are shown in Figure
14. The line superimposed on the (sparse) ethanol data is speculative. It is not known for sure
whether the burning rate in the ETANK test is in fact close to a the limiting rate and if so what pool
area is required before such a rate is developed.
Figure 14: Ethanol consumption rates for pool fires of 100% and 65% ethanol solutions
Burning rates for cask strength ethanol do not increase so rapidly with pool size in the range of sizes
used in this work.
The reason for this can be understood by considering heat transfer from flames to the fuel surface:
in general this is a combination of both convection and radiation. Convection occurs in two ways:
Direct contact between the flames and liquid pool. This occurs because there is an inward
stream of air across the pool driven by the buoyant plume rise and the wind. In larger fires
turbulent mixing between this flow and the underlying vapours is sufficiently vigorous to
bring flame into contact with the surface.
0
10
20
30
40
50
60
70
80
0.1 1 10 100 1000
Eth
ano
l bu
rnin
g ra
te (
g/m
2/s
)
Pool area (m2)
100% Ethanol or E97
Ethanol solution 65% ABV 97%
39
Heat transfer to the material at edge of the pool (and then conduction into the liquid pool).
This is most important for steel trays with a small liquid area and a large area of exposed
steel.
Relevant convective heat transfer coefficients are of order 20-30 W/m2/K and the temperature
difference between flames and fuel is around 1000 K; so convective heat input into vaporisation of
fuel is of order 20-30 kW/m2.
Even when viewed through the full width of the tray the emissive power of cask strength whisky
spirit flames is of a similar magnitude; and most of the fuel surface sees a flame that is very much
thinner or shallower than the tray width. Effective radiative heat transfer rates are consequently
small compared with convection which means that convective heating controls the burning rate.
Since convection is relatively insensitive to scale, the burning rate only increases slowly with pool
diameter.
In contrast radiation from 100% ethanol flames makes an important contribution to fuel
vaporisation even at smaller scales. For large pools radiation effectively controls the fuel
vaporisation rate. Beyond a certain size all of the pool sees a flame that is sufficiently thick that its
emissivity is close to 1, the rate of burning then reaches a limiting level.
Moderate winds reduce the flame height but do not appear to significantly change the burning rate
or SEP.
6.2 SUMMARY OF IMPLICATIONS
6.2.1 Ethanol
The current experiments with pools up to 16 m2 are not large enough to reach the radiation
controlled limit for 100% ethanol.
Large scale data obtained in the ETANK project are a reasonable basis for risk assessment. The
burning rate was around 70 g/m2/s and the surface emissive power was 130 kW/m2. The flames
were conical and there was no significant shrouding by soot.
6.2.2 Cask strength whisky
The current experiments with pools up to 16 m2 are not large enough to reach a limiting burn rate
for cask strength whisky. The rate of burning changes slowly over this range of sizes, and it difficult
to believe that the burning rate will ever exceed half that of 100% ethanol (35 g/m2/s).
The effective surface emissive power of the cask strength flames is much lower than for 100%
ethanol as soot concentrations are low. Even for very large flames the SEP is only likely to be a
fraction of that for 100% ethanol.
The current method of modelling of cask strength whisky fires as 100% ethanol appears rather
conservative and may overestimate the distance to dangerous thermal dose by a factor of order 2.
Much larger experiments would be necessary to provide the data to support more realistic
assessments.

40
This finding only applies to large unconfined releases of cask strength whisky burning outdoors as a
large pool unaffected by any other combustible material. Other fire situations involving this material
are more complex because they might include burning casks or burning building materials.

41
7 REFERENCES
Babrauskas, V. (1988), ‘Burning Rates’, in DiNenno, P.J. (ed) SFPE Handbook of Fire Engineering,
Quincy, Mass., NFPA , Chapter 2-1.
Rew, P.J. and Hulbert, W.G. (1996), Development of a pool fire thermal radiation model [Online], HSE
Contract Research Report 96/1996. Available at
www.hse.gov.uk/research/crr_pdf/1996/crr96096.pdf (accessed 18 March 2019)
Sjöström, J., Appel,G., Amon, F. and Persson, H. (2015), ETANKFIRE –Experimental results of large
ethanol fuel pool fires [Online], Boråsa, SP Technical Research Institute of Sweden. SP Report
2015:12. Available at http://ri.diva-portal.org/smash/get/diva2:962885/FULLTEXT01.pdf (accessed 8
March 2019).

42
8 APPENDIX 1: RADIATION FROM CONICAL AND CYLINDRICAL FLAMES
The schematic below shows a conical flame with the surface is divided into a large number of small
elements defined by small increments in z (height above the base) and θ. The radiation flux Q to a
vertical target from each element is summed over the surface (numerically)
Vector position of the surface element = P = (H-z)/H ro cosθ i + (H-z)/H ro sinθ j + z k
Vector position of target = T
Vector normal to the surface element = n = cosϒcosθ i + cosϒsinθ j + sinϒ k
Choose the unit vectors so that the target position vector has no j component.
Thermal heat flux, Q, to a vertical target surface = 𝑃 ∑ 𝐹. 2𝑐𝑜𝑠𝛽1𝑐𝑜𝑠𝛽2
𝜋𝑑2𝑐𝑜𝑠𝛾. 𝑟0
𝐻−𝑧
𝐻𝜃,𝑧 ∆𝜃. ∆𝑧
i
j
T P
ϒ
θ
H (height of flame)
ro (flame base radius)
Target
Surface element

43
In this sum over all surface elements
P = Surface emissive power of the conical flame
Cosβ1= (P – T).n / d
Cosβ2= (P – T).i / d
d2=(P – T).(P – T) i.e the square of the distance from surface element to target
F = 1 when (P – T).n < 0 otherwise F = 0 this restricts the sum to elements which are in view from
the target.
Calculation for an emissive cylinder is similar but with
Vector position of the surface element = P = r0 cosθ i + ro sinθ j + z k
Vector normal to the surface element = n = cosθ i + cosθ j

44
9 APPENDIX 2: IMAGES FROM THE FIRE TEST PROGRAMME
Small-scale (0.354 m2) pool fires.
The ambient light levels are similar in each case but the camera automatically stops down to
compensate for the light from the larger fires making the background appear darker (and the smaller
fires relatively brighter).
.
45
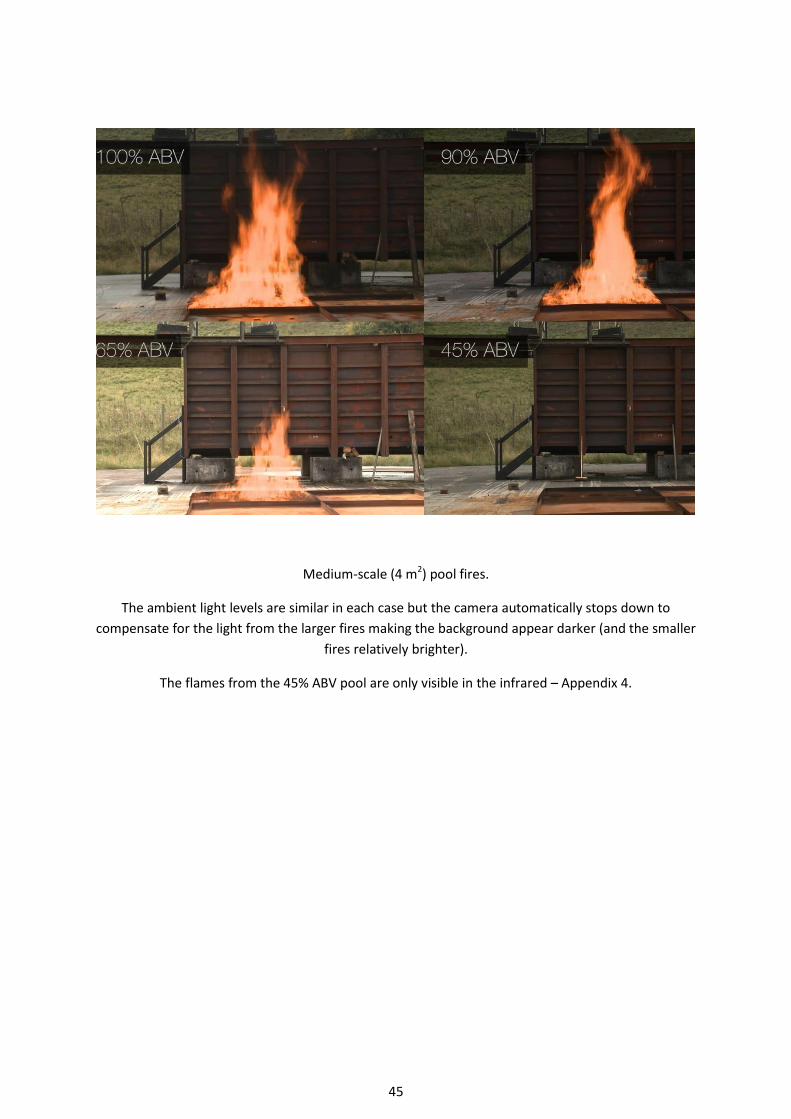
Medium-scale (4 m2) pool fires.
The ambient light levels are similar in each case but the camera automatically stops down to
compensate for the light from the larger fires making the background appear darker (and the smaller
fires relatively brighter).
The flames from the 45% ABV pool are only visible in the infrared – Appendix 4.

46
100% Ethanol 65% Ethanol ABV
Large (16m2) pool fires involving 100% ethanol and 65% Ethanol ABV

47
10 APPENDIX 3: THERMODYNAMICS OF ETHANOL/WATER FIRES
For ethanol /water mixtures the rate of ethanol consumption and heat release rate cannot be
calculated directly from the rate of volume reduction (surface regression) because the vapour also
contains water and some part of the surface regression corresponds to water loss.
Figure A3i shows the equilibrium mole fraction of ethanol in the vapour at various pool surface
temperatures for a range of liquid mole fractions (Dortmund Data Bank7). For reference a plot
showing the correspondence between liquid mole fraction and liquid volume fraction (ABV) is shown
in Figure A3ii. For example, a liquid with ABV 65% has an ethanol mole fraction of around 0.36.
Figure A3i: vapour composition as a function of temperature and liquid mole fraction.
7 http://www.ddbst.com/en/EED/VLE/VLE%20Ethanol%3BWater.php Last accessed 11/6/2018
0
0.1
0.2
0.3
0.4
0.5
0.6
0.7
0.8
0.9
1
50 55 60 65 70 75 80
Vap
ou
r e
than
ol m
ole
fra
ctio
n
Temperature (°C)
Liq mole frac = 0.35
Liq mole frac = 0.25
Liq mole frac = 0.15
48
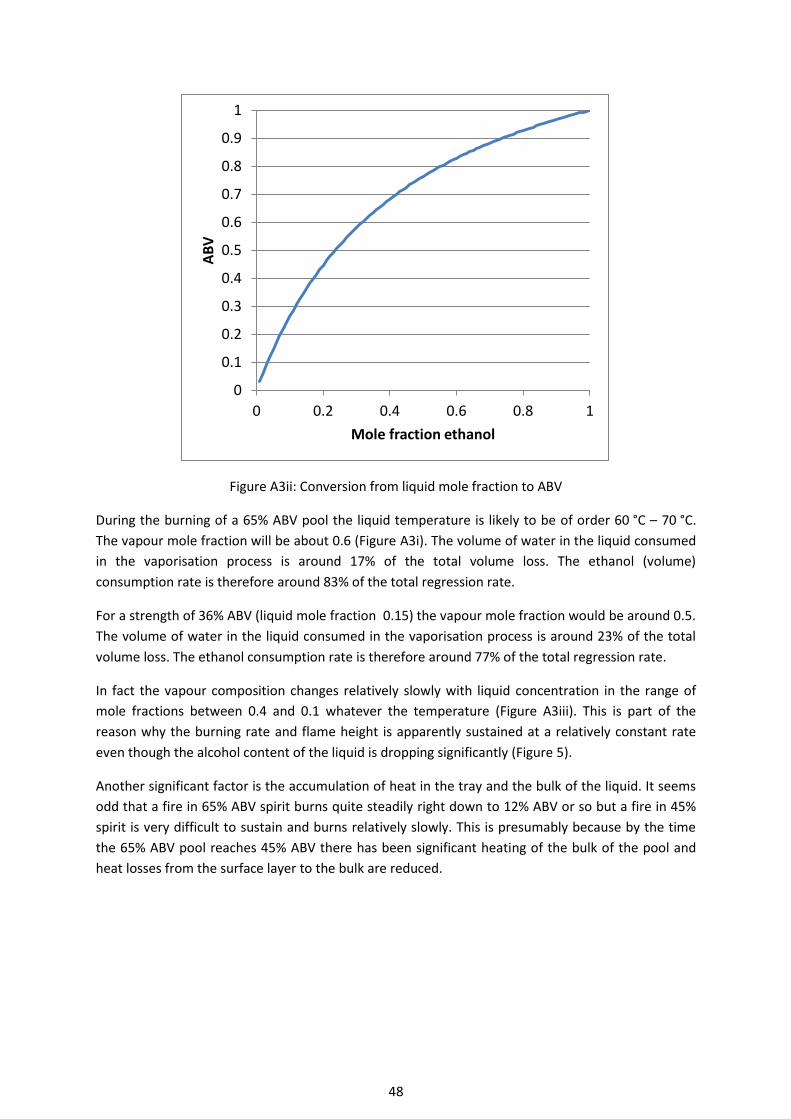
Figure A3ii: Conversion from liquid mole fraction to ABV
During the burning of a 65% ABV pool the liquid temperature is likely to be of order 60 °C – 70 °C.
The vapour mole fraction will be about 0.6 (Figure A3i). The volume of water in the liquid consumed
in the vaporisation process is around 17% of the total volume loss. The ethanol (volume)
consumption rate is therefore around 83% of the total regression rate.
For a strength of 36% ABV (liquid mole fraction 0.15) the vapour mole fraction would be around 0.5.
The volume of water in the liquid consumed in the vaporisation process is around 23% of the total
volume loss. The ethanol consumption rate is therefore around 77% of the total regression rate.
In fact the vapour composition changes relatively slowly with liquid concentration in the range of
mole fractions between 0.4 and 0.1 whatever the temperature (Figure A3iii). This is part of the
reason why the burning rate and flame height is apparently sustained at a relatively constant rate
even though the alcohol content of the liquid is dropping significantly (Figure 5).
Another significant factor is the accumulation of heat in the tray and the bulk of the liquid. It seems
odd that a fire in 65% ABV spirit burns quite steadily right down to 12% ABV or so but a fire in 45%
spirit is very difficult to sustain and burns relatively slowly. This is presumably because by the time
the 65% ABV pool reaches 45% ABV there has been significant heating of the bulk of the pool and
heat losses from the surface layer to the bulk are reduced.
0
0.1
0.2
0.3
0.4
0.5
0.6
0.7
0.8
0.9
1
0 0.2 0.4 0.6 0.8 1
AB
V
Mole fraction ethanol

49
Figure A3iii: Equilibrium liquid and vapour compositions
0
0.1
0.2
0.3
0.4
0.5
0.6
0.7
0.8
0.9
1
0 0.2 0.4 0.6 0.8 1
y M
ole
fra
ctio
n (
vap
ou
r)
x Mole fraction (liquid)
20°C
40°C
60°C

50
11 APPENDIX 4: THERMAL IMAGES FROM THE TEST PROGRAMME
Thermal images in small scale tests – individual images with legible scales follow
51
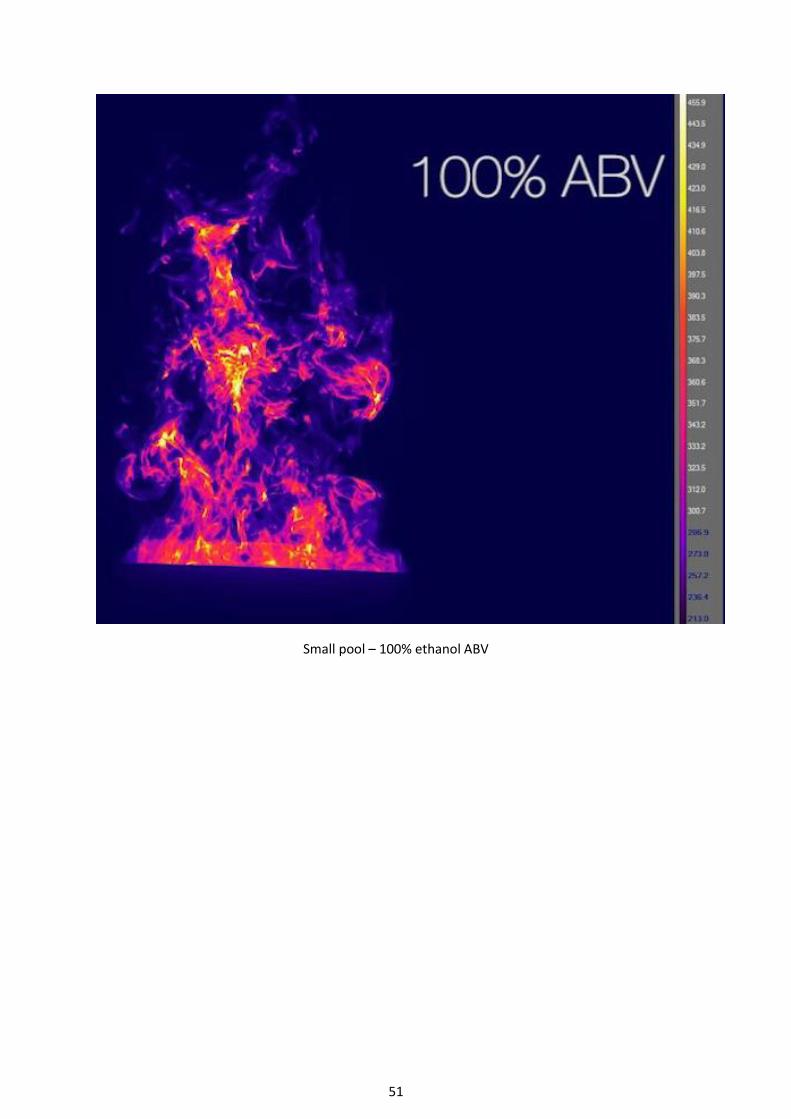
Small pool – 100% ethanol ABV
52
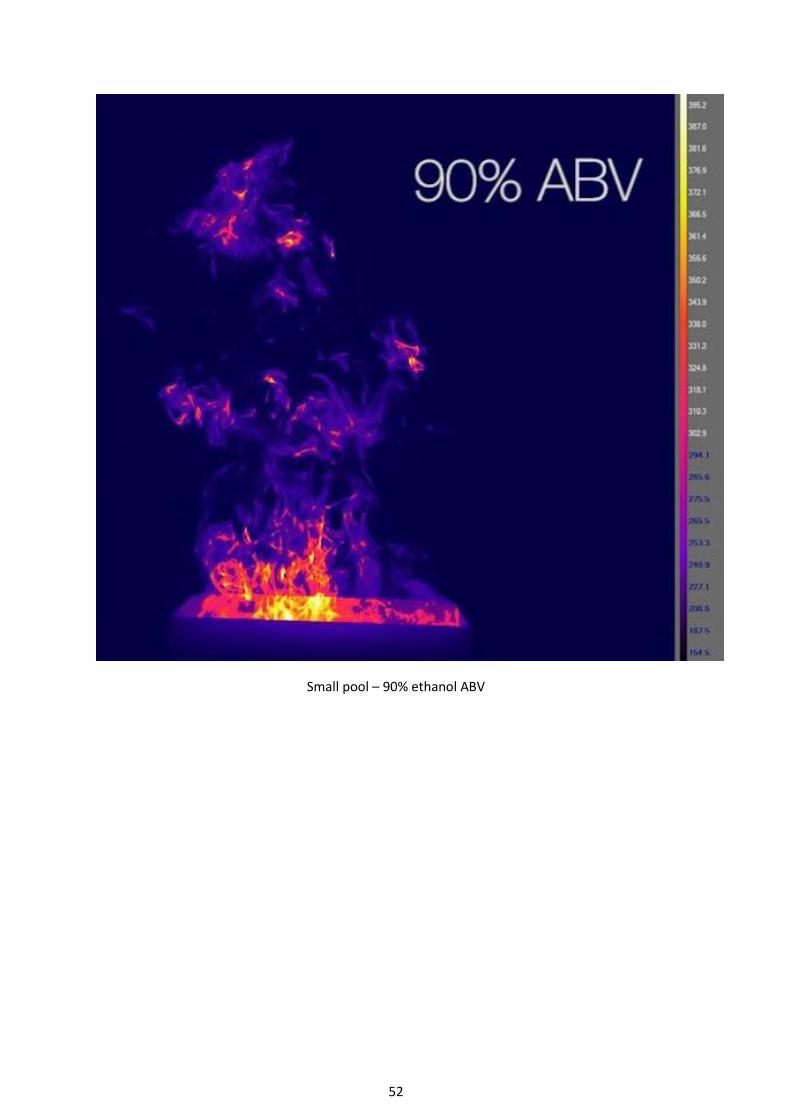
Small pool – 90% ethanol ABV

53
Small pool – 65% ethanol ABV

54
Small pool – 45% ethanol ABV

55
Medium scale pool fires – various strengths.
Individual images with legible scales follow
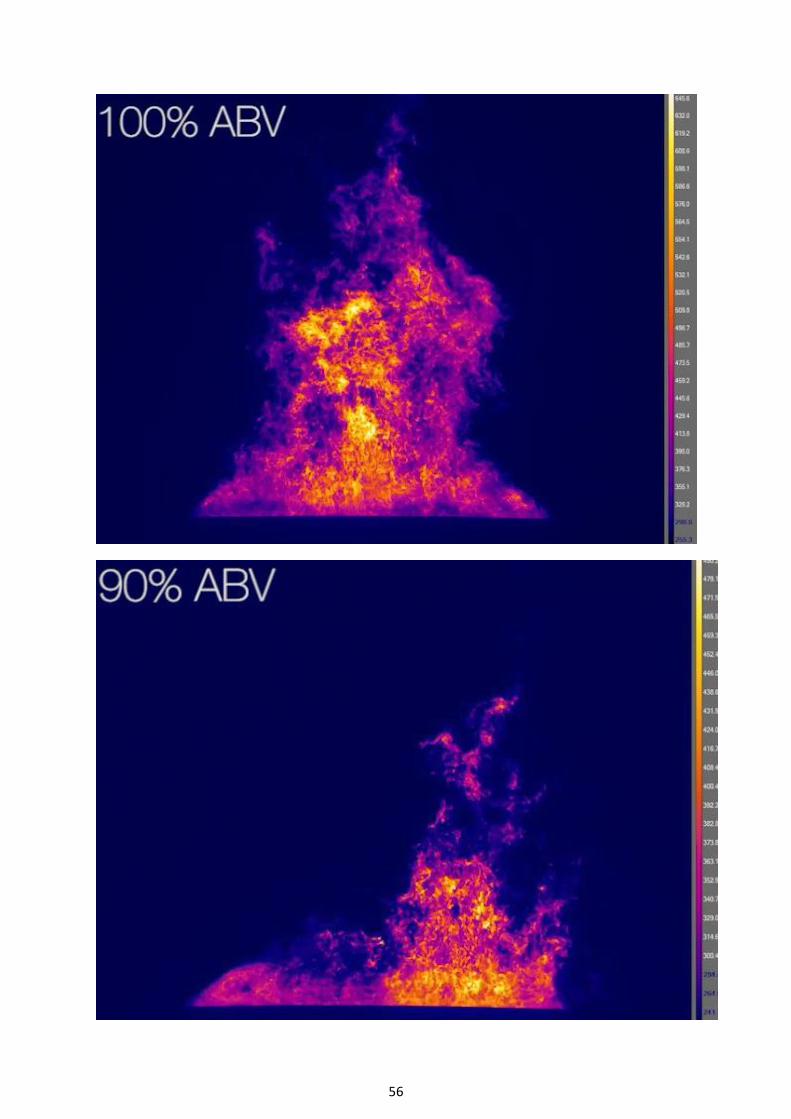
56
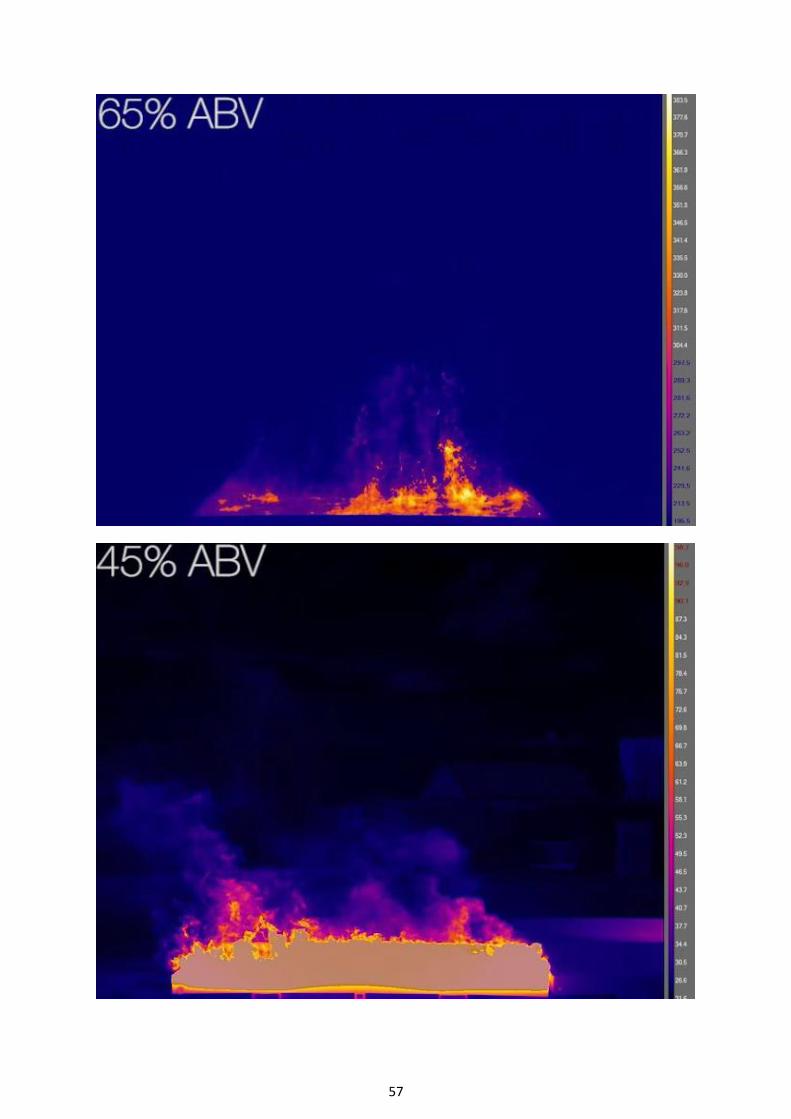
57

58

Published by the Health & Safety Executive 05/19
Measurements of burning rate and radiative heat transfer for pools of ethanol and cask-strength whisky
RR1144
www.hse.gov.uk
Large storage sites for alcoholic spirits are regulated under the COMAH Regulations by HSE, and the site operators require Hazardous Substance Consent to permit them to store these flammable liquids. HSE needs to consider the magnitude and extent of harm to people from potential incidents involving these substances, including that caused by thermal radiation from spirit fires.
Data from scientific sources on the thermal output of fires involving ethanol is limited, reporting high strength ethanol only. This is not representative of fires in industry involving spirit beverages with a range of alcohol by volume (ABV) strengths in large pools, suggesting that use of this sparse data could lead to overly conservative results in the estimation of harm from potential events. To address this, fire specialists at HSE’s laboratory carried out a range of pool fire tests with pool areas up to 16 m² of various ethanol/water mixtures and waste whisky, which was supplied by the Scotch Whisky Association.
The data collected from these tests will assist HSE in producing more appropriate, lower estimates of harm from spirit fires. It may also assist risk management by companies in the alcoholic beverage sector and specialist consultants they may engage.
This report and the work it describes were funded by the Health and Safety Executive (HSE). Its contents, including any opinions and/or conclusions expressed, are those of the authors alone and do not necessarily reflect HSE policy.