radio-astronomy precedent for optical interferometer imaging
TRANSCRIPT
Vol. 3, No. 8/August 1986/J. Opt. Soc. Am. A 1311
Radio-astronomy precedent for optical interferometerimaging
George W. Swenson, Jr.
Departments of Electrical and Computer Engineering and of Astronomy, University of Illinois at Urbana-Champaign, 1406 W. Green Street, Urbana, Illinois 61801
Received December 9, 1985; accepted April 1, 1986
Radio-astronomical correlator arrays have demonstrated the ability of producing images of cosmic radio sourceswith extremely high resolution, dynamic range, and precision. A large body of experience and theory has beendeveloped in connection with this technology that may form useful precedents for the development of similartechnology in the optical and infrared regions of the electromagnetic spectrum. The production of images ofsources from measurements of their mutual coherence functions is demonstrated, and the capabilities and limita-tions of the technique are discussed. A prototype optical instrument is proposed, and its advantages and liabilitiesare identified.
INTRODUCTION
An exceptionally successful technique has been developedby radio astronomers for producing high-resolution imagesof cosmic radio sources. This method, here designated asinterferometric image synthesis, makes use of the vanCittert-Zernike theorem,1' 2 which states, in effect, that themutual coherence function of the electromagnetic field of adistant, completely incoherent source is the spatial Fouriertransform of the angular brightness distribution of thesource. One component of the mutual coherence functioncan be measured in a plane normal to the direction to thesource by sampling the electric field at two points and crosscorrelating the samples. The result is also known as thecomplex visibility and is a function of the vector separationof the sampling points and not of their absolute positions.Thus the measurements can be made anywhere in the dis-tant field of the source. From a complete set of such mea-surements, the brightness structure of the distant source canbe reconstructed by Fourier transformation.
In the early development of radio-astronomical imagesynthesis, optical interferometry provided a useful prece-dent. Subsequently, radio astronomers have developed asuite of sophisticated techniques that can, in turn, providemodels for further development of techniques for visible andinfrared wavelengths. Although the available technologies,the properties of the transmission media, and the photonenergies are significantly different in these disparate wave-length regimes, there are enough similarities in principle andapplication to make comparisons worthwhile. Modern ra-dio telescopes, as epitomized by the very-large-array (VLA)3
and by very-long-baseline (VLBI) networks, 4' 5 can produceimages of outstanding angular resolution and dynamicrange. A typical product of the VLA, for example, is apicture with a field of view of 2 min of arc (arcmin), anangular resolution of 0.6 sec of arc (arcsec), and a dynamicrange of 35 dB at a wavelength of 6.0 cm. With a worldwideVLBI array operating at a wavelength of 1 cm, the angularresolution approaches 0.0001 arcsec. Provided that numer-
ous technical problems in transferring the radio technologyto optical and infrared wavelengths can be solved, compara-ble results should be obtained.
THEORY OF THE RADIO INTERFEROMETER
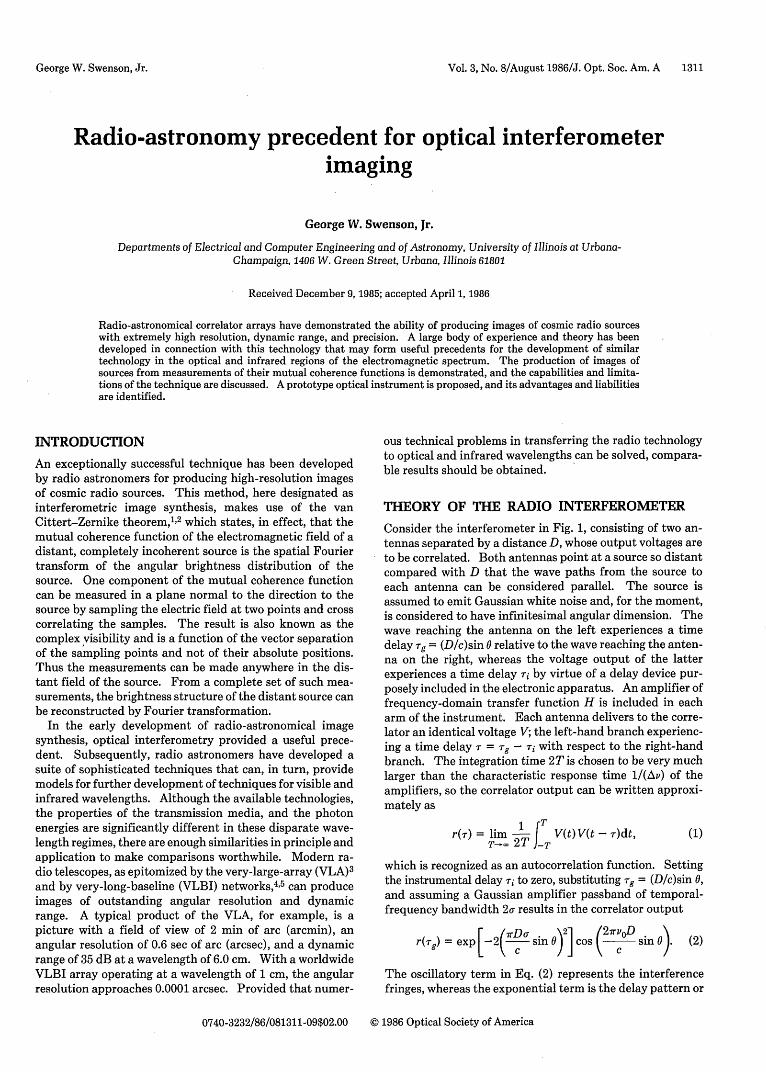
Consider the interferometer in Fig. 1, consisting of two an-tennas separated by a distance D, whose output voltages areto be correlated. Both antennas point at a source so distantcompared with D that the wave paths from the source toeach antenna can be considered parallel. The source isassumed to emit Gaussian white noise and, for the moment,is considered to have infinitesimal angular dimension. Thewave reaching the antenna on the left experiences a timedelay Tg = (D/c)sin 0 relative to the wave reaching the anten-na on the right, whereas the voltage output of the latterexperiences a time delay ri by virtue of a delay device pur-posely included in the electronic apparatus. An amplifier offrequency-domain transfer function H is included in eacharm of the instrument. Each antenna delivers to the corre-lator an identical voltage V; the left-hand branch experienc-ing a time delay r = rg - ri with respect to the right-handbranch. The integration time 2T is chosen to be very muchlarger than the characteristic response time 1/(Av) of theamplifiers, so the correlator output can be written approxi-mately as
1 T
r(T) = lim - V(t)V(t - T)dt,T-X 2T -T
(1)
which is recognized as an autocorrelation function. Settingthe instrumental delay Ti to zero, substituting rg = (D/c)sin 0,and assuming a Gaussian amplifier passband of temporal-frequency bandwidth 2o- results in the correlator output
r(Tg) = exp [-2(-sin 0)2] cos oD sin 0. (2)
The oscillatory term in Eq. (2) represents the interferencefringes, whereas the exponential term is the delay pattern or
0740-3232/86/081311-09$02.00 © 1986 Optical Society of America
George W. Swenson, Jr.
1312 J. Opt. Soc. Am. A/Vol. 3, No. 8/August 1986
Output
Fig. 1. An elementary interferometer.
bandwidth pattern. The fringe occurring closest to thepoint T = 0, ( = 0), at which the delay pattern is maximum,is called the white-light fringe. In most cases it is desirableto operate in the vicinity of the white-light fringe so as toobtain the largest possible signal. This can be achieved byadjusting the instrumental delay. In the case of an interfer-ometer based on the Earth and observing a cosmic source,the angle 0 changes continuously, and regular adjustment ofTj is required. If the instrumental delay is adjusted in stepsthat result in phase changes of 2n7r rad, where n is an integer,no change in phase of the fringe function results. This is notthe usual way to do it,2 but it will suffice for the present.
Define 0 as the angle for which = i-Tg = 0, 0' = 00 - 0,
u = (D/c)cos 00 = (D/Xo)cos O0, (3)
and I' = sin 0'. When 0' is very small, the bandwidth patternis nearly unity, so the fringe term in the correlator output is
FQ') = cos(27ruo0 '), (4)
where u can be interpreted as a spatial frequency measuredin cycles per radian. As the correlated quantities are volt-ages, the correlator output represents power. Equation (4)thus represents the antenna power pattern of the interfer-ometer, analogous to the power-response pattern of a singleantenna or the point-spread function of an optical telescope.
The response of the interferometer to an extended sourcecan be determined by convolution of the interferometerpower pattern with the source-brightness distribution. As-sume that the two antennas comprising the instrument areaimed directly at the source at all times and that their indi-vidual patterns are broad in comparison with the width ofthe source; then the interferometer's correlator output is
MO = AvP urce cos[27ruoQ' - )]A(Q' - ")B(Q")d4", (5)
where B is the source brightness, Vv is the temporal-frequen-cy bandwidth of the instrument, and A is the effective areaof an antenna. The Fourier transform of the correlatoroutput is
r(u) = / 2[6(u - UO) + (u + uo)b(u)AAv= /2AAv[b(uo)b(u - u0 ) + b(-u0 )6(u + uo)], (6)
which indicates that the spatial-frequency spectrum of thesource, as filtered by the interferometer, consists of twodelta functions at plus and minus u0 on the u axis. Recallthat u0 = (D/X)cos 00. To obtain other points in the spatial-frequency spectrum, one must observe with additional val-ues of the projected baseline u0 .
The procedure outlined above might be termed spatial-frequency spectroscopy. In astrophysics temporal-frequen-cy spectroscopy is also of great importance, and, in fact, it isfrequently necessary to make both kinds of measurementsimultaneously. In correlating the two signals from theantennas, it is possible to add an additional time delay r' toone of the signals, in addition to the delay ri necessary toensure operation near the center of the bandwidth pattern(near the white-light fringe). Then, if several correlatorsare operated in parallel on the same baseline, each with itsown different value of T', the temporal-frequency spectrumof the spatial-frequency component corresponding to thatprojected baseline u0 can be derived. The array of T'-depen-dent visibilities for the value of u is Fourier transformedwith respect to T into the temporal-frequency domain, Atemporal-frequency spectrum for each term (each value ofuo) in the spatial-frequency spectrum having thus been ob-tained, a spatial image can be constructed for each temporal-frequency component by Fourier transformation from thespatial frequency to the spatial domain. This spectroscopytechnique has been employed extensively and successfully inradio astronomy. 6 -8
Image SynthesisTo construct an image of a source, it is necessary to obtainenough Fourier components to specify its form uniquely. Inthe demonstration above, for purposes of simplicity, thegeometry was confined to a plane. In order to reconstruct aone-dimensional image of a source, it is necessary to samplethe u domain at a sufficient number of points. The requiredsampling interval is determined by the size of the image to beformed. In accordance with the classical theory of Fourierseries, this interval is Au = 1/W('), where W is the width ofthe field to be synthesized.
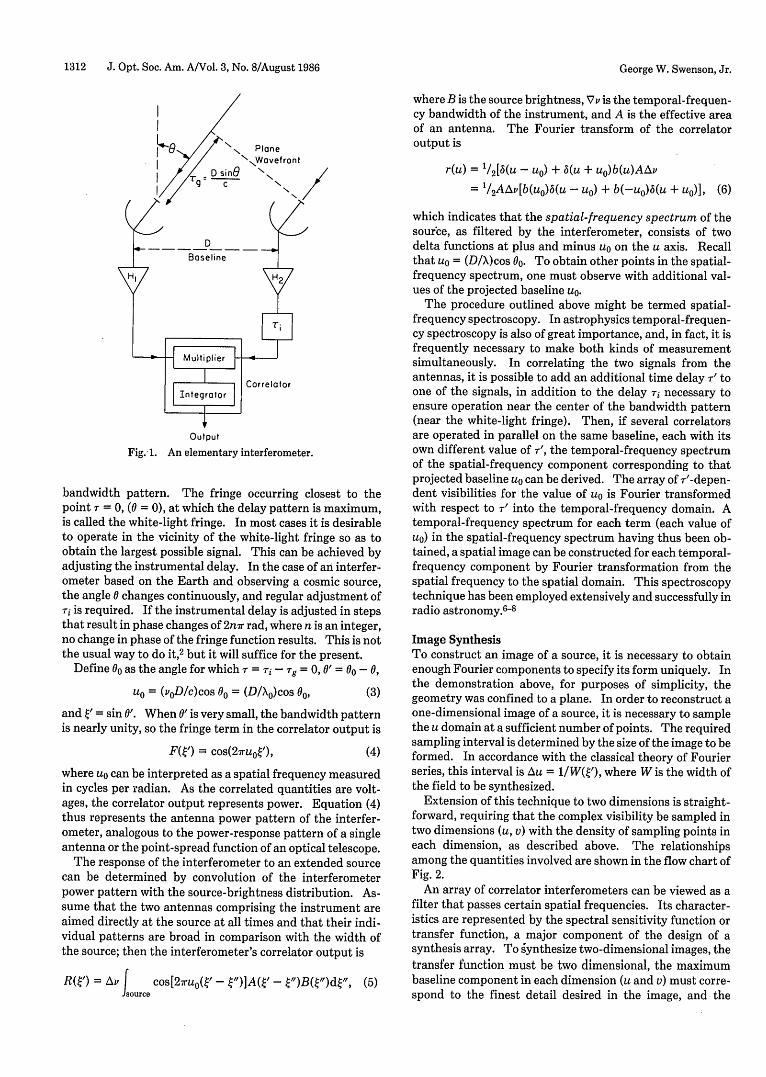
Extension of this technique to two dimensions is straight-forward, requiring that the complex visibility be sampled intwo dimensions (u, v) with the density of sampling points ineach dimension, as described above. The relationshipsamong the quantities involved are shown in the flow chart ofFig. 2.
An array of correlator interferometers can be viewed as afilter that passes certain spatial frequencies. Its character-istics are represented by the spectral sensitivity function ortransfer function, a major component of the design of asynthesis array. To synthesize two-dimensional images, thetransfer function must be two dimensional, the maximumbaseline component in each dimension (u and v) must corre-spond to the finest detail desired in the image, and the
George W. Swenson, Jr.
Vol. 3, No. 8/August 1986/J. Opt. Soc. Am. A 1313
VOLTAGERECEPTION
PATTERN
MAGNITUDE
being observed) is rotated and foreshortened as the Earthturns. In 24 sidereal hours the tip of the baseline vectordescribes an ellipse in the u, v plane. The parametric equa-tions of the locus are
u = D cos d sin(H - h),X
DV = - [sin d cos - cos d sin 6 cos(H - h]
X
INDICATES FOURIER TRANSFORM
Fig. 2. Flow chart showing the relationships among antenna quan-tities. The part below the dashed line applies to correlator arrays(linear in intensity). The entire chart applies to phased arrays orsingle-aperture systems.
sampling interval must correspond to the desired field ofview. The number of points in the u, v plane sampledinstantaneously, that is, the number of coexisting interfer-ometer baselines, is N(N - 1)/2, where N is the number ofantennas in the array. As a general rule, providing enoughantennas simultaneously to cover all the points in the u, vplane necessary to synthesize a complete image with usefulresolution and field of view is quite an expensive undertak-ing. For example, a square field of view with 100 resolutionelements per side (10,000 pixels total) would require a mini-mum of 150 antennas and 10,000 correlators, even if such atwo-dimensional array could be designed with no redundantbaselines. In fact, however, a two-dimensional array con-tains a high degree of redundancy, so these figures are highlyoptimistic. Although redundant baselines do contributebeneficially to the accuracy of the reconstructed image,more-complete coverage of the u, v plane is obtained whenthe available antennas are disposed in a minimum-redun-dancy configuration.
No analytical procedure is currently available for design-ing minimum-redundancy arrays in two dimensions, al-though one-dimensional minimum-redundancy configura-tions have been tabulated.9 "10 In the two-dimensional case,one resorts to computer modeling,1"-'3 which produces ac-ceptable arrays that, if not truly minimally redundant, arebelieved to approach this condition closely.
For astronomical imaging, fortunately, an alternativetechnique is available that permits great economy in arraydesign. In the case of an array fixed to the ground, theprojection of a baseline on the celestial sphere (at the source
where u is the baseline projection in the hour-angle direc-tion, v is the projection in the declination direction, d and hare, respectively, the declination and the hour angle of theintersection of the vector baseline D with the northern celes-tial hemisphere, and 6 and H are, respectively, the declina-tion and the hour angle of the source. By sampling at inter-vals along the elliptical locus, one may obtain from a singlephysical baseline many points in the transfer function astime elapses. In this way a few antennas can constitute anarray sufficient to synthesize high-resolution images oversubstantial fields of view. This Earth-rotation synthesistechnique is now widely used and has, for the most part,displaced other techniques of high-resolution radio astrono-my.
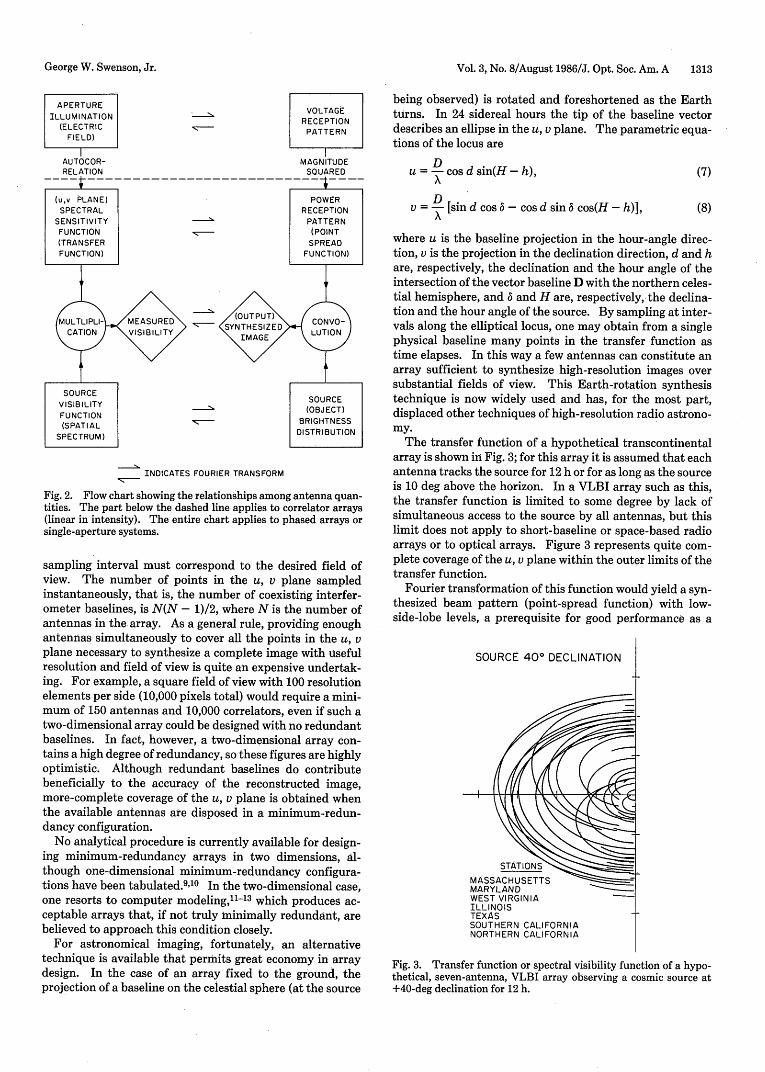
The transfer function of a hypothetical transcontinentalarray is shown in Fig. 3; for this array it is assumed that eachantenna tracks the source for 12 h or for as long as the sourceis 10 deg above the horizon. In a VLBI array such as this,the transfer function is limited to some degree by lack ofsimultaneous access to the source by all antennas, but thislimit does not apply to short-baseline or space-based radioarrays or to optical arrays. Figure 3 represents quite com-plete coverage of the u, v plane within the outer limits of thetransfer function.
Fourier transformation of this function would yield a syn-thesized beam pattern (point-spread function) with low-side-lobe levels, a prerequisite for good performance as a
SOURCE 400 DECLINATION
STATIONS N__MASSACHUSETTSMARYLANDWEST VIRGINIAILLINOISTEXASSOUTHERN CALIFORNIANORTHERN CALIFORNIA
Fig. 3. Transfer function or spectral visibility function of a hypo-thetical, seven-antenna, VLBI array observing a cosmic source at+40-deg declination for 12 h.
APERTUREILLUMINATION
(ELECTRICFIELD)
IAUTOCOR-
(7)
(8)
George W. Swenson, Jr.
1314 J. Opt. Soc. Am. A/Vol. 3, No. 8/August 1986
synthesis instrument. A more direct and equally valid wayof evaluating an array is visual inspection of the transferfunction. In general, it is desirable that the support of thefunction be compact and symmetrical and that there be fewholes in the function larger than the sampling interval dic-tated by the desired field of view. Such a hole, if it iscompact, is represented in the synthesized image by a sinus-oidal striation in the brightness of the image. A commonsituation is to have too few antennas to achieve the desiredresolution and field of view, and the problem then for thearray designer is to dispose the antennas in such a way as tominimize the ill effects of inadequate sampling of the u, vplane. There is no optimum solution to this problem, unlessthe brightness distribution of the source is known, in whichcase the transfer function can be tailored to fit it. In themore general case it seems most appropriate to ensure thatthe Fourier components of the source be sampled as com-pletely as possible. Computer modeling programs to pro-duce objective measures of array quality have been pub-lished,11-'3 but the method of subjective visual inspectionseems to be preferred.
In Fig. 3 the transfer function is produced by an array ofseven antennas observing a source at 40-deg declination for12 h. The antennas are at existing observatories, for conve-nience, so the array is not optimized for minimum redundan-cy or uniform coverage of the u, v plane and is shown forillustrative purposes only. As the transfer function is sym-metrical through the origin of the u, v plane, only one half ofthe plane need be shown. This plot is fairly typical of the adhoc VLBI arrays that have been used heretofore. The trans-fer function of an array with antennas optimally locatedwould show fewer and smaller gaps in coverage.
There may necessarily be some compromises in design ofVLBI arrays because of political or geographical constraints,but, by using the Earth-rotation technique, a lower-resolu-tion array can easily be designed that will have virtuallycomplete (u, v)-plane coverage for a given field of view andresolution. The same statement would apply to an opticalarray of any conceivable parameters.
IMAGE CONSTRUCTION
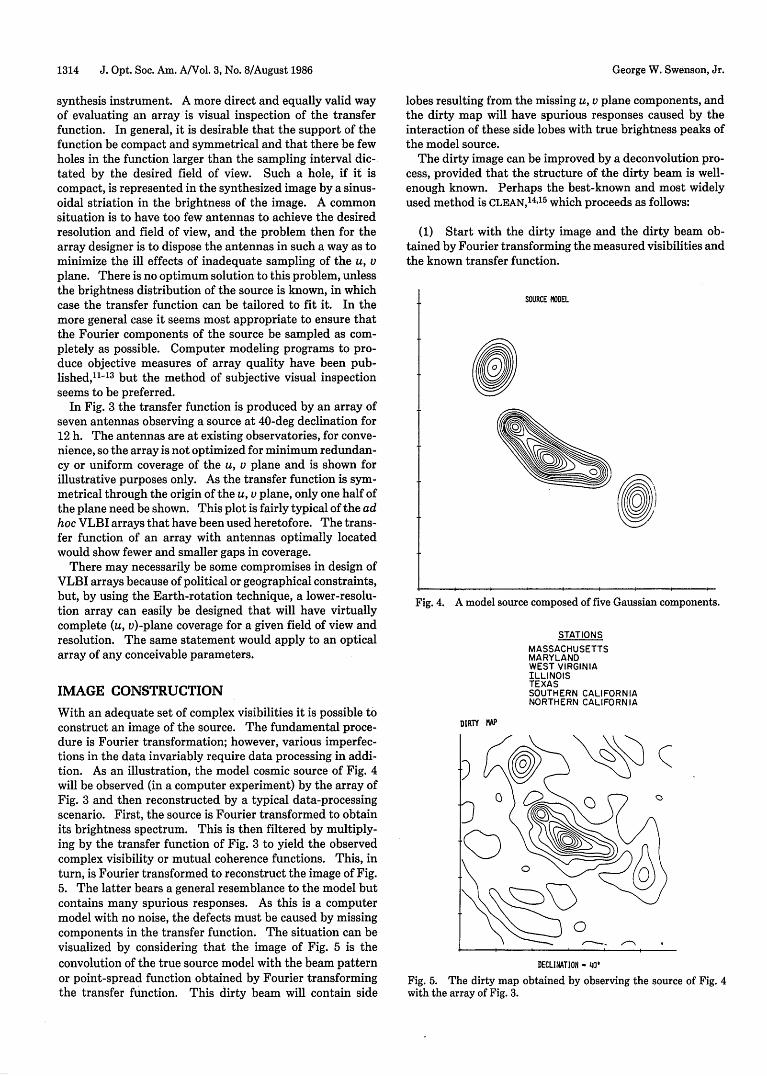
With an adequate set of complex visibilities it is possible toconstruct an image of the source. The fundamental proce-dure is Fourier transformation; however, various imperfec-tions in the data invariably require data processing in addi-tion. As an illustration, the model cosmic source of Fig. 4will be observed (in a computer experiment) by the array ofFig. 3 and then reconstructed by a typical data-processingscenario. First, the source is Fourier transformed to obtainits brightness spectrum. This is then filtered by multiply-ing by the transfer function of Fig. 3 to yield the observedcomplex visibility or mutual coherence functions. This, inturn, is Fourier transformed to reconstruct the image of Fig.5. The latter bears a general resemblance to the model butcontains many spurious responses. As this is a computermodel with no noise, the defects must be caused by missingcomponents in the transfer function. The situation can bevisualized by considering that the image of Fig. 5 is theconvolution of the true source model with the beam patternor point-spread function obtained by Fourier transformingthe transfer function. This dirty beam will contain side
lobes resulting from the missing u, v plane components, andthe dirty map will have spurious responses caused by theinteraction of these side lobes with true brightness peaks ofthe model source.
The dirty image can be improved by a deconvolution pro-cess, provided that the structure of the dirty beam is well-enough known. Perhaps the best-known and most widelyused method is CLEAN,14 15 which proceeds as follows:
(1) Start with the dirty image and the dirty beam ob-tained by Fourier transforming the measured visibilities andthe known transfer function.
SOURCE MODEL
ok~~~()Fig. 4. A model source composed of five Gaussian components.
STATIONS
MASSACHUSETTSMARYLANDWEST VIRGINIAILLINOISTEXASSOUTHERN CALIFORNIANORTHERN CALIFORNIA
DIRTY MAP
DECLINATION 40'
Fig. 5. The dirty map obtained by observing the source of Fig. 4with the array of Fig. 3.
0 . i l l l l :
George W. Swenson, Jr.
Vol. 3, No. 8/August 1986/J. Opt. Soc. Am. A 1315
CLEANED MAP
STATIONS
MASSACHUSETTSMARYLANDWEST VIRGINIAILLINOISTEXASSOUTHERN CALIFORNIANORTHERN CALIFORNIA
©
DECLINATION - 40'
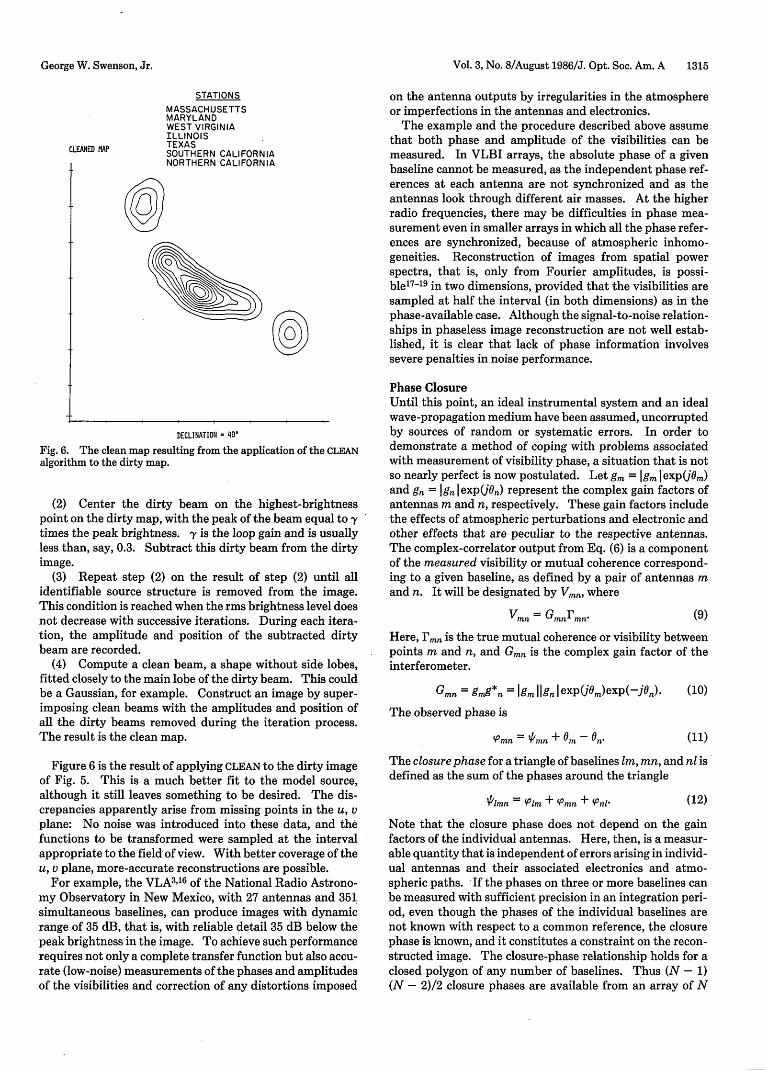
Fig. 6. The clean map resulting from the application of the CLEANalgorithm to the dirty map.
(2) Center the dirty beam on the highest-brightnesspoint on the dirty map, with the peak of the beam equal to ytimes the peak brightness. y is the loop gain and is usuallyless than, say, 0.3. Subtract this dirty beam from the dirtyimage.
(3) Repeat step (2) on the result of step (2) until allidentifiable source structure is removed from the image.This condition is reached when the rms brightness level doesnot decrease with successive iterations. During each itera-tion, the amplitude and position of the subtracted dirtybeam are recorded.
(4) Compute a clean beam, a shape without side lobes,fitted closely to the main lobe of the dirty beam. This couldbe a Gaussian, for example. Construct an image by super-imposing clean beams with the amplitudes and position ofall the dirty beams removed during the iteration process.The result is the clean map.
on the antenna outputs by irregularities in the atmosphereor imperfections in the antennas and electronics.
The example and the procedure described above assumethat both phase and amplitude of the visibilities can bemeasured. In VLBI arrays, the absolute phase of a givenbaseline cannot be measured, as the independent phase ref-erences at each antenna are not synchronized and as theantennas look through different air masses. At the higherradio frequencies, there may be difficulties in phase mea-surement even in smaller arrays in which all the phase refer-ences are synchronized, because of atmospheric inhomo-geneities. Reconstruction of images from spatial powerspectra, that is, only from Fourier amplitudes, is possi-ble17 '19 in two dimensions, provided that the visibilities aresampled at half the interval (in both dimensions) as in thephase-available case. Although the signal-to-noise relation-ships in phaseless image reconstruction are not well estab-lished, it is clear that lack of phase information involvessevere penalties in noise performance.
Phase ClosureUntil this point, an ideal instrumental system and an idealwave-propagation medium have been assumed, uncorruptedby sources of random or systematic errors. In order todemonstrate a method of coping with problems associatedwith measurement of visibility phase, a situation that is notso nearly perfect is now postulated. Let gm = jgm | exp(jOm)and gn = Ign expj0,n) represent the complex gain factors ofantennas m and n, respectively. These gain factors includethe effects of atmospheric perturbations and electronic andother effects that are peculiar to the respective antennas.The complex-correlator output from Eq. (6) is a componentof the measured visibility or mutual coherence correspond-ing to a given baseline, as defined by a pair of antennas mand n. It will be designated by Vmn, where
Vmn = GmnJmn (9)
Here, rn is the true mutual coherence or visibility betweenpoints m and n, and Gn is the complex gain factor of theinterferometer.
Gmn = 9m9*n = I Ign I exp(J0)exp(-i n)-
The observed phase is
SPmn = 'Pmn + Om - ,
(10)
(11)
Figure 6 is the result of applying CLEAN to the dirty imageof Fig. 5. This is a much better fit to the model source,although it still leaves something to be desired. The dis-crepancies apparently arise from missing points in the u, vplane: No noise was introduced into these data, and thefunctions to be transformed were sampled at the intervalappropriate to the field of view. With better coverage of theu, v plane, more-accurate reconstructions are possible.
For example, the VLA3,16 of the National Radio Astrono-my Observatory in New Mexico, with 27 antennas and 351simultaneous baselines, can produce images with dynamicrange of 35 dB, that is, with reliable detail 35 dB below thepeak brightness in the image. To achieve such performancerequires not only a complete transfer function but also accu-rate (low-noise) measurements of the phases and amplitudesof the visibilities and correction of any distortions imposed
The closure phase for a triangle of baselines m, mn, and nl isdefined as the sum of the phases around the triangle
OPmn ' 'Pim + ';mn + (Pnl (12)
Note that the closure phase does not depend on the gainfactors of the individual antennas. Here, then, is a measur-able quantity that is independent of errors arising in individ-ual antennas and their associated electronics and atmo-spheric paths. If the phases on three or more baselines canbe measured with sufficient precision in an integration peri-od, even though the phases of the individual baselines arenot known with respect to a common reference, the closurephase is known, and it constitutes a constraint on the recon-structed image. The closure-phase relationship holds for aclosed polygon of any number of baselines. Thus (N - 1)(N - 2)/2 closure phases are available from an array of N
i j~~~~~~~~~~~~
George W. Swenson, Jr.
1316 J. Opt. Soc. Am. A/Vol. 3, No. 8/August 1986
antennas. Together with N(N - 1)/2 measured amplitudesthese constitute (N - 1)2 data. N(N - 1) numbers areneeded to specify completely all the potentially measurableinstantaneous visibilities, so there would appear to be N - 1too few data for the image to be determined unambiguously.In any conventional application, however, there are inevita-bly a number of redundant baselines that reduce the numberof unknown quantities. Also, as discussed above, it is possi-ble in two dimensions with sufficiently dense sampling toreconstruct an image that is essentially unambiguous. Anyadditional phase-closure constraints will accelerate conver-gence in the iterative reconstruction procedures and willenhance the signal-to-noise ratio in the image. The greaterthe number of antennas in an array, the more nearly com-plete is the array of data obtained from visibility amplitudemeasurements and phase-closure relations. For example,with 10 antennas, 90% of the closure phases potentiallyavailable are obtained, and, with 20 antennas, 95%. It mayalso occur that amplitude data are unreliable by virtue ofuncertain radio-receiver and antenna gains, atmospheric ab-sorption, unreliable antenna pointing, etc. An amplitude-closure20 relation exists, relating the visibility amplitudes ona closed polygon of baselines involving at least four anten-nas, that can be used as a constraint on the reconstructedimage. From N antennas N(N - 3)/2 independent closureamplitudes are available. If reliance is placed entirely onphase- and amplitude-closure relations and not on directlymeasured complex visibilities, N 2 - 3N + 1 data are avail-able to determine N 2 - N quantities in the image. Again,there is a clear advantage in having a large number of anten-nas in an array.
Heterodyne InterferometryIn radio-astronomy practice, the heterodyne radio receiver8
is invariably used as the detector of the cosmic signal. Inthis technique the incoming polychromatic radio-frequencyvoltage from the antenna is multiplied by (mixed with) amonochromatic local-oscillator signal, producing two bandsof frequencies, one above and one below the local-oscillatorfrequency.
In each of these translated bands, the temporal-frequencyspectrum of the original signal is faithfully reproduced, al-though the spectrum may or may not be inverted, dependingon whether the cosmic signal band being received is higher orlower in frequency than the local oscillator. The heterodynetechnique can be used to translate a signal to a higher- orlower-frequency band or to superimpose two bands symmet-rically situated above and below the local oscillator into asingle different band. Selection of the desired input andoutput bands is accomplished by proper choice of local-oscillator frequency and by filters at the input and output ofthe mixer. The incoming signal from the antenna is calledthe radio-frequency (r.f.) signal, and the output signal fromthe mixer is called the intermediate-frequency (i.f.) signal.Although a signal band is sometimes converted to higherfrequencies, the usual practice is to use an i.f. band consider-ably lower than the r.f. band. In any case the interferometerperformance, as described in earlier paragraphs, is unaffect-ed by the receiving technique if the latter is correctly de-signed.
The motivation for use of heterodyne receivers is facilityin electronic signal processing at lower frequencies. Band-
* OUTPUT
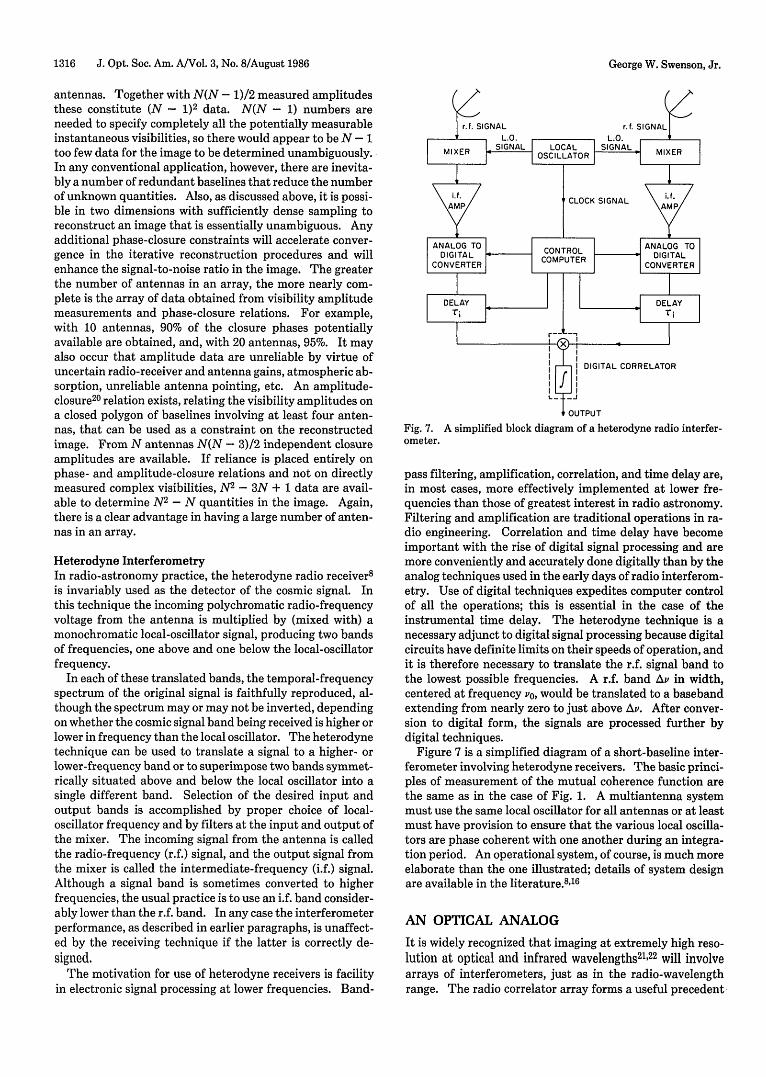
Fig. 7. A simplified block diagram of a heterodyne radio interfer-ometer.
pass filtering, amplification, correlation, and time delay are,in most cases, more effectively implemented at lower fre-quencies than those of greatest interest in radio astronomy.Filtering and amplification are traditional operations in ra-dio engineering. Correlation and time delay have becomeimportant with the rise of digital signal processing and aremore conveniently and accurately done digitally than by theanalog techniques used in the early days of radio interferom-etry. Use of digital techniques expedites computer controlof all the operations; this is essential in the case of theinstrumental time delay. The heterodyne technique is anecessary adjunct to digital signal processing because digitalcircuits have definite limits on their speeds of operation, andit is therefore necessary to translate the r.f. signal band tothe lowest possible frequencies. A r.f. band Az' in width,centered at frequency vo, would be translated to a basebandextending from nearly zero to just above AP. After conver-sion to digital form, the signals are processed further bydigital techniques.
Figure 7 is a simplified diagram of a short-baseline inter-ferometer involving heterodyne receivers. The basic princi-ples of measurement of the mutual coherence function arethe same as in the case of Fig. 1. A multiantenna systemmust use the same local oscillator for all antennas or at leastmust have provision to ensure that the various local oscilla-tors are phase coherent with one another during an integra-tion period. An operational system, of course, is much moreelaborate than the one illustrated; details of system designare available in the literature.8"16
AN OPTICAL ANALOG
It is widely recognized that imaging at extremely high reso-lution at optical and infrared wavelengths21' 2 2 will involvearrays of interferometers, just as in the radio-wavelengthrange. The radio correlator array forms a useful precedent
George W. Swenson, Jr.
Vol. 3, No. 8/August 1986/J. Opt. Soc. Am. A 1317
in several respects. The experience in array configurationdesign transfers directly to the optical case, particularly forastronomical applications in which Earth rotation can beemployed or for other situations in which the array can berotated to improve the (u, v)-plane coverage. Postobserva-tional data-processing techniques can probably be trans-ferred to the shorter wavelengths, although with consider-able difficulty.
The closest optical analog to the radio array is an array ofoptical heterodyne interferometers. The heterodyne meth-od has long been considered ineffective at optical wave-lengths for astronomical applications by virtue of the ex-tremely narrow bandwidths available from the tech-nique.23 24 Astronomical signals are typically very weak,and the narrow bandwidth is consequently a serious handi-cap. Nevertheless, the radio array is so well developed andso successful that it seems appropriate to investigate thecapabilities of the optical heterodyne array.
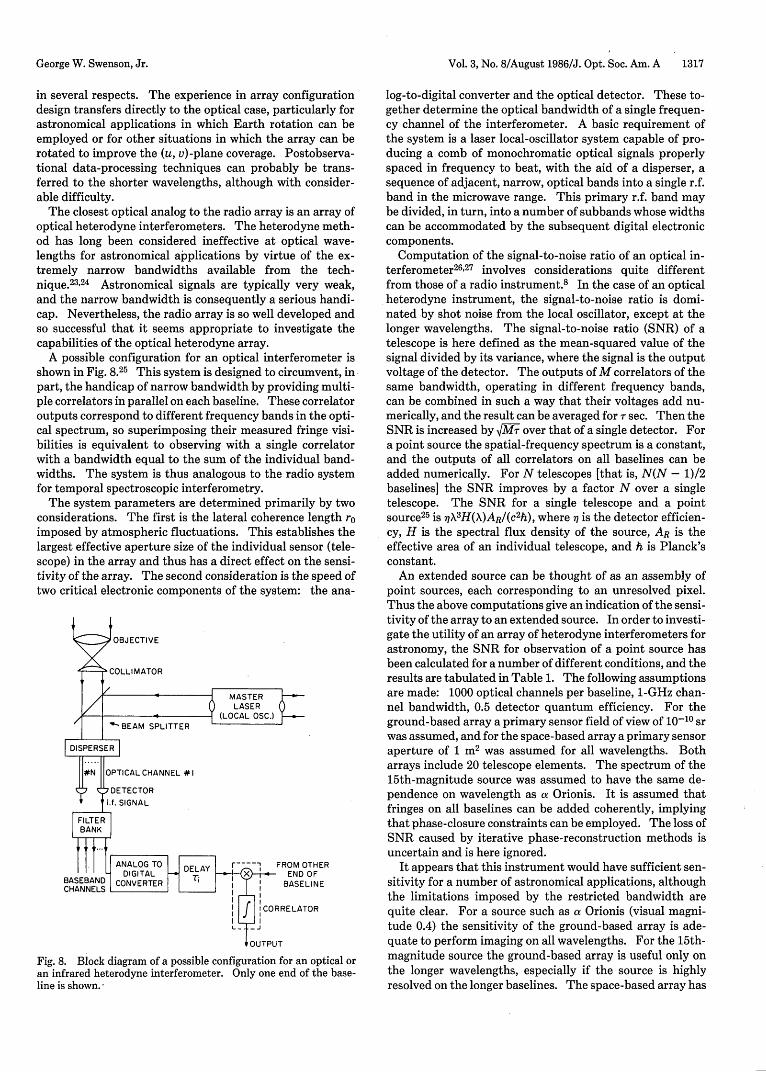
A possible configuration for an optical interferometer isshown in Fig. 8.25 This system is designed to circumvent, inpart, the handicap of narrow bandwidth by providing multi-ple correlators in parallel on each baseline. These correlatoroutputs correspond to different frequency bands in the opti-cal spectrum, so superimposing their measured fringe visi-bilities is equivalent to observing with a single correlatorwith a bandwidth equal to the sum of the individual band-widths. The system is thus analogous to the radio systemfor temporal spectroscopic interferometry.
The system parameters are determined primarily by twoconsiderations. The first is the lateral coherence length roimposed by atmospheric fluctuations. This establishes thelargest effective aperture size of the individual sensor (tele-scope) in the array and thus has a direct effect on the sensi-tivity of the array. The second consideration is the speed oftwo critical electronic components of the system: the ana-
#l
FROM OTHER- END OF
,OUTPUT
Fig. 8. Block diagram of a possible configuration for an optical oran infrared heterodyne interferometer. Only one end of the base-line is shown.
log-to-digital converter and the optical detector. These to-gether determine the optical bandwidth of a single frequen-cy channel of the interferometer. A basic requirement ofthe system is a laser local-oscillator system capable of pro-ducing a comb of monochromatic optical signals properlyspaced in frequency to beat, with the aid of a disperser, asequence of adjacent, narrow, optical bands into a single r.f.band in the microwave range. This primary r.f. band maybe divided, in turn, into a number of subbands whose widthscan be accommodated by the subsequent digital electroniccomponents.
Computation of the signal-to-noise ratio of an optical in-terferometer2 6,27 involves considerations quite differentfrom those of a radio instrument.8 In the case of an opticalheterodyne instrument, the signal-to-noise ratio is domi-nated by shot noise from the local oscillator, except at thelonger wavelengths. The signal-to-noise ratio (SNR) of atelescope is here defined as the mean-squared value of thesignal divided by its variance, where the signal is the outputvoltage of the detector. The outputs of M correlators of thesame bandwidth, operating in different frequency bands,can be combined in such a way that their voltages add nu-merically, and the result can be averaged for r sec. Then theSNR is increased by /M over that of a single detector. Fora point source the spatial-frequency spectrum is a constant,and the outputs of all correlators on all baselines can beadded numerically. For N telescopes [that is, N(N - 1)/2baselines] the SNR improves by a factor N over a singletelescope. The SNR for a single telescope and a pointsource2 5 is nX3H(X)AR/(c2h), where -j is the detector efficien-cy, H is the spectral flux density of the source, AR is theeffective area of an individual telescope, and h is Planck'sconstant.
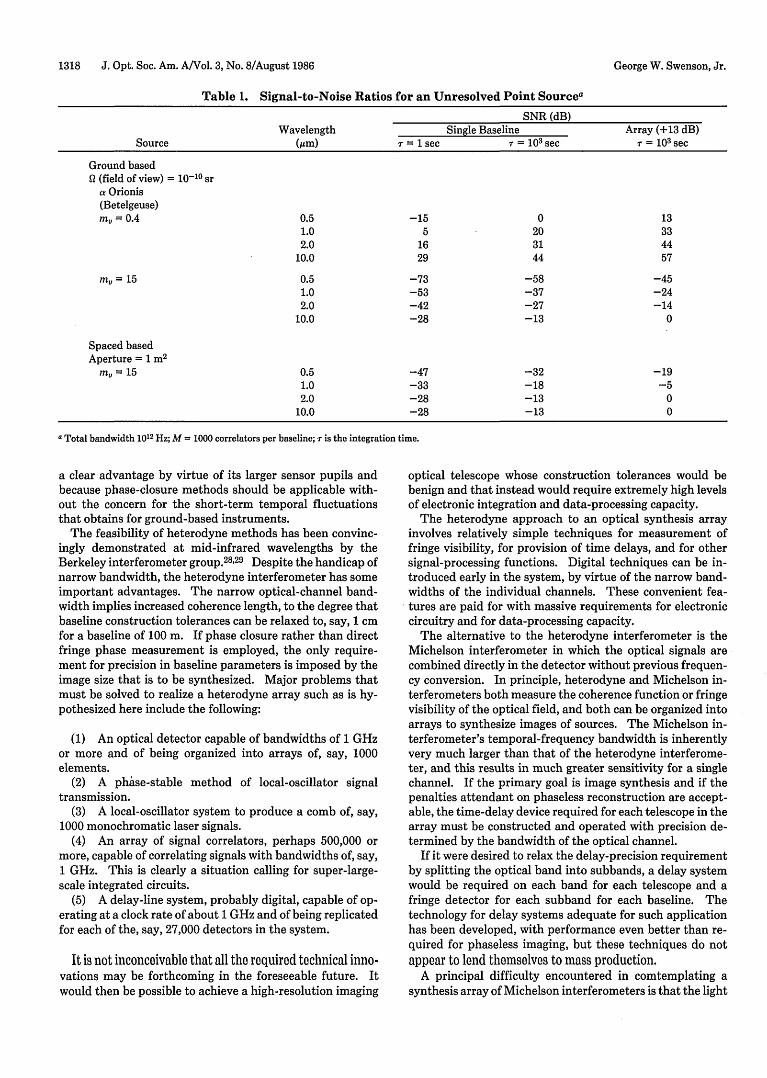
An extended source can be thought of as an assembly ofpoint sources, each corresponding to an unresolved pixel.Thus the above computations give an indication of the sensi-tivity of the array to an extended source. In order to investi-gate the utility of an array of heterodyne interferometers forastronomy, the SNR for observation of a point source hasbeen calculated for a number of different conditions, and theresults are tabulated in Table 1. The following assumptionsare made: 1000 optical channels per baseline, 1-GHz chan-nel bandwidth, 0.5 detector quantum efficiency. For theground-based array a primary sensor field of view of 10-10 srwas assumed, and for the space-based array a primary sensoraperture of 1 m2 was assumed for all wavelengths. Botharrays include 20 telescope elements. The spectrum of the15th-magnitude source was assumed to have the same de-pendence on wavelength as a Orionis. It is assumed thatfringes on all baselines can be added coherently, implyingthat phase-closure constraints can be employed. The loss ofSNR caused by iterative phase-reconstruction methods isuncertain and is here ignored.
It appears that this instrument would have sufficient sen-sitivity for a number of astronomical applications, althoughthe limitations imposed by the restricted bandwidth arequite clear. For a source such as a Orionis (visual magni-tude 0.4) the sensitivity of the ground-based array is ade-quate to perform imaging on all wavelengths. For the 15th-magnitude source the ground-based array is useful only onthe longer wavelengths, especially if the source is highlyresolved on the longer baselines. The space-based array has
George W. Swenson, Jr.
1318 J. Opt. Soc. Am. A/Vol. 3, No. 8/August 1986
Table 1. Signal-to-Noise Ratios for an Unresolved Point Sourcea
SNR (dB)Wavelength Single Baseline Array (+13 dB)
Source (tm) r = 1sec r = 103 sec r = 103 sec
Ground basedQ (field of view) = 10-1 sr
c Orionis(Betelgeuse)m,= 0.4 0.5 -15 0 13
1.0 5 20 332.0 16 31 44
10.0 29 44 57
m = 15 0.5 -73 -58 -451.0 -53 -37 -242.0 -42 -27 -14
10.0 -28 -13 0
Spaced basedAperture = 1 m
2
= 15 0.5 -47 -32 -191.0 -33 -18 -52.0 -28 -13 0
10.0 -28 -13 0
a Total bandwidth 1012 Hz; M = 1000 correlators per baseline; is the integration time.
a clear advantage by virtue of its larger sensor pupils andbecause phase-closure methods should be applicable with-out the concern for the short-term temporal fluctuationsthat obtains for ground-based instruments.
The feasibility of heterodyne methods has been convinc-ingly demonstrated at mid-infrared wavelengths by theBerkeley interferometer group.28 29 Despite the handicap ofnarrow bandwidth, the heterodyne interferometer has someimportant advantages. The narrow optical-channel band-width implies increased coherence length, to the degree thatbaseline construction tolerances can be relaxed to, say, 1 cmfor a baseline of 100 m. If phase closure rather than directfringe phase measurement is employed, the only require-ment for precision in baseline parameters is imposed by theimage size that is to be synthesized. Major problems thatmust be solved to realize a heterodyne array such as is hy-pothesized here include the following:
(1) An optical detector capable of bandwidths of 1 GHzor more and of being organized into arrays of, say, 1000elements.
(2) A phase-stable method of local-oscillator signaltransmission.
(3) A local-oscillator system to produce a comb of, say,1000 monochromatic laser signals.
(4) An array of signal correlators, perhaps 500,000 ormore, capable of correlating signals with bandwidths of, say,1 GHz. This is clearly a situation calling for super-large-scale integrated circuits.
(5) A delay-line system, probably digital, capable of op-erating at a clock rate of about 1 GHz and of being replicatedfor each of the, say, 27,000 detectors in the system.
It is not inconceivable that all the required technical inno.vations may be forthcoming in the foreseeable future. Itwould then be possible to achieve a high-resolution imaging
optical telescope whose construction tolerances would bebenign and that instead would require extremely high levelsof electronic integration and data-processing capacity.
The heterodyne approach to an optical synthesis arrayinvolves relatively simple techniques for measurement offringe visibility, for provision of time delays, and for othersignal-processing functions. Digital techniques can be in-troduced early in the system, by virtue of the narrow band-widths of the individual channels. These convenient fea-tures are paid for with massive requirements for electroniccircuitry and for data-processing capacity.
The alternative to the heterodyne interferometer is theMichelson interferometer in which the optical signals arecombined directly in the detector without previous frequen-cy conversion. In principle, heterodyne and Michelson in-terferometers both measure the coherence function or fringevisibility of the optical field, and both can be organized intoarrays to synthesize images of sources. The Michelson in-terferometer's temporal-frequency bandwidth is inherentlyvery much larger than that of the heterodyne interferome-ter, and this results in much greater sensitivity for a singlechannel. If the primary goal is image synthesis and if thepenalties attendant on phaseless reconstruction are accept-able, the time-delay device required for each telescope in thearray must be constructed and operated with precision de-termined by the bandwidth of the optical channel.
If it were desired to relax the delay-precision requirementby splitting the optical band into subbands, a delay systemwould be required on each band for each telescope and afringe detector for each subband for each baseline. Thetechnology for delay systems adequate for such applicationhas been developed, with performance even better than re-quired for phaseless imaging, but these techniques do notappear to lend themselves to mass production.
A principal difficulty encountered in comtemplating asynthesis array of Michelson interferometers is that the light
George W. Swenson, Jr.
Vol. 3, No. 8/August 1986/J. Opt. Soc. Am. A 1319
power collected by each of the N telescopes in the array mustbe divided among N - 1 detectors. Thus the SNR of thearray varies as N/(N - 1). By contrast, the SNR of a hetero-dyne array varies as N, by virtue of the amplification of thebaseband signal before distribution to the several correla-tors. To avoid the power-dilution problem in a Michelson-interferometer array one must provide two telescopes foreach baseline, with a delay system for each telescope. Thus,for example, to duplicate the u-v plane coverage of thehypothetical array of Fig. 3 would require 42 telescopesinstead of the 7 of the heterodyne array. This problem andthe problem of multiple, high-precision, optomechanical de-lay systems appear to be the principal technical obstacles torealization of an optical synthesis array based on the Michel-son principle.
ACKNOWLEDGMENTS
The author expresses his thanks to C. S. Gardner, R. H. T.Bates, A. R. Thompson, J. M. Moran, and R. J. Allen fordiscussions on the topic of this paper and to the J. S. Gug-genheim Foundation for a fellowship during 1984-1985.
REFERENCES
1. M. Born and E. Wolf, Principles of Optics (Pergamon, Oxford,1959), and later editions.
2. G. W. Swenson Jr. and N. C. Mathur, "The interferometer inradio astronomy," Proc. IEEE 56, 2114-2130 (1968).
3. A. R. Thompson, B. G. Clark, C. M. Wade, and P. J. Napier,"The very large array," Astrophys. J. Suppl. 44, 151-167 (1980).
4. M. H. Cohen, "Introduction to very long baseline interferome-try," Proc. IEEE 61,1192-1197 (1973).
5. K. I. Kellermann and A. R. Thompson, "The very long baselinearray," Science 229, 123-130 (1985).
6. J. M. Moran, "Spectral-line analysis of very-long-baseline inter-ferometric data," Proc. IEEE 61, 1236-1242 (1973).
7. J. L. Yen, "Image reconstruction in synthesis radio telescopearrays," in Array Signal Processing, S. Haykin, ed. (Prentice-Hall, Englewood Cliffs, N.J., 1984).
8. A. R. Thompson, J. M. Moran, and G. W. Swenson, Jr., Interfer-ometry and Synthesis in Radio Astronomy (Wiley/Inter-science, New York, 1986).
9. J. Leech, "On representation of 1, 2, ... , n by differences," J.Math. Soc. London 31, 160-169 (1956).
10. A. T. Moffet, "Minimum-redundancy linear arrays," IEEETrans. Antennas Propag. AP-16, 172-175 (1968).
11. N. C. Mathur, "A pseudo-programming technique for the design
of correlator supersynthesis arrays," Radio Sci. 4, 235-244(1969).
12. Y. L. Chow, "On designing a supersynthesis antenna array,"IEEE Trans. Antennas Propag. AP-20, 30-35 (1972).
13. G. A. Seielstad, G. W. Swenson, Jr., and J. C. Webber, "A newmethod of array evaluation applied to very long baseline inter-ferometry," Radio Sci. 14, 509-517 (1979).
14. J. A. Hogbom, "Aperture synthesis with a non-regular distribu-tion of interferometer baselines," Astron. Astrophys. Suppl.Sec. 15, 417-426 (1974).
15. U. J. Schwarz, The Method CLEAN-Use, Misuse and Varia-tions, in Image Formation from Coherence Functions in As-tronomy, C. van Schooneveld, ed. (Reidel, Dordrecht, TheNetherlands, 1979).
16. P. J. Napier, A. R. Thompson, and R. D. Ekers, "The very largearray: design and performance of a modern synthesis radiotelescope," Proc. IEEE 71, 1295-1320 (1983).
17. Yu. M. Bruck and L. G. Sodin, "On the ambiguity of the imagereconstruction problem," Opt. Commun. 30, 304-308 (1979).
18. J. R. Fienup, "Reconstruction of an object from the modulus ofits Fourier transform," Opt. Lett. 3, 27-29 (1978).
19. R. H. T. Bates, "Uniqueness of solutions to two-dimensionalFourier phase problems for localized and positive images,"Comput. Vision Graphics Image Process. 25, 205-217 (1984).
20. T. J. Pearson and A. C. S. Readhead, "Image formation by selfcalibration in radio astronomy," Ann. Rev. Astron. Astrophys.22, 97-130 (1984).
21. See Proceedings of the ESO Conference on Scientific Impor-tance of High Angular Resolution at Infrared and OpticalWavelengths (European Southern Observatory, Garching, Fed-eral Republic of Germany, 1981).
22. See Proceedings of the Colloquium on Kilometric Optical Ar-rays in Space, Doc. SP226 (European Space Agency, Noord-wijk, The Netherlands, 1984).
23. J. Davis, "High angular resolution stellar interferometry," Proc.Astron. Soc. Aust. 3, 26-32 (1976).
24. R. D. Twiss, "Applications of intensity interferometry in phys-ics and astronomy," Opt. Acta 16, 423-451 (1969).
25. G. W. Swenson Jr., C. S. Gardner, and R. H. T. Bates, "Opticalsynthesis telescopes," in Infrared Adaptive and Synthetic Ap-erture Optical Systems, R. B. Johnson, W. L. Wolfe, and J.Fender, eds., Proc. Soc. Photo-Opt. Instrum. Eng. 643 (to bepublished, 1986).
26. A. H. Greenaway, "The signal-to-noise ratio in long-baselinestellar interferometry," Opt. Acta 26, 1147-1171 (1979).
27. F. Roddier, "Pupil plane versus image plane in Michelson stel-lar interferometry," preprint (National Optical Astronomy Ob-servatories, Tucson, Arizona, 1985).
28. E. C. Sutton, "Results and future uses of heterodyne spatialinterferometry at 11 microns," in Proceedings of the Interna-tional Astronomical Union Colloquium (Chatterson Astrono-my Department, University of Sydney, New South Wales, Aus-tralia, 1979), No. 50, pp. 16-1-16-20.
29. C. H. Townes, "Spatial interferometry in the mid-infrared re-gion," J. Astrophys. Astron. 5, 111-130 (1985).
George W. Swenson, Jr.