radio emission from active galactic nuclei - turun yliopisto · pdf fileagn classification...
TRANSCRIPT

Radio emission from active
galactic nuclei
Anne Lähteenmäki
Aalto University Metsähovi Radio Observatory
& Dept of Radio Science and Engineering

Today
Active galactic nuclei (AGN)
Radio emission from AGN & jet models
Radio spectra and spectral energy distributions (SEDs)
Examples:
• Single-dish radio data
• Multifrequency data

R&O PKS2356-61
Active Galactic Nuclei (AGN)

Active Galactic Nuclei (AGN)

AGN classification
Radio-loud
• 15% of all AGN
• Powerful radio jets
Radio-quiet
• IR, optical, UV
• No/weak radio jets and/or star formation processes
Ron K
ollg
aard

Outdated!

Ideally… but not necessary in real life…

At radio frequencies we see
synchrotron emission
Variable jet and radio core
Non-variable radio lobes and hot spots
FR II

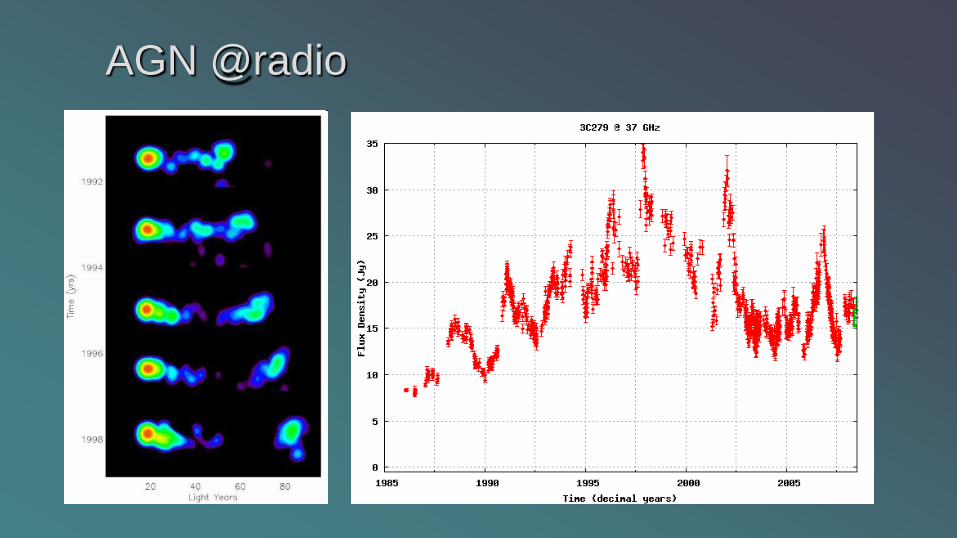
AGN @radio

Relativistic beaming
Superluminal motion
Doppler boosting factor
Lorentz factor
Viewing angle
http
://ww
w.is
dc.u
nig
e.c
h/s
edto
ol

Shocked jet model Marscher & Gear 1985
http://www.bu.edu/blazars/
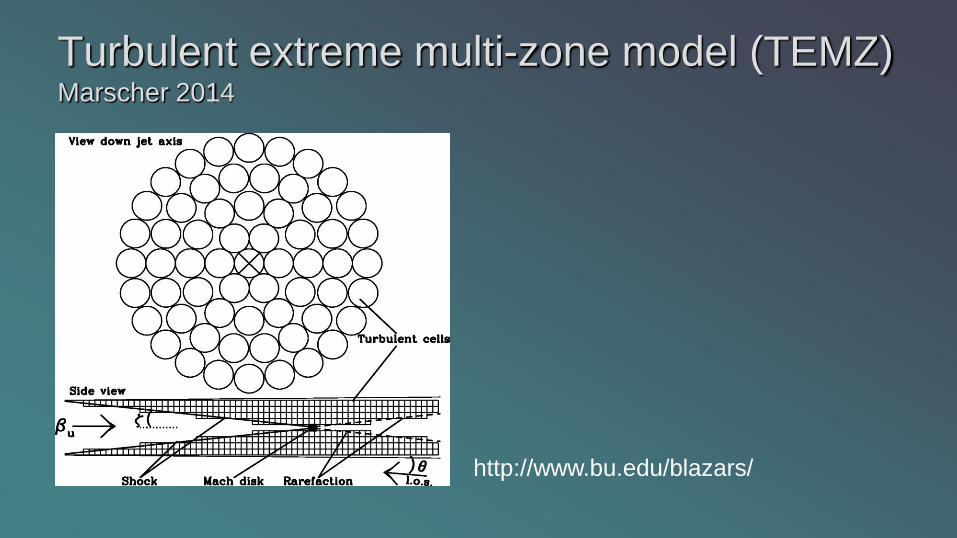
Turbulent extreme multi-zone model (TEMZ) Marscher 2014
http://www.bu.edu/blazars/

Multifrequency observations of AGN
TeV
X-rays Gamma-rays
Optical Radio

Spectral energy distributions (SEDs) of AGN
Sambruna 1994
Synchrotron component
Inverse Compton (IC) component:
External Compton (EC) or Synchrotron Self-Compton (SSC)

Radio spectra of AGN
Typically flat radio spectra due to overlapping shock components
”Evolving shocks”

Radio spectra and SEDs…
Properties of the AGN and the host galaxy
Emission mechanisms
Turnover frequency
• Turnover flux density
• Size, magnetic field strength
Energy requirements

SED modelling
Contemporary models fit the high-energy IC part rather nicely, but (still) almost completely ignore the synchrotron part which most likely is the source for the high-energy emission.
Bonnoli et al. 2010

Multicomponent SED modelling
Start with the underlying physics and fit the primary photons (i.e. synchrotron, also at low frequencies!) first.
Use multicomponent fitting:
• underlying jet flow + individual shocks moving in the jet.
3C 454.3 Tammi et al.

Examples
Case 1: Total flux density variations in AGN
Case 2: SEDs and radio spectra of AGN using Planck satellite data
Case 3: Multifrequency correlations
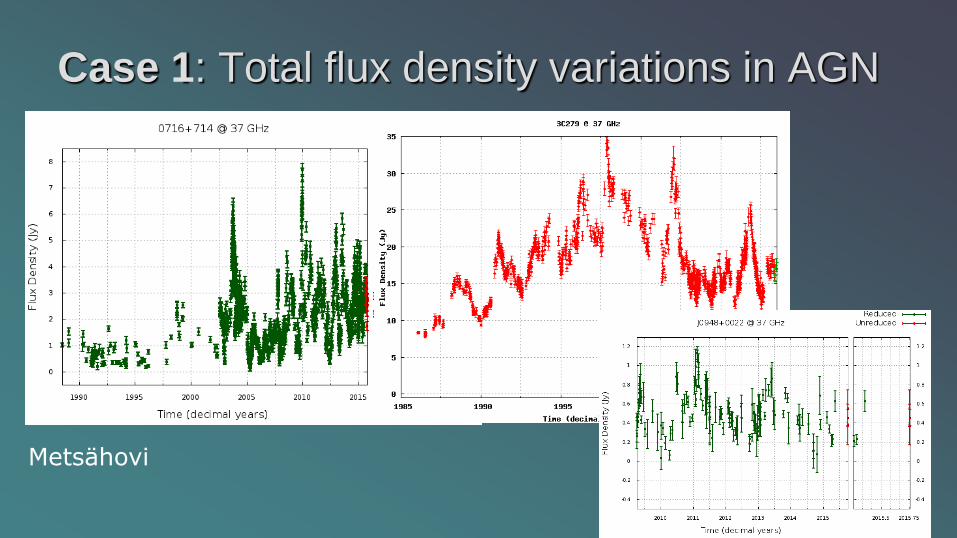
Case 1: Total flux density variations in AGN
Metsähovi

UMRAO

Flare characteristics: fitting the lightcurve
Decay timescale is 1.3 times the rise timescale.

Jet parameters Observed variability timescale
Maximum flare amplitude Smax
Apparent superluminal speed app (from VLBI)
Brightness temperature:
Doppler factor:
Lorentz factor:
Viewing angle:
Lähteenmäki & Valtaoja 1999

Variability analysis
How much, how often: long term variability timescales
Various methods (structure function, periodogram, DCF, …)
4C 29.45, Hovatta et al. 2007
• Average long term timescales ~7 years
• Different timescales for source types • Sources are mostly in a quiescent or intermediate state, big flares happen fairly rarely.

Case 2: SEDs and radio spectra of AGN using
Planck satellite data
14.5.2009 – 23.10.2013
Cosmic microwave background (CMB) + foreground sources
9 frequencies 30 – 857 GHz
5 to 8 full sky surveys

Simultaneous multifrequency data: one epoch Planck Collaboration 2011
104 sources
Planck, 9 frequencies (30 – 857 GHz)
Radio (1 – 345 GHz)
• Metsähovi, RATAN-600, UMRAO, VLA, ATCA, Effelsberg, IRAM, APEX, OVRO, Medicina
Optical
• Tuorla + KVA (La Palma), Xinglong
X-rays (+optical+UV)
• Swift
Gamma-rays
• Fermi

3C 454.3

OJ 287

Case 3: Multifrequency correlations
Metsähovi 37 GHz & Fermi gamma-ray data

Summary
Active galactic nuclei (AGN)
Radio emission from AGN & jet models
Radio spectra and spectral energy distributions (SEDs)
Examples:
• Single-dish radio variability data
• Multifrequency data: SEDs and correlations