radiology staff in focus - philips · 2020-05-31 · radiology staff in focus a radiology services...
TRANSCRIPT

Radiology staff in focusA Radiology services impact and satisfaction survey of technologists and imaging directors
Research reportResearch report

ContentsBackground, 4
Research overview, 5
Summary of findings, 6
Imaging staff satisfaction, 6
Factors contributing to job satisfaction, 8
Motivation for choice of profession, 10
Stress among technologists, 12
Burnout among technologists, 14
Sources of stress and burnout, 17
Efficiency and automation, 20
Communication and information flow, 22
Getting the image right the first time, 24
Tech confidence in imaging systems operation, 27
Staff empowerment, 28
Conclusion, 30
References, 31
Radiology staff in focus research report 32 Radiology staff in focus research report
Targets Total
127
127
254
Radiology Technologists (RTs)
Imaging Directors (IDs)
Total
France
30
30
60
Germany
30
30
60
US
41
41
82
UK
26
26
52
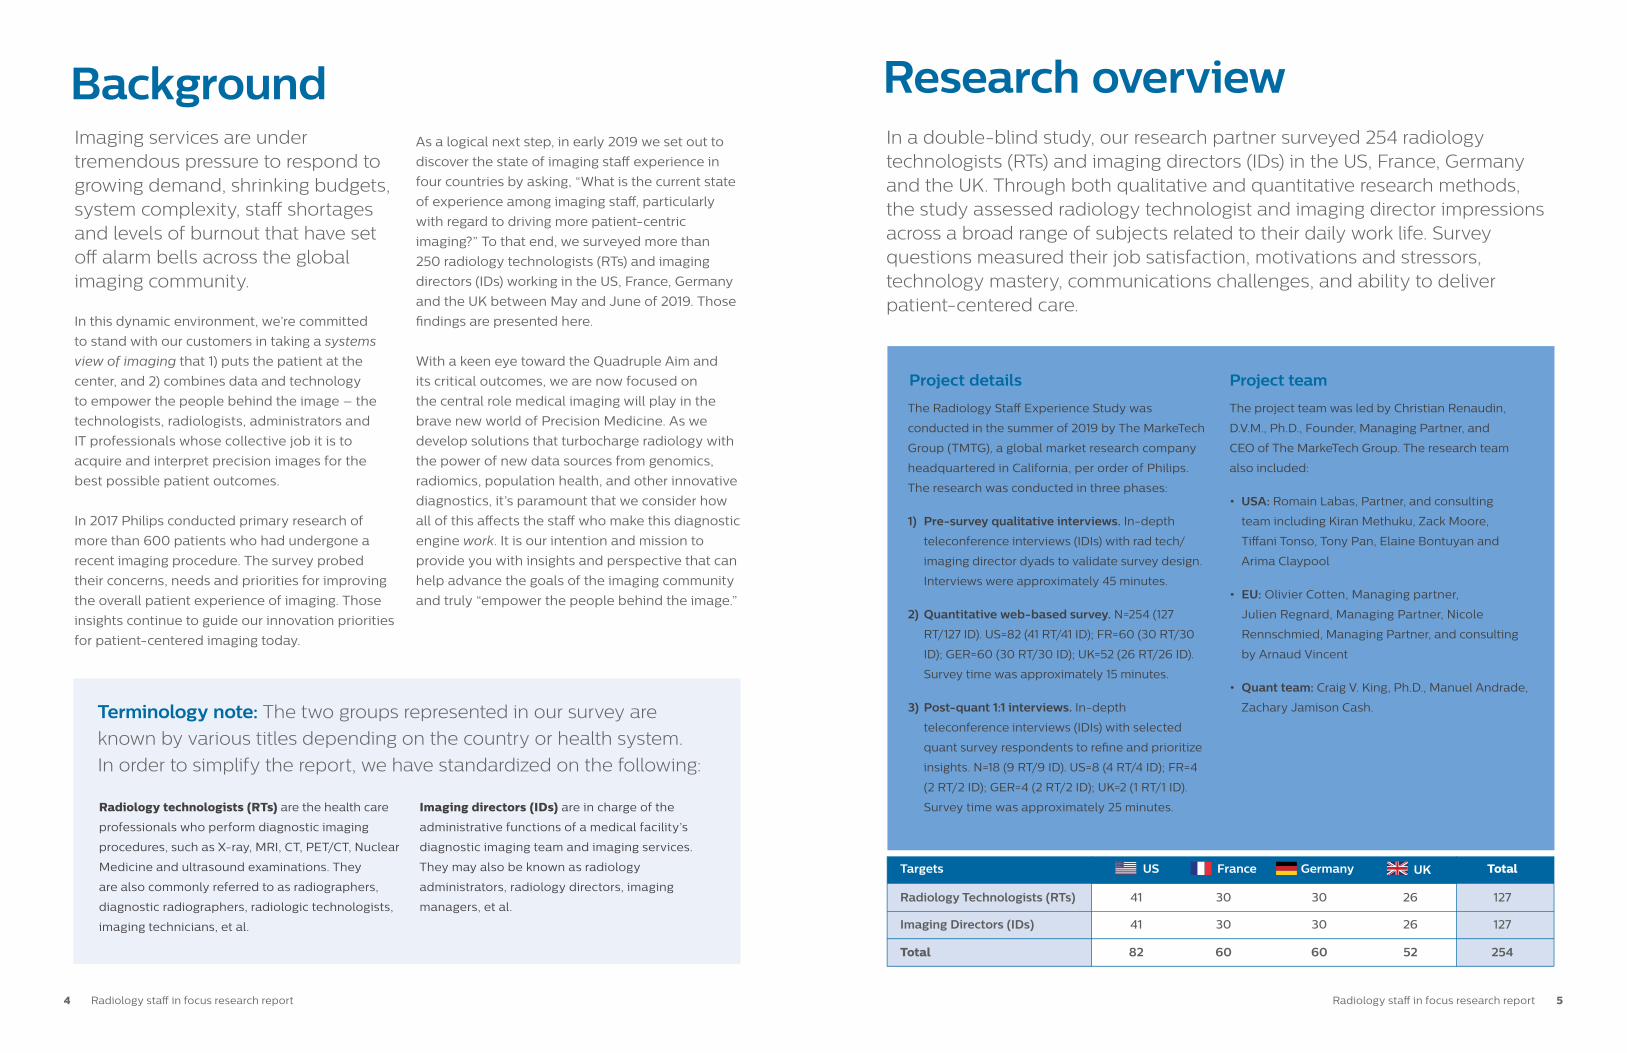
Project details
The Radiology Staff Experience Study was
conducted in the summer of 2019 by The MarkeTech
Group (TMTG), a global market research company
headquartered in California, per order of Philips.
The research was conducted in three phases:
1) Pre-survey qualitative interviews. In-depth
teleconference interviews (IDIs) with rad tech/
imaging director dyads to validate survey design.
Interviews were approximately 45 minutes.
2) Quantitative web-based survey. N=254 (127
RT/127 ID). US=82 (41 RT/41 ID); FR=60 (30 RT/30
ID); GER=60 (30 RT/30 ID); UK=52 (26 RT/26 ID).
Survey time was approximately 15 minutes.
3) Post-quant 1:1 interviews. In-depth
teleconference interviews (IDIs) with selected
quant survey respondents to refine and prioritize
insights. N=18 (9 RT/9 ID). US=8 (4 RT/4 ID); FR=4
(2 RT/2 ID); GER=4 (2 RT/2 ID); UK=2 (1 RT/1 ID).
Survey time was approximately 25 minutes.
Project team
The project team was led by Christian Renaudin,
D.V.M., Ph.D., Founder, Managing Partner, and
CEO of The MarkeTech Group. The research team
also included:
• USA: Romain Labas, Partner, and consulting
team including Kiran Methuku, Zack Moore,
Tiffani Tonso, Tony Pan, Elaine Bontuyan and
Arima Claypool
• EU: Olivier Cotten, Managing partner,
Julien Regnard, Managing Partner, Nicole
Rennschmied, Managing Partner, and consulting
by Arnaud Vincent
• Quant team: Craig V. King, Ph.D., Manuel Andrade,
Zachary Jamison Cash.
Research overviewImaging services are under tremendous pressure to respond to growing demand, shrinking budgets, system complexity, staff shortages and levels of burnout that have set off alarm bells across the global imaging community.
In this dynamic environment, we’re committed
to stand with our customers in taking a systems
view of imaging that 1) puts the patient at the
center, and 2) combines data and technology
to empower the people behind the image – the
technologists, radiologists, administrators and
IT professionals whose collective job it is to
acquire and interpret precision images for the
best possible patient outcomes.
In 2017 Philips conducted primary research of
more than 600 patients who had undergone a
recent imaging procedure. The survey probed
their concerns, needs and priorities for improving
the overall patient experience of imaging. Those
insights continue to guide our innovation priorities
for patient-centered imaging today.
As a logical next step, in early 2019 we set out to
discover the state of imaging staff experience in
four countries by asking, “What is the current state
of experience among imaging staff, particularly
with regard to driving more patient-centric
imaging?” To that end, we surveyed more than
250 radiology technologists (RTs) and imaging
directors (IDs) working in the US, France, Germany
and the UK between May and June of 2019. Those
findings are presented here.
With a keen eye toward the Quadruple Aim and
its critical outcomes, we are now focused on
the central role medical imaging will play in the
brave new world of Precision Medicine. As we
develop solutions that turbocharge radiology with
the power of new data sources from genomics,
radiomics, population health, and other innovative
diagnostics, it’s paramount that we consider how
all of this affects the staff who make this diagnostic
engine work. It is our intention and mission to
provide you with insights and perspective that can
help advance the goals of the imaging community
and truly “empower the people behind the image.”
In a double-blind study, our research partner surveyed 254 radiology technologists (RTs) and imaging directors (IDs) in the US, France, Germany and the UK. Through both qualitative and quantitative research methods, the study assessed radiology technologist and imaging director impressions across a broad range of subjects related to their daily work life. Survey questions measured their job satisfaction, motivations and stressors, technology mastery, communications challenges, and ability to deliver patient-centered care.
Background
Terminology note: The two groups represented in our survey are
known by various titles depending on the country or health system.
In order to simplify the report, we have standardized on the following:
Radiology technologists (RTs) are the health care
professionals who perform diagnostic imaging
procedures, such as X-ray, MRI, CT, PET/CT, Nuclear
Medicine and ultrasound examinations. They
are also commonly referred to as radiographers,
diagnostic radiographers, radiologic technologists,
imaging technicians, et al.
Imaging directors (IDs) are in charge of the
administrative functions of a medical facility’s
diagnostic imaging team and imaging services.
They may also be known as radiology
administrators, radiology directors, imaging
managers, et al.
4 Radiology staff in focus research report Radiology staff in focus research report 5

Imaging staff and directors are moderately satisfied with their jobs. With a global shortage of qualified staff, there are many reasons to improve.
Qualified imaging techs and tech managers are
already in short supply – and the forecast for
meeting mounting demand is not optimistic. In a
2016 study by the Advisory Board, 28 percent of
imaging departments surveyed reported being
understaffed, with an annual uptick in vacancy
rates for all imaging modalities since 2013.1
According to a 2016 ASRT survey, 23 percent of
radiology technologists in the US are over age 55.2
Survey data from LFT (Leaders for Today) showed
that US hospitals are on a pace of needing to
replace virtually half of their staff every five years,3
with 47.7 percent of respondents indicating they
plan to stop working within the next ten years.4
To make things worse, training programs are not
filling the funnel with new techs. ASRT reported in
2017 that 50 percent of radiography programs were
not fully enrolled.5
Data from the Advisory Board study shows that
there is a direct relationship between increased
staffing levels and volumes, suggesting that
increased staff per scanner helps organizations
maximize capacity.6 In CT, for example, the
potential profit from increased staff could reach
$569K in CT and $251K in mammography.7
Additionally, they point out that conservative
estimates for the cost of filling non-physician
turnover is 1.5 times salary.8 In this environment,
health systems cannot afford to leave imaging
staff satisfaction to chance. They must invest in
programs to engage, develop and retain staff or
risk a catastrophic resource gap in their essential
diagnostic capabilities.
The upshot
Imaging staff satisfactionSummary of findings
“Working with patients and helping them to feel better” has always been extremely satisfying for me. However, the overall patient throughput has “increased tremendously for profit reasons,” so time spent with the patient has decreased to “close to zero”.
– R, Radiology Technologist, Germany
Job satisfaction
by country
Q (RTs + IDs): How satisfied are you with your job?
Job satisfaction by role
Data insight:
Satisfaction levels were nearly identical for Radiology technologists and Imaging directors.
Data insight: Overall, satisfaction levels are slightly higher in the US than in the European geographies.
Radiology Technologists (RTs)
Imaging Directors (IDs)
How satis�ed are you with your job?Job satisfaction by role
18%
39%
33%
9%
21%
41%
27%
9% 2% 1%
Not at all satis�ed
Very satis�ed
Extremely satis�ed
Satis�ed
Somewhat satis�ed
(N=127)(N=127)
Radiology Technologists (RTs)
Imaging Directors (IDs)
How satis�ed are you with your job?Job satisfaction by role
18%
39%
33%
9%
21%
41%
27%
9% 2% 1%
Not at all satis�ed
Very satis�ed
Extremely satis�ed
Satis�ed
Somewhat satis�ed
(N=127)(N=127)
Sta� voices
2%27%
48%
3%
20%
70%
7%
23%
18%
38%
24%
18%
33%
9%
1%
21%
38%
4%
Very satis�ed
Extremely satis�ed
Satis�ed
Somewhat satis�ed
Not at all satis�ed
0%
20%
60%
40%
80%
100%
France Germany UKUS(N=82) (N=60) (N=60) (N=52)
1
3
2
4
5
Q (RTs + IDs): How satis�ed are you with your job?
Job satisfaction by country
Note: Due to rounding,
some totals fall below 100%.
2%27%
48%
3%
20%
70%
7%
23%
18%
38%
24%
18%
33%
9%
1%
21%
38%
4%
Very satis�ed
Extremely satis�ed
Satis�ed
Somewhat satis�ed
Not at all satis�ed
0%
20%
60%
40%
80%
100%
France Germany UKUS(N=82) (N=60) (N=60) (N=52)
1
3
2
4
5
Q (RTs + IDs): How satis�ed are you with your job?
Job satisfaction by country
Radiology staff in focus research report 76 Radiology staff in focus research report
We evaluated the most important-rated factors for their relationship to
satisfaction with those factors. Results are ranked by the delta between
importance and satisfaction. (∆ = Importance mean – Satisfaction mean)
The connection between job satisfaction and
employee productivity is well established. Harvard
Business Review recently published an analysis
of various studies that showed an average of 31%
more productivity when employees are happy or
satisfied.9 Another study – this one conducted
by economists at the University of Warwick –
found that happiness leads to a 12% increase in
productivity. It also found that unhappy workers
are 10% less productive than content employees.10
With a looming shortage of talent and mounting
pressure on imaging departments, health systems
must be very clear about what matters most to staff
and actively intervene to enhance their satisfaction
and avoid disengagement and attrition.
The upshot
Factors contributing to job satisfaction
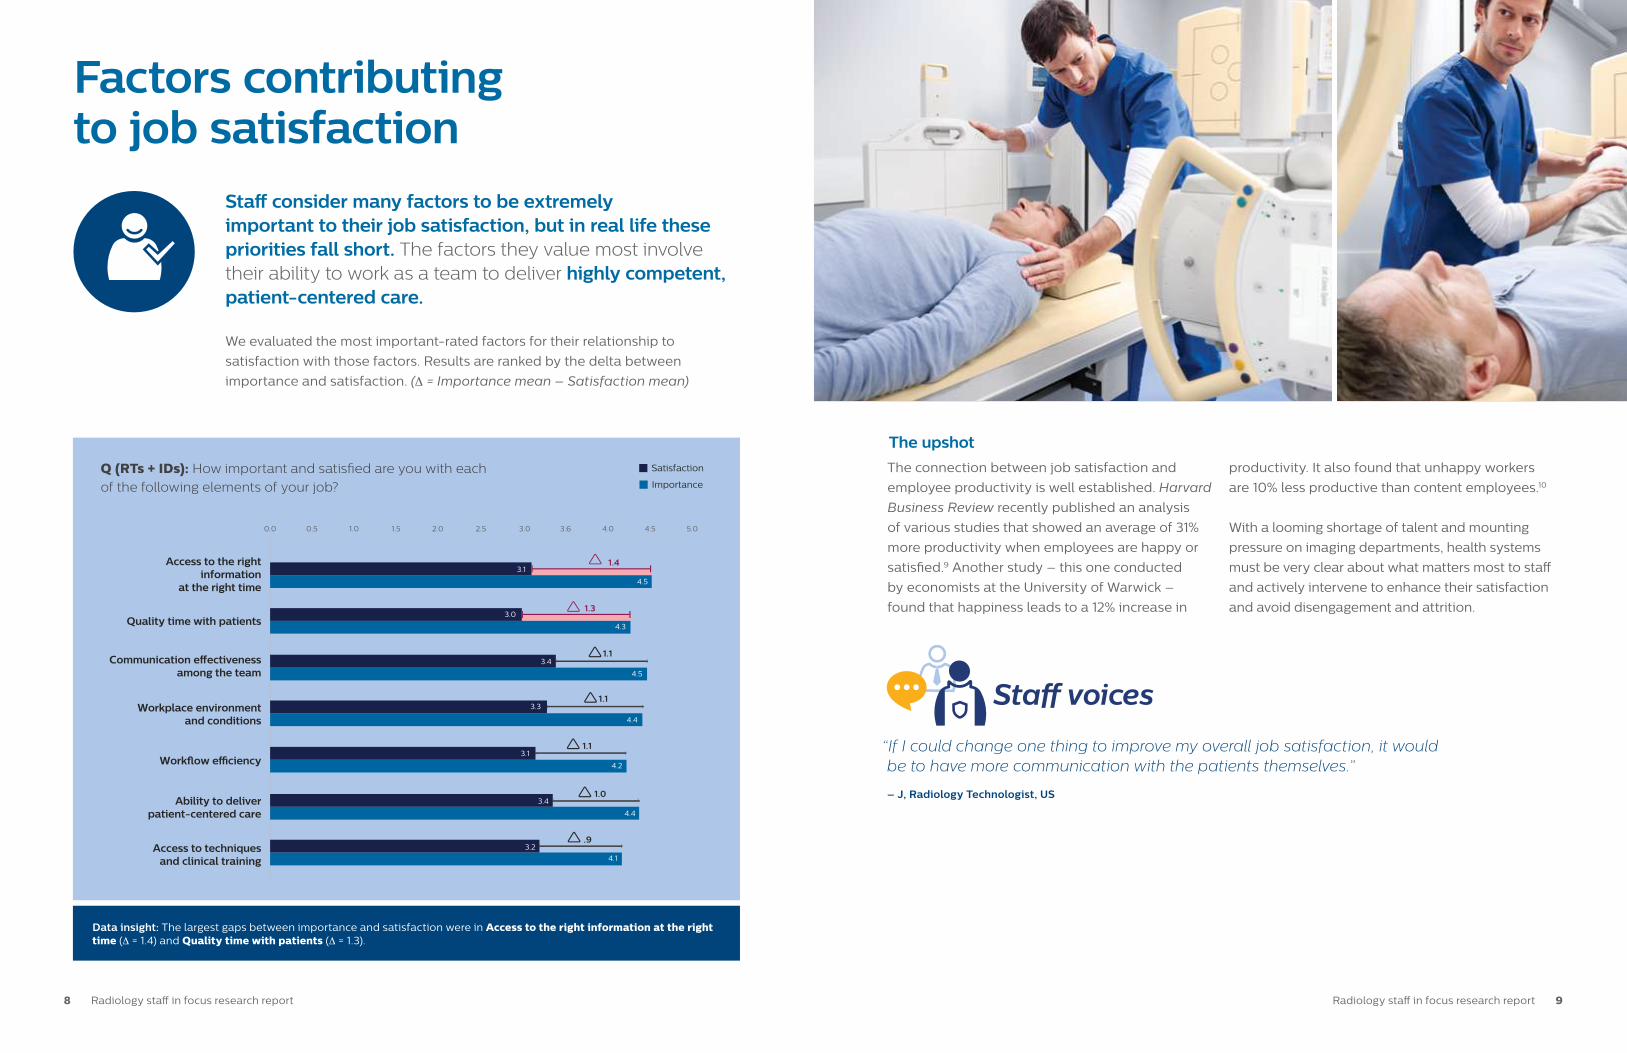
Staff consider many factors to be extremely important to their job satisfaction, but in real life these priorities fall short. The factors they value most involve their ability to work as a team to deliver highly competent, patient-centered care.
“If I could change one thing to improve my overall job satisfaction, it would be to have more communication with the patients themselves.”
– J, Radiology Technologist, US
Q (RTs + IDs): How important and satisfied are you with each
of the following elements of your job?
Data insight: The largest gaps between importance and satisfaction were in Access to the right information at the right time (∆ = 1.4) and Quality time with patients (∆ = 1.3).
Importance
Satisfaction
Q (RTs + IDs): How important and satis�ed are you with each of the following elements of your job?
0.0 0.5 1.0 1.5 2.0 2.5 3.0 3.6 4.0 4.5 5.0
Work�ow e�ciency
Quality time with patients
Communication e�ectiveness among the team
Workplace environment and conditions
Ability to deliver patient-centered care
Work�ow e�ciency
1.3
Access to the right information
at the right time
.9
1.0
1.1
1.1
1.1
Access to techniques and clinical training
1.43.1
4.5
3.0
4.3
3.4
4.5
3.3
4.4
3.1
4.2
3.4
4.4
3.2
4.1
Sta� voices
8 Radiology staff in focus research report Radiology staff in focus research report 9

Motivation for choice of professionImaging staff are purpose-driven professionals. They chose this profession because they want to help and care for people. Anything that interferes with that core sense of purpose should be regarded as a threat to their satisfaction.
Before we dug into the specifics of our respondents’
experience, we wanted to understand why these
professionals chose their career path to begin with.
What we found was a group of people who are
exceptionally purpose-driven, but who also enjoy
the challenge of a technology environment.
This finding augurs both good news and bad news
for health systems. On the positive side, research
shows that employees who feel like their work
creates a positive impact are more likely to feel
fulfilled, promote their workplace and stay at their
job longer. A seminal study by Tony Schwartz
and Christine Porath found that employees who
derive meaning and significance from their work
were more than three times as likely to stay with
their organizations — the highest single impact
of any variable in the survey. These employees
also reported 1.7 times higher job satisfaction and
were 1.4 times more engaged at work.11
On the down side, people who actively seek
meaning in their work will be highly sensitive to
the factors that threaten that sense of purpose.
A Gallup report entitled “How Millennials Want
to Work” determined that, “for millennials,
compensation is important and must be fair, but
it’s no longer the driver. The emphasis for this
generation has switched from paycheck to purpose
— and so must your culture.”12 A purpose-driven
workforce must be authentically connected to their
staff’s sense of purpose, and managers need to
remove obstacles that impede that connection.
The upshot
Data insights:
Helping people and Patient care were by far the highest primary drivers for motivating both RTs and IDs to choose their current position.
Using technology was a higher motivation for respondents in France and Germany than in UK and US – and was more motivating than Salary for respondents in general.
Patient-care
Using technology
Flexible working conditions
Helping people
Salary
54%
38%
23%
73%
35%
US
32%
62%
38%
63%
23%
France
88%
62%
12%
70%
65%
Germany
69%
54%
42%
71%
44%
UK
Helping people
70%Patient-care
60%Using technology
52%Salary
41%
Flexible working conditions
28%
Q (RTs + IDs): What motivated you to choose your current profession?
(Respondents could choose all that apply.)
“Working in patient care for years was a source of high satisfaction, especially when there was still enough time to talk to the patient for a few moments.”
For all HCPs in Germany, times have changed, and “patients nowadays become more and more a number…. Patient throughput, profit and efficiency are in the center of medicine.”
– S, Imaging Director, Germany
Sta� voices
10 Radiology staff in focus research report Radiology staff in focus research report 11

Stress among technologistsAlarming numbers of technologists report moderate or severe levels of job stress: FR=40%; US=44%; UK=54%; GER=97%. There is no sugar-coating these results.
Our study used a standard workplace stress scale13
to investigate stress levels among techs.
Respondents were asked about stress level using the 8 statements below:
• Conditions at work are unpleasant or sometimes even unsafe
• I feel that my job is negatively affecting my physical or emotional well-being
• I have too much work to do and/or too many unreasonable deadlines
• I find it difficult to express my opinions or feelings about my job conditions to my superiors
• I feel that job pressures interfere with my family or personal life
• I have adequate control or input over my work duties
• I receive appropriate recognition or rewards for good performance
• I am able to utilize my skills and talents to the fullest extent at work
Scale:
Never | Rarely | Sometimes | Often | Very often
Scoring:
• 5 to 15 = Very low stress
• 16 to 20 = Low stress
• 21 to 25 = Moderate stress
• 26+ = Severe stress
Cronbach’s alpha (scale reliability metric) = .85
About the stress level scale:
The connections between stress and depression,
anxiety, substance abuse, illness, errors, reduced
productivity, absenteeism, attrition, and so on
are literally too complex and exhaustive to cover
here. But we can safely say that any sustained
level of moderate to extreme stress is a threat
to your imaging staff, their patients’ experience,
and the very functioning of your core diagnostic
service. Imaging staff stress levels are alarmingly
high, and efforts to reduce them should be intrinsic
to the management of this valuable group of
professionals.
The upshot
Data insight: In Germany, the number of techs reporting severe stress – 70% – is truly alarming and a clear outlier from the other geographies: 4% (UK), 7% (FR) and 15% (US).
“...Time per exam is very tight, which affects the quality of the images as everybody is stressed...”
– S, Radiology Technologist, Germany
Sta� voices
Q (RTs): Thinking about your current job, how often does each of the following statements
describe how you feel?
0%
20%
60%
40%
80%
100%
France Germany UKUS(N=41) (N=30) (N=30) (N=26)
Very low stress
Low stress
Moderate stress
Severe stress
1
3
2
4
5
27%
29%
15%
29%
17%
43%
33%
7%
27%
70%
3%
35%
19%
42%4%
Q (RTs): Thinking about your current job, how often does each of the following statements describe how you feel?
Note: Due to rounding,
some totals fall below 100%.
12 Radiology staff in focus research report Radiology staff in focus research report 13

Burnout among technologistsTechnologists in every geography reported a significant incidence of moderate or high burnout: UK=30%; FR=33%; US=36%; GER=97%. Taken together with burnout levels for radiologists, we’re witnessing a serious, systemic problem across imaging.
The correlation between stress and burnout is
.78, which is very strong. Our results underscore
distressing levels of burnout in a talent pool that
is already in inadequate supply.
In his research on physician burnout, Dr. Tait
Shanafelt determined that every one point
increase in burnout [based on a 7-point
emotional exhaustion scale] is associated with
30-50% likelihood of reduced professional
work effort. In more recent work, Dr. Shanafelt
cautions that “Physician burnout has been
shown to influence quality of care, patient safety,
physician turnover, and patient satisfaction.
Although burnout is a system issue, most
institutions operate under the erroneous
framework that burnout and professional
satisfaction are solely the responsibility of the
individual physician. Engagement is the positive
antithesis of burnout and is characterized by
vigor, dedication, and absorption in work. There
is a strong business case for organizations to
invest in efforts to reduce physician burnout and
promote engagement.”
The upshot
“With the focus on profit, workload has increased in past years, but lack of well-trained staff is a major issue in [our] hospital. Every third position remains vacant. It means we now work 30% more, and if someone is sick or on holiday, the patients go on like an assembly line. It’s incredible!”
– S, Imaging Director, Germany
Using a standard inventory for professional burnout,15
technologists were asked about how they feel
at work. In addition, we asked imaging directors
to estimate the stress levels of the technologists
they supervise.
Respondents were asked about their burnout level using the 9 statements below. These statements are used in standard inventories that probe the subject professional burnout.
• I feel emotionally drained from work
• I feel used up at the end of the workday
• I feel fatigued when I get up in the morning
• I feel like I am at the end of the rope/out of patience
• I feel burned out from work
• I feel frustrated by my job
• I feel I am working too hard on the job
• Working with people puts too much stress on me
• Working with patients is a strain
Scale:
Never | A few times a year or less |
Once a month or less | A few times a month |
Once a week | A few times a week | Every day
Categories based on the quartile
distribution:
• 7 to 20 = Very low burnout• 21 to 30 = Low burnout• 31 to 40 = Moderate burnout• 41+ = Severe burnout
Cronbach’s alpha (scale reliability metric) = .92
About the burnout level scale:
Burnout results are highly correlated to stress results. Techs in every surveyed geography reported a significant incidence of moderate or high burnout: UK=30%; France=33%; US=36%; Germany=97%.
Germany’s technologists are voicing crisis levels of burnout, with their managers concurring.
In the US, imaging directors underestimate burnout among techs, underscoring
a communications gap between staff and management. 36% of US techs report moderate to high burnout, but IDs appraise only 17% of techs feeling burned out to that extent.
Perception of burnout is skewed in the opposite direction in Europe, with techs in France and the UK reporting less burnout than IDs expect them to experience.
Data insights:
14 Radiology staff in focus research report
Sta� voices
Q (RTs): How often do the following statements describe how you feel at work?
Q (IDs): How often do the following statements describe how your Techs feel at work?
46%
17%
12%
24%
41%
41%
7%
10%
38%
31%
15%
15%
23%
27%
8%
42%
3%
47%
50%
50%
50%
27%
40%
33%
23%
33%
23%
20%
0%
20%
60%
40%
80%
100%
France Germany UKUS
Q RTs: How often do the following state-ments describe how you feel at work?
Q IDs: How often do the following statements describe how your Techs feel at work?
Very low burnout
Low burnout
Moderate burnout
High burnout
1
3
2
4
5
RTs IDs RTs IDs RTs IDs RTs IDs
Note: Due to rounding,
some totals fall below 100%.
14 Radiology staff in focus research report Radiology staff in focus research report 15

Sources of stress and burnoutWorkload is, by far, the greatest source of stress and burnout for imaging staff. Given that workload will likely only increase, it is paramount to focus both innovation and process improvement efforts on empowering techs to do their jobs with more ease and less stress.
Q (RTs + IDs): What are the greatest sources of stress or burnout at your work?
Data insights:
Workload contributes the most towards stress in all countries – followed by Staff scheduling, Burden of non-core activities, Communication and information flow, and Lack of appreciation.
Workload and the Burden of non-core activities is significantly larger in Germany than elsewhere.
Q (RTs + IDs): What are greatest sources of stress or burnout at your work?
Dealing with patients and families
Workload
Sta� scheduling
Burden of non-core activities
Communication and information �ow
Lack of appreciation
Dealing with patients and families
Workload
Sta� scheduling
Burden of non-core activities
Communication and information �ow
Lack of appreciation
UK
FranceUS
40%
67%
50%
95%
15%
28%
27%
29%
35%
6%
33%
29%
19%
33%
3%
22%
8%
20%
5%
8%
33%
47%
37%
22%
Germany
16 Radiology staff in focus research report Radiology staff in focus research report 17

More than a third of imaging staff surveyed think their workload is higher than average. Although workload is a shared challenge across institutions and geographies, many techs have the feeling “it’s just us.”
“If we are in the middle of an exam and there are 10 patients waiting, we will be in a hurry, and errors may occur.”
– A, Radiology Technologist, France
There’s no mystery behind the workload crunch
in imaging. While contributing factors vary across
geographies (lack of budget, lack of training
programs, competition for talent), the mandate
to “do more with less” is a constant. Additionally,
the burden of non-patient care activities such
as reporting and compliance documentation
continues to increase.
As imaging services are forced to become ‘leaner,’
some technologists are being asked to pick up
duties such as patient transport – or to support
imaging needs in other departments. So while
demand for imaging continues to increase,
health systems have largely been unwilling
or unable to respond in ways that reduce the
pressure on imaging staff.
Finally, morale matters. In an environment of heavy
workloads and pressures, it’s important to find
opportunities to offer encouragement and praise
– especially for staff who are struggling or who are
actively looking for ways to make things better.
The upshot
Q (RTs + IDs): How would you compare your institution’s imaging case
load to that of other similar institutions? Data insight:
In every geography, a significant number of respondents believe their workload is higher than average when compared to similar institutions.
Germany UKFranceUS
Q (RTs + IDs): How would you compare your institution’s imaging case load to that of other similar institutions?
Same as averageLower than average Higher than average
56%40%
4%
45%
37%
18%
54%40%
6%
52% 48%
Germany UKFranceUS
Q (RTs + IDs): How would you compare your institution’s imaging case load to that of other similar institutions?
Same as averageLower than average Higher than average
56%40%
4%
45%
37%
18%
54%40%
6%
52% 48%
“Often techs don’t have lunch because they’re so busy during the day...”
– C, Imaging Director, US
Sta� voices
Radiology staff in focus research report 1918 Radiology staff in focus research report

Efficiency and automationGiven their workload pressure, imaging staff are eager for efficiency gains. Indeed, respondents believe almost a quarter of their work could be automated. The response indicates the great opportunity that exists to make their work more streamlined and, presumably, more satisfying.
“If the system was highly automated then they would not have to wait for anything [i.e., reconstruction], which would also improve the patient experience.”
— T, Radiology Technologist, US
“The machine’s user interface is not friendly; we got used to it but it was complicated at first. Radiologists have the same issue on their interpretation interface.”
– C, Radiology Technologist, France
“If the ergonomics were better, the techs could be more efficient and complete more scans daily.”
– J, Radiology Technologist, US
The need for automation and Artificial Intelligence
(AI) to improve the staff experience for imaging
technologists, administrators, radiologists, and
collaborating physicians is not merely a nicety at
this juncture; it’s a necessity. Staff know the power
of technology to work for or against them, and
they are eager to see it align around their needs.
When discussing inefficiencies in their work
environment, staff are quick to point out
opportunities for improvement. Automating
processes related to patient and staff
scheduling, patient preparation, protocoling
and protocol selection, pre-exam planning
(e.g., contraindications and implants), patient
positioning, image analysis and post-processing,
and readying results to be sent to PACS would go
far toward helping imaging staff spend less time
with technology and more time with patients.
Focusing innovation efforts in these areas
has great potential to improve workflow and
throughput, enhance patient satisfaction, and
decrease staff stress and burnout.
The upshot
Q (RTs + IDs): What percentage of your work do you feel is inefficient
and would make your job better if it was automated?
Total
29%
23%20%
17%
23%
France Germany UKUS
Sta� voices
20 Radiology staff in focus research report Radiology staff in focus research report 21

Communication and information flow
When asked which communication/information channels are most critical to improve, respondents ranked Ordering Physicians first. It makes total sense: How can you do your job well and without undue stress when you’re not sure what you’re supposed to do and why?
“Town doctors sometimes ask for outdated exams that are not done anymore. I think they are not informed enough about radiology…. Secretaries do not have paramedical training and sometimes plan inadequate exams for patients.”
– C, Radiology Technologist, France
“Very often, only ‘X-Ray leg’ is mentioned – not which one, what to look for, or the area to scan.”
– S, Radiology Technologist, Germany
The number of information sources and systems
that must be figured into a patient’s care journey
has never been greater. As we move beyond
imaging to a new era of Precision Diagnosis and
Precision Medicine, new data sources – genomic,
radiomic, cellular, pharmacological, demographic,
and more – will be applied to individual clinical
scenarios to guide the best course of treatment.
But even today, we’re facing communication and
information lapses that present an unacceptable
burden on an already struggling system. That’s
why it’s critical to take a systems view of imaging
and focus on optimizing radiology and informatics
workflows to support staff in getting the image
right the first time. This is an urgent prerequisite
for health systems and technology suppliers as we
glimpse the horizon of a new era of personalized
care. Without it, we place imaging staff in the
unmerited position of struggling to deliver the
enormous value of Precision Medicine to their
patients ‘for want of a nail.18
The upshot
Data insights:
Respondents indicated that information flows between Technologist–ordering physicians, Technologist–radiologists, Technologist–scheduling are the most critical ones to improve.
In Germany, the information flow between Technologist–patient/family is also cited as critical to improve.
Q (RTs + IDs): Which communication/information channels are the most critical to improve
between Techs and the following key stakeholders?
0%
2%
20%
7%
57%
67%
18%
82%
Germany
Technologist
Lead Technologist
Nurse
Radiology Administrator
Patient / Family
Scheduling
Radiologist
Ordering Physician
Technologist
Lead Technologist
Nurse
Radiology Administrator
Patient / Family
Scheduling
Radiologist
Ordering Physician
42%
83%
38%
29%
35%
15%
33%
29%
UK
23%
23%
35%
33%
28%
44%
57%
57%
US France
62%
63%
55%
27%
42%
32%
23%
25%
Sta� voices
22 Radiology staff in focus research report Radiology staff in focus research report 23
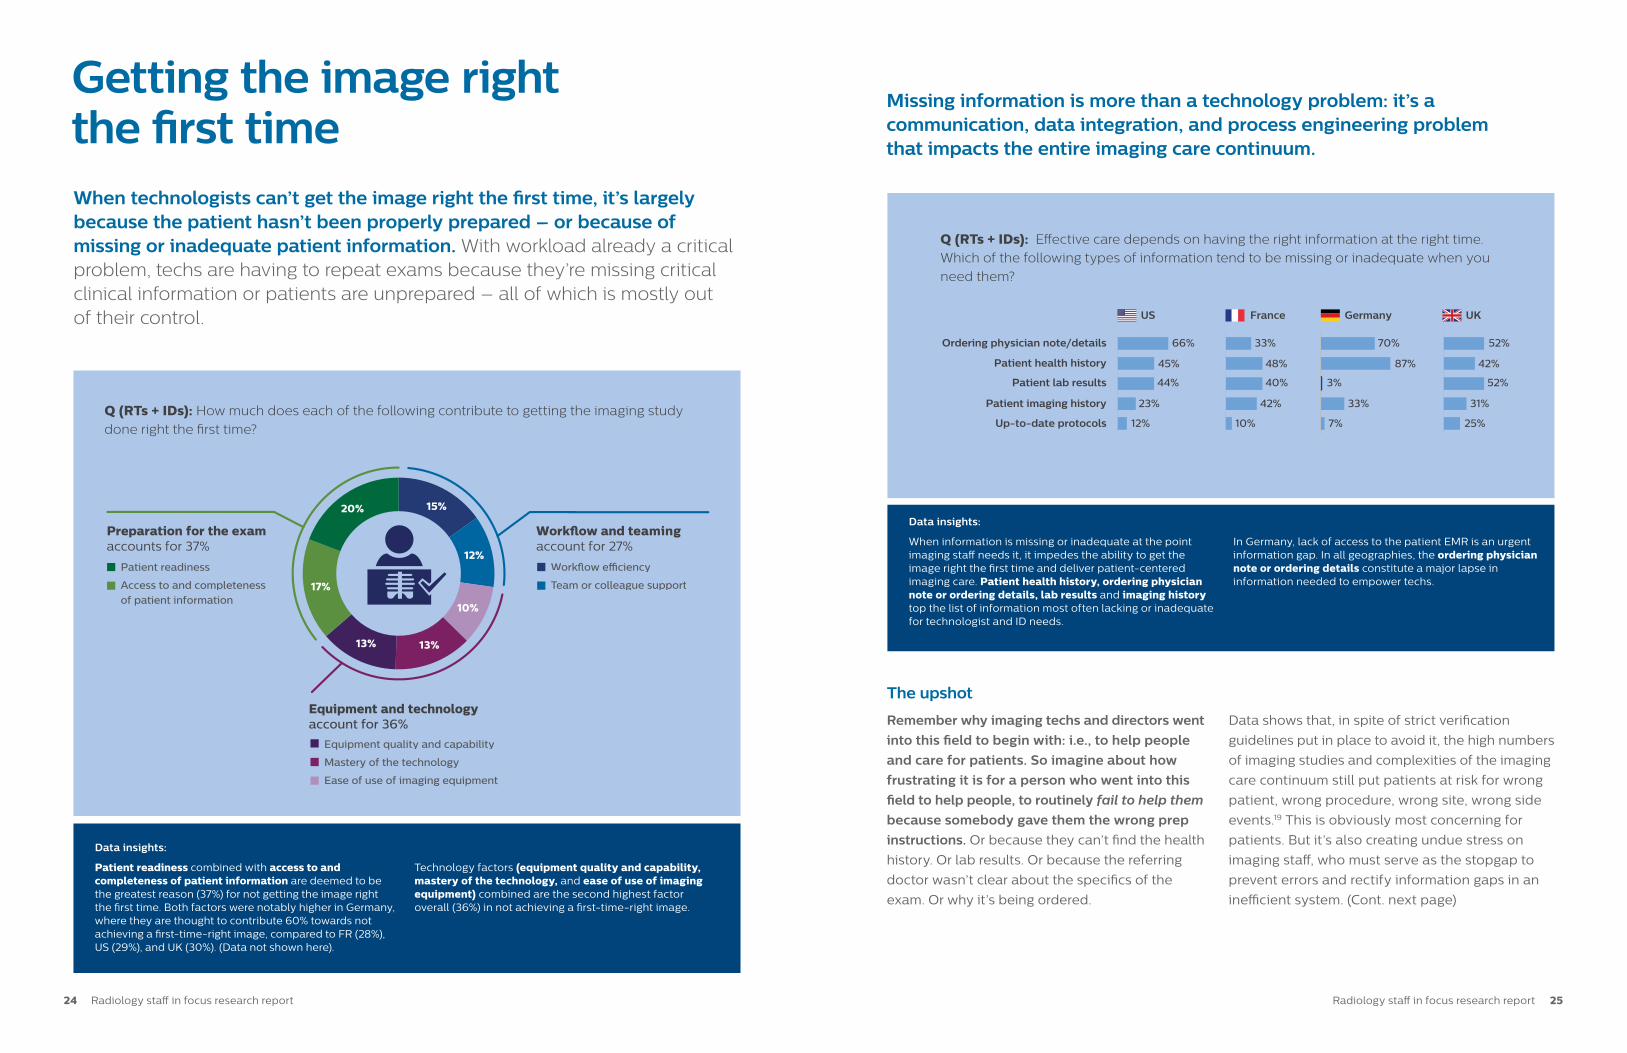
Getting the image right the first timeWhen technologists can’t get the image right the first time, it’s largely because the patient hasn’t been properly prepared – or because of missing or inadequate patient information. With workload already a critical problem, techs are having to repeat exams because they’re missing critical clinical information or patients are unprepared – all of which is mostly out of their control.
Missing information is more than a technology problem: it’s a communication, data integration, and process engineering problem that impacts the entire imaging care continuum.
Q (RTs + IDs): How much does each of the following contribute to getting the imaging study
done right the first time?
Remember why imaging techs and directors went
into this field to begin with: i.e., to help people
and care for patients. So imagine about how
frustrating it is for a person who went into this
field to help people, to routinely fail to help them
because somebody gave them the wrong prep
instructions. Or because they can’t find the health
history. Or lab results. Or because the referring
doctor wasn’t clear about the specifics of the
exam. Or why it’s being ordered.
Data shows that, in spite of strict verification
guidelines put in place to avoid it, the high numbers
of imaging studies and complexities of the imaging
care continuum still put patients at risk for wrong
patient, wrong procedure, wrong site, wrong side
events.19 This is obviously most concerning for
patients. But it’s also creating undue stress on
imaging staff, who must serve as the stopgap to
prevent errors and rectify information gaps in an
inefficient system. (Cont. next page)
The upshot
Data insights:
Patient readiness combined with access to and completeness of patient information are deemed to be the greatest reason (37%) for not getting the image right the first time. Both factors were notably higher in Germany, where they are thought to contribute 60% towards not achieving a first-time-right image, compared to FR (28%), US (29%), and UK (30%). (Data not shown here).
Technology factors (equipment quality and capability, mastery of the technology, and ease of use of imaging equipment) combined are the second highest factor overall (36%) in not achieving a first-time-right image.
Data insights:
When information is missing or inadequate at the point imaging staff needs it, it impedes the ability to get the image right the first time and deliver patient-centered imaging care. Patient health history, ordering physician note or ordering details, lab results and imaging history top the list of information most often lacking or inadequate for technologist and ID needs.
In Germany, lack of access to the patient EMR is an urgent information gap. In all geographies, the ordering physician note or ordering details constitute a major lapse in information needed to empower techs.
Patient readiness
Access to and completenessof patient information
Preparation for the exam accounts for 37%
Work�ow e�ciency
Team or colleague supportTT
Work�ow and teaming account for 27%
Equipment quality and capability
Mastery of the technology
Ease of use of imaging equipment
Equipment and technology account for 36%
20%
17%
13% 13%
10%
12%
15%
Q (RTs + IDs): Effective care depends on having the right information at the right time.
Which of the following types of information tend to be missing or inadequate when you
need them?
Up-to-date protocols
Ordering physician note/details
Patient imaging history
Patient lab results
Patient health history
12% 25%10% 7%
66% 52%33% 70%
23% 31%42% 33%
44% 52%40% 3%
45% 42%48% 87%
Germany UKUS France
24 Radiology staff in focus research report Radiology staff in focus research report 25

The good news is: these are addressable
problems. We have solutions and insights that can
help us tackle these challenges today. Deploying
communication tactics to better prepare patients…
arming techs with the information they need to
get the image right the first time…setting better
expectations with referring physicians: these are
all processes that we can address today without
huge technology investments. Considering the
fact that we spend up to US $12B a year on
unnecessary, sub-optimal, and repeat imaging,20
that’s effort well spent.
“Physician notes or ordering details tend to be missing or inadequate about half the time. This affects the workflow because [the techs] can’t process the order, so they have to stop and call the office. This causes delays, and the patient thinks the department is inefficient as a result.”
– K, Imaging Director, US
Tech confidence in imaging systems operationTechnologists’ confidence in their mastery of the systems they operate varies. In the US and UK, imaging directors overestimate and underestimate, respectively, their technologists’ skills. Given the high cost of imaging systems and huge demand for their use, staff confidence is an important factor to assess and improve.
Here we were interested in contrasting technologists’ confidence in their abilities with that of their supervisors’ (IDs’) confidence in their technologists’ abilities.
Q (RTs): How confident are you in
your skills/capabilities needed to
optimally operate the imaging systems
you work on?
Q (IDs): How confident do you
feel that your Techs have the skills/
capabilities to optimally operate
the imaging systems they work on?
Data insights:
Techs are more confident in the UK than in the US, GER and FR.
US IDs have higher confidence in their technologists than the techs themselves and underestimate the number of techs (10%) who feel only somewhat confident.
UK IDs have lower confidence in their technologists than the techs themselves, none of whom feel not at all confident vs. the IDs’ impression that 15% feel only somewhat confident.
FR and GER IDs seem to have a very realistic impression of their techs’ confidence.
Sta� voices
37%
29%
24%
10%
44%
15%
2%
39%
20%
10%
17%
53%
20%3%
17%
60%
10%
43%
47%
57%
7%
37%
50%
35%
15%
31%
23%
31%
15%
0%
20%
60%
40%
80%
100%
France Germany UKUS
Q RTs: How con�dent are you in your skills/capabilities needed to optimally operate the imaging systems you work on?
Q IDs: How con�dent are you that your Techs have the skills/capabilities to optimally operate the imaging systems they work on?
Extremely con�dent
Very con�dent
Con�dent
Somewhat con�dent
Not at all con�dent
1
3
2
4
5
RTs IDs RTs IDs RTs IDs RTs IDs
37%
29%
24%
10%
44%
15%
2%
39%
20%
10%
17%
53%
20%3%
17%
60%
10%
43%
47%
57%
7%
37%
50%
35%
15%
31%
23%
31%
15%
0%
20%
60%
40%
80%
100%
France Germany UKUS
Q RTs: How con�dent are you in your skills/capabilities needed to optimally operate the imaging systems you work on?
Q IDs: How con�dent are you that your Techs have the skills/capabilities to optimally operate the imaging systems they work on?
Extremely con�dent
Very con�dent
Con�dent
Somewhat con�dent
Not at all con�dent
1
3
2
4
5
RTs IDs RTs IDs RTs IDs RTs IDs
Note: Due to rounding,
some totals fall below 100%.
26 Radiology staff in focus research report Radiology staff in focus research report 27

Staff empowermentWhile techs are quite clear about causes of inefficiency in their departments, many do not feel empowered to effect change.
Q (RTs + IDs): How empowered do you feel to effect change in your department?
Data insights:
A majority of FR and UK respondents (65% and 59%, respectively) felt either Not at all empowered or just Somewhat empowered.
Differences by role (data not shown): Not surprisingly, IDs feel somewhat more empowered (mean = 3.1) than the technologists they manage (mean = 2.5). Creating positive change in the imaging
environment requires empowering the people
behind the image – in this case, the imaging techs
and directors responsible for the critical image
acquisition phase of diagnostic imaging. To that
end, we asked both imaging techs and directors
how empowered they felt to effect change in
their departments.
A recent report by Salesforce revealed that
employees who feel their voice is heard at work
are nearly five times (4.6X) more likely to feel
empowered to perform their best work.21 In
addition, studies have shown that empowered
employees are more satisfied and committed
to their workplace. According to recent research
published in the Harvard Business Review, “when
employees feel empowered at work, it’s associated
with stronger job performance, job satisfaction and
commitment to the organization.” Moreover, they
were likely to trust leaders they perceived as more
empowering.22
Empowerment is about supporting staff. As we
have seen in this study, imaging staff are quite
clear in their assessment of the gaps and obstacles
to better job satisfaction and patient care.
The upshotGiving them a voice – and making them a vested
partner in transforming care – is a valuable key
to unlocking the goals of the Quadruple Aim:
happier patients and more satisfied staff, with
better outcomes and at lower cost.
The issue of staff confidence in their mastery of
technology rightly raises the issue of training.
Clearly, the onus is on both technology vendors
and imaging departments and to make sure techs
have access to the training and support resources
they need, when they need them. In this area,
there’s certainly room for improvement.
Beyond formal technical training, however, is
an opportunity to build confidence through less
formal staff development structures. Let’s be
honest: a lack of professional confidence is a
factor many may not want to share. Initiatives
around teaming, mentoring, best practice
sharing, and confidential staff input are ways to
address staff insecurity while at the same time
building team trust. Trust is essential to honest
communication about skill, and skill is directly
related to image quality. Moreover, tactics such
as these can go a long way toward enhancing
engagement and loyalty among staff who will
certainly be exposed to competing opportunities
as the bid for talent intensifies.
The upshot
“It would be helpful to have cheat sheets for the sequences because a lot of people don’t know what sequences to do” (i.e., difference between T1 and T2) and then they “check with the radiologist after that.”
– T, Radiology Technologist, US
Sta� voices
Extremely empowered
Q (RTs + IDs): How empowered do you feel to e�ect change in your department?
Somewhat empowered
Not at all empowered
Empowered
Very empowered
France Germany UK TotalUS
1
3
2
4
5
5%
22%
27%
43%
3%
30%
30%
21%
39%
21%
15%4%10%16%
26%
28%
23%
7% 7%
23%
21%
9%
26%
31%
13%
0%
20%
60%
40%
80%
100% Extremely empowered
Q (RTs + IDs): How empowered do you feel to e�ect change in your department?
Somewhat empowered
Not at all empowered
Empowered
Very empowered
France Germany UK TotalUS
1
3
2
4
5
5%
22%
27%
43%
3%
30%
30%
21%
39%
21%
15%4%10%16%
26%
28%
23%
7% 7%
23%
21%
9%
26%
31%
13%
0%
20%
60%
40%
80%
100%
Note: Due to rounding,
some totals fall below 100%.
Radiology staff in focus research report 2928 Radiology staff in focus research report

1) Imaging’s System Advantage: Five goals for
achieving systemness in imaging, Advisory
Board Company, 2016.
2) Source: “Radiologic Technologists Wage
and Salary Survey 2016,” American Society
of Radiologic Technologists, http://hshs.
csi.edu/radiologic_technology/documents/
radiologic-technologist-wage-and-salary-
survey-2016.pdf
3) “The Other Elephant in the Hospital Room”
LFT (Leaders for Today) Survey: Hospital
staff hiring & turnover, May 2017.
4) Ibid.
5) “Enrollment Snapshot of Radiography,
Radiation Therapy and Nuclear Medicine
Technology Programs-2017,” American
Society of Radiologic Technologists,
https://www.asrt.org/docs/default-
source/research/enrollment-snapshot/
enrollment_snapshot_2017.pdf
6) Source: 2019 Hospital Benchmark
Generator, Health Care Advisory Board;
2017 Imaging Benchmarking Survey,
Imaging Performance Partnership,
Advisory Board; Imaging Performance
Partnership interviews and analysis.
https://www.advisory.com/
7) Profit estimates based on facilities at
25th and 75th percentile of staff/scanner.
Average payment per case as reported
in CMS’s Outpatient Standard Analytical
file (SAF).
8) “2017 Annual Turnover, Vacancy, and
Premium Labor Benchmarks,” HR
Advancement Center, Advisory Board;
Imaging Performance Partnership
interviews and analysis, 2017.
9) Achor, Shawn. “The Happiness Dividend,”
Harvard Business Review, June 23, 2011.
https://hbr.org/2011/06/the-happiness-
dividend
10) Oswald, Andrew J., Proto, Eugenio and
Sgroi, Daniel. (2015) “Happiness and
productivity,” Journal of Labor Economics,
33 (4). pp. 789-822. http://wrap.warwick.
ac.uk/63228
11) Schwartz, Tony, and Christine Porath, “Why
You Hate Work,” New York Times, Section
SR, New York edition, p.1. June 1, 2014.
https://www.nytimes.com/2014/06/01/
opinion/sunday/why-you-hate-work.
html?_r=1
12) Gallup poll: “How Millennials Want to
Work and Live.” 2016. https://www.gallup.
com/workplace/238073/millennials-work-
live.aspx
13) The Workplace Stress Scale™, Copyright ©
The Marlin Company, North Haven, CT,
and the American Institute of Stress,
Yonkers, NY.
14) According to Medscape’s Radiologist
Lifestyle Report 2018: Personal
Happiness vs Work Burnout, 47% of
radiologists state feeling burned out,
depressed, or both: https://www.
medscape.com/slideshow/2018-lifestyle-
radiologist-6009241#4
15) Emotional Exhaustion (EE) Subscale of the
Maslach Burnout Inventory (MBI) (Maslach
& Jackson, 1981). https://www.ncbi.nlm.nih.
gov/pmc/articles/PMC2700194/
16) Shanafelt TD at al. Longitudinal study
evaluating the association between
physician burnout and changes in
professional work effort. Mayo Clin Proc.
2016 Apr;91(4):422-31.
17) Shanafelt TD, Noseworthy JH. Executive
Leadership and Physician Well-being:
Nine Organizational Strategies to Promote
Engagement and Reduce Burnout. Mayo
Clin Proc. 2017 Jan;92(1):129-146.
18) “For want of a nail” is based on a proverb,
having numerous variations over the
centuries, reminding that seemingly
unimportant acts or omissions can have
grave and unforeseen consequences.
https://en.wikipedia.org/wiki/For_Want_
of_a_Nail
19) For an interesting analysis, see “Adapting
Verification Processes to Prevent Wrong
Radiology Events,” PA Patient Saf Advis
2018 Sep;15(3).
20) Peer60; Unnecessary Imaging.
https://reactiondata.com/wp-
content/uploads/2015/02/peer60-
unnecessaryimaging.pdf
21) The Impact of Equality and Values Driven
Business: Insights from over 1,500 business
professionals on workplace equality and
values driven leadership trends. A report
by Salesforce. https://www.salesforce.com/
contents/impact-of-equality/
22) Allan Lee, Sara Willis, and Amy Wei Tian,
“When Empowering Employees Works, and
When It Doesn’t,” Harvard Business Review.
March 2, 2018. https://hbr.org/2018/03/
when-empowering-employees-works-
and-when-it-doesnt
References
So what’s the takeaway? At Philips, we understand
we have a mandate as a technology partner
to connect data and technology in a way that
empowers staff and doesn’t add to their stress.
And for you on the front lines of imaging, we hope
this underscores some of the areas where you can
focus your improvement efforts today. Identifying
better ways to prepare patients… arming
technologists with the information they need to
get the image right the first time… recognizing
staff and expressing appreciation: these are all
incremental improvement tactics that can make a
huge difference for staff.
These are not easy problems. But the good news
is: we know where to take action to ease the
burden on staff, and we’re committed to working
with you to do it.
Conclusion
Radiology staff in focus research report 3130 Radiology staff in focus research report

© 2019 Koninklijke Philips N.V. All rights reserved.
4522 991 53691 * OCT 2019 www.philips.com