radius of curvature metrology for segmented mirrors
TRANSCRIPT
Current Developments in Lens Design and Optical Systems Engineenng,Robert E. Fischer, R. Barry Johnson, Warren J. Smith, William H. Swantner, Editors,
Proceedings of SPIE Vol. 4093 (2000)© 2000 SPIE. . 0277-786X/00/$15.00
Radius of curvature metrology for segmented mirrors
Dave Baiocchi and J. H. Burge
Optical Sciences Ctr./Univ. of Arizona, Thcson AZ
ABSTRACTFuture space and ground telescopes will have apertures that are increasingly larger in size. The primary mirrors frrthese telescopes will be so large that they cannot be fabricated, transported, and/or launched as a single entity. Onesolution is to build a large mirror out of smaller segments. The biggest challenge in fabricating segmented mirrors ismatching the individual pieces so they form a single, continuous surface. This requirement means that the radii ofcurvature must all match. We present a technique for matching the relative radii of curvature for segmented mirrors.and we include an error analysis of this method.
Keywords: Telescopes, segmented mirrors, radius of curvature
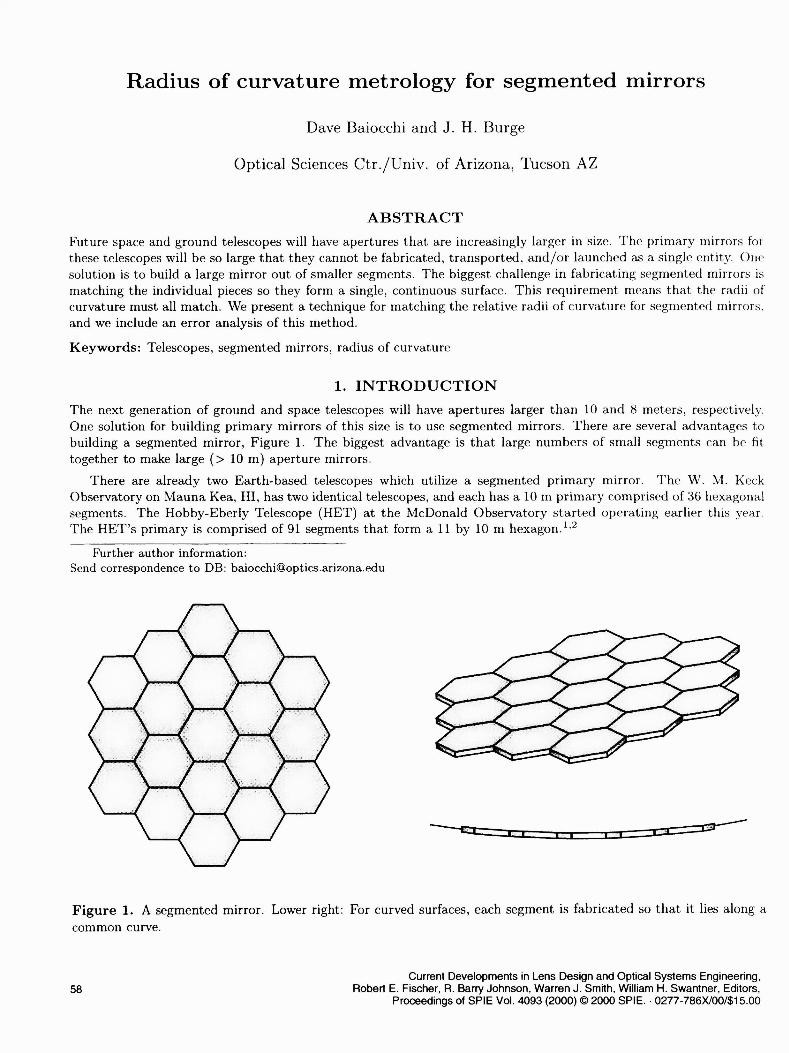
1. INTRODUCTIONThe next generation of ground and space telescopes will have apertures larger than 10 and 8 meters, respectively.One solution for building primary mirrors of this size is to use segmented mirrors. There are several advantages tobuilding a segmented mirror, Figure 1. The biggest advantage is that large numbers of small segments can be fittogether to make large (> 10 m) aperture mirrors.
There are already two Earth-based telescopes which utilize a segmented primary mirror. The W. M. KeckObservatory on Mauna Kea, HI, has two identical telescopes, and each has a 10 m primary comprised of 36hexagonalsegments. The Hobby-Eberly Telescope (HET) at the McDonald Observatory started operating earlier this year.The HET's primary is comprised of 91 segments that form a 11 by 10 m hexagon."2
Further author information:Send correspondence to DB: baiocchi©optics.arizona.edu
58
Figure 1. A segmented mirror. Lower right: For curved surfaces, each segment is fabricated so that it lies along acommon curve.

For large space-based telescopes, a segmented primary is a necessity. Future space telescopes must be engineeredso they comply with the size and mass restrictions imposed by the launch vehicle. A telescope can be launched intoorbit in several small segments, and the final instrument can be assembled in space. There is also less risk in buildingsmaller segments. If one of the segments is damaged, it can be easily replaced. If a monolithic mirror is damaged,the entire part must be recast.
The successor to the Hubble Space Telescope, the Next Generation Space Telescope (NGST) , will have an 8 metersegmented primary mirror. While the most of NGST's details are still in the design phase, a segmented primarymirror will be part of the final telescope.
Until recent years, the Earth's atmosphere limited the resolution of Earth-based telescopes. Space telescopesare free from this limitation, and ground-based instruments are now utilizing adaptive optics to correct for theatmosphere. Due to these improvements all telescopes can now be designed to be diffraction-limited. A diffraction-limited instrument is one in which the resolution is no longer limited by the quality of the optics. Because of this,telescopes can now be built to optical tolerances, and it's crucial that the segments all have the same radius ofcurvature. We analyze the effect of radius mismatch on the system performance in Section 3.1.
The need to carefully match radii presents an interesting challenge for the optics shop. Measuring the radius ofcurvature (ROC) to a high level of accuracy using conventional tools is extremely difficult. In the following sections,we present a technique for measuring the relative radii of curvature of the mirror segments to within 10 microns.
2. METROLOGY2.1. Test Setup for Radius of Curvature MeasurementsFor single, curved mirrors, measuring the radius of curvature is not of significant concern because it only introducesa defocus error. This defocus is easily removed by adjusting the position of one of the system elements. The opticianuses conventional tools (a spherometer or inside micrometer), and measures the accuracy of the ROC to a fewmillimeters.
Multiple mirror systems combine several mirrors to form one large primary, and the errors cannot be corrected bymoving the image plane. In order to minimize this error, the individual segments should lie along the same surfaceand have the same radius of curvature. It is therefore essential that the segments have their relative radii of curvaturematched to within a few tens of microns.
Figure 2 shows our test plate setup for measuring the relative radii of the segments. The convex reference surfaceof the test plate should have a radius of curvature that is about 1 - 2 cm less than the mirror under test. The testplate is translated until all of the power is removed from the image. In doing this, we overlap the centers of curvatureof the two surfaces. The gap between the facesheet and the test plate —which can be measured very accurately witha telescoping gauge and micrometer — represent the difference in radii between the test plate and the mirror surface.Additional segments are measured with a similar procedure: the test plate is translated to remove the power andthe gap is measured. Note that this method is measuring the relative ROC between the mirrors, not the absoluteradius.
An additional benefit of using this technique is that we can perform phase-shifting interferometry (PSI) withthe setup. PSI is a powerful tool which creates a surface profile by varying the phase between the reference andtest surface.3 This is done by physically moving the reference with respect to the test piece using piezo-electrictransducers.
2.2. Test Setup for Radius of Curvature Measurements for AspheresAll of the latest telescope designs use aspheric optics. Aspheres allow for a more efficient and compact optical design:light is collected more efficiently and the enclosure around the telescope is smaller.
The technique described in the previous section is easily modified into a scheme which measures aspheres accu-rately and efficiently. The technique4 employs a computer-generated hologram (CGH) that is projected directly ontothe test plate.* A diagram of this scheme is shown in Figure 3. The test plate provides a reference surface, and thewavefront stored in the hologram is that of a perfect asphere. This wavefront is interfered with the reference beam's
*An alternative method is to write the CGH directly onto the test plate. However, this method requires a different testplate/CGH combination for every unique segment. For most applications, this technique is too costly to implement.
Proc. SPIE Vol. 4093 59

Laser Source,Imaging Optics,
and COD Camera
Reference Surface
Figure 2. Test setup for ROC measurements.
Laser Source &Collimator
CGH
Projection Lens
Test PlateMirror Segment
Figure 3. Diagram of the system which projects a CGH onto the test plate. The first two orders of diffractionfrom the CGH are projected onto the test part with a projection lens. The CGH is designed so the 1st-order lightreflected from the segment will exactly match the 0-order light reflected from the test plate.
reflection off the test optic, and the resulting fringe pattern represents the residual error between the test part andideal wavefront.
This system has several important advantages:
High accuracy. Using holograms fabricated with electron beam lithography, this test can achieve an accuracyof th for large, steep, off-axis aspheres.
60 Proc. SPIE Vol. 4093
Fold Mirror
Test Plate
Mirror Segment
CCD Camera &Imaging Optics

. Low cost. This test requires only one accurate surface: the reference side of the test plate.
. Accurate radius measurement. Using the technique described in Section 2. 1 , the relative radii of differentsegments can be measured to tens of microns.
. Efficient. For different off-axis segments, the only necessary modification is a new CGH. Thus, an entire systemof segments is easily and quickly tested by simply inserting the appropriate CGH.
3. TEST ACCURACY3.1. Radius of Curvature Error and System PerformanceAs we mentioned in Section 2. 1 , the ROC errors from the various segments cannot be removed at the image plane.Thus, for a segmented mirror, it is useful to determine how errors in the relative radii affect the system performance.
The Strehi ratio is a useful quantity for assessing the performance of a diffraction-limited optical system. Aqualitative definition of the Strehi ratio is
. intensity of onaxis aberrated imageStrehl ratio = . . .
intensity of perfect image
For our system, we will determine how a typical error in the radius affects the Strehl ratio.
We begin by relating the error in the radius to the error in the sagitta:
(1)
where S is the sag, D is the segment diameter, and R is the ROC. We can take a derivative to see how errors in theROC, IR, affect sag error:
D2Ls -R.We can define the segment "R-number" as . This is more useful quantity than the F-number because mirrors aregenerally tested at their center of curvature. We can express the previous equation in terms of R/#:
Ls = - (R/#)2 (2)
Figure 4 shows a plot of Equation 2 for R/7, R/1O, and R/15 optical systems. As expected, errors in the radius havea greater effect on the sag errors for "faster" (smaller R-number) systems. A low R-number means that the optichas a significant amount of curvature which quickly focus the incident rays.
Now that we have a relationship between radius error and sag error, we can describe the Strehi ratio in terms ofzR. A convenient mathematical form for the Strehl ratio is
SR e_(22 1 — (2iro2, (3)
where .2 is the wavefront variance in units of waves. The square root of 2 is the rms wavefront. This quantity isrelated to wavefront error as followst:
= 0.289W = 0.289(2S). (4)
We can substitute for /.S with the expression from Equation 2:
tWe derive the relationship between and W in Appendix A
Proc. SPIE Vol. 4093 61

R/7 0.075 S(pm)SS%
%. 0.05R/10
.. S% 0.025n15-..10 20 30
. c;::- . R(pm)-30 -20 -10 % %..
-0.025
-0.05
-0.075
Figure 4. Plot of Equation 2. This effect is more severe for faster systems.Strehi Ratio
-60 -40 -20 20 40 60--.-- .t ' R(im).— — , I' \ S%
—. , I— , I \ \
R/15 , I 0.95ii S
I,I sI '
I / 0.9 \I :I \
,/ I 0.85I II / I'
RhO : 0.8RI7
Figure 5. Strehl ratio as a function of ROC error. A = 633 nm (HeNe).
c7 = —0.289 ( (R/#)2).
Finally, we'll put the previous result into the Strehi ratio, Equation 3:
SR 1 — (_2 0.072 (R#2 J))2where we have used AJ so 0 is in units of waves. Figure 5 shows a plot of Equation 5. Smaller R-numbers have agreater affect on the system performance.
3.2. Accuracy of the Relative Radius MeasurementThere are three dominant sources of errors in the ROC measurement, and we now explain each in detail. Theseerrors are summarized in Table 1.
62 Proc. SPIE Vol. 4093

The first error has to do with measuring the gap between the test plate and the facesheet. Because the gaprepresents the difference in radii between the two parts, errors in this measurement contribute directly as errors inradius measurement. A good telescoping gauge and micrometer can measure this distance to within 5 microns.
Another effect on the measurement accuracy depends on the ability to remove all of the optical power at theimage. We can quantify this effect by recalling the relationship between sagitta (wavefront power) and segmentdiameter, Equation 1 . Because we're actually interested in errors in the radius due to the sag error, we'll solveEquation 2 for LR:
LRpower = —8 (R/#)2ES. (6)
We now have an equation which relates residual sag, LS, to error in the radius measurement, LR.
Figure 6 shows a plot of Equation 6. The plot shows two separate curves. The dotted curve represents a LS of; this is a typical iS when an optician uses an interferogram to remove the power to a quarter fringe. The solid
curve represents a zS of This is a typical value for LtS when phase-shifting interferometry is used.
The final error is due to the fact that the light incident on the test plate is not perfect. As shown in Figure 7,this presents a problem because off-axis rays are not normal to the test surface. Along the optic axis, the light isnormal to this surface, and it retraces the incident path back to the source. For off-axis rays, the light is not normalto the test surface, and this introduces an optical path difference (OPD) between the incident and reflected paths.We derive this error in Appendix B, and we'll simply state the results here. The error in the radius measurementdue to this effect is
LR0 = —8(R/#)2 d . a2 (7)
where d is the gap between the test and reference surfaces and is the slope error in radians (deviation from normalincidence). This error is large for a large air gap, d. When designing this test, the engineer should specify a testplate such that the air gap is only a few centimeters.
We conclude with a simple example that illustrates each factor's relative contribution to the overall accuracyof the ROC measurement. We'll consider an R/1O segment; the results are shown in Table 2. Let's supposethat using good tools and techniques, we measure the physical gap with an accuracy of iRgap 5gm. Oursetup allows us to remove all of the residual power except 31 .6 nm ( ). We can use Equation 6 to calculateLRpower = —8 (10)2 . 31 .6 nm = —25.3 jim. Finally, let's suppose that we have a 2 cm gap and a slope error of 0.001radians. Using Equation 7 we find = —8 (10)2 (0.02m)(0.001)2 = —16m. The RSS of these three values is
N S1/100wv-40
-60
-80 \\-100 \-120 \S1/8wv
Figure 6. iR as a function of F-number. The dotted line represents a typical amount of residual power when aninterferogram is used. The solid curve represents a PSI measurement. A = 633 nm (HeNe).
Proc. SPIE Vol. 4093 63

Figure 7. Right: Light incident near the edge of the test plate is not perpendicular to the optic. The actual path(exaggerated) is represented by the dotted line. Left: Magnified view of the air gap between the test plate andfacesheet.
Cause Effect, LR Comments
Inaccurately measuring the gap, RgapNot removing all of the power, Rpower
The "cosine" effect, LRCOS
d8 (R/#)2S
—8 (R/#)2d• a2
Good tools can measure distance to 5 microns.
Rpower = S
Minimize this error by making d small.
Table 1. Sources for error in the radius measurement, zR. The R-number (R/#) is the segment ROC over thediameter, -. LS is the residual power (or sag), a is the slope error (deviation from normal incidence), and d is thedistance between the test plate and facesheet.
30.3 tim. As with all RSS calculations, the largest value has the biggest effect on the overall result. For this situation.LR power will drive the final number.
Error Amount (,um) Contributing Parameters
LRgap
L'XRpower
5
-25.3
-16
We can measure the gap to 5 im
F/5 segment with of residual power
2 cm gap and 0.001 radian slope error
RSS:__{ 30.3
Table 2. Results for a typical example. The Rpower is the driving factor in this calculation.
64 Proc. SPIE Vol. 4093
j.. /2u' y / V

APPENDIX A. DERIVATION: RELATIONSHIP BETWEEN WAVEFRONTVARIANCE AND COEFFICIENT W20
We begin with the expression for variance:
=2ir 1 1 2ir 1 2
= [_ f f LW2(p, O)p dp do] — — [f f zW(p, O)p dp do]
For defocus, tiW = W20p2. We'll make this substitution and continue as follows:
1 27r 1 2ir 1 2f (Wop2)2p dp do] [f f W20p2p dp do]
Finally, we'll take a square root to solve for o:
w200 == 0.289W20
Proc. SPIE Vol. 4093 65

iass
similar triangles
Figure 8. Geometry of the path difference derivation. Left: when light is at normal incidence, the path throughthe gap is 2d. When light is incident at an angle Q, the OPD is not 2d. Right: closeup view of glass/air interface.
APPENDIX B. DERIVATION: THE "COSINE" EFFECT IN THE RADIUSMEASUREMENT
We now present the full derivation for Equation 7. As we mentioned in Section 3.2, when light is normal to thetest glass, the optical path difference (OPD) is 2d. When light is incident at an angle c, the OPD is different. Wewill derive the actual path difference and show the effect this has on the accuracy of the radius measurement. Forsimplicity, we will consider a plane parallel plate instead of a curved surface. We also assume that the two opticsrest parallel with respect to each other. Figure 8 shows the geometry of the situation.
We'll start by writing down the OPD for the transmitted and reflected rays,
OPD = (AB + BC) - (n,)AD. (8)
Note that ABis equal to because we assume that the test plate and test surface are parallel to each other. Wecan express AB in terms of O and the distance between the two optics, d:
We can now write Equation 8 as follows:
AB=cos (9)
OPD2d
— (n)Ai.cos
We know that AD is related to U by the following equation:
ADsin =AC
Finding AC is a little tricky. We can use half of triangle ABAC to get the following relation:
66 Proc. SPIE Vol. 4093
AC
sinOAB
(10)
(11)
air
ni
air ft
Ut

We'll solve the above equation for AC and replace AB with the expression from Equation 9:
AC = 2AB SlflOt,
— 2dsin9tcosOt
= 2dtanOt. (12)
We can now solve for AD in Equation 11 using the expression for AC in Equation 12:
M = 2dtan9tsinO2,= 2d tan Ot r! e, , (13)ni
where we have used Snell's Law to replace sin 9 with sin 9,. Note that for this example, n, is in air so it's equalto one.
We can finally complete our expression for the OPD between the two paths using Equations 10 and 13:
OPD = ( 2d ' —n(2dtanOt1sinOt),\cosOj ni
= 2d(1—sin29),cos
= 2dcos9t. (14)
We can express the final equation in terms of the slope error, a:
OPD = 2dcosa.
Note that Ot is equal to a and represents the angle between the incident ray and the surface normal. For normalincidence (a = 0) this error is zero.
The error in the sag measurement is the difference in the two optical paths:
zs = OPD1-OPD,= 2d—2dcosa= 2d(1—cosa)
d•a2
Finally, we can use Equation 6 to find L\R:
LiR0 = —8(R/#)2da2.
REFERENCES1. F. J. Cobos et. a!., "The Hobby-Eberly telescope low resolution spectrograph: optical design," in Optical Astro-
nomical Instrumentation, S. D'Odorico, ed., Proc. SPIE 3355, pp. 424—432, 1998.2. G. J. Hill et. al., "The Hobby-Eberly telescope low resolution spectrograph: mechanical design," in Optical
Astronomical Instrumentation, S. D'Odorico, ed., Proc. SPIE 3355, pp. 433—443, 1998.3. J. E. Greivenkamp and J. H. Bruning, "Phase shifting interferometers," in Optical Shop Testing, Second Ed.,
D. Malacara, ed., pp. 501—598, John Wiley & Sons, 1992.4. J. H. Burge, "Efficient testing of off-axis aspheres with test plates and computer-generated holograms," in Optical
Manufacturing and Testing III, H. P. Stahl, ed., Proc. SPIE 3782, pp. 348—357, 1999.
Proc. SPIE Vol. 4093 67