rail development plans infrastructure zones - … - chapter... · rail development plans...
TRANSCRIPT

Rail Development PlansInfrastructure Zones
Musina
Ore Line
Western & Southern Cape
Eastern Cape & Central Port System
Gauteng Freight Ring & Central CorePhalaborwa
Vaalwater
Lephalale Groenbult
Polokwane
Hoedspruit
Coal line, NATCOR and Eastern port system
Maputo Corridor
Northern System
Steelpoort
Komatipoort
Mafikeng
Kaapmuiden
Modimolle
Nelspruit
RietvalleiSWAZILANDErmelo
Zesfontein
Ogies
p
Roossenekal
Pyramid
Cachet
Lichtenburg
ColignyWelverdiend
Wesrand
RustenburgGreenview Derwent
Belfast
Machadadorp
Sishen
Upington
Hotazel
Kimberley
Veertien Strome
Danskraal
Nakop
Bethlehem
Klerksdorp
Harrismith
Vryheid
Glencoe
Empangeni
CachetHoutheuwel
Noupoort
Springfontein
Port Shepstone
DurbanLESOTHO
Halfweg
De Aar
Belmont
Richards BayBloemfontein
Pietermaritzburg
Maseru
Bitterfontein
Stanger
SaldanhaEast London
Rosmead
Cookhouse
Noupoort
Queenstown
Blaney
Hutchinson
Beaufort West
Alicedale
Slide 109July 2009
Cape TownPort ElizabethMosselbaai
Worcester
Ngqura
Kalbaskraal
Dal Josafat

Iron Ore Line: Profile
Distance 861 km
Topography oSemi-desert, descending to the coast from 1 295 m above sea level at the Sishen mines.
A l l d O t d t 30 t/ lAxle loads Operated at 30 t/axle
Ruling Gradient 0,37% loaded
Traction 50kV AC
Ci il Olif t i i B idCivil Olifantsrivier Bridge
# of lines Single line with crossing loops
Train Authorisation Simmis S colour light signalling
Locomotives oClass 9E and 34 Class DieselsLocomotives oClass 9E and 34 Class Diesels oClass 15 E locomotives being commissioned
Wagons CR type: max payload of 100 tons
Gross tons per train 34 200 tons @ 4km in lengthp g
Volumes in 2008/09 36mt export iron ore, 1 mt general freight
Competitiveness Longest heavy haul production t i i th ld
Slide 110July 2009
trains in the world

Hotazel
Rail Development PlansOre Line
Sishen
Upington
Nakop
Halfweg
Belmont
Phase Intervention Motivation Needed by
Phase 1B
19 passing loops extended (4.4km) with OHTE & SignallingLoop 7 replaced by loop 7A to facilitate more efficient operations
To provide increased operational capacity to achieve 47Mtpa 2010
Phase 1C
Port link lineIntroduce a direct link from Postmasburg
To provide increased operational capacity to achieve 60Mtpa 2013Halfweg
De Aar
Hutchinson
Beaufort West
Bitterfontein
1C Introduce a direct link from Postmasburg capacity to achieve 60Mtpa 2013
Phase 2A
Intermediate loops (4,4 km) with OHTE & SignallingTelecommunication system extensionsTrack work for Salkor and yard automation Service Lines for Tippler 3 Maintenance Facilities and support equipment Condition Monitoring Equipment Power Upgrade
To provide increased operational capacity to achieve 80Mtpa 2014
Saldanha
Cape Town
Mossel Bay
WorcesterKalbaskraal
Dal Josafat
pg p y p
Phase 2B
9 remaining loops (4,4 km) with OHTE & SignallingTelecommunication system extensionsTrack work for Salkor and yard automation Service Lines for Tippler 4 Maintenance Facilities and support equipment Condition Monitoring Equipment Power Upgrade
To provide increased operational capacity to achieve 105Mtpa 2015
Sishen - Saldanha
Op
s S
lots
20
07
20
08
20
09
20
10
20
11
20
12
20
13
20
14
20
15
20
16
20
17
20
18
20
19
20
20
20
21
20
22
20
23
20
24
20
25
20
26
20
27
20
28
20
29
20
30
20
31
20
32
20
33
20
34
20
35
20
36
20
37
Sishen Iron Ore - Salkor 7 6 6 % 6 8 % 7 6 % 7 9 % 8 3 % 1 1 3 % 1 3 2 % 1 3 5 % 1 4 2 % 1 4 3 % 1 4 4 % 1 4 6 % 1 4 7 % 1 4 9 % 1 5 0 % 1 5 1 % 1 5 3 % 1 5 4 % 1 5 6 % 1 5 7 % 1 5 9 % 1 6 1 % 1 6 3 % 1 6 5 % 1 6 6 % 1 6 8 % 1 7 1 % 1 7 3 % 1 7 5 % 1 7 8 % 1 8 0 %
Salkor - Saldanha 23 1 4 % 1 5 % 1 8 % 1 9 % 2 0 % 2 9 % 3 4 % 3 5 % 3 7 % 3 7 % 3 7 % 3 7 % 3 7 % 3 7 % 3 7 % 3 8 % 3 8 % 3 8 % 3 8 % 3 8 % 3 8 % 3 8 % 3 8 % 3 8 % 3 9 % 3 9 % 3 9 % 3 9 % 3 9 % 3 9 % 4 0 %
Slide 111July 2009

Rail Development Plans
Western and Southern Cape
Hotazel
Sishen
Upington
Kimberley
Nakop
Belmont
Location Intervention Principle Motivation Needed by
Bellville Relocate washing facility to Bellville 2 Operational Simplification 2012
Belcon Optimise yard at Belcon 2 If Belcon development continues 2019
Kraaifontein to Re-signalling fully 2 Out dated train control 2014
Rosmead
Noupoort
Halfweg
De Aar
Hutchinson
Beaufort West
Bitterfontein
Bellville directional with CTC 2 Out dated train control 2014
Wellington to Kraaifontein Re-signal 2 Out dated train control 2014
Saldanha
Cape Town
Mossel Bay
Worcester
Beaufort West
Kalbaskraal
Dal Josafat
Cape Town - De Aar
Ops
Slo
ts
2007
2008
2009
2010
2011
2012
2013
2014
2015
2016
2017
2018
2019
2020
2021
2022
2023
2024
2025
2026
2027
2028
2029
2030
2031
2032
2033
2034
2035
2036
2037
Cape Town - Bellville 32 1 1 % 9 % 7 % 8 % 8 % 9 % 9 % 9 % 1 0 % 1 0 % 1 1 % 1 2 % 1 2 % 1 3 % 1 4 % 1 5 % 1 6 % 1 7 % 1 8 % 1 9 % 2 0 % 2 1 % 2 3 % 2 4 % 2 6 % 2 8 % 3 0 % 3 2 % 3 4 % 3 6 % 3 9 %
Bellville - Kraaifontein 117 8 % 8 % 7 % 8 % 8 % 8 % 8 % 8 % 9 % 9 % 9 % 9 % 1 0 % 1 0 % 1 0 % 1 0 % 1 1 % 1 1 % 1 1 % 1 2 % 1 2 % 1 3 % 1 3 % 1 3 % 1 4 % 1 4 % 1 5 % 1 6 % 1 6 % 1 7 % 1 7 %
Kraaifontein - Dal Josafat 62 1 0 % 9 % 8 % 9 % 9 % 9 % 9 % 1 0 % 1 0 % 1 0 % 1 1 % 1 1 % 1 1 % 1 2 % 1 2 % 1 3 % 1 3 % 1 4 % 1 4 % 1 5 % 1 5 % 1 6 % 1 7 % 1 7 % 1 8 % 1 9 % 2 0 % 2 1 % 2 1 % 2 2 % 2 4 %
Saldanha to Cape Town
ps S
lots
2007
2008
2009
2010
2011
2012
2013
2014
2015
2016
2017
2018
2019
2020
2021
2022
2023
2024
2025
2026
2027
2028
2029
2030
2031
2032
2033
2034
2035
2036
2037
Kraaifontein Dal Josafat 62Dal Josafat - Hermon 35 1 7 % 1 6 % 1 5 % 1 5 % 1 6 % 1 6 % 1 7 % 1 7 % 1 8 % 1 8 % 1 9 % 1 9 % 2 0 % 2 1 % 2 2 % 2 2 % 2 3 % 2 4 % 2 5 % 2 6 % 2 7 % 2 8 % 2 9 % 3 1 % 3 2 % 3 3 % 3 5 % 3 7 % 3 8 % 4 0 % 4 2 %
Hermon - Worcester 25 2 5 % 2 4 % 2 2 % 2 2 % 2 3 % 2 4 % 2 5 % 2 5 % 2 6 % 2 7 % 2 8 % 2 9 % 3 0 % 3 1 % 3 2 % 3 3 % 3 4 % 3 6 % 3 7 % 3 9 % 4 0 % 4 2 % 4 4 % 4 5 % 4 7 % 4 9 % 5 2 % 5 4 % 5 7 % 5 9 % 6 2 %
Worcester - Beaufort West 17 2 1 % 1 9 % 1 5 % 1 6 % 1 7 % 1 8 % 1 9 % 2 0 % 2 1 % 2 1 % 2 2 % 2 4 % 2 5 % 2 6 % 2 8 % 2 9 % 3 1 % 3 3 % 3 4 % 3 6 % 3 8 % 4 1 % 4 3 % 4 6 % 4 8 % 5 1 % 5 4 % 5 7 % 6 1 % 6 5 % 6 9 %
Beaufort West - De Aar 18 1 8 % 1 7 % 1 3 % 1 4 % 1 5 % 1 6 % 1 7 % 1 7 % 1 8 % 1 9 % 2 0 % 2 1 % 2 2 % 2 3 % 2 5 % 2 6 % 2 7 % 2 9 % 3 1 % 3 2 % 3 4 % 3 6 % 3 8 % 4 1 % 4 3 % 4 5 % 4 8 % 5 1 % 5 4 % 5 8 % 6 1 %
Slide 112July 2009
Op
Salkor - Bergrivier 17 1 3 % 1 2 % 9 % 1 0 % 1 1 % 1 1 % 1 2 % 1 2 % 1 2 % 1 3 % 1 3 % 1 4 % 1 4 % 1 5 % 1 6 % 1 7 % 1 7 % 1 8 % 1 9 % 2 0 % 2 1 % 2 2 % 2 3 % 2 4 % 2 5 % 2 6 % 2 8 % 2 9 % 3 0 % 3 2 % 3 3 %
Bergrivier - Kalbaskraal 11 2 0 % 1 8 % 1 4 % 1 5 % 1 6 % 1 6 % 1 7 % 1 8 % 1 8 % 1 9 % 2 0 % 2 0 % 2 1 % 2 2 % 2 3 % 2 4 % 2 5 % 2 7 % 2 8 % 2 9 % 3 1 % 3 2 % 3 4 % 3 5 % 3 7 % 3 9 % 4 1 % 4 3 % 4 5 % 4 7 % 4 9 %
Kalbaskraal - Klipheuwel 28 1 5 % 1 5 % 1 4 % 1 4 % 1 5 % 1 5 % 1 5 % 1 6 % 1 6 % 1 6 % 1 7 % 1 7 % 1 7 % 1 8 % 1 8 % 1 8 % 1 9 % 1 9 % 2 0 % 2 0 % 2 1 % 2 1 % 2 2 % 2 2 % 2 3 % 2 3 % 2 4 % 2 4 % 2 5 % 2 5 % 2 6 %
Klipheuwel - Kraaifontein 24 1 7 % 1 7 % 1 6 % 1 7 % 1 7 % 1 7 % 1 8 % 1 8 % 1 8 % 1 9 % 1 9 % 2 0 % 2 0 % 2 0 % 2 1 % 2 1 % 2 2 % 2 2 % 2 3 % 2 3 % 2 4 % 2 4 % 2 5 % 2 5 % 2 6 % 2 7 % 2 7 % 2 8 % 2 9 % 2 9 % 3 0 %
Source: Transnet Group Planning

Rail Development Plans
Eastern Cape and Central Port System – Manganese Export CorridorHotazel Klerksdorp
Houtheuwel
H t l P E Slot
s
07 08
09 10
11
12
13
14
15
16 17
18 19
20
21
22
23
24
25 26
27
28
29
30
31
32 33
34 35
36
37
Sishen
Kimberley
Veertien Strome
Arlington
LESOTHO
Bethlehem
Belmont
Bloemfontein
Maseru
Hotazel – P. E.
Ops
S
20
0
20
0
20
0
20
1
20
1
20
1
20
1
20
1
20
1
20
1
20
1
20
1
20
1
20
2
20
2
20
2
20
2
20
2
20
2
20
2
20
2
20
2
20
2
20
3
20
3
20
3
20
3
20
3
20
3
20
3
20
3
Hotazel - Mamathwane 6 45% 40% 42% 51% 54% 56% 58% 60% 63% 66% 68% 71% 74% 77% 80% 83% 87% 90% 94% 97% 101% 104% 108% 112% 116% 120% 124% 128% 132% 137% 141%
Mamathwane - Sishen 5 83% 74% 76% 88% 93% 97% 100% 105% 111% 114% 118% 123% 128% 133% 139% 145% 152% 159% 165% 172% 179% 187% 195% 203% 211% 219% 228% 237% 247% 256% 265%
Sishen - Lohatlha 12 86% 78% 71% 79% 84% 81% 85% 89% 94% 97% 101% 105% 111% 117% 124% 133% 137% 141% 145% 149% 153% 157% 162% 167% 171% 176% 181% 187% 192% 198% 203%
Lohatlha - Beeshoek 14 73% 67% 61% 67% 71% 67% 70% 74% 78% 80% 84% 87% 92% 97% 104% 112% 115% 118% 121% 125% 128% 132% 135% 139% 143% 147% 151% 156% 161% 165% 170%
Beeshoek - Postmasburg 14 71% 64% 56% 62% 66% 69% 72% 75% 79% 82% 86% 90% 94% 100% 107% 115% 118% 122% 125% 128% 131% 135% 139% 143% 147% 151% 155% 160% 164% 169% 173%
Postmasburg - Groenwater 11 88% 79% 70% 77% 82% 85% 89% 93% 98% 101% 106% 111% 117% 124% 132% 142% 146% 150% 154% 158% 163% 167% 172% 177% 181% 186% 192% 197% 203% 209% 214%
Groenwater - Lime Acres 17 58% 52% 47% 52% 56% 58% 60% 63% 66% 69% 72% 75% 79% 83% 89% 95% 98% 101% 103% 106% 109% 112% 115% 119% 122% 125% 129% 133% 136% 140% 144%
Lime Acres - Silverstreams 12 100% 90% 79% 87% 93% 97% 101% 105% 111% 115% 120% 125% 132% 140% 148% 159% 164% 169% 174% 180% 185% 191% 198% 204% 210% 217% 224% 232% 240% 248% 256%
Rosmead
Noupoort
Springfontein
Queenstown
Bl
De Aar
utchinson
Beaufort WestNoupoort - Cookhouse 8 8 9 % 5 0 % 4 5 % 5 5 % 5 9 % 6 2 % 6 3 % 6 7 % 7 0 % 7 4 % 7 8 % 8 2 % 8 7 % 9 1 % 9 6 % 1 0 0 % 1 0 5 % 1 1 0 % 1 1 5 % 1 2 0 % 1 2 6 % 1 3 1 % 1 3 7 % 1 4 3 % 1 5 0 % 1 5 6 % 1 6 3 % 1 7 1 % 1 7 8 % 1 8 6 % 1 9 4 %
C kh Ali d l 7
De Aar - Noupoort 7 9 8 % 5 6 % 5 0 % 6 1 % 6 5 % 6 8 % 7 0 % 7 4 % 7 8 % 8 2 % 8 6 % 9 1 % 9 6 % 1 0 1 % 1 0 7 % 1 1 2 % 1 1 7 % 1 2 3 % 1 2 9 % 1 3 5 % 1 4 2 % 1 4 8 % 1 5 5 % 1 6 3 % 1 7 0 % 1 7 8 % 1 8 7 % 1 9 5 % 2 0 4 % 2 1 4 % 2 2 4 %
Silverstreams - Ulco 12 108% 97% 85% 94% 100% 104% 108% 113% 119% 123% 129% 135% 142% 150% 159% 170% 176% 181% 187% 193% 199% 206% 213% 220% 227% 235% 243% 251% 260% 269% 278%
Ulco - Barkly West 12 108% 97% 85% 93% 99% 103% 107% 112% 118% 122% 128% 134% 141% 149% 158% 169% 175% 180% 186% 192% 198% 205% 212% 219% 226% 233% 241% 250% 258% 267% 276%
Barkly West - Fieldsview 12 108% 97% 85% 93% 99% 104% 108% 113% 118% 123% 128% 134% 141% 149% 159% 169% 175% 181% 186% 192% 198% 205% 212% 219% 226% 234% 242% 250% 259% 267% 276%
Fieldsview - Kamfersdam 21 9% 9% 8% 10% 11% 11% 12% 12% 13% 13% 14% 15% 15% 16% 17% 17% 18% 19% 19% 20% 20% 21% 22% 22% 23% 24% 24% 25% 26% 27% 27%
De Aar - Belmont 7 96% 86% 73% 87% 92% 97% 100% 105% 111% 116% 122% 129% 137% 144% 151% 158% 166% 174% 183% 192% 201% 211% 221% 231% 243% 254% 267% 280% 293% 308% 323%
Belmont - Beaconsfield 7 98% 88% 74% 88% 94% 98% 102% 107% 113% 118% 124% 131% 139% 146% 153% 161% 168% 177% 185% 194% 203% 213% 223% 234% 245% 257% 270% 283% 296% 311% 326%
Beaconsfield - Kamfersdam 27 27% 24% 21% 23% 25% 26% 27% 28% 30% 31% 33% 35% 37% 38% 41% 43% 45% 47% 49% 52% 55% 58% 61% 64% 67% 71% 74% 78% 83% 87% 92%
Kamfersdam - MacFarlane 72 7% 7% 5% 6% 6% 6% 7% 7% 7% 8% 8% 9% 9% 10% 10% 11% 11% 12% 13% 13% 14% 15% 16% 17% 18% 19% 20% 22% 23% 25% 26%
East London
Port Elizabeth
Cookhouse Blaney
Alicedale
Ngqura
Cookhouse - Alicedale 7 1 0 8 % 5 2 % 4 9 % 6 4 % 6 7 % 7 1 % 7 2 % 7 6 % 8 0 % 8 4 % 8 8 % 9 2 % 9 7 % 1 0 1 % 1 0 6 % 1 1 0 % 1 1 5 % 1 1 9 % 1 2 4 % 1 2 9 % 1 3 4 % 1 3 8 % 1 4 4 % 1 4 9 % 1 5 4 % 1 6 0 % 1 6 6 % 1 7 2 % 1 7 8 % 1 8 4 % 1 9 1 %
Alicedale - Addo 7 1 0 8 % 5 2 % 4 9 % 6 4 % 6 7 % 7 0 % 7 2 % 7 6 % 8 0 % 8 4 % 8 8 % 9 2 % 9 7 % 1 0 1 % 1 0 6 % 1 1 0 % 1 1 5 % 1 1 9 % 1 2 4 % 1 2 8 % 1 3 3 % 1 3 8 % 1 4 3 % 1 4 9 % 1 5 4 % 1 6 0 % 1 6 6 % 1 7 2 % 1 7 8 % 1 8 4 % 1 9 1 %
Addo - Coega 26 2 7 % 1 9 % 1 6 % 1 8 % 1 9 % 2 0 % 2 1 % 2 2 % 2 3 % 2 4 % 2 5 % 2 7 % 2 9 % 3 0 % 3 2 % 3 4 % 3 5 % 3 7 % 3 9 % 4 1 % 4 3 % 4 6 % 4 8 % 5 1 % 5 4 % 5 6 % 5 9 % 6 3 % 6 6 % 7 0 % 7 3 %
Coega - Swartkops 26 2 1 % 1 9 % 1 6 % 1 8 % 1 9 % 2 0 % 2 1 % 2 2 % 1 3 % 1 4 % 1 5 % 1 6 % 1 7 % 1 8 % 1 9 % 2 0 % 2 2 % 2 3 % 2 5 % 2 6 % 2 8 % 3 0 % 3 2 % 3 4 % 3 6 % 3 8 % 4 1 % 4 4 % 4 7 % 5 0 % 5 3 %
Swartkops - New Brighton 26 1 7 % 1 5 % 1 3 % 1 5 % 1 6 % 1 7 % 1 7 % 1 8 % 9 % 1 0 % 1 0 % 1 1 % 1 1 % 1 2 % 1 3 % 1 3 % 1 4 % 1 5 % 1 6 % 1 7 % 1 8 % 1 9 % 2 0 % 2 2 % 2 3 % 2 4 % 2 6 % 2 8 % 2 9 % 3 1 % 3 3 %
New Brighton - Algoabaai 26 1 3 % 1 2 % 1 0 % 1 3 % 1 3 % 1 4 % 1 4 % 1 5 % 6 % 6 % 7 % 7 % 8 % 8 % 9 % 9 % 1 0 % 1 1 % 1 1 % 1 2 % 1 3 % 1 4 % 1 5 % 1 6 % 1 7 % 1 8 % 1 9 % 2 1 % 2 2 % 2 4 % 2 5 %
Algoabaai - Port Elizabeth 26 0 % 0 % 0 % 0 % 0 % 0 % 0 % 0 % 0 % 0 % 0 % 0 % 0 % 0 % 0 % 1 % 1 % 1 % 1 % 1 % 1 % 1 % 1 % 1 % 1 % 1 % 1 % 1 % 1 % 1 % 2 %
Location Intervention Needed
Hotazel to Sishen Two new substations 2021
Hotazel to Kimberley Extension of 5 passing loops to accommodate long trains, with 3k.V D.C OHTE, and CTC signalling 2019
Hotazel to KimberleyOHTE upgrades, signalling renewal, 3 substations, 25kV upgrade from hotazel to Kimberley, Power supply upgrade loco run round at Beaconsfield Changeover yard at Warrenton 2013Hotazel to Kimberley upgrade, loco run round at Beaconsfield, Changeover yard at Warrenton 2013
Hotazel to Kimberley Double remaining single (283km) line sections. Electrify with 3k.V D.C OHTE, and provide CTC signalling 2022
Kimberley to De AarExtension of short Crossing Loops, doubling of OHTE, upgrade signalling and power supply, 164km track reinstatement to provide full double line 2019
De Aar to Cookhouse Extension of crossing loops New traction substations Eskom power supply 2021
Slide 113July 2009 Source: Transnet Group Planning
De Aar to Cookhouse Extension of crossing loops, New traction substations, Eskom power supply 2021
Cookhouse to Addo Extension of all short passing loops 2027
PE + Ngqura Full rationalisation of arrival and departure yards (Operational Simplification) 2017

Rail Development Plans
Eastern Cape and Central Port System – Long Term Plans
Sishen
Hotazel
Kimberley
Veertien Strome
Arlington
Bethlehem
Klerksdorp
Bloemfontein
Houtheuwel
2
Sishen
Hotazel
Kimberley
Veertien Strome
Arlington
Bethlehem
Klerksdorp
Bloemfontein
Houtheuwel
Manganese
Rosmead
Noupoort
Springfontein
LESOTHO
De Aar
utchinson
Belmont Maseru2
3
R d
Noupoort
Springfontein
LESOTHO
De Aar
Hutchinson
Belmont MaseruManganese
Containers
4
East London
Rosmead
Cookhouse
Queenstown
BlaneyBeaufort West
Alicedale
Ngqura
1
East London
Rosmead
Cookhouse
Queenstown
BlaneyBeaufort West
Alicedale
NgquraPort Elizabeth
gq
Location Intervention PP Motivation Needed byCookhouse to East London
Upgrade track axle load to 20t and improve geometry (gradients and curves) 3
Improve operational characteristics for Port Interconnectivity. 20201
Port Elizabeth
Ngqura
(g ) yKimberley to Bloemfontein
Maintain as operational alternative to connect Capecor and Hotazel traffic to Durban 2 Operational flexibility and capacity alternative 2025
Bloemfontein to Maseru
Maintain and develop in synchronization with PRASA development plans 3 Cross-border connection TBDDevelop as container corridor to GautengSubstations25kV AC Electrification and CTC Signaling Decision dependent upon Manganese volumes
1
2
3
Slide 114July 2009
Noupoort to Bloemfontein
Additional passing loopsGeneral realignment 1
as well as Container hub development in Ngqura. TBD4
Source: Transnet Group Planning

Rail Development Plans
Gauteng: Freight Ring Concept
Gauteng is at the centre of most regional and port connections in Southern AfricaGauteng is at the centre of most regional and port connections in Southern Africa
Flows are complex and there are no clear bypass routes
A freight ring can potentially -
l d fl f f hFacilitate uninterrupted flow of freight
Provide a key link between Hubs and Terminals
Provide dedicated freight routes segregated from congested PRASA routes.
Set a logical separation of electrification between 3kV DC and 25kV AC.The image cannot be displayed. Your computer may not have enough memory to open the image, or the image may have been corrupted. Restart your computer, and then open the file again. If the red x still appears, you may have to delete the image and then insert it again.
Zimbabwe TrafficThe image cannot be displayed. Your computer may not have enough memory to open the image, or the image may have been corrupted. Restart your computer,
and then open the file again. If the red x still appears, you may have to delete the image and then insert it again.
The Waterberg
The image cannot be displayed. Your computer may not have enough memory to open the image, or the image may have been corrupted. Restart your computer, and then open the file again. If the red x still appears, you may have to delete the image and then insert it again.
The Maputo Corridor
The image cannot be displayed. Your computer may not have enough memory to open the image, or the image may have been corrupted. Restart your computer, and then open the file again. If the red x still appears, you may have to delete the image and then insert it again.
Botswana Traffic
The image cannot be displayed. Your computer may not have enough memory to open the image, or the image may have been corrupted. Restart your computer, and then open the file again. If the red x still appears, you may have to delete the image and then insert it again.
Coal Line
Slide 115July 2009
The image cannot be displayed. Your computer may not have enough memory to open the image, or the image may have been corrupted. Restart your computer, and then open the file again. If the red x still appears, you may have to delete the image and then insert it again.
CapeCor and Central Ports
The image cannot be displayed. Your computer may not have enough memory to open the image, or the image may have been corrupted. Restart your computer, and then open the file again. If the red x still appears, you may have to delete the image and then insert it again.
Free State and Central Ports
The image cannot be displayed. Your computer may not have enough memory to open the image, or the image may have been corrupted. Restart your computer, and then open the file again. If the red x still appears, you may have to delete the image and then insert it again.
Natal Corridor
Source: Transnet Group Planning

Rail Development Plans
Gauteng Freight Ring: Finding a viable route
Northern Bypassb d bl
1
1
a. Cost but unavoidable
2
Western Bypassa. Cost
1
2
East-West through passa. Costb. Environmentalc. Lack of Transportation reserve
1
1
1
a. Cost b. EnvironmentalRoute perhaps not needed
2
Western Bypassa. Costb. Constructability: sink hole formationc. Topography: Gradients (Magaliesburg)d. Environmental
1 2
45
3
4
1
2 3
Key
Slide 116July 2009
Southern / Western Bypassa. Costb. Constructability: sink hole formationc. Topography: Tunnels requiredd. Gold Mining activity
South Eastern Bypassa. Cost
Options Eliminated
Potential solutions 2
1
Source: Transnet Group Planning

Rail Development Plans
Gauteng Freight Ring Concept
The eventual freight ring will not be closedThe eventual freight ring will not be closed on the western side because no feasible
route was found. Instead, a bypass further west connecting Rustenburg,
Swartruggens, Lichtenburg and Mafikeng is proposed but only if volumes justify the p p y j y
investment.
Slide 117July 2009 Source: Transnet Group Planning

Rail Development Plans
Gauteng Freight Ring and Central Core: Freight Ring
Location Intervention Needed byLocation Intervention Needed byPendoring to Rustenburg Double existing single track sections, 25kV and CTC 2027Pyramid South to Wildebeeshoek Double existing single track sections, 25kV and CTC 2027Freight Ring to Maputo Corridor) New single track chord from South to East 2015Baviaanspoort to Leeufontein Double existing single track sections, 3kV and CTC 2032Tweedracht to Kleinzonderhout Double existing single track sections, 3kV and CTC 2033Roodekoppies to Knoppiesfontein Double existing single track sections, 3kV and CTC 2025Ystervarkfontein to Katbosfontein Double existing single track sections, 3kV and CTC 2036Zestfontein to Cowles Dam Signal infill scheme to reduce headway to 8mins 2027Aurum - Rooivlei Signal infill scheme to reduce headway to 8mins 2037Rooivlei - Rietvallei Signal infill scheme to reduce headway to 8mins 2027
New double track Houtheuwel to Skansdam 3kV DC, CTC signalling 2029
Rustenburg - Pyramid 17 4 8 % 4 4 % 4 0 % 4 2 % 4 5 % 4 7 % 4 9 % 5 5 % 5 9 % 6 2 % 6 5 % 6 9 % 7 2 % 7 7 % 8 1 % 8 5 % 8 8 % 9 1 % 9 4 % 9 7 % 1 0 0 % 1 0 4 % 1 0 8 % 1 1 2 % 1 1 6 % 1 2 0 % 1 2 5 % 1 3 0 % 1 3 5 % 1 4 0 % 1 4 5 %
Pyramid - Greenview 49 3 8 % 3 5 % 2 9 % 3 0 % 3 3 % 3 4 % 3 5 % 3 9 % 4 2 % 4 4 % 4 6 % 4 8 % 5 1 % 5 4 % 5 7 % 6 1 % 6 3 % 6 6 % 6 9 % 7 3 % 7 6 % 8 0 % 8 4 % 8 8 % 9 3 % 9 7 % 1 0 3 % 1 0 8 % 1 1 4 % 1 2 0 % 1 2 6 %
Greenview - Donkerhoek 49 3 1 % 2 8 % 2 4 % 2 5 % 2 7 % 2 8 % 2 9 % 3 1 % 3 2 % 3 3 % 3 5 % 3 7 % 3 9 % 4 1 % 4 4 % 4 6 % 4 9 % 5 1 % 5 3 % 5 6 % 5 8 % 6 1 % 6 4 % 6 7 % 7 1 % 7 4 % 7 8 % 8 2 % 8 7 % 9 1 % 9 6 %
Donkerhoek - Tweedrag 72 2 1 % 1 9 % 1 6 % 1 7 % 1 8 % 1 9 % 2 0 % 2 1 % 2 2 % 2 3 % 2 4 % 2 5 % 2 7 % 2 8 % 3 0 % 3 2 % 3 3 % 3 5 % 3 6 % 3 8 % 4 0 % 4 2 % 4 4 % 4 6 % 4 8 % 5 1 % 5 3 % 5 6 % 5 9 % 6 2 % 6 6 %
Tweedrag - Kleinsonderhout 37 4 1 % 3 7 % 3 1 % 3 3 % 3 5 % 3 7 % 3 8 % 4 0 % 4 2 % 4 4 % 4 6 % 4 9 % 5 2 % 5 4 % 5 8 % 6 1 % 6 4 % 6 7 % 7 0 % 7 3 % 7 7 % 8 0 % 8 4 % 8 9 % 9 3 % 9 8 % 1 0 3 % 1 0 8 % 1 1 4 % 1 2 0 % 1 2 7 %
Rustenburg - Houtheuwel
Ops
Slo
ts
20
07
20
08
20
09
20
10
20
11
20
12
20
13
20
14
20
15
20
16
20
17
20
18
20
19
20
20
20
21
20
22
20
23
20
24
20
25
20
26
20
27
20
28
20
29
20
30
20
31
20
32
20
33
20
34
20
35
20
36
20
37
Kleinsonderhout - Roodekoppies 104 1 5 % 1 3 % 1 1 % 1 2 % 1 3 % 1 3 % 1 4 % 1 5 % 1 5 % 1 6 % 1 7 % 1 8 % 1 9 % 2 0 % 2 1 % 2 2 % 2 3 % 2 4 % 2 5 % 2 6 % 2 8 % 2 9 % 3 0 % 3 2 % 3 3 % 3 5 % 3 7 % 3 9 % 4 1 % 4 3 % 4 6 %
Roodekoppies - Knoppiesfontein 25 6 0 % 5 5 % 4 6 % 4 8 % 5 2 % 5 4 % 5 7 % 6 0 % 6 3 % 6 5 % 6 8 % 7 2 % 7 6 % 8 1 % 8 5 % 9 0 % 9 4 % 9 9 % 1 0 3 % 1 0 8 % 1 1 3 % 1 1 9 % 1 2 5 % 1 3 1 % 1 3 8 % 1 4 5 % 1 5 2 % 1 6 0 % 1 6 9 % 1 7 8 % 1 8 7 %
Knoppiesfontein - Ystervarkfontein 134 1 1 % 1 0 % 9 % 9 % 1 0 % 1 0 % 1 1 % 1 1 % 1 2 % 1 2 % 1 3 % 1 4 % 1 4 % 1 5 % 1 6 % 1 7 % 1 8 % 1 9 % 2 0 % 2 0 % 2 1 % 2 2 % 2 4 % 2 5 % 2 6 % 2 7 % 2 9 % 3 0 % 3 2 % 3 4 % 3 5 %
Ystervarkfontein - Katbosfontein 45 3 4 % 3 1 % 2 6 % 2 8 % 2 9 % 3 1 % 3 2 % 3 4 % 3 6 % 3 7 % 3 9 % 4 1 % 4 3 % 4 6 % 4 8 % 5 1 % 5 4 % 5 6 % 5 9 % 6 1 % 6 4 % 6 7 % 7 1 % 7 4 % 7 8 % 8 2 % 8 6 % 9 1 % 9 6 % 1 0 1 % 1 0 6 %
Katbosfontein - Zesfontein 62 2 4 % 2 2 % 1 9 % 2 0 % 2 1 % 2 2 % 2 3 % 2 4 % 2 5 % 2 6 % 2 8 % 2 9 % 3 1 % 3 3 % 3 5 % 3 7 % 3 8 % 4 0 % 4 2 % 4 4 % 4 6 % 4 8 % 5 1 % 5 3 % 5 6 % 5 9 % 6 2 % 6 5 % 6 8 % 7 2 % 7 6 %
Zesfontein - Cowles Dam 62 4 6 % 4 3 % 4 0 % 4 2 % 4 4 % 4 6 % 4 8 % 5 1 % 5 3 % 5 5 % 5 7 % 6 0 % 6 3 % 6 6 % 6 9 % 7 3 % 7 6 % 7 9 % 8 2 % 8 6 % 8 9 % 9 3 % 9 7 % 1 0 2 % 1 0 6 % 1 1 1 % 1 1 6 % 1 2 2 % 1 2 7 % 1 3 3 % 1 4 0 %
Cowles Dam - Aurum 267 1 1 % 1 0 % 9 % 9 % 1 0 % 1 1 % 1 1 % 1 2 % 1 2 % 1 3 % 1 3 % 1 4 % 1 4 % 1 5 % 1 6 % 1 7 % 1 7 % 1 8 % 1 9 % 1 9 % 2 0 % 2 1 % 2 2 % 2 3 % 2 4 % 2 5 % 2 6 % 2 8 % 2 9 % 3 0 % 3 2 %
Aurum - Withok 104 2 9 % 2 7 % 2 4 % 2 5 % 2 7 % 2 8 % 3 0 % 3 1 % 3 3 % 3 4 % 3 5 % 3 7 % 3 9 % 4 0 % 4 2 % 4 4 % 4 6 % 4 8 % 5 0 % 5 2 % 5 5 % 5 7 % 6 0 % 6 2 % 6 5 % 6 8 % 7 1 % 7 5 % 7 8 % 8 2 % 8 6 %
Withok - Rooivlei 104 2 6 % 2 4 % 2 2 % 2 3 % 2 4 % 2 5 % 2 6 % 2 8 % 2 9 % 3 0 % 3 2 % 3 3 % 3 5 % 3 6 % 3 8 % 4 0 % 4 2 % 4 4 % 4 5 % 4 7 % 4 9 % 5 2 % 5 4 % 5 6 % 5 9 % 6 2 % 6 5 % 6 8 % 7 1 % 7 5 % 7 8 %
Rooivlei - Rietvallei 62 4 3 % 4 0 % 3 6 % 3 8 % 4 1 % 4 2 % 4 4 % 4 7 % 4 9 % 5 0 % 5 3 % 5 5 % 5 8 % 6 1 % 6 4 % 6 7 % 7 0 % 7 3 % 7 6 % 7 9 % 8 2 % 8 6 % 9 0 % 9 4 % 9 8 % 1 0 3 % 1 0 8 % 1 1 3 % 1 1 9 % 1 2 4 % 1 3 0 %
Slide 118July 2009
Rietvallei - Roode 187 9 % 8 % 7 % 8 % 8 % 9 % 9 % 1 0 % 1 0 % 1 0 % 1 1 % 1 1 % 1 2 % 1 2 % 1 3 % 1 3 % 1 4 % 1 5 % 1 5 % 1 6 % 1 6 % 1 7 % 1 8 % 1 8 % 1 9 % 2 0 % 2 1 % 2 2 % 2 3 % 2 4 % 2 5 %
Roode - Skansdam 187 9 % 8 % 7 % 8 % 8 % 9 % 9 % 1 0 % 1 0 % 1 0 % 1 1 % 1 1 % 1 2 % 1 2 % 1 3 % 1 3 % 1 4 % 1 5 % 1 5 % 1 6 % 1 6 % 1 7 % 1 8 % 1 8 % 1 9 % 2 0 % 2 1 % 2 2 % 2 3 % 2 4 % 2 5 %
Skansdam - Meyerton 85 5 7 % 5 6 % 5 3 % 5 5 % 5 7 % 5 8 % 6 0 % 6 1 % 6 3 % 6 4 % 6 6 % 6 8 % 7 0 % 7 2 % 7 5 % 7 7 % 7 9 % 8 2 % 8 4 % 8 6 % 8 9 % 9 1 % 9 4 % 9 7 % 1 0 0 % 1 0 3 % 1 0 7 % 1 1 0 % 1 1 4 % 1 1 7 % 1 2 1 %
Meyerton - Duncanville 94 5 2 % 5 0 % 4 8 % 5 0 % 5 1 % 5 3 % 5 4 % 5 6 % 5 7 % 5 8 % 6 0 % 6 2 % 6 4 % 6 6 % 6 8 % 7 0 % 7 2 % 7 4 % 7 6 % 7 9 % 8 1 % 8 4 % 8 6 % 8 9 % 9 2 % 9 5 % 9 8 % 1 0 1 % 1 0 4 % 1 0 8 % 1 1 2 %
Duncanville - Leeuhof 104 1 8 % 1 6 % 1 4 % 1 5 % 1 6 % 1 7 % 1 8 % 1 9 % 1 9 % 2 0 % 2 1 % 2 2 % 2 3 % 2 4 % 2 5 % 2 7 % 2 8 % 2 9 % 3 0 % 3 1 % 3 3 % 3 4 % 3 5 % 3 7 % 3 8 % 4 0 % 4 2 % 4 4 % 4 6 % 4 8 % 5 0 %
Leeuhof - Kleigrond 72 6 5 % 6 3 % 6 1 % 6 2 % 6 5 % 6 6 % 6 8 % 7 0 % 7 2 % 7 3 % 7 5 % 7 7 % 8 0 % 8 2 % 8 5 % 8 8 % 9 0 % 9 2 % 9 5 % 9 8 % 1 0 0 % 1 0 3 % 1 0 7 % 1 1 0 % 1 1 3 % 1 1 6 % 1 2 0 % 1 2 4 % 1 2 8 % 1 3 2 % 1 3 6 %
Kleigrond - Houtheuwel 134 3 5 % 3 4 % 3 2 % 3 3 % 3 4 % 3 4 % 3 5 % 3 6 % 3 7 % 3 8 % 3 9 % 4 0 % 4 2 % 4 3 % 4 5 % 4 6 % 4 7 % 4 9 % 5 0 % 5 1 % 5 3 % 5 4 % 5 6 % 5 7 % 5 9 % 6 1 % 6 2 % 6 4 % 6 6 % 6 8 % 7 1 %
Source: Transnet Group Planning
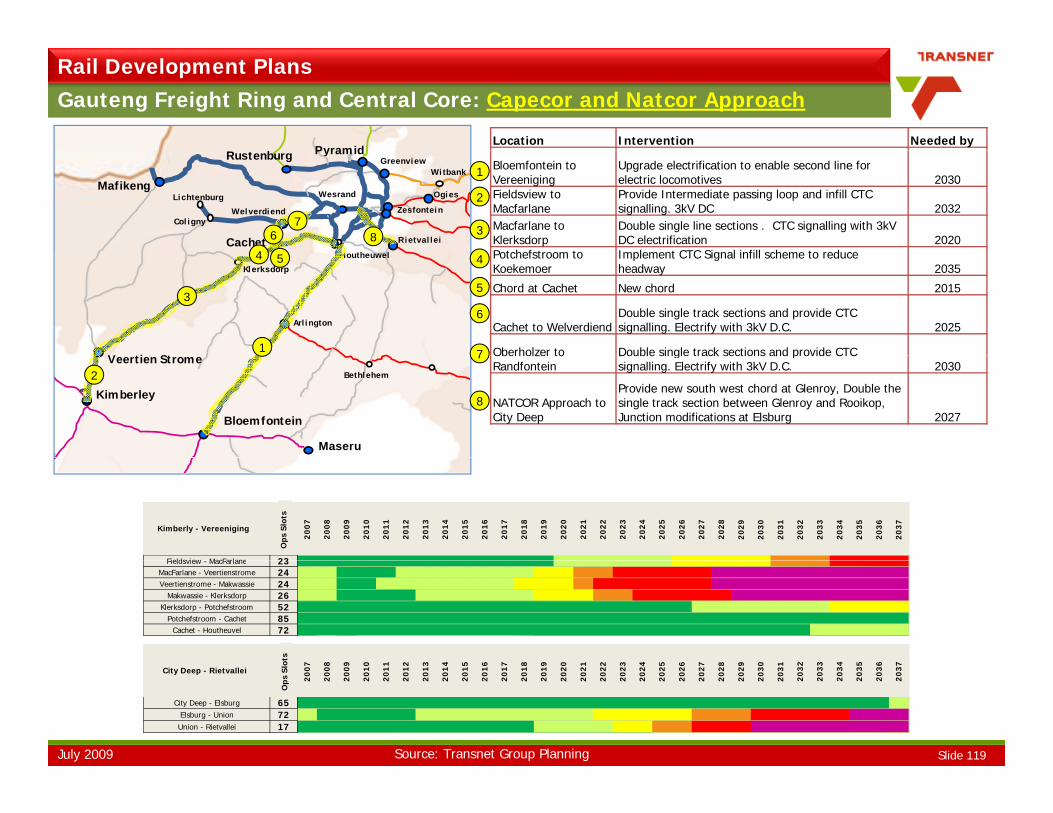
Rail Development PlansGauteng Freight Ring and Central Core: Capecor and Natcor Approach
PyramidLocation Intervention Needed by
Mafikeng
Rietvallei
Zesfontein
Ogies
Pyramid
CachetH th l
Lichtenburg
ColignyWelverdiend
Wesrand
Rustenburg GreenviewWitbank
Bloemfontein to Vereeniging
Upgrade electrification to enable second line for electric locomotives 2030
Fieldsview to Macfarlane
Provide Intermediate passing loop and infill CTC signalling. 3kV DC 2032
Macfarlane to Klerksdorp
Double single line sections . CTC signalling with 3kV DC electrification 2020
Potchefstroom to Implement CTC Signal infill scheme to reduce
2
1
3
4
67
8
V ti St
Arlington
Klerksdorp
Houtheuwel Potchefstroom to Koekemoer
Implement CTC Signal infill scheme to reduce headway 2035
Chord at Cachet New chord 2015
Cachet to WelverdiendDouble single track sections and provide CTC signalling. Electrify with 3kV D.C. 2025
Oberholzer to Double single track sections and provide CTC
3
1
4 4
5
5
6
7
Kimberley
Veertien StromeBethlehem
Bloemfontein
Maseru
Oberholzer to Randfontein
Double single track sections and provide CTC signalling. Electrify with 3kV D.C. 2030
NATCOR Approach to City Deep
Provide new south west chord at Glenroy, Double the single track section between Glenroy and Rooikop, Junction modifications at Elsburg 2027
2
7
8
Fieldsview MacFarlane 23
Kimberly - Vereeniging
Ops
Slo
ts
20
07
20
08
20
09
20
10
20
11
20
12
20
13
20
14
20
15
20
16
20
17
20
18
20
19
20
20
20
21
20
22
20
23
20
24
20
25
20
26
20
27
20
28
20
29
20
30
20
31
20
32
20
33
20
34
20
35
20
36
20
37
Fieldsview - MacFarlane 23 4 8 % 4 3 % 3 7 % 3 9 % 4 1 % 4 3 % 4 5 % 4 7 % 5 0 % 5 1 % 5 3 % 5 6 % 5 9 % 6 3 % 6 7 % 7 3 % 7 5 % 7 7 % 8 0 % 8 2 % 8 5 % 8 8 % 9 1 % 9 4 % 9 7 % 1 0 0 % 1 0 4 % 1 0 7 % 1 1 1 % 1 1 5 % 1 1 9 %
MacFarlane - Veertienstrome 24 6 9 % 6 2 % 5 1 % 5 4 % 5 8 % 6 0 % 6 3 % 6 6 % 7 0 % 7 2 % 7 6 % 8 0 % 8 4 % 9 0 % 9 6 % 1 0 2 % 1 0 7 % 1 1 1 % 1 1 5 % 1 2 0 % 1 2 5 % 1 3 0 % 1 3 6 % 1 4 2 % 1 4 8 % 1 5 4 % 1 6 2 % 1 6 9 % 1 7 7 % 1 8 5 % 1 9 4 %
Veertienstrome - Makwassie 24 7 2 % 6 4 % 5 3 % 5 6 % 6 0 % 6 3 % 6 5 % 6 9 % 7 2 % 7 5 % 7 8 % 8 2 % 8 7 % 9 3 % 9 9 % 1 0 6 % 1 1 0 % 1 1 4 % 1 1 9 % 1 2 3 % 1 2 8 % 1 3 4 % 1 4 0 % 1 4 6 % 1 5 2 % 1 5 9 % 1 6 6 % 1 7 3 % 1 8 1 % 1 9 0 % 1 9 9 %
Makwassie - Klerksdorp 26 6 8 % 6 1 % 5 1 % 5 4 % 5 7 % 6 0 % 6 2 % 6 5 % 6 9 % 7 1 % 7 4 % 7 8 % 8 3 % 8 8 % 9 3 % 1 0 0 % 1 0 4 % 1 0 8 % 1 1 2 % 1 1 7 % 1 2 1 % 1 2 6 % 1 3 2 % 1 3 7 % 1 4 3 % 1 4 9 % 1 5 6 % 1 6 3 % 1 7 1 % 1 7 9 % 1 8 7 %
Klerksdorp - Potchefstroom 52 3 5 % 3 1 % 2 6 % 2 7 % 2 9 % 3 0 % 3 2 % 3 3 % 3 5 % 3 6 % 3 8 % 4 0 % 4 2 % 4 4 % 4 7 % 5 0 % 5 2 % 5 4 % 5 7 % 5 9 % 6 1 % 6 4 % 6 7 % 6 9 % 7 2 % 7 5 % 7 9 % 8 2 % 8 6 % 9 0 % 9 4 %
Potchefstroom - Cachet 85 2 1 % 1 9 % 1 6 % 1 7 % 1 8 % 1 9 % 1 9 % 2 0 % 2 1 % 2 2 % 2 3 % 2 4 % 2 6 % 2 7 % 2 9 % 3 1 % 3 2 % 3 3 % 3 5 % 3 6 % 3 7 % 3 9 % 4 1 % 4 2 % 4 4 % 4 6 % 4 8 % 5 0 % 5 3 % 5 5 % 5 8 %
Cachet - Houtheuvel 72 2 7 % 2 4 % 2 0 % 2 1 % 2 3 % 2 4 % 2 5 % 2 6 % 2 7 % 2 8 % 2 9 % 3 1 % 3 2 % 3 4 % 3 7 % 3 9 % 4 0 % 4 2 % 4 4 % 4 5 % 4 7 % 4 9 % 5 1 % 5 3 % 5 6 % 5 8 % 6 1 % 6 3 % 6 6 % 6 9 % 7 2 %
ots
7 8 9 0 1 2 3 4 5 6 7 8 9 0 1 2 3 4 5 6 7 8 9 0 1 2 3 4 5 6 7
Slide 119July 2009
City Deep - Elsburg 65 1 6 % 1 5 % 1 1 % 1 2 % 1 3 % 1 3 % 1 4 % 1 5 % 1 6 % 1 6 % 1 7 % 1 8 % 1 9 % 2 1 % 2 2 % 2 3 % 2 5 % 2 6 % 2 8 % 3 0 % 3 2 % 3 4 % 3 6 % 3 9 % 4 1 % 4 4 % 4 7 % 5 1 % 5 4 % 5 8 % 6 2 %
Elsburg - Union 72 6 1 % 5 9 % 5 5 % 5 7 % 5 8 % 6 0 % 6 1 % 6 3 % 6 5 % 6 6 % 6 8 % 7 1 % 7 3 % 7 5 % 7 8 % 8 0 % 8 3 % 8 6 % 8 9 % 9 2 % 9 6 % 9 9 % 1 0 3 % 1 0 7 % 1 1 1 % 1 1 6 % 1 2 1 % 1 2 6 % 1 3 1 % 1 3 7 % 1 4 3 %
Union - Rietvallei 17 5 1 % 4 5 % 3 5 % 3 7 % 4 0 % 4 1 % 4 3 % 4 6 % 4 9 % 5 2 % 5 5 % 5 9 % 6 3 % 6 8 % 7 3 % 7 8 % 8 3 % 8 9 % 9 6 % 1 0 2 % 1 1 0 % 1 1 8 % 1 2 6 % 1 3 6 % 1 4 6 % 1 5 6 % 1 6 8 % 1 8 0 % 1 9 4 % 2 0 8 % 2 2 3 %
Source: Transnet Group Planning
City Deep - Rietvallei
Ops
Slo
20
07
20
08
20
09
20
10
20
11
20
12
20
13
20
14
20
15
20
16
20
17
20
18
20
19
20
20
20
21
20
22
20
23
20
24
20
25
20
26
20
27
20
28
20
29
20
30
20
31
20
32
20
33
20
34
20
35
20
36
20
37