railpassenger experienceof disruptionhandling
TRANSCRIPT

Rail Passenger Experience of Disruption Handling
Moving Britain Ahead
May 2021
Although this report was commissioned by the Department for Transport (DfT) the findings and recommendations are those of the authors and do not necessarily represent the views of the DfT The information or guidance in this document (including third party information products and services) is provided by DfT on an as is basis without any representation or endorsement made and without warranty of any kind whether express or implied
The Department for Transport has actively considered the needs of blind and partially sighted people in accessing this document The text will be made available in full on the Departmentrsquos website The text may be freely downloaded and translated by individuals or organisations for conversion into other accessible formats If you have other needs in this regard please contact the Department
Department for Transport Great Minster House 33 Horseferry Road London SW1P 4DR Telephone 0300 330 3000 General enquiries httpsformsdftgovuk Website wwwgovukdft
Crown copyright 2021
Copyright in the typographical arrangement rests with the Crown
You may re-use this information (not including logos or third-party material) free of charge in any format or medium under the terms of the Open Government Licence v30 To view this licence visit httpwwwnationalarchivesgovukdocopen-government-licenceversion3 or write to the Information Policy Team The National Archives Kew London TW9 4DU or e-mail psinationalarchivesgsigovuk
Where we have identified any third-party copyright information you will need to obtain permission from the copyright holders concerned
Rail Passenger Experience of Disruption Handling
February 2021
Contents
EXECUTIVE SUMMARY i
1 Introduction 8
Background 8
Objectives 8
2 Methodology 10
Introduction 10
Qualitative Methodology 10
Quantitative Methodology 12
3 Experiences of Past Delays and Handling of Disruption 13
Disruptions Experienced 13
Waiting During Disruption 23
Handling of the Disruption 29
4 Information During Disruption 33
Reception of Information 38
Additional Information during Disruption 47
Delivery Mechanism of Information 56
5 The Impact of Disruption 63
APPENDIX A Questionnaire
APPENDIX B Fieldwork Details
Behavioural and Sentimental Responses to Disruption 63
Compensation and Redress 67
Best in Class 69
Executive Summary
Introduction
In March 2019 the Department for Transport (DfT) commissioned research to explore passengersrsquo needs during times of unplanned rail disruptions The aim of the project was to explore the needs of rail passengers from across Great Britain when they experience unplanned delays and disruption on the rail network The project incorporated a two-staged approach consisting of qualitative (journey diaries pre-tasked discussion groups and depth interviews) and quantitative (a large scale self-completion survey of disrupted travellers) methods Overall 85 travellers contributed to the qualitative stage with a further 1790 passengers entering the survey
MAIN FINDINGS1
Waiting during disruption
Most passengers waited on the platform if they experienced disruption at their boarding station or the interchange station Very few passengers waited in a waiting room or shelter
Only 38 of passengers reported that the wait was comfortable with 62 saying their wait during disruption was uncomfortable
Passengers were more likely to feel comfortable if they waited on the train or in a cafeacute or waiting room The longer the delay at the boarding station the more uncomfortable it was perceived to be 78 of passengers who experienced a delay of 60 minutes or more said their wait was uncomfortable This compares to 57 of passengers who said their wait of less than 5 minutes was comfortable
Handling of the disruption
Handling of the disruption by the TOC was perceived as poor or very poor by 38 of passengers with only 22 thinking it was handled well Longer disruptions contributed to poor ratings as did cancellations
1 This section refers to the quantitative phase only Throughout the report findings from the qualitative stage are interwoven However findings from both stages are very similar across the different aspects tested
5
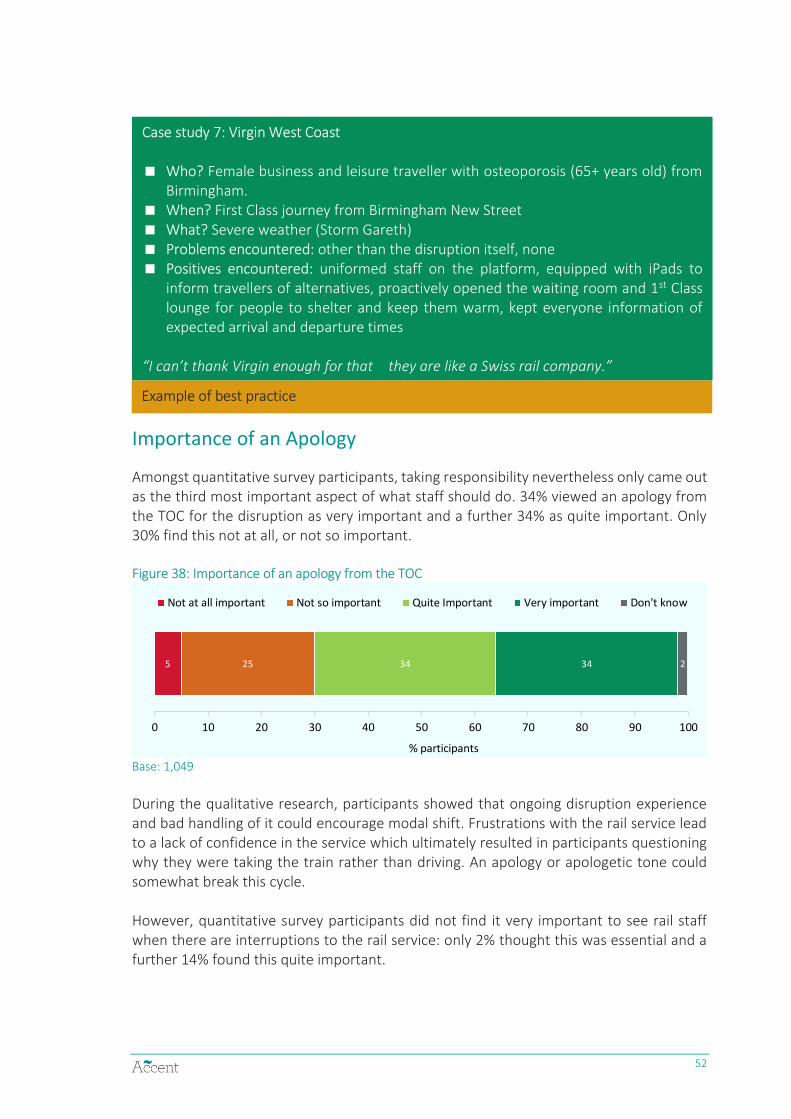
Overall the information given during the disruption was perceived as negative 95 gave negative comments (eg 26 insufficient 19 unclear 19 inadequate 15 no information given) and 42 gave positive comments (eg 13 clear 9 useful 8 informative)
45 rated the information provided as poor
or very poor 25 rated the information as good or very good for example reason given for the disruption (32) and the length of delay (17)
Reception of information
39 of passengers first noticed information about the disruption via a display at the station 18 via an announcement on the train and 16 via announcements at the station
Passengers said that apps and websites are relatively unimportant sources of information on disruptions just 13 first learned about the disruption through those means
About three quarters of passengers would like information to be disseminated every 0 to 5 minutes for a slow running service or for a disruption However this is dependent on the nature of the journey being made and the length of journey
Four fifths preferred that an announcement was made with very little or no information than having to wait until there was some information
Additional information required during disruption
Even if the disruption was very severe only 5 of passengers said they would abandon the journey
During severe disruptions the most required information was about connections or alternative routes as well as the cause of disruption
For both normal and severe disruptions participants most want lsquocorrectrsquo (30) and lsquoclearrsquo (25 for normal 23 for severe) information 61 prefer very detailed information on the disruption and 37 quite detailed information
80 said it was very important that the train company be honest even if that means saying they do not know what is happening 80 wanted additional information on causes of disruption with signal and points failures (71) engineering works (67) and knock-on delays (62) the most sought-after information
6
Across the groups and depths interviews commuters were the group that experienced most delays Although they were familiar with alternatives they still wanted to be advised of what to do in case of a disruption
Even though participants in the qualitative stage showed different behaviours in journey planning at the point of disruption information needs are very similar In addition participants with particular needs required much of the same information but reported that they need more time to actionprocess
Delivery mechanism of information
During disruptions most seek information through apps or websites and half use more than one source 10 didnrsquot use any
There was a general distrust in information sources
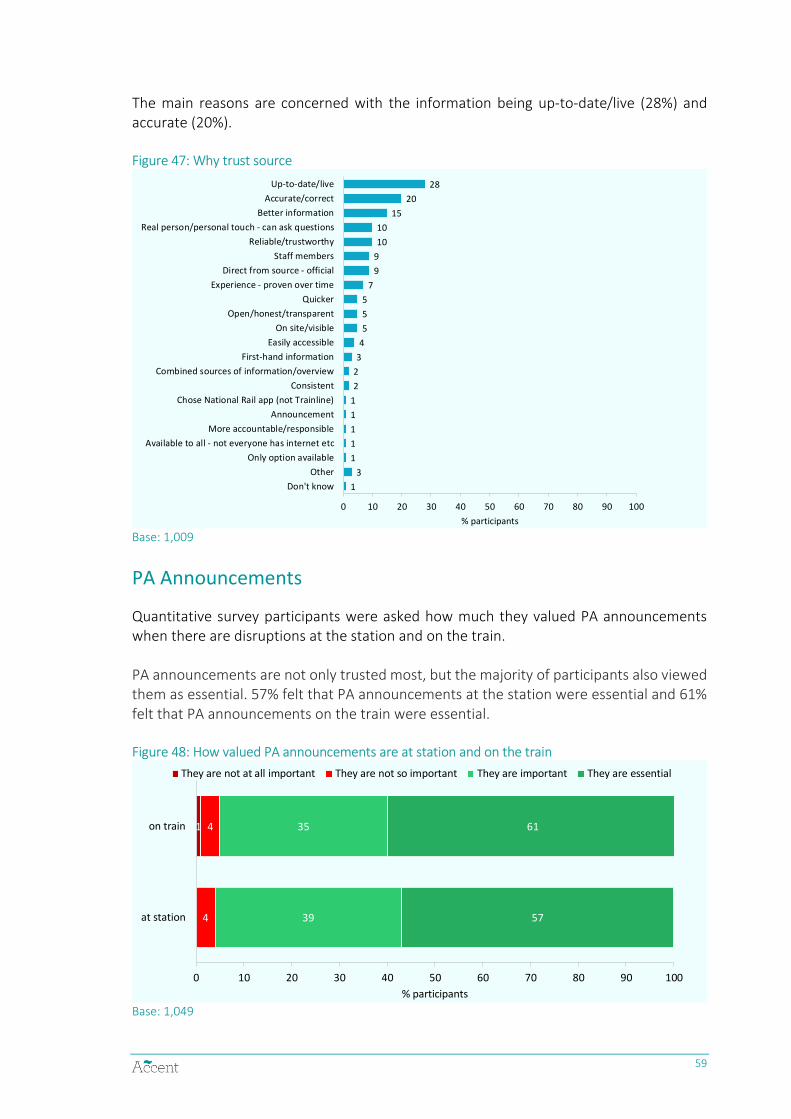
PA announcements were the most trusted sources of information and they were seen as essential by more than half the participants
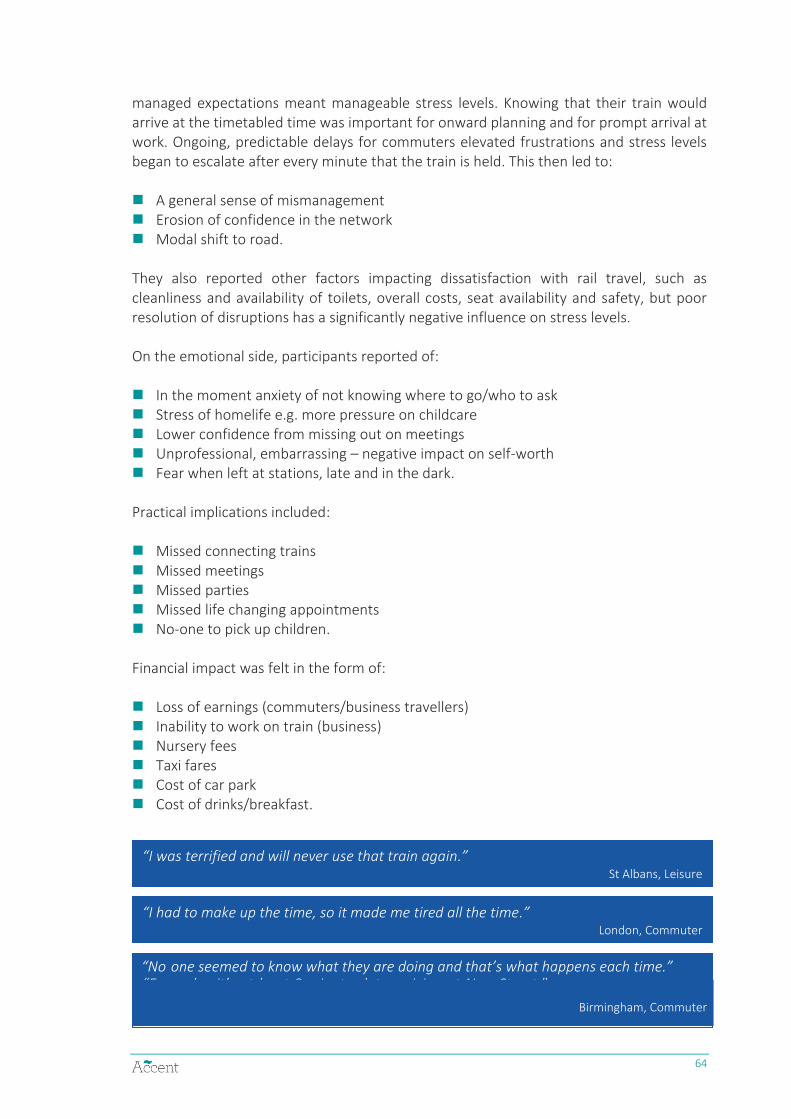
Behavioural and sentimental responses to disruption
33 cited emotional impacts 48 practical impacts and 18 financial impacts from disruption
The main impacts were stress with respect to work (55) arriving home late (51) and missed meetings (32)
Leisure travellers were often unfamiliar with routes This meant that disruptions often unsettled them and resulted in stress around missing events arriving in the dark and personal safety
7
1 Introduction
Background
How TOCs handle delays is of paramount importance to rail passengers so much so that according to the National Rail Passenger Survey (NRPS)2 it has the biggest impact on overall passenger dissatisfaction
NRPS data shows that in spring 2019 just 40 of delayed passenger journeys were rated as satisfactory for the way in which Train Operating Companies (TOCs) dealt with delays when they occurred There are large variations in the performance of TOCs during disruption as well as geographic variations in passenger satisfaction when things go wrong
However the last time any tailored research was undertaken on this subject was in 2014 when the Office of Rail and Road (ORR) commissioned Transport Focus to undertake research into passengersrsquo experiences of information handling during delays and disruption Transport Focus concluded that improvements were not being seen by passengers in the availability of information during delays and disruption The most important information for delayed passengers was understanding the impact of a disruption on their journey
This work was the last time a significant TOC wide assessment was conducted on this subject (although the ORRrsquos annual Measuring Up report analyses some aspects of the communication between passengers and TOCs)
When continued significant delays occur on the rail network understanding how best to handle disruption is paramount As such the DfT commissioned Accent to undertake research to explore passengersrsquo needs during times of unplanned rail disruption and how Train Operating Companies (TOCs) communicate with passengers during periods of delay on the rail network
The aim of the project was to explore the needs of rail passengers from across Great Britain when they experienced delays and disruption on the rail network The project captured passengersrsquo real-time experience of unplanned disruption to inform rail policy
Objectives
The aim of the research was to explore the needs of rail passengers from across Great Britain when they experience unplanned delays and disruption on the rail network The project captured passengersrsquo real-time experience of unplanned disruption
The objectives for the overall study were
2 The NRPS surveys more than 50000 passengers each year to give a network-wide picture of rail passengersrsquo satisfaction with rail travel
8
To explore perceptions of how TOCs handled recent periods of severe disruption especially the wintery weather in March 2018 and the changes to timetabling in May 2018
To capture any examples of best practice the industry could learn from when faced with handling rail disruption
To explore what passengersrsquo expectations are in terms of customer service delivery and information provision when delays occur
To understand the different sources of information passengers access at different journey stages and which of these information sources they trust most
To provide a clear and detailed recommendation as to the most appropriate actions the industry can take to meet the needs of rail passengers when they are delayed
To recommend any messaging approaches related to disruption that passengers find more or less informative as well as how the tone and timing of messages impact on different groups of passengers
9
2 Methodology
Introduction
The approach was two-staged
Qualitative journey diaries pre-tasked discussion groups and depth interviews
Quantitative a large scale self-completion survey of travellers during a disrupted rail journey or who had recently experienced a disruption
Figure 1 Research Approach
Qualitative Methodology
As one of the critical elements of this research was to understand the emotional consequence of any journey disruption and the specific information and messaging that was required at a particular journey moment a real-time methodology was adopted The LiveMinds mobile app was used by participants to record their experience of rail journey disruptions as they happened
Eighty-five passengers were recruited to use the app for three weeks prior to attending a discussion group The sample was chosen to ensure that a range of journeys were captured and
to optimise the chance of picking up journey disruptions Through the app simple questions relating to the journey and the disruption experience (where they look for information helpfulness of staff extent of TOC ownership) were asked as well as questions around information needs and how information needed to be delivered at specific pinch points
10
Following this Accent moderated eight two-hour discussion groups and eight face-to-face depth interviews with the 85 participants The face-to-face forum allowed for interrogations of the journey data and experiences collected in the three-week period via the app The groups took place in four different locations London Birmingham Manchester and St Albans Attendance was broken down by journey type (commuter business leisure) and distance and included participants who had experienced severe disruptions3 The eight in-home depth interviews covered customers with particular needs when travelling and took 45 minutes each They took place in the same cities as the discussion groups
A variety of techniques were used to dissect customersrsquo needs in both the groups and the depth interviews Key topics for both methods were their rail journey disruption experiences (eg waiting during disruptions information needs and information received) and best in class service models
Demographics of Qualitative Stage
Overall 85 travellers contributed to the qualitative stage 77 of these participated in discussion groups across four different locations and eight participants provided feedback in the form of face-to-face depth interviews
There was a mix of gender for all groups and the depths The groups were structured by customer type journey length and TOCs Figure 2 shows the structure of the discussion groups The groups took place between 11 and 19 March 2019
Figure 2 Qualitative fieldwork plan
3 For a fieldwork schedule of the qualitative stage see Figure 2
11
Quantitative Methodology
Survey Recruitment
Passengers were invited to take part through postcards distributed at stations The sampling focused on eleven stations where there was a relatively high likelihood of some disruptions such as London termini Birmingham New Street Manchester Piccadilly
Following a pilot at London Liverpool Street and London Victoria on 11 June 2019 the main stage took place between 2 July and 12 July 2019
Response Rate and Questionnaire Length
In total 1790 entered the survey equating to 16 of the cards handed out 172 were out of scope (because they had not experienced any delays) Of the 1618 in scope 1049 (65) completed and 569 did not A paper version of the questionnaire is attached as Appendix A
Demographics of Quantitative Sample
Completion of the survey link in the 11040 postcards handed out during quantitative fieldwork was left to fall out naturally There were no quotas and data has not been weighted
Overall the sample was made up of 52 male and 46 female participants (2 preferred not to answer this question) 79 of participants did not have a disability 7 had a physical or mental disability and 7 had mental health issues or a social disability 37 of participants were between 16 and 35 44 were between 36 and 55 and 18 were 56 or older
Our sample is comparable to the 2019 National Travel Survey (NTS) figures for rail users The NTS shows that males made slightly more rail trips than females in 2019 (24 compared to 21) and that users with mobility difficulties travelled less than those without and were particularly less likely to use rail On average they made 5 times fewer rail trips In addition the age spread is in line with the NTS figures with most rail trips being made by people aged between 20 and 50 Males made slightly more rail trips than females in 2019 (24 compared to 21) Users with mobility difficulties travelled less than those without and were particularly less likely to use rail On average they made 50 times fewer rail trips
12
3 Experiences of Past Delays and Handling of Disruption
Disruptions Experienced
Amongst quantitative survey participants the majority of travellers had experienced at least one disruption of 5-19 minutes (71) in the past four weeks4 The second most frequent disruption were continued short delays of up to 5 minutes (67) followed by a disruption of 20-60 minutes which half the participants experienced Under a fifth (18) experienced a disruption of over 60 minutes
Figure 3 Disruptions experienced in the past four weeks
18
50
67
71
0 10 20 30 40 50 60 70 80 90 100
A disruption of over 60 minutes
A disruption of 20 minutes-60 minutes
Continued short delays of up to 5 minutes toregular journeys
A disruption of 5-19 minutes
participants
Base 1049 more than one answer could be given so percentages add up to more than 100
Commuter journeys were significantly more often affected by delays than leisure journeys (except disruptions of 60 minutes or over) It is perhaps not surprising therefore that participants of 65 years or older were significantly less likely to have experienced delays than younger participants
4 Half the sample experienced a disruption in the past 24 hours another 31 experienced one in the last 2 to 6 days and the remaining 19 experienced the last disruption in the past one to four weeks
13
Figure 4 Delays experienced by age of participant
Base 388 (16-35) 464 (36-55) 127 (56-64) 59 (65+) more than one answer could be given so percentages add up to more than 100
Most Recent Disrupted Rail Journey
As a large proportion of quantitative survey participants had experienced more than one disruption Participants were asked to respond on the basis of their most recent disruption with 39 of passengers experiencing a disruption of 5-19 minutes 31 experienced continued delays of up to 5 minutes to regular journey 23 experienced a disruption of 20-60 minutes and 7 of participants said their disruption lasted over 60 minutes
To put into perspective the reasons for journey disruptions we asked about the nature of the most recent disruption experienced the length of the disruption and some other key aspects of the disruption For most of the remainder of the questionnaire participants were asked to focus on the most recent disrupted journey
For half of the sample the most recent disruption was experienced on that day or the day before 31 experienced a disruption to their journey within 2-6 days of completing the survey 14 within the past 2 weeks and 4 experienced a disruption between 3 and 4 weeks before completing the survey
In the qualitative stage participants spoke of recent improvements to the number of disruptions they experience However they felt that further improvements were needed still There was a sense that disruptions had settled from March-May 2018 when the timetable changed but there was still a considerable way to go
14
ndash
-
ldquoIt was complete and absolute chaos day after dayrdquo St Albans Depth interview
ldquoThe difference is that you donrsquot travel to the station expecting a delay there might be one but you are not expecting itrdquo
London Commuter
Case study 1 Thameslink
Who Female businesses traveller (45 64 years old) from Borehamwood When Uses train three times a week to go from Borehamwood to London St
Pancras What Ongoing timetable issues Problems encountered Delayed and cancelled trains inconsistency in information
(across app platform and station) dismissive staff continually late for work or late home)
Positives encountered Hot chocolate sachet
It was reported by some that in March-May 2018 they experienced disruptions every day on every service This coincided with a period of significant disruption on the rail network caused mainly by the weather due to the ldquoBeast from the Eastrdquo and the timetable changes in May 2018 During this time some passengers told us that information provision was very poor and staff were ill informed and nervous Passengers reported that they made choices about travelling by rail and often worked from home more or took alternative modes of transport to get to the office It had a significant impact on life and work for the participants
Although the level of disruption may have calmed down no consistent difference was perceived in the communications when there were disruptions During the fieldwork qualitative participants felt that disruptions still occurred but were less frequent Information provision was still perceived as poor and staff were still perceived to lack information resulting in continued lack of confidence in the services from passengersrsquo side
Purpose and Outcome of the Journey
Amongst quantitative survey participants the main purpose of the train journey of the most recently disrupted journey was commuting (64) followed by business (20) Leisure journeys formed the smallest purpose for travelling (13)
Looking at different age groups those aged 16-35 36-55 and 56-64 were significantly more likely to have experienced disruptions when commuting (72 68 and 51 respectively) Those travelling for business were significantly more likely to be 36-55 (23) or 56-64 (26) whilst almost 3 in 5 of the 65+ year old participants travelled for leisure
15
Figure 5 Purpose of disrupted journey
64
72
68
51
15
20
14
23
26
12
13
12
7
20
58
3
2
2
3
15
0 10 20 30 40 50 60 70 80 90 100
Total
16 to 35
36 to 55
56 to 64
65+
participants
Commuting Business Leisure Other
Base 1049 (total) 59 (65+) 127 (56-64) 464 (36-55) 388 (16-35)
In most cases the disruption did not result in a cancellation of the train (77) However 55 of disruptions caused by weather or seasonal factors5 were cancelled and 37 of journeys where problems with the train had caused disruptions were cancelled Service issues and when the disruption remained unexplained caused the small proportion of cancellations as Figure 6 shows
Figure 6 Proportion of cancellations by disruption cause
10
11
32
33
35
37
55
0 10 20 30 40 50 60 70 80 90 100
Service issues
No reason given
Engineering works
Infrastructure
External factors
Problem with train
Weatherseasonal factors
participants
Base 11 (weather) 120 (problem) 48 (external factors) 227 (infrastructure) 25 (engineering works) 283 (No reasons) 161 (service issues)
Cancellations had an impact on the satisfaction with how the individual TOCs handled the disruption 49 of participants who experienced a cancelled train rated the TOC experience of disruption as poor or very poor
5 Very low base n=11
16
Figure 7 Satisfaction with handling of disruption
26
15
23
23
29
34
13
17
4
5
4
6
0 10 20 30 40 50 60 70 80 90 100
Cancelled train
Total
participants
Very poorly Poorly Neither Well Very well Dont knowNo opinion
Base 1049 (total) 245 (cancelled train)
Nature of Disruption
Participants in the qualitative stage reported of a wide range of disruptions
Long Delays Overcrowding No First-Class carriages Slow running No seating Change of platform Ongoing small delays Short forming Cancellations Unexpected stop Changes to timetable
Regardless of the type of disruption qualitative participants wanted to feel in control and that they had choices to allow them to change their journey plans They showed more tolerance for disruptions that are lsquoout of Operator controlrsquo such as severe weather events powerlines suicide or trespassers and vandalism Operational issues such as staff shortagesno train driver leaves on the line last minute platform changes and train congestion6 received less tolerance as they were considered avoidable
In the LiveMinds app exercises participants discussed unintended consequences of disruptions such as extra childcare costs after missing nursery pick-up disagreements at home as spouses are waiting at the station work reputation eg continually being late for work missing out on work (missing an audition and therefore losing a part) missing social engagements such as a family party and losing property because of rushing through a station
Quantitative survey participants reported that when experiencing disruptions just under a third were not given a reason for their disruption (27) and of those disruptions a reason was given for problems with the infrastructure (22) and service issues (15) were the most common followed by problems with the train (11)
6 Other mentions here include wrong type of snow lack of foresight eg train delayed immediately after leaving a station giving people no chance for alternative and replacement bus services that donrsquot offer enough capacity
17
Figure 8 Reasons for most recent disruption
8
8
1
2
5
11
15
22
27
0 10 20 30 40 50 60 70 80 90 100
Dont knowremember
Other
Weatherseasonal factors
Engineering works
External factors
Problem with the train
Service issues
Infrastructure
No reason given
participants
Base 1049
The quantitative stage showed that problems with the train were reported significantly more often in journeys that were more than six minutes delayed with 20 reported problems causing a delay of 21-30 minutes Similarly infrastructure problems were reported significantly more often when journeys were delayed for more than 11 minutes with over half of reported problems causing a delay of more than 60 minutes The top three reasons for disruptions per delay length were
0-5 minutes delay 11-20 minutes 31-60 minutes No reason given (55) No reason given (22) Infrastructure (31) Service issues (17) Infrastructure (21) Other (15) Donrsquot know (13) Service issues (18) No reason given (14)
6-10 minutes 21-30 minutes 60+ minutes No reason given (34) Infrastructure (28) Infrastructure (58) Service issues (22) Train problems (22) Other (14) Train problems (11) No reason given (16) Train problems (11)
Base 0-5 minutes 160 6-10 minutes 250 11-20 minutes 302 21-30 minutes 155 31-60 minutes 118 60+ minutes 64
In contrast to this for over half of delays of less than five minutes no reason was given for the delay This dropped down to 34 for journeys of 6-10 minutes and to 22 for journeys delayed by between 11 and 20 minutes These differences were significantly different
Delay Length
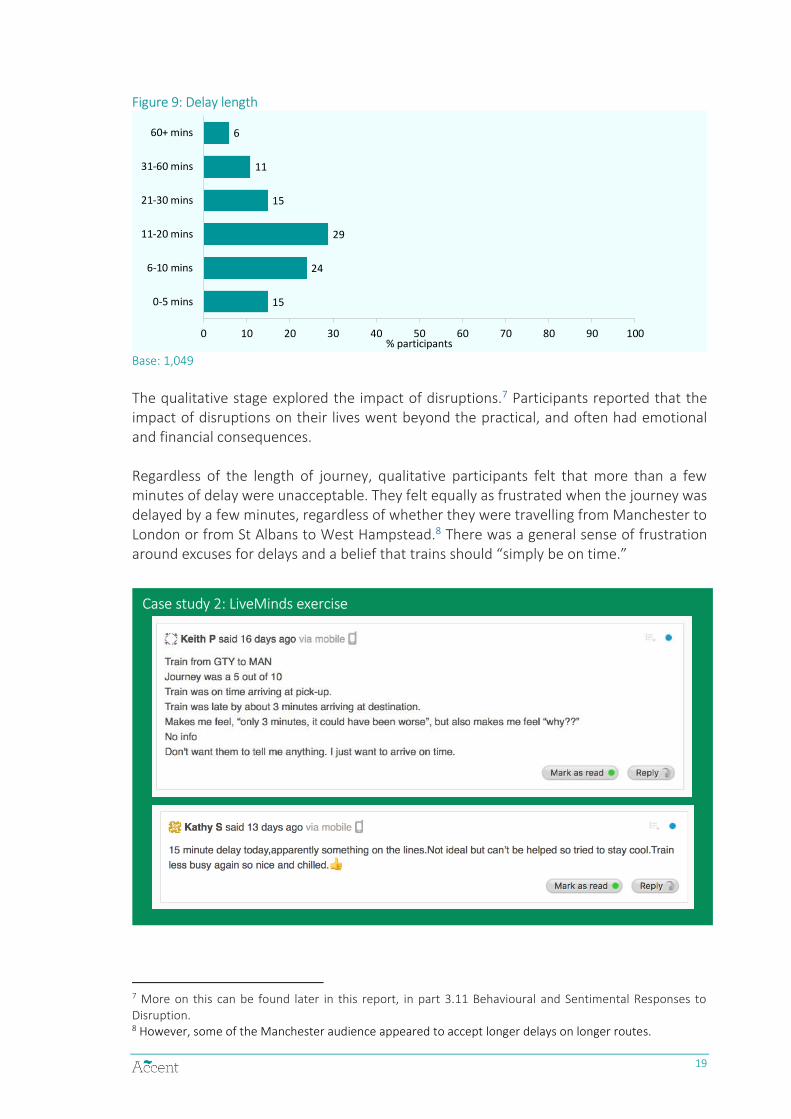
The average length of delay experienced by quantitative survey participants was 24 minutes The distribution of delay length is shown below
18
Figure 9 Delay length
15
24
29
15
11
6
0 10 20 30 40 50 60 70 80 90 100
0-5 mins
6-10 mins
11-20 mins
21-30 mins
31-60 mins
60+ mins
participants
Base 1049
The qualitative stage explored the impact of disruptions7 Participants reported that the impact of disruptions on their lives went beyond the practical and often had emotional and financial consequences
Regardless of the length of journey qualitative participants felt that more than a few minutes of delay were unacceptable They felt equally as frustrated when the journey was delayed by a few minutes regardless of whether they were travelling from Manchester to London or from St Albans to West Hampstead8 There was a general sense of frustration around excuses for delays and a belief that trains should ldquosimply be on timerdquo
Case study 2 LiveMinds exercise
7 More on this can be found later in this report in part 311 Behavioural and Sentimental Responses to Disruption 8 However some of the Manchester audience appeared to accept longer delays on longer routes
19
20
Expected Journey Length
Asking quantitative survey participants about the most recent disruption experienced the scheduled journey time did not have a significant impact on length of the delay This reflected to a large extent the fact that the majority of journeys with disruption experiences were commuting journeys Figure 10 shows the distribution of scheduled journey length Figure 10 Scheduled journey length
2
5
22
18
31
22
0 10 20 30 40 50 60 70 80 90 100
0-5 mins
6-10 mins
11-20 mins
21-30 mins
31-60 mins
60+ mins
participants
Base 1049
Table 1 shows a matrix of delay length by scheduled journey length for quantitative participants This uses shading to indicate the highest proportions The most frequent delay length of 11-20 minutes occurred most often across all scheduled journey times Table 1 Matrix of length of delay by scheduled journey length
Length of delay
0-5 mins 6-10 mins 11-20 mins 21-30 mins 31-60 mins 60+ mins
sch
ed
ule
d jo
urn
ey
len
gth
0-5 mins 1 0
6-10 mins 1 1 2 1
11-20 mins 4 6 6 3 2 1
21-30 mins 3 4 6 3 2 1
31-60 mins 4 8 9 5 4 1
60+ mins 2 4 6 4 3 3
Base 1049 = less than 05
Journeys of a scheduled length of 60+ minutes saw the highest proportion of delays that lasted 60 minutes or longer Delays for shorter journeys were generally shorter Qualitative stage participants reported that they built in extra time for travelling in order to avoid being caught out due to disruptions This then often had an impact on their personal lives and personal value of time as it was often seen as missing an opportunity of doing other things Some participants reported that a steady erosion of confidence in disruption management meant that they were getting earlier trains to ensure they arrived
on time This then resulted in a re-evaluation of their value of time as loss of personal time Opportunity cost and financial implications were also considered when making a decision regarding train travel Participants reported that they traded in their personal time when experiencing delays travelling for example
Getting the earlier train to work everyday Setting off early from work for specific leisure events Travelling the night before for to get to the airportparty Leaving two hours to get to a meeting
ldquoIrsquom losing an extra hour every dayrdquo Manchester Commuter
ldquoIf I have to get somewhere that takes an hour ndash Irsquoll always take two hours and thatrsquos an hour I could be workingrdquo
St Albans Business
When Passengers First Heard of Disruption
The quantitative survey showed that disruptions were most likely to occur at the boarding station (67) followed by on the train (41) and at another station along the route (10) Only 7 of survey participants had a delay at an interchange station
Figure 11 Where disruption occurred
67
41
7
10
2
0 10 20 30 40 50 60 70 80 90 100
At the boarding station
On the train
At an interchange station
At another station along the routejourney
Other
participants
Base 1049
Commuting journeys were significantly more likely to be delayed on the train than leisure journeys (45 vs 31)
A delay whilst on the train was also experienced significantly more often when the nature of the disruption was a service issue (58) than when it was a problem with the train (43) external factors (32) or when no reason was given (39)
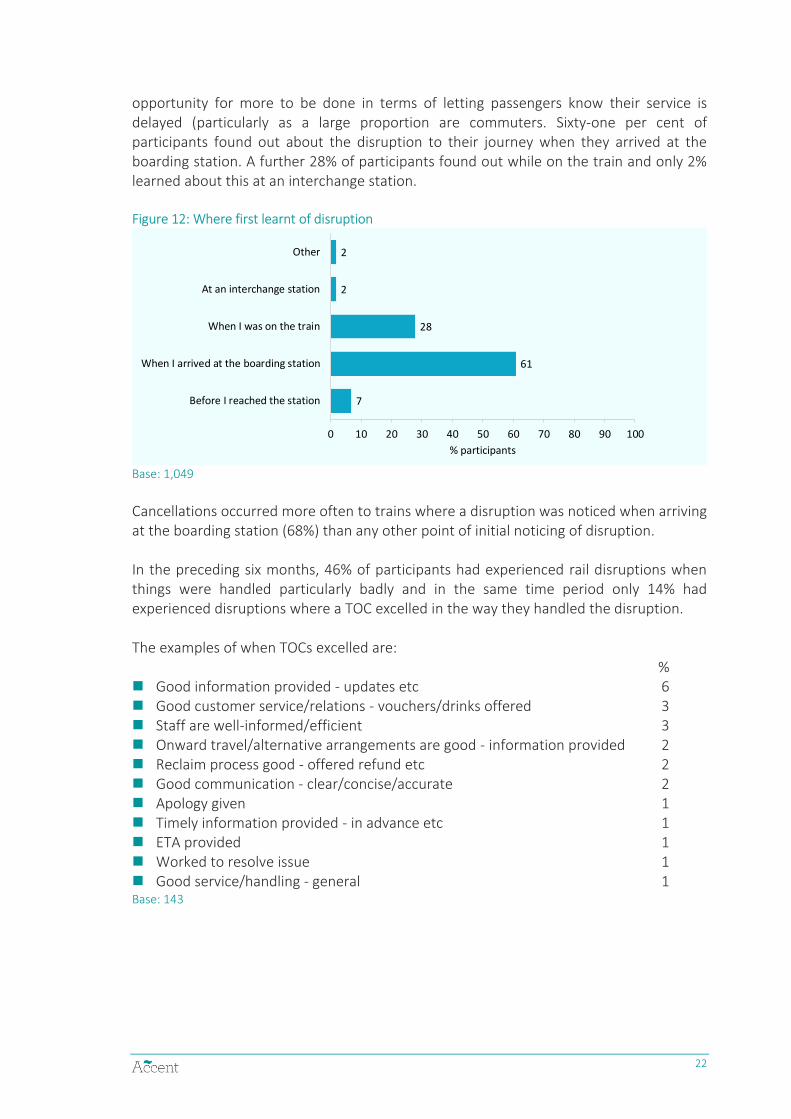
Only 7 of participants learned about the disruption to their journey before they reached the station With 67 of delays occurring are the boarding station there is clearly an
21
opportunity for more to be done in terms of letting passengers know their service is delayed (particularly as a large proportion are commuters Sixty-one per cent of participants found out about the disruption to their journey when they arrived at the boarding station A further 28 of participants found out while on the train and only 2 learned about this at an interchange station
Figure 12 Where first learnt of disruption
7
61
28
2
2
0 10 20 30 40 50 60 70 80 90 100
Before I reached the station
When I arrived at the boarding station
When I was on the train
At an interchange station
Other
participants
Base 1049
Cancellations occurred more often to trains where a disruption was noticed when arriving at the boarding station (68) than any other point of initial noticing of disruption
In the preceding six months 46 of participants had experienced rail disruptions when things were handled particularly badly and in the same time period only 14 had experienced disruptions where a TOC excelled in the way they handled the disruption
The examples of when TOCs excelled are
Good information provided - updates etc 6 Good customer servicerelations - vouchersdrinks offered 3 Staff are well-informedefficient 3 Onward travelalternative arrangements are good - information provided 2 Reclaim process good - offered refund etc 2 Good communication - clearconciseaccurate 2 Apology given 1 Timely information provided - in advance etc 1 ETA provided 1 Worked to resolve issue 1 Good servicehandling - general 1 Base 143
22
Summary9
Most participants experienced more than one disruption over the past month The most recent disrupted rail journey was typically a commuting journey (64) For 23 of reported disruptions the train was cancelled and the satisfaction with how the disruption was handled was much worse when there was a cancellation compared to delays For 27 of the disruptions no reasons were given for the disruption with this occurring more often for shorter delays Infrastructure (22) and service issues (15) were the main stated c auses of disruptions The scheduled journey time did not have a significant impact on length of the delay The most frequent delay length of 11 -20 minutes occurred most often across all scheduled journey times
Disruptions were most likely to occur at the boarding station (67) followed by on
the train (41) and at another station along the route (10) 61 first learnt about
the disruption when they arrived at the boarding station 28 while on the train and
just 7 before they arrived at the station
Waiting During Disruption
Participants were asked to think about how and where they spend the time during the disruption to their journey They were asked how they felt when they first learnt of the disruption and shown a list of potential emotions Amongst quantitative survey participants disruptions caused a mix of emotions though unsurprisingly negative emotions occurred more often than neutral or positive emotions
9 This and subsequent summaries are focusing on the quantitative findings only
23
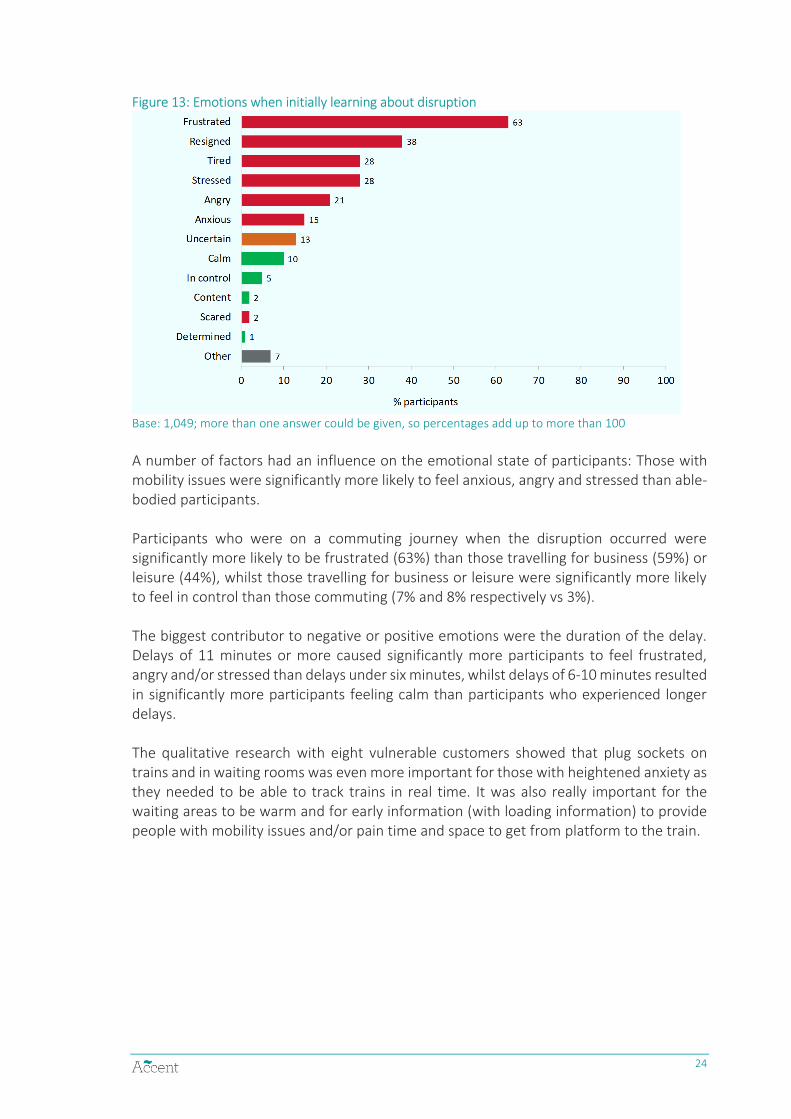
Figure 13 Emotions when initially learning about disruption
Base 1049 more than one answer could be given so percentages add up to more than 100
A number of factors had an influence on the emotional state of participants Those with mobility issues were significantly more likely to feel anxious angry and stressed than able-bodied participants
Participants who were on a commuting journey when the disruption occurred were significantly more likely to be frustrated (63) than those travelling for business (59) or leisure (44) whilst those travelling for business or leisure were significantly more likely to feel in control than those commuting (7 and 8 respectively vs 3)
The biggest contributor to negative or positive emotions were the duration of the delay Delays of 11 minutes or more caused significantly more participants to feel frustrated angry andor stressed than delays under six minutes whilst delays of 6-10 minutes resulted in significantly more participants feeling calm than participants who experienced longer delays
The qualitative research with eight vulnerable customers showed that plug sockets on trains and in waiting rooms was even more important for those with heightened anxiety as they needed to be able to track trains in real time It was also really important for the waiting areas to be warm and for early information (with loading information) to provide people with mobility issues andor pain time and space to get from platform to the train
24
-
-
-
- ndash
ndash
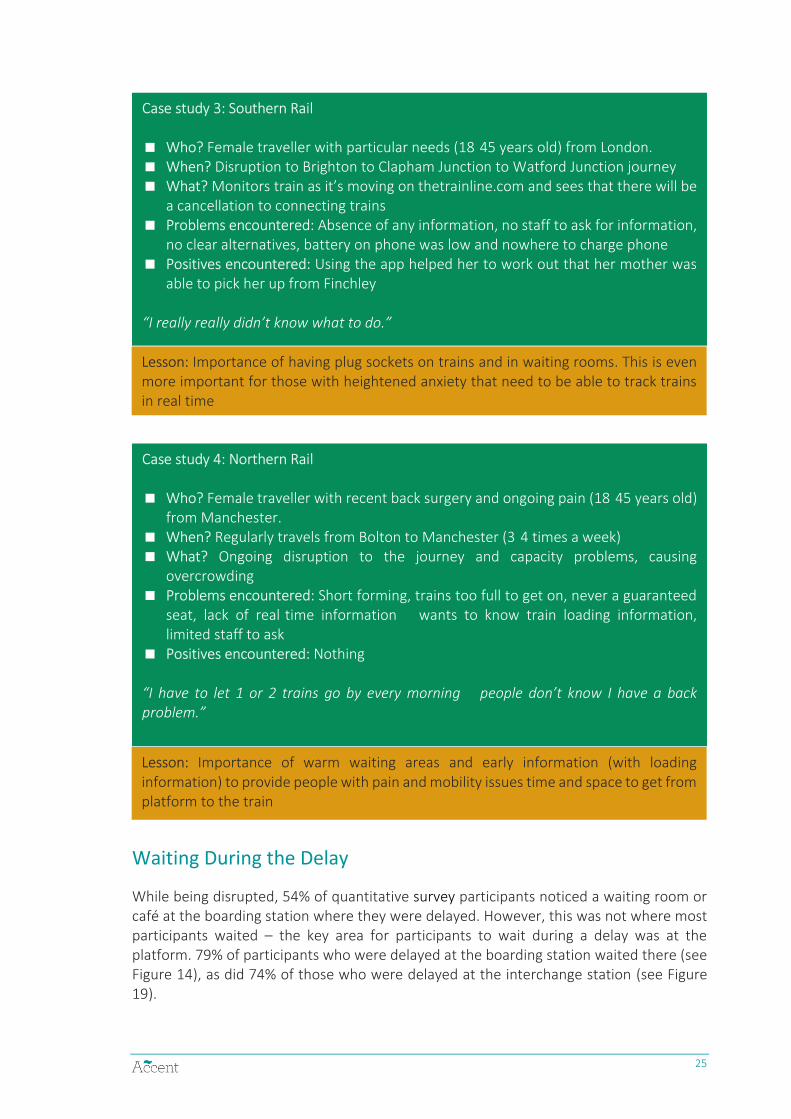
Case study 3 Southern Rail
Who Female traveller with particular needs (18 45 years old) from London When Disruption to Brighton to Clapham Junction to Watford Junction journey What Monitors train as itrsquos moving on thetrainlinecom and sees that there will be
a cancellation to connecting trains Problems encountered Absence of any information no staff to ask for information
no clear alternatives battery on phone was low and nowhere to charge phone Positives encountered Using the app helped her to work out that her mother was
able to pick her up from Finchley
ldquoI really really didnrsquot know what to dordquo
Lesson Importance of having plug sockets on trains and in waiting rooms This is even more important for those with heightened anxiety that need to be able to track trains in real time
Case study 4 Northern Rail
Who Female traveller with recent back surgery and ongoing pain (18 45 years old) from Manchester
When Regularly travels from Bolton to Manchester (3 4 times a week) What Ongoing disruption to the journey and capacity problems causing
overcrowding Problems encountered Short forming trains too full to get on never a guaranteed
seat lack of real time information wants to know train loading information limited staff to ask
Positives encountered Nothing
ldquoI have to let 1 or 2 trains go by every morning people donrsquot know I have a back problemrdquo
Lesson Importance of warm waiting areas and early information (with loading information) to provide people with pain and mobility issues time and space to get from platform to the train
Waiting During the Delay
While being disrupted 54 of quantitative survey participants noticed a waiting room or cafeacute at the boarding station where they were delayed However this was not where most participants waited ndash the key area for participants to wait during a delay was at the platform 79 of participants who were delayed at the boarding station waited there (see Figure 14) as did 74 of those who were delayed at the interchange station (see Figure 19)
25
Figure 14 Where waited when disruption occurred at boarding station
Amongst the latter only 40 noticed a waiting room or cafeacute at the interchange station with an additional 21 unsure about whether these facilities were present at the interchange station This indicates that a delay increases uncertainty about further travel and travellers remain put or at least as close to that as possible to not cause further disruption to their journeys
Of those delayed at the boarding station 16-35-year olds are significantly less likely to wait on the concourse than any other age group They are more likely to wait at the platform (83 not significant)
2
1
1
2
7
8
79
0 10 20 30 40 50 60 70 80 90 100
Other
In a cafeacute
At a shelter
In a waiting room
On the train
On the concourse
At the platform
participants
Base 706 who were delayed at the boarding station
Figure 15 Where waited when disruption occurred at interchange station
14
5
4
6
74
0 10 20 30 40 50 60 70 80 90 100
Other
In a cafeacute
In a waiting room
On the concourse
At the platform
participants
Base 77 who were delayed at the interchange station
Interestingly almost nine in ten participants who found out about the disruption before reaching the station waited on the platform rather than on the concourse (2) Longer delays at the boarding station (31 minutes or more) resulted in significantly more participants waiting on the concourse (c20) rather than on the platform (c5) However this may be due to the platform number not being announced for longer delays until closer to the time that the train arrives
26
The top three locations when waiting during a disruption per delay length were
0-5 minutes delay 11-20 minutes 31-60 minutes At the platform (90) At the platform (81) At the platform (65) On the train (7) On the concourse (9) On the concourse (18) Anywhere else (4) On the train (7) On the train (5)
6-10 minutes 21-30 minutes 60+ minutes At the platform (81) At the platform (83) At the platform (54) On the train (13) On the concourse (6) On the concourse (22) On the concourse (4) On the train (4) Waiting roomon train
(10) Base 0-5 minutes 160 6-10 minutes 250 11-20 minutes 302 21-30 minutes 155 31-60 minutes 118 60+ minutes 64
Comfort During Wait
Participants were generally uncomfortable wherever they waited during the disruption Only 38 of quantitative survey participants who were delayed at the boarding station found their location of choice comfortable Those who were delayed at the interchange station were slightly more comfortable (44)
Comfort levels varied very much depending on the waiting location Waiting in a cafeacute or a waiting room resulted in the highest levels of comfort Participants who waited on the platform the main location where participants waited were significantly less comfortable than those who waited in a cafeacute or waiting room
Figure 16 Proportion who said they were comfortable by waiting location at boarding station
23
33
37
40
67
71
71
0 10 20 30 40 50 60 70 80 90 100
Other
On the concourse
At the platform
On the train
At a shelter
In a waiting room
In a cafe
participants
Base 7 (cafeacute) 14 (waiting room) 6 (shelter) 52 (train) 559 (platform) 55 (concourse) 13 (other) Very low bases for some of these subgroups
Where the disruption was first noticed (ie before reaching the station when arriving at the boarding station or when already on the train) did not have a noticeable impact on comfort levels suggesting that even if rail users are given notice of the disruption their discomfort and likely satisfaction is not impacted positively or negatively
27
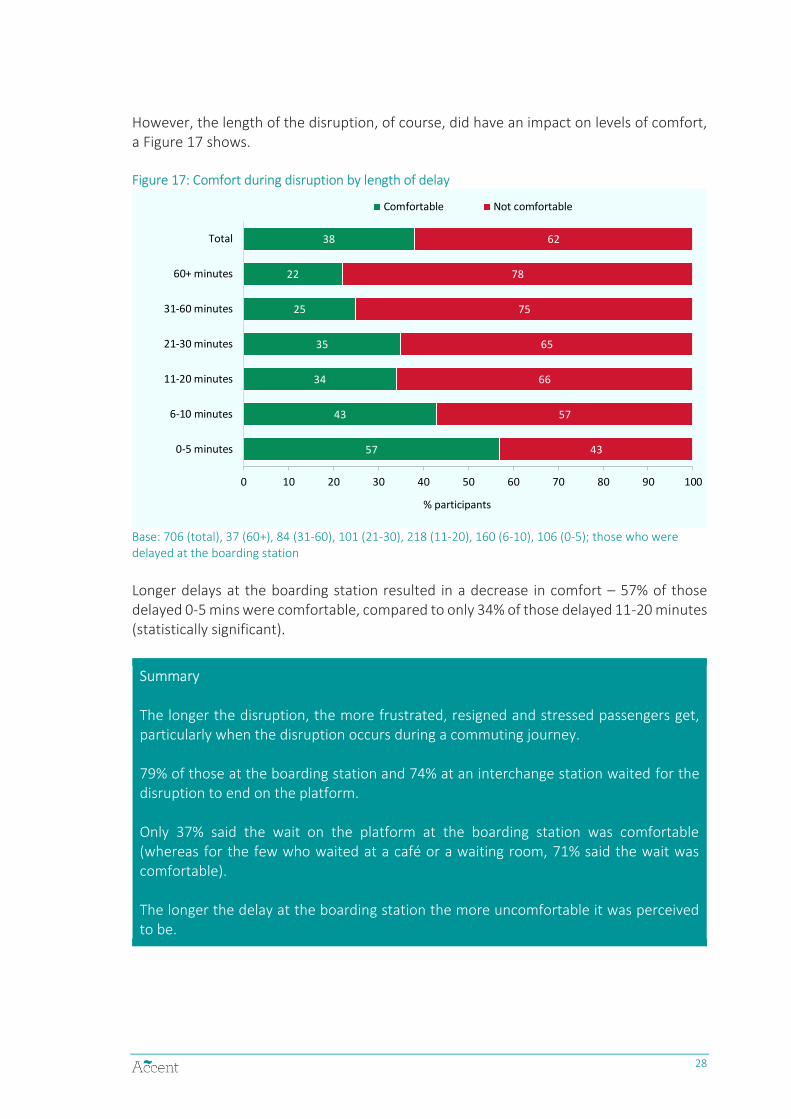
However the length of the disruption of course did have an impact on levels of comfort a Figure 17 shows
Figure 17 Comfort during disruption by length of delay
57
43
34
35
25
22
38
43
57
66
65
75
78
62
0 10 20 30 40 50 60 70 80 90 100
0-5 minutes
6-10 minutes
11-20 minutes
21-30 minutes
31-60 minutes
60+ minutes
Total
participants
Comfortable Not comfortable
Base 706 (total) 37 (60+) 84 (31-60) 101 (21-30) 218 (11-20) 160 (6-10) 106 (0-5) those who were delayed at the boarding station
Longer delays at the boarding station resulted in a decrease in comfort ndash 57 of those delayed 0-5 mins were comfortable compared to only 34 of those delayed 11-20 minutes (statistically significant)
Summary
The longer the disruption the more frustrated resigned and stressed passengers get particularly when the disruption occurs during a commuting journey
79 of those at the boarding station and 74 at an interchange station waited for the disruption to end on the platform
Only 37 said the wait on the platform at the boarding station was comfortable (whereas for the few who waited at a cafeacute or a waiting room 71 said the wait was comfortable)
The longer the delay at the boarding station the more uncomfortable it was perceived to be
28
Handling of the Disruption
Overall when asked to rate how well the rail company handled the disruption quantitative survey participants felt that the travel disruption was not handled very well Only 22
10believed that it was handled well
Figure 18 Rating of how the rail company handled the disruption
Very poorly15
Poorly23
Neither34
Well17
Very well5
Dont knowno opinion
6
Base 1049
Over a quarter (27) of commuters found the handling poor compared with 15 of business travellers and 17 of those travelling for leisure Similarly commuters were significantly less likely to find the disruption was handled very well (2) than business (8) and leisure travellers (13)11
Unsurprisingly the length of the delay contributes to the dissatisfaction with the handling of the disruption as the proportion of participants viewing this as poorly rises from 6 and 11 for the shortest delays to 31 for 31-60 minute delays and 27 for delays of more than 60 minutes The mean satisfaction score (where 1 = very poorly and 5 = very well) by disruption length is shown in Figure 19
10 A further breakdown of answers to this question can be found above in Figure 7 11 However there is no correlation between purpose of the disrupted journey and satisfaction with handling the disruption The difference was statistically significant at the 95 confidence level
29
Figure 19 Mean rating of how the rail company handled the disruption by disruption length
308
29
271
251
24
251
1 2 3 4 5
0-5 mins
6-10 mins
11-20 mins
21-30 mins
31-60 mins
60+ mins
very poorly very well
Base 0-5 mins 160 6-10 mins 250 11-20 mins 302 21-30 mins 155 31-60 mins 118 60+ mins 64
Age does not correlate with the rating of how a disruption is handled to a great extent though those 65 years or older are significantly more likely to say that the disruption was handled very well (17) than any other age group
Another key driver for satisfaction with the handling of the disruption was the satisfaction with the information received during the disruption 66 of those who felt that the information received during the disruption was good or very good also felt that the rail company involved in the disruption handled this well whilst only 5 thought the rail company didnrsquot handle the disruption well this difference is statistically significant Similarly 74 of participants who felt the information received was poor or very poor also thought the handling was poor
Figure 20 Rating of information by how well the rail company handled the disruption
1
36
10
38
20
19
54
5
12 2
2
0 10 20 30 40 50 60 70 80 90 100
TOC handleddisruption well
TOC handleddisruption
poorly
participants
Very poor Poor Neither Good Very good Dont knowNo opinion
Base 234 TOC handled information well 397 TOC handled information poorly
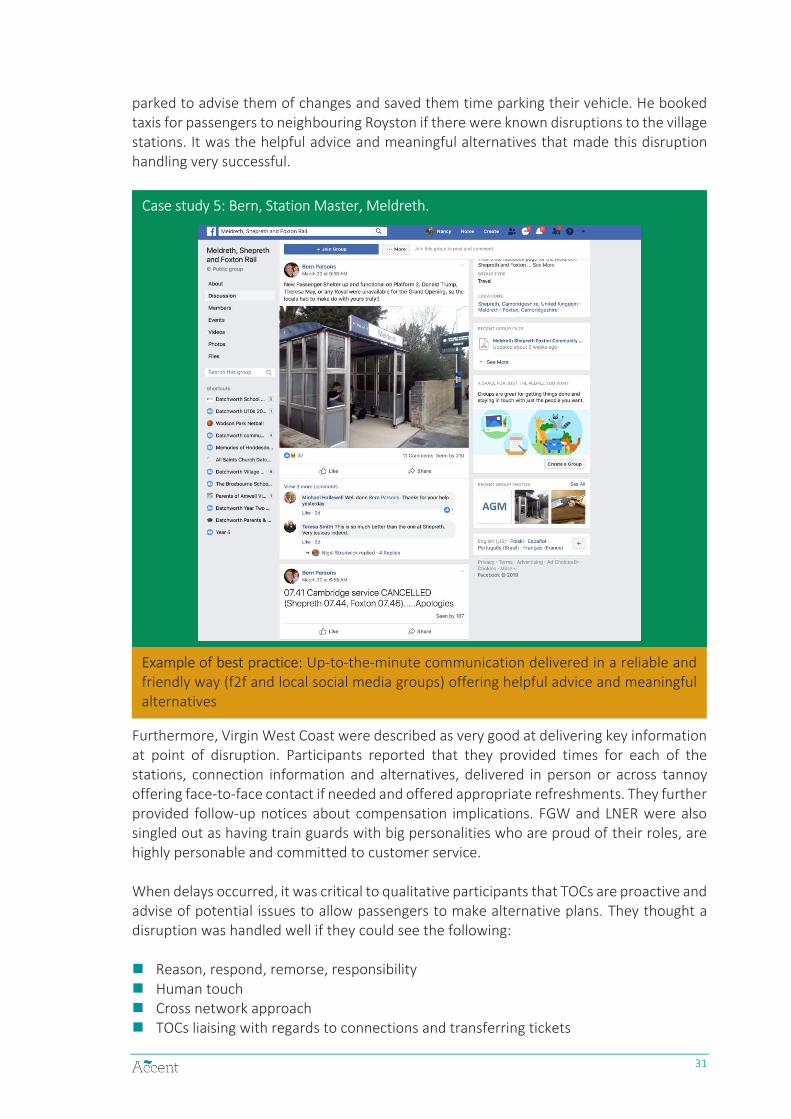
Amongst qualitative participants there were a handful of positive disruption stories The station master at Meldreth Bern for example updated his local Facebook page to advise passengers of disruptions The information could also be seen on a blackboard that was kept up to date At the time of disruption he met and greeted passengers before they
30
parked to advise them of changes and saved them time parking their vehicle He booked taxis for passengers to neighbouring Royston if there were known disruptions to the village stations It was the helpful advice and meaningful alternatives that made this disruption handling very successful
Case study 5 Bern Station Master Meldreth
Example of best practice Up-to-the-minute communication delivered in a reliable and friendly way (f2f and local social media groups) offering helpful advice and meaningful alternatives
Furthermore Virgin West Coast were described as very good at delivering key information at point of disruption Participants reported that they provided times for each of the stations connection information and alternatives delivered in person or across tannoy offering face-to-face contact if needed and offered appropriate refreshments They further provided follow-up notices about compensation implications FGW and LNER were also singled out as having train guards with big personalities who are proud of their roles are highly personable and committed to customer service
When delays occurred it was critical to qualitative participants that TOCs are proactive and advise of potential issues to allow passengers to make alternative plans They thought a disruption was handled well if they could see the following
Reason respond remorse responsibility Human touch Cross network approach TOCs liaising with regards to connections and transferring tickets
31
Anticipating problems and advising of alternative routes eg ldquoYou could change hereas there might be some congestion which would cause delayrdquo
Summary
Handling of the disruption by the TOC was perceived as poor or very poor by 38 with only 22 thinking it was handled well Commuters were most likely to find the handling of the disruption as poor Longer disruptions contributed to poor ratings as did cancellations
32
4 Information During Disruption
Information Needs
Participants in the qualitative stage were asked to complete lsquojourney mapsrsquo focusing on the information needed at different stages of the journey they undertake
Before travelling they wanted to know Is my train running on time Will I get a seat Is my train overcrowded Have trains run on time today What platform is it on Where to stand on the platform
Once at the station they were concerned with Should I purchase my ticketcar park Is my train still due in at x time Is there a platform change Up to date loading data
If a disruption was to occur at this stage of the journey their key questions would be
Around disruption scale
Reason ndash congestion vs suicide
How long it will be delayed
Connection implications Around alternative travel arrangements
Where shall I go instead
What is the fastest route from A to B
Other relevant modal information eg busescabs
Are tickets transferable
At the point of disruption qualitative participants said they would check multiple sources so that consistency of information was a key concern for them One way of achieving this would be through development of a multi-modal app
Information about disruptions occurring before getting on the train were received in a variety of ways For example the majority opted for lsquoalertsrsquo via text or push notification and many also checked the TOCrsquos app or their Twitter feed Participants also reported that they lsquoused big datarsquo to personalise the information Whilst a blackboardwhite board outside of station or in ticket office was also cited repeatedly as source of information it became clear that station staff are now key to get up to date with travel information (Station Master or staff in high vis clothing who have iPads on the platformconcourse) Participant were looking for platform screens to include matrix touch screens video feeds
33
with real-time news which means that websites need to be updated continuously This was especially important as participants said they would continue to check journey alerts
Once on the train participants wanted to receive information mainly around disruption scale and alternative travel arrangements Questions around information needs during this stage of the journey included
Why the train has stopped What is the best alternative What is the reason for the delay Where could I get off What is the scale of the delay Whether tickets are transferable What is the ETD What are the compensation What is the ETA at each station arrangements What implications does this have for
connections
The moment the train pauses or goes unusually slowly participants were looking for an lsquoimplications explanationrsquo and wanted regular updates throughout the delay Participants would like to receive this from the train guard (longer distance journey) train driver LCDvisual displays touch screens with alternatives via a helpline or a live chat during train operating hours
Perception of information given
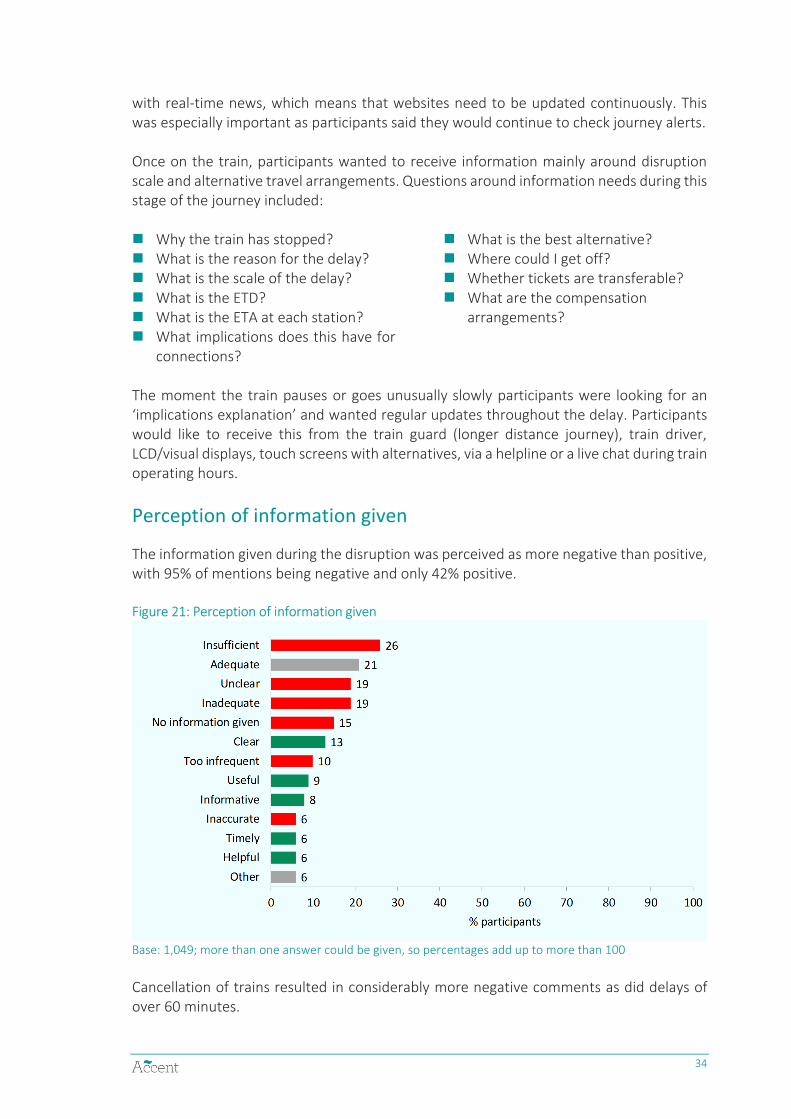
The information given during the disruption was perceived as more negative than positive with 95 of mentions being negative and only 42 positive
Figure 21 Perception of information given
Base 1049 more than one answer could be given so percentages add up to more than 100
Cancellation of trains resulted in considerably more negative comments as did delays of over 60 minutes
34
35
Table 2 Perception of information given by length of delay and whether train cancelled
Total
Length of delay Whether train
cancelled
0-5 mins
6-10 mins
11-20 mins
21-30 mins
31-60 mins
60+ mins
Yes
No
Insufficient 26 21 18 26 31 36 45 32 25
Adequate 21 21 29 18 20 18 16 18 22
Inadequate 19 9 11 22 26 26 36 30 16
Unclear 19 8 15 19 26 26 33 27 17
No information given 15 27 16 15 8 8 3 9 17
Clear 13 14 16 12 12 14 11 11 14
Too infrequent 10 6 6 11 10 17 23 12 10
Useful 9 11 10 10 5 6 5 7 9
Informative 8 9 10 7 8 8 6 6 9
Helpful 6 8 7 6 6 5 5 5 7
Timely 6 7 7 6 3 6 3 4 6
Inaccurate 6 3 2 8 5 10 16 9 5
Other 6 4 7 6 8 4 14 9 6
Base 1049 160 250 302 155 118 64 245 804
Tone of information
As a whole the tone of information given was perceived as neutral the inconvenience caused was acknowledged however the general tone was deemed indifferent Just over a fifth of quantitative survey participants each described the tone more positively 22 easy to understand 22 apologetic and 21 informative Figure 22 Tone of information provided
Base 895 (all those who were given information) more than one answer could be given so percentages add up to more than 100
7
1
3
3
7
9
21
22
22
25
36
0 10 20 30 40 50 60 70 80 90 100
Other
Rude
Lacked respect
Cared about my needs
No information received
Lacked care
Informative
Apologetic
Easy to understand
Indifferent
Acknowledged the inconvenience
participants
Rating of information
Overall 25 rated the information as good or very good and 45 as poor or very poor See Figure 23
Figure 23 Rating of the information received about the disruption
Base 1049
Very poor16
Poor29
Neither28
Good22
Very good3
Dont knowno opinion
2
When asked about what information was poor participants focused especially on the content of the information provided to them during the disruption a lack of or inadequate information was noted by almost a quarter of participants and a similar proportion of participants were unhappy about a delay in providing information The information was deemed vague unclear or inaudible by 10 of the participants
Similarly key information perceived as good centred around reasons given for the disruption In contrast to vague unclear inaudible information as reported by those who found the information poor it was reported as reported clear and concise by some These should be the focus of what and how TOCs provide information during disruption
36
Figure 24 Good information during disruption
6
2
3
3
3
6
8
8
9
9
13
13
14
14
15
17
32
0 10 20 30 40 50 60 70 80 90 100
Other
Information available online
Information provided via app
Information from station staff
Accurate information
Apology given
Timely information - in advance etc
Information re onward travel
Announcements
On-train information
TimingsETA given
Information on boardsscreens
Clearconcise information
Information provided (general)
Updates provided - good regular
Length of delay
Reason for disruption
participants
Q28 Base 263 (those who found information good) more than one answer could be given so percentages add up to more than 100 Chart only shows mentions gt1
During the qualitative stage participants said they would want to hear the following
An apology (more than once) The reason the train is delayed eg sheepsuicidestaff Estimated time of arrival at EVERY station Impact on connectionsticket validity We will update you again within 5 minutes We are doing everything we can to get you in on time Please check your app We know this isnrsquot acceptable We will refund ndash this is how
As with the quantitative findings participants here also said that the tone of voice was very important They were looking for information that was delivered in a very apologetic almost self-flagellating way showing genuine concern and with a reassuring optimistic and bright tone A human touch if appropriate humorous was also welcome Key to this was that the information would be given proactively via text message or email or via a TOC app
37
Figure 25 What information during disruption was poor
2
2
2
2
5
7
7
8
10
10
13
18
19
22
23
24
0 10 20 30 40 50 60 70 80 90 100
Other
No apology
Delay repaycompensation issues
Information available online
Information on boardsscreens
Noinsufficient updates
Poor communication (general)
Lack of information (onward travel)
Vagueunclearinaudible
Staff uninformedunavailable
No ETAlength of delay
Inaccurateconflicting information
No information provided
No reason for delay
Delay in providing information
Lack of or inadequate information
participants
Base 467 (those who rated the information as poor) more than one answer could be given so percentages add up to more than 100 Chart only shows mentions gt1
Summary
Overall the information given during the disruption was perceived as more negative than positive 95 negative comments (eg 26 insufficient 19 unclear 19
inadequate 15 none given) and 42 positive comments (eg 13 clear 9 useful 8 informative)
As a whole the tone of information given was perceived as neutral 36 said the
inconvenience caused was acknowledged 25 said it was indifferent Just over a fifth each described the tone more positively 22 easy to understand 22 apologetic and
21 informative
Overall 25 rated the information as good or very good and 45 as poor or very poor The main examples of poor information were lack of or inadequate information (24)
delay in providing information (23) and no reason given (23) The main examples for good information were reason given for the disruption (32) and the length of delay
(17) These findings provide clear pointers as to how TOCs should provide information during disruptions
Reception of Information
Participants were asked where they first received information about the disruption
38
Amongst qualitative stage participants there was a high demand for an app built on real-time GPS data with push notifications Participants were reliant on a range or apps for journey planning and perceiving real-time information including Citymapper National Rail Enquiries and Trainlinecom
Third party apps were viewed as independent highly trusted delivering the bigger picture eg offering more than just network data and also show early updates that are accurate However many commuters were more familiar with their TOC and would prefer apps from them These apps were viewed as good for specific routes with dedicated journeys saved in the app and many qualitative participants would check the apps first thing in the morning and before leaving the office There was a general feeling amongst participants that none of the existing apps goes far enough and that these apps are not always consistent with other information especially at times of disruptions
Participants hence were looking for something that was an all-in-one ticketpayment and information source Key for this to work would be GPS data TOC data personal data accuracy in information and real-time information Participants were looking for this app to provide disruption alerts for pre-set journeys fastest journey prediction including alternative TOCsmodes platform information and changes seat availability and loading data as well as rail driver information
ldquoThey should look at Uber Itrsquos so easy to use and you can track where your driver is at any momentrdquo
London Commuter
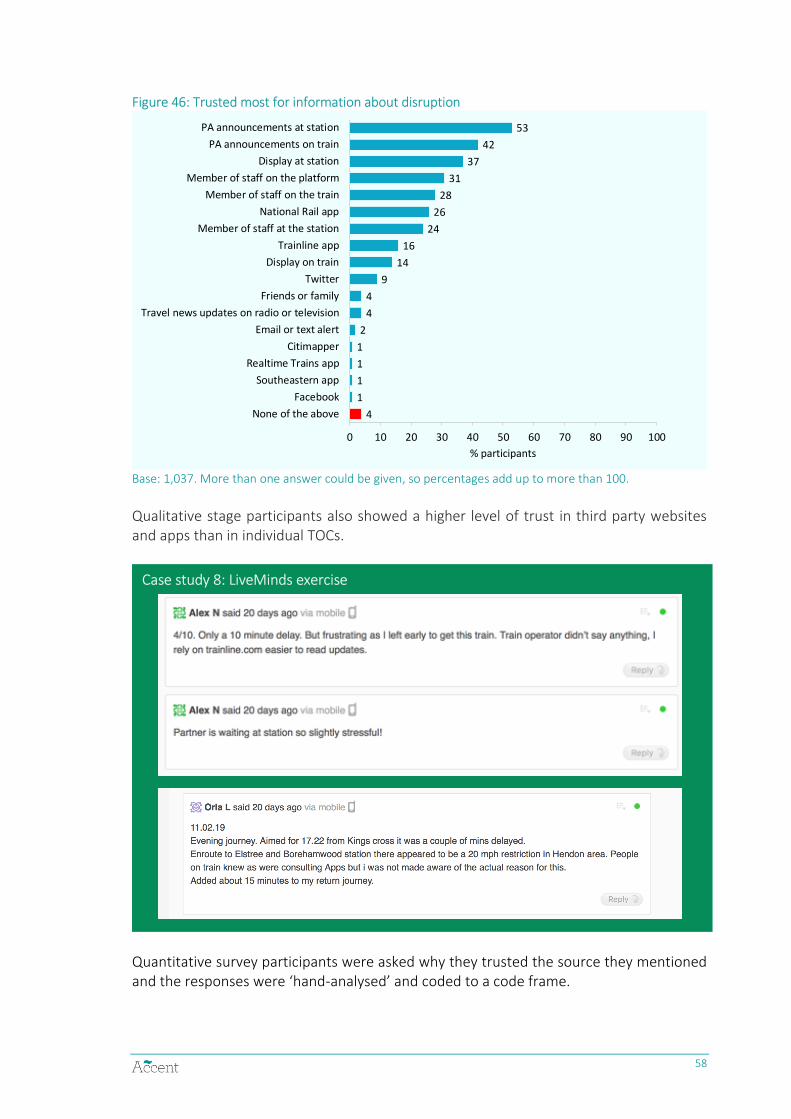
Amongst survey participants nearly four in ten (39) first noticed information about the disruption to their train journey via a display at the station Rail staff continues to be one of the key early delivery methods of information though predominantly via PA announcements Face-to-face information through members of staff only make up 8 of all initial points of information Only 13 of participants learned about the disruption first via an App or the internet with the National Rail app the main one
39
Figure 26 How information is first received
1
3
1
1
1
2
2
2
4
5
5
16
18
39
0 10 20 30 40 50 60 70 80 90 100
Dont know
Other
Member of staff at the station
Other travel app
Member of staff on the platform
Rail company app
Family friend or fellow traveller
Trainline app
Member of staff on the train
National Rail app
PA announcements at station
PA announcements on train
Display at station
participants
Base 1049
Amongst the survey participants who learned about the disruption before reaching the station App usage was significantly higher than amongst those who learned about the disruption at a later stage A third of all participants who learned about the disruption before reaching the station were significantly more likely to hear about this via the National Rail app 22 learned about it via the Trainline app and 8 found out through a particular rail companyrsquos app compared to almost none of the participants who learned about this later
Where the first information of the disruption was delivered via a Rail company app PA announcements on the train or members of staff on the platform participants were most likely to be satisfied with the handling of the disruption by the TOC Other travel apps and displays at the station had the opposite effect ndash here participants were significantly more likely to think the situation was handled poorly rather than well
Table 3 Rating of how TOC handled disruption by information source
TOC handled disruption well
TOC handled disruption poorly Base
Rail company app 37 32 19
PA announcements on train 33 31 187
Member of staff on the platform 31 25 16
Trainline app 28 43 40
PA announcements at station 25 34 173
Member of staff at the station 25 42 12
Twitter 25 25 8
Display on train 25 0 4
Member of staff on the train 23 42 48
National Rail app 19 42 53
Display at station 17 42 406
Other travel app 15 54 13
Family friend or fellow traveller 6 28 18
40
When asked which if any sources they recalled receiving information about the disruption during the disrupted journey this was a little different from the initial source mainly because more than one source could be mentioned although the ordering is similar
Quantitative survey participants recall receiving information about the disruption predominantly when itrsquos announced through a display at the station (45) PA announcements at the station (39) or on the train (37) The next most frequently remembered method of delivery is the National Rail app (13) followed by members of staff on the platform and on the train as well as via the Trainline app (8 each)
Figure 27 From which sources received information about the disruption during disrupted journey
1
3
3
3
4
6
8
8
8
13
37
39
45
0 10 20 30 40 50 60 70 80 90 100
Rail company app
Member of staff at the station
Family friend or fellow traveller
Display on train
No information received
Member of staff on the platform
Member of staff on the train
Trainline app
National Rail app
PA announcements on train
PA announcements at station
Display at station
participants
Base 1049
Qualitative stage participants found visual displays on the train helpful but pointed out that they needed to provide ETD implications and ETA at each station There was a keen interest for these to be used more actively answering questions such as
How long will the train be held at a red signal What time do we get in at the next station Is it now better to get off and change
Emotions When Receiving Initial Information
Finding out that their journey was disrupted caused a range of emotions in participants
Qualitative stage participants felt that poor management of disruptions and lack of communication exacerbates emotional and financial impact There was a clear desire for honest dynamic information delivered proactively to allow for passengers to regain control
41
--
-
The lack of proactive lsquoup to datersquo information dominated the range of frustrations voiced by qualitative stage participants and they had a strong desire for increased staff visibility However addressing the information hole via automateddigital channels would help all the frustrations Participants reported of a variety of frustration lsquocategoriesrsquo
lsquoHumanrsquo Absence of staff to answer questions eg on the platform Live Chat
No human response ndash they all hide
Lack of clear diction ndash do you know the Muffle Man
Dismissive staff
Need some lsquoRRRRrsquo - reason (whatrsquos happened) response (what are we doing about it) remorse (we are sorry) responsibility (we will rectify in the future by)
Connection
Knock on impact eg missing connecting trains
Implications for seat availability for longer journeys - where trains are cancelled and seat reservations get ignore
Informational
Absence of any explanation
No real time information eg train stops without reason
Inconsistency of information eg Platform screen different to App to Twitter
Lack of confidence in real time information eg expected train time keeps being delayed by 1 minute then 2 minutes then 3 minutes etc
Case study 6 Greater Anglia
Who Female commuter (45 65 years old) from London When 4 5 times a week from London Liverpool Street to Hertford East What Trouble with the power lines Problems encountered chaos at Liverpool Street Station dismissive staff
boardsannouncements not up to date and not informative no ETD or alternatives provided
Positives encountered one staff member eventually radiorsquod the train driver to get a specific ETD which allowed passenger to make a choice and to Moorgate Hertford North and then take a taxi home
ldquoThe station staff at Liverpool Street were hellip I mean she just flicked her hand at me in a dismissive way and said lsquoI donrsquot know read the boardsrsquordquo
ldquoIrsquom lucky that I have two choices of train line near me but I have a season ticket so itrsquos important that the ticket is then transferablerdquo
Quantitative survey participants reported mostly negative emotions when first receiving information about the disruption which were very similar to those recalled when initially
42
learning about a disruption (see Figure 13) though slightly more balanced Only 55 felt frustrated (rather than 63 in the previous question) and 12 felt informed
Figure 28 Emotions when receiving initial information
2
5
8
12
12
14
18
25
37
55
0 10 20 30 40 50 60 70 80 90 100
Reassured
In control
Calm
Uncertain
Informed
Anxious
Angry
Stressed
Resigned
Frustrated
participants
Base 974 (all those who were given information)
Predictably feeling angry and stressed increased as the length of disruption increased A very short delay (0-5 minutes) unsurprisingly lead to significantly fewer quantitative survey participants saying they felt frustrated (40) than delays between 11 and 60 minutes (60-69) This feeling decreased however for delays of 60 minutes or more where the percentage dropped to 57 These participants had an increased feeling of uncertainty (26) compared to those with a delay of 10 minutes or less
Some factors influenced the emotions of quantitative survey participants For example when the reason of the disruption remained unexplained or were service-related issues participants felt significantly more resigned (41 and 44 respectively) than when a problem with the train caused the disruption (22) Commuting participants felt significantly more frustrated (60) than leisure travellers Those in turn felt significantly more uncertain when experiencing disruptions (19) than commuters (11) or business travellers (9)
Listening for Announcements
To avoid those frustrations most quantitative survey participants said they always actively listen for announcements at the boarding station (73) and on the train (51)
Age seems to have an influence on the frequency of listening out for announcements Participants older than 65 generally try to listen to announcements on the boarding station (85) and on the train (63) whilst participants under 35 make less of an effort to always listen (65 and 47) At the boarding station and on the train however the younger participants are more likely to listen if they think there may a delay or disruption (26 at station and 15 on train vs 12 and 2 of the 65+ year olds)
43
Figure 29 Whether actively listen for any announcements at the boarding station
73
20
4
1
2
0 10 20 30 40 50 60 70 80 90 100
Yes always
Only if I think there may be a delay or disruption
No
My station doesnt have a PA system
Other
participants
Base 1049
Figure 30 Whether actively listen for any announcements on the train
51
33
12
3
2
0 10 20 30 40 50 60 70 80 90 100
Yes always
Yes only when I can hear them
Only if I think there may be a delay or disruption
No
Other
participants
Base 1049
Frequency of Announcements
Frustrations can also be avoided when information about disruptions are given at the right time
Overall if on a train that seems to be running slower than it should be or stops between stations 72 of quantitative survey participants wanted to receive information about the delay within five minutes and 20 within 6-10 minutes
Overall when there is a disruption to the rail service slightly more (75) would like announcements to be made within five minutes and 18 within 6-10 minutes
See Figure 31 which all shows the data disaggregated by journey purpose
Commuting participants are more likely to be interested in receiving information about slow running every 0-5 minutes 74 of participants feel that this is appropriate when being on a train that seems to be running slower than it should be or stops between station and 78 feel this is appropriate when a disruption is already occurring
44
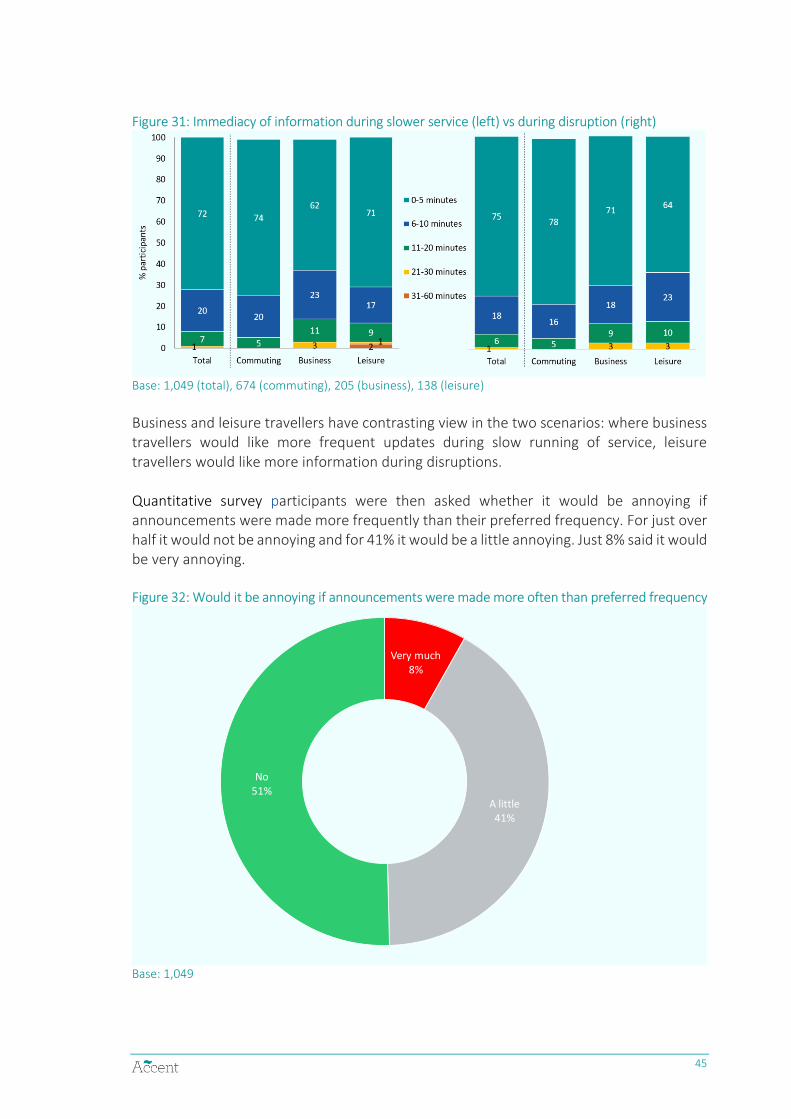
Figure 31 Immediacy of information during slower service (left) vs during disruption (right)
Base 1049 (total) 674 (commuting) 205 (business) 138 (leisure)
Business and leisure travellers have contrasting view in the two scenarios where business travellers would like more frequent updates during slow running of service leisure travellers would like more information during disruptions
Quantitative survey participants were then asked whether it would be annoying if announcements were made more frequently than their preferred frequency For just over half it would not be annoying and for 41 it would be a little annoying Just 8 said it would be very annoying
Figure 32 Would it be annoying if announcements were made more often than preferred frequency
Very much8
A little41
No51
Base 1049
45
Leisure travellers are significantly less likely to feel very much annoyed (2) compared with commuters (9) or business travellers (10)
In summary our research shows that announcements are likely to be most welcome if they are made within five minutes for both slow running services and disruptions and most passengers would not be annoyed if it was more frequent than their preferred frequency
Participants were asked which they would prefer in situations when there are no announcements made because the train company doesnt have enough information
A) an announcement made with very little or no information B) an announcement made once there is some information
The consensus across rail passengers is that an announcement made with very little or no information is much better (80) than having to wait for an initial announcement until there is some information (20)
Summary
39 first noticed information about the disruption via a display at the station PA announcements on train (18) and PA announcements at the station (16) are also important sources Only 13 first learned about the disruption via an App or the internet with the National Rail app the main one If the information source was a rail company app PA announcements on the train or members of staff on the platform were most likely to be satisfied with the handling of the disruption by the TOC Other travel apps and displays at the station had the opposite effect
Unsurprisingly learning about a disruption to the journey resulted in negative emotions and participants tried to avoid these by always actively listen for announcements at the boarding station and on the train
Participants felt that the ideal frequency for information to be disseminated is every 0 to 5 minutes 72 for a slower running service and 75 for a disruption
If the frequency of announcement is higher than preferred most would not be annoyed
Announcements made within five minutes for both slow running services and disruptions would be most welcomed by passengers
Four fifths prefer that an announcement is made with very little or no information than having to wait until there is some information
46
Additional Information during Disruption
Participants were asked what else in addition to general information about the disruption they are looking for and what tone the information should be delivered in In addition they were asked about their likely behaviour during severe disruptions
Behaviour in Severe Disruption
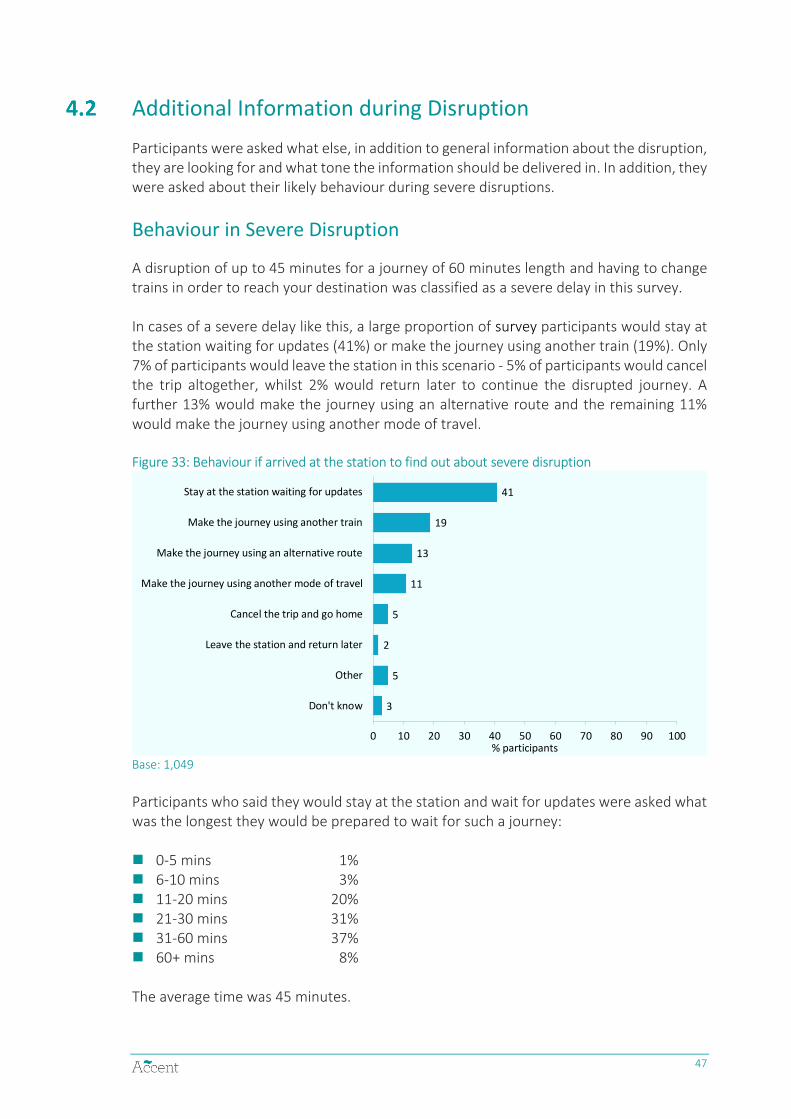
A disruption of up to 45 minutes for a journey of 60 minutes length and having to change trains in order to reach your destination was classified as a severe delay in this survey
In cases of a severe delay like this a large proportion of survey participants would stay at the station waiting for updates (41) or make the journey using another train (19) Only 7 of participants would leave the station in this scenario - 5 of participants would cancel the trip altogether whilst 2 would return later to continue the disrupted journey A further 13 would make the journey using an alternative route and the remaining 11 would make the journey using another mode of travel
Figure 33 Behaviour if arrived at the station to find out about severe disruption
3
5
2
5
11
13
19
41
0 10 20 30 40 50 60 70 80 90 100
Dont know
Other
Leave the station and return later
Cancel the trip and go home
Make the journey using another mode of travel
Make the journey using an alternative route
Make the journey using another train
Stay at the station waiting for updates
participants
Base 1049
Participants who said they would stay at the station and wait for updates were asked what was the longest they would be prepared to wait for such a journey
0-5 mins 1 6-10 mins 3 11-20 mins 20 21-30 mins 31 31-60 mins 37 60+ mins 8
The average time was 45 minutes
47
Tone of Information
Quantitative survey participants were also asked which of the following tones of information they would prefer in normal and severe disruptions Qualitative research had shown that these seven tones of information were in particular demand from travellers during disruptions
Clear = easy to hear and to understand Correct = factual and up to date Concise = short and regular Confident = genuine and honest Conciliatory = apologetic and empathetic Consistent = across different channels andor providers Personal = tailored to your circumstances
The quantitative survey participants could give a maximum of three answers out of a list of seven tones specifying their first second and third choice Overall participants were looking for assurance through information provided about the disruption therefore looking predominantly for correct and clear information during normal disruption but also during severe disruption that would increase the journey time by 75
Figure 34 Preferred tone of information provided12
9
10
7
9
12
23
30
4
5
8
13
15
25
30
0 10 20 30 40 50 60 70 80 90 100
Personal
Conciliatory
Consistent
Concise
Confident
Clear
Correct
participants
Average disruption
Severe disruption
Base 1049
As the disruption gets more severe participants would like to see a conciliatory tone of voice and a more personal touch to the message
12 To distil the one preferred tone of voice the count for each tone was multiplied by three for the first choice by two for the second and by one for the third The values were then added up and divided by 6 before dividing it by 1049 to get the overall percentage
48
Level of Detail of Information during Disruption
Quantitative survey participants were asked what level of detail about the cause of the disruption they would prefer from the following
Very detailed for example this train is running 25 minutes late because of damage to the overhead electric wires between Birmingham New Street and Longbridge caused by a falling tree
Quite detailed for example this train is running 25 minutes late because of damage to the overhead electric wires between Birmingham New Street and Longbridge
Not detailed for example this train is running 25 minutes late
Figure 35 Level of detail about the cause of the disruption preferred
Very detailed61
Quite detailed37
Not detailed2
Base 1049
Over six tenths prefer very detailed information on the disruption containing for example the length and exact nature of the disruption Quite detailed information comprising of length and some information on the nature of the disruption was preferred by 37 Only very few participants would look for basic not-detailed information (2)
Some differences of opinion can be seen when looking at age of the passenger and satisfaction with handling of the disruption 16 to 35-year olds are significantly more likely to want very detailed information (67) than passengers that are 36 to 55 (57) or 56 to 64 (54) Furthermore significantly more participants who rate the TOC handling of the disruption as poor would prefer very detailed information (67) than those who rate the handling good (55)
49
Table 4 Preferred level of information
Level of information 16 -35
36 -55
56 -64
65+
Well -handled
Poorly handled
Very detailed 67 57 54 58 55 67
Quite detailed 30 40 44 41 42 31
Not detailed 3 3 2 2 3 2
Donrsquot know 1 0 0
Base 388 464 127 59 234 397
= less than 05
Preferred Staff Behaviour in Severe Disruptions
Quantitative survey participants were asked which of the following they would like staff to do if the disruption was particularly severe
Take responsibility Give you a named person for follow up Escalate to management Find me an alternative mode of transport to complete my journey Find me an alternative route to complete my journey Provide information on compensation Other
They were asked to choose the top three
As only 5 of participants would consider abandoning a severely disrupted journey participants were predominantly interested in information that would help them find an alternative arrangement to complete the journey as Figure 36 demonstrates
50
Figure 36 Preferred staff behaviour in severe disruptions13
1
3
4
16
20
26
30
0 10 20 30 40 50 60 70 80 90 100
Other
Give a named person for follow up
Escalate to management
Provide information on compensation
Take responsibility
Find an alternative mode of transport to completejourney
Find an alternative route to complete journey
participants
Base 1049
In case of a severe disruption the majority viewed information about options such as connections or alternative routes as most important (51) followed by information about the cause of disruption (44) An apology for the disruption was viewed as less important (4)
Figure 37 If the disruption was particularly severe which of the following would be most important and 2nd most important
44
4
51
47
16
37
0 10 20 30 40 50 60 70 80 90 100
Information about the cause of disruption (eg thecause and how long it will last)
An apology for the disruption
Information about options (eg connections oralternative routes)
participants
1st 2nd
Base 1049
13 the count was multiplied by three for the first choice by two for the second and by one for the third The values were then added up and divided by 6 before dividing it by 1049 to get the overall percentage
51
ndash
Case study 7 Virgin West Coast
Who Female business and leisure traveller with osteoporosis (65+ years old) from Birmingham
When First Class journey from Birmingham New Street What Severe weather (Storm Gareth) Problems encountered other than the disruption itself none Positives encountered uniformed staff on the platform equipped with iPads to
inform travellers of alternatives proactively opened the waiting room and 1st Class lounge for people to shelter and keep them warm kept everyone information of expected arrival and departure times
ldquoI canrsquot thank Virgin enough for that they are like a Swiss rail companyrdquo
Example of best practice
Importance of an Apology
Amongst quantitative survey participants taking responsibility nevertheless only came out as the third most important aspect of what staff should do 34 viewed an apology from the TOC for the disruption as very important and a further 34 as quite important Only 30 find this not at all or not so important
Figure 38 Importance of an apology from the TOC
5 25 34 34 2
0 10 20 30 40 50 60 70 80 90 100
participants
Not at all important Not so important Quite Important Very important Dont know
Base 1049
During the qualitative research participants showed that ongoing disruption experience and bad handling of it could encourage modal shift Frustrations with the rail service lead to a lack of confidence in the service which ultimately resulted in participants questioning why they were taking the train rather than driving An apology or apologetic tone could somewhat break this cycle
However quantitative survey participants did not find it very important to see rail staff when there are interruptions to the rail service only 2 thought this was essential and a further 14 found this quite important
52
Figure 39 Importance of being able to see rail staff when there are disruptions to the rail service
Essential2 Quite important
14
Not so important38
Not at all important46
Base 1049
Agreement with statements about disruptions
Overall 68 of quantitative survey participants agreed that there should be an apology for any disruption however short it is Only 14 disagreed Female passengers found it more important to hear an apology as 40 found an apology very important (29 men statistically significant)
When asked if they agreed with the statement that lsquosometimes the train company is deliberately evasive about the reason for disruptionsrsquo only 13 disagreed with this statement signalling that there is a lack of trust in TOCs
Figure 40 Agreement with statements about disruptions
22
25
36
43
29
23
13
7 2
0 10 20 30 40 50 60 70 80 90 100
Sometimes the train company is deliberately evasiveabout the reasons for disruptions
There should be an apology given for any disruptionhowever short it is
participants
Strongly agree Agree Neither Disagree Strongly disagree
Base 1049
53
Figure 42 Events about which information would be appreciated
Honesty was viewed as extremely important 80 of participants said it was very important that the train company be honest even if that means saying they do not know what is happening
Figure 41 Importance that the train company is honest even if that means saying they do not know what is happening
Base 1049
Not so important3
Quite Important17
Very important80
Content and Delivery of Additional Information
Quantitative survey participants were also asked whether and how they would like to receive information about the causes of the disruptions 80 of participants said they would like this additional information and they are interested in hearing about certain events more often than others Amongst qualitative participants similar needs were reported Figure 42 demonstrates the response from survey participants
13
38
41
43
45
48
49
52
54
62
67
71
0 10 20 30 40 50 60 70 80 90 100
None of the above Other
Leaves
Landslips
Cable theft
Buckled rails
Snow and ice
Flooding
Fatalities
Vandalism and trespass
Knock-on delays
Engineering works
Signals and points failure
participants
54
Base 835 (those who would like to receive information about causes)
Weather related causes of disruptions were less important to quantitative survey participants than infrastructure issues engineering works or external factors like vandalism Sixty-two per cent of participants would want to know about knock-on delays
Amongst the preferred method of delivery for information on these events are announcements on trains (55) through a member of staff on the platform (46) and on travel apps (45)
Figure 43 Preferred delivery method of information
2
10
13
15
18
23
28
38
41
43
45
46
55
0 10 20 30 40 50 60 70 80 90 100
Other
Leaflets at stations
Text message
In emails
On social media
Through messaging apps
Posters at stations
On NRE website
Member of staff on the train
Member of staff at the station
On travel apps
Member of staff on the platform
Announcements on trains
participants
Base 835 (those who would like to receive information about causes) more than one answer could be given so percentages add up to more than 100
Significantly more participants with a mental health andor social disability would like announcements on trains (70) or on social media (36) than participants without any disability (55 and 16 respectively)
Summary
If they experience a severe disruption only 5 would abandon the journey Almost half would stay at the station waiting for updates and be prepared to wait an average of 45 minutes In cases like this participants said they would want information about options such as connections or alternative routes but also know about the cause of disruption
For both normal and severe disruptions participants most want lsquocorrectrsquo (30 normal 30 severe) and lsquoclearrsquo (25 normal 23 severe) information As the disruption gets more severe participants would like to see a conciliatory tone of voice and a more personal touch to the message
61 prefer very detailed information on the disruption and 37 quite detailed information
55
Figure 44 Apps and websites used during disruption
-
In case of a severe disruption 51 viewed information about options such as connections or alternative routes as most important followed by information about the cause of disruption (44) An apology for the disruption is viewed as less important (4)
80 said it was very important that the train company be honest even if that means saying they do not know what is happening
80 wanted addition information on causes of disruption with signal and points failures (71) engineering works (67) and knock on delays (62) the most sought after information
Infographic style information on causes of disruptions via a variety means such as posters at stations on their apps and websites leaflets at stations etc would be welcomed by passengers
Delivery Mechanism of Information
This section focuses on how information is obtained during disruptions looking particularly at PA announcements
To stay up-to-date with journey information the majority of survey participants used at least one app or website during their journey being disrupted ndash only 10 did not use any and 50 used more than one method The most popular method to obtain information during disruption was the National Rail Enquiries website
1
10
1
1
1
1
1
1
3
4
7
9
10
10
20
29
29
41
0 10 20 30 40 50 60 70 80 90 100
Dont knowcant remember
None
Other
Rail company app
Other travel app
Realtime Trains app
Google Maps app
Google Maps
Citimapper
Trainline app
National Rail app
Specific rail company app
Friend family or fellow traveller
Rail company website
Trainline or other booking site
National Rail Enquiries website
participants
Base 1049 more than one answer could be given so percentages add up to more than 100 This code combines apps such as Thameslink app Southern app SWR app etc
56
The apps and websites used most when there is a disruption are shown in Figure 45 The two main sources were the National Rail Enquiries website (28) and Trainline or other booking site (23)
Figure 45 Apps and websites used most
1
3
2
2
6
9
13
14
23
28
0 10 20 30 40 50 60 70 80 90 100
Dont knowcant remember
Other
Friend family or fellow traveller
Other travel app
Rail company website
Rail company app
Trainline or other booking site
National Rail Enquiries website
participants
Base 931 who used one or more apps or websites
Considering that 50 of quantitative survey participants said they use more than one source of information to keep updated on disrupted journeys it is not surprising that not all of the sources available are trusted When asked which method they would trust most for information about disruptions participants gave a large range of answers with PA announcement at stations and on train most trusted followed by displays at stations The top five most trusted sources of information are linked directly to rail staff whether this is through PA announcements displays or members of staff Interestingly apps and websites were not as trusted as the more traditional means
57
Case study 8 LiveMinds exercise
Figure 46 Trusted most for information about disruption
4
1
1
1
1
2
4
4
9
14
16
24
26
28
31
37
42
53
0 10 20 30 40 50 60 70 80 90 100
None of the above
Southeastern app
Realtime Trains app
Citimapper
Email or text alert
Travel news updates on radio or television
Friends or family
Display on train
Trainline app
Member of staff at the station
National Rail app
Member of staff on the train
Member of staff on the platform
Display at station
PA announcements on train
PA announcements at station
participants
Base 1037 More than one answer could be given so percentages add up to more than 100
Qualitative stage participants also showed a higher level of trust in third party websites and apps than in individual TOCs
Quantitative survey participants were asked why they trusted the source they mentioned and the responses were lsquohand-analysedrsquo and coded to a code frame
58
The main reasons are concerned with the information being up-to-datelive (28) and accurate (20)
Figure 47 Why trust source
1
3
1
1
1
1
1
2
2
3
4
5
5
5
7
9
9
10
10
15
20
28
0 10 20 30 40 50 60 70 80 90 100
Dont know
Other
Only option available
Available to all - not everyone has internet etc
More accountableresponsible
Announcement
Chose National Rail app (not Trainline)
Consistent
Combined sources of informationoverview
First-hand information
Easily accessible
On sitevisible
Openhonesttransparent
Quicker
Experience - proven over time
Direct from source - official
Staff members
Reliabletrustworthy
Real personpersonal touch - can ask questions
Better information
Accuratecorrect
Up-to-datelive
participants
Base 1009
PA Announcements
Quantitative survey participants were asked how much they valued PA announcements when there are disruptions at the station and on the train
PA announcements are not only trusted most but the majority of participants also viewed them as essential 57 felt that PA announcements at the station were essential and 61 felt that PA announcements on the train were essential
Figure 48 How valued PA announcements are at station and on the train
1
4
4
39
35
57
61
0 10 20 30 40 50 60 70 80 90 100
at station
on train
participants
They are not at all important They are not so important They are important They are essential
Base 1049
59
The preferred interval for PA announcements was probed By a large margin participants preferred PA announcements to be every 0-5 minutes at the station and on the train
Figure 49 Preferred interval of PA announcements
1
9
25
65
1
6
22
72
0 10 20 30 40 50 60 70 80 90 100
31-60 mins
21-30 mins
11-20 mins
6-10 mins
0-5 mins
participants
At the station
On the train
Base 1049
Commuters were more likely to be in favour of a 0-5 minute frequency to updates than business or leisure travellers Participants who found the handling of the disruption by the TOC to be poor were significantly more in favour of 0-5 minute frequency that those who thought the handling was done well (76 vs 65 at stations 70 vs 55 on trains)
The length of the most recent delay and the nature of the disruption do not have a significant impact on the preference nor does when the disruption was noticed
In addition to timeliness it is important that PA announcements are easy to understand Participants thought that the PA announcements during their most recent disrupted journey were slightly less clear at the station than those on trains and overall the majority thought they were not clear
60
Figure 50 Clarity of announcements at stations and on trains
39 42
35 32
10 9
16 17
0
10
20
30
40
50
60
70
80
90
100
at station on train
p
arti
cip
ants
Dont knowNot applicable
Very unclear (cant make out muchor anything that is said)
Not very clear (cant make out allthat is said)
Very clear
Base 1049
Participants who thought the TOC had handled the disruption well found the PA announcements both at the station and on the train significantly clearer than those who thought this was handled poorly
Figure 51 Clarity of PA announcements at the station
18
17
42
24
12
3
22
63
0 10 20 30 40 50 60 70 80 90 100
Don`t know
Very unclear
Not very clear
Very clear
participants
Well handled
Poorly handled
Base 234 (well) 397 (poorly)
61
ndash -
-
Figure 52 Clarity of PA announcements on the train
18
15
37
29
11
4
23
62
0 10 20 30 40 50 60 70 80 90 100
Don`t know
Very unclear
Not very clear
Very clear
participants
Well handled
Poorly handled
Base 234 (well) 397 (poorly)
Summary
When experiencing disruptions most participants sought information through apps or websites and half of them used more than one source 10 used none The most popular method to obtain information during disruption was the National Rail Enquiries website
There seems to be a general distrust in information sources though overall PA announcements were the most trusted sources of information and they were seen as essential by more than half the participants The top five most trusted sources of information are linked directly to rail staff whether this is through PA announcements displays or members of staff Interestingly apps and websites were not as trusted as the more traditional means
Key to information via PA announcements during disruptions is timeliness 0 5 minutes was the preferred interval for around three quarters at stations and two thirds on trains The clarity of the announcements was poor with the majority assessing the PA announcements unclear at both stations and on trains
PA announcements are used trusted and seen as essential Therefore it is very important that they are frequent (every 0 5 minutes) and clear when there are disruptions
62
5 The Impact of Disruption
Behavioural and Sentimental Responses to Disruption
Qualitative stage participants reported a number of stress factors when considering the impact disruptions have on them Although there were a number of factors that impacted real-time stress levels delivery of information was the key driver of stress levels Where information was provided stress levels went down whereas a lack of information resulted in escalated stress levels
Case study 9 LiveMinds exercise
ldquoI travelled from Smethwick Galton Bridge to Birmingham Snow Hill and the train was due at 1722 There was an announcement that this train would be 3 minutes late Looking at the display information sign I could see that it then became 4 minutes then 5 minutes and each time the clock would go forward as to expecting time it eventually came 7 minutes late My anxiety increased with each minuterdquo
Birmingham Leisure
Factors that impacted stress levels negatively were
No information Ever increasing delays Finding out about delay on the train Length of delay Frequency of delays Impact on personalwork life
Factors that helped bring stress levels down were
Information to plan alternative route Predictive information Proactive information eg finding out at homebefore interchange
There was an overarching preference for Train Operating Companies to manage expectations with accurate timetables even if the journey time is slower For customers
63
managed expectations meant manageable stress levels Knowing that their train would arrive at the timetabled time was important for onward planning and for prompt arrival at work Ongoing predictable delays for commuters elevated frustrations and stress levels began to escalate after every minute that the train is held This then led to
A general sense of mismanagement Erosion of confidence in the network Modal shift to road
They also reported other factors impacting dissatisfaction with rail travel such as cleanliness and availability of toilets overall costs seat availability and safety but poor resolution of disruptions has a significantly negative influence on stress levels
On the emotional side participants reported of
In the moment anxiety of not knowing where to gowho to ask Stress of homelife eg more pressure on childcare Lower confidence from missing out on meetings Unprofessional embarrassing ndash negative impact on self-worth Fear when left at stations late and in the dark
Practical implications included
Missed connecting trains Missed meetings Missed parties Missed life changing appointments No-one to pick up children
Financial impact was felt in the form of
Loss of earnings (commutersbusiness travellers) Inability to work on train (business) Nursery fees Taxi fares Cost of car park Cost of drinksbreakfast
ldquoI was terrified and will never use that train againrdquo St Albans Leisure
ldquoI had to make up the time so it made me tired all the timerdquo London Commuter
ldquoNo -one seemed to know what they are doing and thatrsquos what happens each timerdquo ldquoEvery day itrsquos at least 3 minutes late arriving at New Street
Birmingham Commuter
64
Figure 53 Impact of disruption
Quantitative survey participants were asked about the emotional financial and practical impacts the disruption had caused them
A third of the impacts cited were emotional 48 were practical and 18 were financial On average 38 impacts were mentioned by each participant The main impacts were stress with respect to work arriving home late and missed meetings
8
1
4
5
5
7
8
8
10
10
10
11
13
14
16
21
24
25
29
32
51
55
0 10 20 30 40 50 60 70 80 90 100
None of the above
Lost my passenger assist
Nursery fees
Fear
Cost of car parking
No-one to pick children up
Had to buy a new rail ticket
Lost seat reservation
Stressworry for person collecting me
Cost of drinksfood
Missed follow-on transport
Taxi fares
Inability to work on train
Loss of earnings
Missed social event
Missed appointment
Stress on homelife
Anxiety of not knowing where to go
Missed connecting trains
Missed meeting
Arrived home late
Stress with respect to work
participants
Emotional impact
Practical impact
Financial impact
No impact
Base 1049 more than one answer could be given so percentages add up to more than 100
Quantitative survey participants with a disability experienced more emotional impacts of the disruptions than those without Particularly those with mental health issues or a social disability reported on this
In addition younger age groups were more effected emotionally than older age groups More than six out of ten of 16 to 35-year olds were more stressed with respect to work and more than a third of them experienced anxiety of not knowing where to go or who to ask
65
Figure 54 Emotional impacts by purpose
Base 388 (16-35) 674 (commuting) 205 (business) 138 (leisure) more than one answer could be given so percentages add up to more than 100
Figure 55 Practical impacts by purpose
Base 388 (16-35) 674 (commuting) 205 (business) 138 (leisure) more than one answer could be given so percentages add up to more than 100
Summary
Participants were asked about the emotional financial and practical impacts the disruption had caused them
66
33 cited emotional impacts 48 practical impacts and 18 financial impacts On average 38 impacts were mentioned by each participant The main impacts were stress with respect to work (55) arriving home late (51) and missed meetings (32)
Compensation and Redress
Qualitative stage participants were asked about their attitudes to compensation for tickets Although they welcomed Delay Repay they felt that currently this was not efficient or effective enough They welcomed
TOCs do mention it or give out forms Gets you part of your money back Once itrsquos set up itrsquos relatively easy Additional compensation (outside of Delay Repay) for ongoing timetable changes
However they thought the service needs improving because
It puts the onus on the customer The process feels cumbersome and daunting Lack of consistency across TOCs Suspect the TOC will quibble and doubts that any money will actually be repaid Itrsquos based on individual journey delays vs whole trips eg missed connections
ldquoI got over pound400 back and that was good but my season ticket is pound4500k and it doesnrsquot really account for the wider impact on my liferdquo
St Albans Depth Interview
ldquoSo I missed my connection at Watford Junction to Northampton because of a significant delay from Euston but I only could claim the first bitrdquo
St Albans Business
There was an overwhelming preference for a compensation ethos that makes customers feel valued regardless of journey purpose The minimum expected compensation would be money back for the ticket cost
Qualitative stage participants would begin to value the compensation if they received something unexpected andor if the compensation would take into account spend during the delay It was also felt that automatic refunds should be possible where travellers had purchased an e-ticket or a mobile ticket and where the TOC already had the relevant bank details to refund the costs Participants were looking for automatic compensation that demonstrates that the customer is valued and which might include multiple minimal journey disruptions eg five delayed journeys in one month
67
ldquoI just have to think about Amazon and the way that they give you your money back without even asking for the productrdquo
St Albans Commuter
ldquoThey know you donrsquot really have an alternative so it feels like they feel that they donrsquot have to do thisrdquo
London Commuter
Quantitative survey participants were asked whether if the disruption to the rail service they experienced was long enough to warrant compensation which of the following means would they prefer to find out about it
Announcement at the station Announcement on the train Display at station Display on train Member of staff on the platform Member of staff at the station Member of staff on the train National rail app Trainline app An email or text alert Social Media (eg Facebook or Twitter) A claim form handed to you on the train
Announcements on the train (55) and at the station (46) were the two preferred means
On average 34 sources were mentioned by each participant
68
Figure 56 If the disruption to the rail service experienced was long enough to warrant compensation which of the following means would they prefer to find out about it
4
8
19
20
22
23
24
25
26
31
32
46
55
0 10 20 30 40 50 60 70 80 90 100
Other
Social Media (eg Facebook or Twitter)
Trainline app
Member of staff at the station
Member of staff on the train
Display on train
National rail app
A claim form handed to you on the train
Member of staff on the platform
An email or text alert
Display at station
Announcement at the station
Announcement on the train
participants
Base 1049
Summary
If the disruption to the rail service was long enough to warrant compensation the preferred means of hearing about it were announcements on the train (55) announcements at the station (46) display at the station (32) and an email or text alert (31)
Best in Class
Qualitative stage participants were also asked about lsquoBest in Classrsquo examples for customer service to help TOCs to understand what could be done to improve this Key to thinking of brands as lsquoBest in Classrsquo was consistency in their service recovery strategies Whilst some airline companies were mentioned here no rail company was mentioned amongst lsquoBest in Classrsquo examples The list of lsquoBest in Classrsquo companies included telecoms leisure technology and rail companies such as Amazon Apple British Airways EE John Lewis MampS Premier Inn and Sonos14 Their commonalities were that they were easy to speak to they took responsibility resolved issues speedily showed flexibility proactive communication had a human touch refundedcompensated immediately and offered surprise vouchers
The blueprint of good service for TOCs as seen by qualitative stage participants is demonstrated in Figure 57 below
14 Other companies mentioned here included BT Delta Airlines JD Wetherspoons Sky and TGI Fridays
69
Figure 57 Best in Class Blueprint
The overarching implications for TOCs then come in three levels measures that are expected to be implemented if these are not already in place followed by a level of measures that would increase customersrsquo opinion of the TOCs and a third level which would really improve how customers see TOCs in the time of delay
Measures that are expected to be implemented Human face ndash approachable professional flexible Be polite take responsibility and apologise Do not make use internal operational issues as justification eg staffing No excuses
Measures that would increase customersrsquo opinion of the TOCs Ability to check disruption status through real time platform Provide realistic timing updates Make us comfortable Prompt payment of compensation Provide monetary compensation where appropriate Make it easy to report delays Provide ongoing text messages with status updates
Best in Class Do something unexpected eg vouchers for a free train ride free drinks Provide live chat messaging feed Proactive communication Automatic compensation
70
Case study 10 LiveMinds exercise
71
Appendix A
Questionnaire
Introduction
Thank you very much for agreeing to complete this on-line survey which is being conducted by Accent on behalf of the Department for Transport The closing date for completion of this survey is 16 July 2019
Anyone completing the questionnaire will be eligible for a pound5 voucher
We will just ask you a couple of questions to check that you are eligible to take part in this research
Any answer you give will be treated in confidence in accordance with the Code of Conduct of the Market Research Society If you would like to confirm Accentrsquos credentials type Accent in the search box at httpswwwmrsorgukresearchbuyersguide
IF MOBILE DEVICE SHOW This survey is best undertaken on a tablet or a PC If you do use a smartphone you can switch between desktop mode and mobile mode at any time by clicking the button at the bottom of the screen
For the purposes of administering the questionnaire and for analysis we may collect demographic information You do not have to answer any questions that you do not wish to and if you do you can withdraw your consent for us to process this information at any time Any personal data collected over the course of this survey will be held securely and will not be shared with any third party unless you give permission (or unless we are legally required to do so) Our privacy statement is available at wwwaccent-mrcomprivacy
Do you agree to proceeding with the survey on this basis Yes No THANK AND CLOSE
PLEASE ENTER THE UNIQUE CODE THAT IS PRINTED ON THE POSTCARD
ALLOW FOR SIX FIGURE ALPHA NUMERIC CODE
Q1 This questionnaire is about disruptions to your rail service and the information provided to you when that happens For the purposes of this research rail disruptions include delays (including repeated shorter delays) cancelled trains overcrowding meaning you couldnrsquot board the train and unplanned station closures
In the last month have you experienced any of the following disruptions to your rail journeys TICK ALL THAT APPLY
continued short delays of up to 5 minutes to regular journeys
a disruption of 5-19 minutes a disruption of 20 minutes-60 minutes a disruption of over 60 minutes none of the above THANK AND CLOSE
Q2 IF Q1 HAS MORE THAN ONE RESPONSE ASK Which was the most recent
IF Q1_1=1 SHOW continued short delays of up to 5 minutes to regular journeys IF Q1_2=1 SHOW a disruption of 5-19 minutes IF Q1_3=1 SHOW a disruption of 20 minutes-60 minutes IF Q1_4=1 SHOW a disruption of over 60 minutes
Q3 When did you last experience Q2Q1 IF ONLY ONE RESPONSE AT Q1
Today Yesterday 2-6 days ago 1-2 weeks ago 3-4 weeks ago More than a month ago THANK AND CLOSE
Main Questionnaire Thank you you are in scope for the survey The questionnaire will take about 15 minutes to complete
Q4 Any data collected over the course of this interview that could be used to identify you such as your name address or other contact details will be held securely and will not be shared with any third party unless you give permission (or unless we are legally required to do so)Our privacy statement is available at wwwaccent-mrcomprivacy
Do you agree to proceeding with the interview on this basis
Yes No THANK AND CLOSE
For convenience you can stop and return to complete the questionnaire as many times as you wish although once submitted you will not be able to enter again
Q5 Please describe your most recent disrupted rail journey below
Q6 What was the boarding station LIST OF STATIONS
Q7 What was the destination station LIST OF STATIONS
Q8 What was the main purpose of the train journey Commuting (including commuting for education) Business (including personal business such as job interviews dentist appointment etc) Leisure (including shopping visiting friends or relatives etc) Other (please type in)
Q9 Which train company operated the train service (If you travelled with more than one train company then you should select the company you travelled on for longest)
Transport for Wales Caledonian Sleeper c2c Chiltern Railways CrossCountry East Midlands Trains Gatwick Express Grand Central
Great Northern Great Western Railway Greater Anglia Heathrow Express Hull Trains London Northeastern Railway (LNER) London Northwestern Railway London Overground Merseyrail Northern ScotRail Southeastern Southern South Western Railway Stansted Express TfL Rail (excluding underground) Thameslink TransPennine Express Virgin Trains West Coast West Midlands Railway Dont know Other (please type in)
Q10 When did you first find out about the disruption
Before I reached the station When I arrived at the boarding station When I was on the train At an interchange station Other (please type in)
Q11 Where were you delayed TICK ALL THAT APPLY
IF Q10=4 DONrsquoT SHOW At the boarding station On the train At an interchange station At another station along the routejourney Other (please type in)
Q12 How long was the delay
helliphellip minutes
Q13 And how long was the rail journey scheduled to take
helliphellip minutes
Q14 What was the nature of the disruption
Problem with the train (eg faulty train waiting for a platform no driver) Infrastructure (eg signalling problem broken rail overhead wire problems unplanned station closure) Engineering works (eg emergency engineering works planned engineering work over running) External factors (eg person on the line vandalism passenger taken ill obstruction on the line) Weatherseasonal factors (eg flooding leaves ice) Service issues (eg Train congestion last minute platform changes overcrowding due to latecancelled trains) No reason given Other (Please type in) Dont knowcant remember
Q15 Was the train cancelled
Yes No
Q16 IF Q11_1=1 (DELAY AT BOARDING STATION) ASK Where did you wait at the station during the delay
At the platform On the concourse In a waiting room In a cafeacute On the train At a shelter Other (please type in)
Q17 Was this a comfortable place to wait
Yes No
Q18 IF Q16_3ltgt1 AND IF Q16_4ltgt1 (DIDNrsquoT WAIT IN WAITING ROOM OR CAFEacute) ASK Was there a waiting room or cafeacute you could have waited in
Yes No
Q19 IF Q11_3=1 (DELAY AT INTERCHANGE STATION) ASK Where did you wait at the station during the delay
At the platform On the concourse In a waiting room In a cafeacute At a shelter Other (please type in)
Q20 Was it a comfortable place to wait
Yes No
Q21 IF Q19_3ltgt1 AND IF Q19_4ltgt1 (DIDNrsquoT WAIT IN WAITING ROOM OR CAFEacute) ASK Was there a waiting room or cafeacute you could have waited in
Yes No Donrsquot know
Q22 IF Q15=2 ASK Thinking about the most recent rail disruption you experienced how did you feel when you first found out there was a disruption TICK ALL THAT APPLY IF Q15=1 ASK Thinking about the most recent rail disruption you experienced how did you feel when you first found out there was a cancellation TICK ALL THAT APPLY
RANDOMISE ORDER Uncertain Frustrated Anxious Angry Scared Stressed
Resigned Calm In control Content Determined Tired Other (please type in)
Past and current experiences of messaging during disruption Q23 Again thinking about the most recent rail disruption you experienced how do you rate how the rail
company handled the disruption
Very well Well Neither Poorly Very poorly Dont knowNo opinion
Q24 Overall how would you rate the information provided about that disruption
Very good Good Neither Poor Very poor Dont knowNo opinion
Q25 How would you describe the information provided about that disruption TICK ALL THAT APPLY
RANDOMISE ORDER Useful Helpful Informative Adequate Clear Timely Inadequate Inaccurate Insufficient Too infrequent Unclear No information given GO TO Q27 Other (please type in)
Q26 How would you describe the tone of the information provided about that disruption TICK ALL THAT APPLY
RANDOMISE ORDER Apologetic Rude Indifferent Lacked care Lacked respect Cared about my needs Acknowledged the inconvenience Easy to understand Informative
No information received Other (please type in)
Q27 And thinking more generally about when there are disruptions to your rail service how do you rate the information you received about the disruption
Very good Good Neither Poor Very poor Dont knowNo opinion
Q28 IF Q27=1 OR 2 ASK What information was good IF Q27=4 OR 5 ASK What information was bad
Q29 In the last six months have you experienced any rail disruptions when things were handled particularly badly
Yes PLEASE DESCRIBE No
Q30 In the last six months have you experienced any rail disruptions where a train company excelled in the way they handled the disruption (including the information they gave you)
Yes PLEASE DESCRIBE No
Q31 Thinking about when you experience disruptions on other forms of transport such as air the Underground or coach do you have any examples where the disruption was handled particularly well (including the information you received during this time)
Yes PLEASESTATE THE FORM OF TRANSPORT ANDDESCRIBE IN WHAT WAY IT WAS GOOD No
Timeliness of delivery The next set of questions are about when and where the information about the rail disruption was delivered
Q32 And where did you first receive information about the disruption
PA announcements at station PA announcements on train Display at station Display on train Member of staff on the platform Member of staff at the station Member of staff on the train National Rail app Trainline app Rail company app (please specify) Other travel app (please specify) Facebook Twitter Family friend or fellow traveller Other (please type in)
Donrsquot know
Q33 From which if any of the following sources do you remember receiving information about the disruption during your disrupted journey TICK ALL THAT APPLY
PA announcements at station PA announcements on train Display at station Display on train Member of staff on the platform Member of staff at the station Member of staff on the train National Rail app Trainline app Rail company app (please specify) Other travel app (please specify) Facebook Twitter Family friend or fellow traveller Other (please type in) No information received GO TO Q35 Donrsquot know GO TO Q35
Q34 And how did you feel when you first received the information TICK ALL THAT APPLY
RANDOMISE ORDER Uncertain Frustrated Anxious Angry Scared Stressed Resigned Reassured Calm In control Informed Pleased Relieved Other (please type in)
Q35 When you travel by rail do you actively listen for any announcements at the boarding station
Yes always Only if I think there may be a delay or disruption No My station doesnrsquot have a PA system Other (please type in)
Q36 And do you actively listen for announcements on the train
Yes always Yes only when I can hear them Only if I think there may be a delay or disruption No Other (please type in)
Q37 If you are on a train that seems to be running slower than it should be or stops between stations how quickly do you want to receive information about the delay
Type in helliphellip minutes
Q38 When there is a disruption to your rail service how often would you like announcements to be made
Type in Every hellipminutes
Q39 If announcements were made more often than every [Q38 answer] would that annoy you
Very much A little No
Q40 Sometimes there are no announcements made because the train company doesnrsquot have enough information In such situations would you prefer
a) an announcement made with very little or no information b) an announcement made once there is some information
Q41
Tone and content This section is about the tone and content of messages or information delivered when there are disruptions to your rail service
Q42 Overall when information is provided about disruptions which of the following styles would you prefer PLEASE PICK THE TOP THREE
RANDOMISE ORDER Clear = easy to hear and to understand Correct = factual and up to date Concise = short and regular Confident = genuine and honest Conciliatory = apologetic and empathetic Consistent = across different channels andor providers Personal = tailored to your circumstances Other (please type in)
Q43 Would your preference change if the disruption was particularly severe Imagine that you were taking a rail journey for Q8 [purpose] which was expected to last 1 hour However due to disruption your journey was now going to take 1 hour 45 minutes and that you had to change trains in order to reach your destination In that situation which of the following styles would you prefer PLEASE PICK THE TOP THREE
RANDOMISE ORDER Clear = easy to hear and to understand Correct = factual and up to date Concise = short and regular Confident = genuine and honest Conciliatory = apologetic and empathetic Consistent = across different channels andor providers Personal = tailored to your circumstances
Other (please type in)
Q44 Still imagine that you are making that journey and you arrived at the station to find out about the disruption What do you think you would do
Stay at the station waiting for updates Cancel the trip and go home Make the journey using another train Make the journey using another mode of travel Make the journey using an alternative route Leave the station and return later Other (please type in) Donrsquot know
Q45 IF Q44=1 ASK What is the longest you would be prepared to wait for this type of journey
Enter minutes
Q46 If the disruption was particularly severe which of the following would you like staff to do PLEASE PICK THE TOP THREE
Take responsibility Give you a named person for follow up Escalate to management Find me an alternative mode of transport to complete my journey Find me an alternative route to complete my journey Provide information on compensation Other (please type in)
Q47 What level of detail about the cause of the disruption would you prefer
Very detailed for example this train is running 25 minutes late because of damage to the overhead electric wires between Birmingham New Street and Longbridge caused by a falling tree Quite detailed for example this train is running 25 minutes late because of damage to the overhead electric wires between Birmingham New Street and Longbridge Not detailed for example this train is running 25 minutes late Donrsquot know
Q48 Again if the disruption was particularly severe which of the following would be most important to you
Information about the cause of disruption (eg the cause and how long it will last) An apology for the disruption Information about options (eg connections or alternative routes)
Q49 And the second most important
IF NOT TICKED AT Q48 Information about the cause of disruption (eg the cause and how long it will last) IF NOT TICKED AT Q48 An apology for the disruption IF NOT TICKED AT Q48 Information about options (eg connections or alternative routes)
Q50 Would you like to receive information about the causes of some of the disruptions such as signalling problems leaves on the line etc Some examples are shown below
httpswwwnetworkrailcoukrunning-the-railwaylooking-after-the-railwaydelays-explainedleaves httpswwwnetworkrailcoukrunning-the-railwaylooking-after-the-railwaydelays-explainedsignals-points-failure httpswwwnetworkrailcoukrunning-the-railwaylooking-after-the-railwaydelays-explainedvandalism-and-trespass etc
Yes No
Q51 IF Q50=1 ASK Some events can cause regular disruption to the railways Which of the following would you most like to receive further information on during instances of disruption to your journey TICK ALL THAT APPLY
Buckled rails Cable theft Engineering works Fatalities Flooding Knock-on delays Landslips Leaves Signals and points failure Snow and ice Vandalism and trespass None of the above Other (please type in)
Q52 IF Q50=1 ASK How would you like to receive such information TICK ALL THAT APPLY
Posters at stations Leaflets at stations In emails Notifications through messaging apps such as Facebook Messenger and WhatsApp Member of staff on the platform Member of staff at the station Member of staff on the train On National Rail Enquiries website On travel apps Announcements on trains (eg Did you knowhellip) On social media Text message Other (please type in)
Q53 How important is it to you that the train company apologises for the disruption
Very important Quite Important Not so important Not at all important Donrsquot know
Q54 Please say whether you agree or disagree with the following statements about rail disruptions
a) Sometimes the train company is deliberately evasive about the reasons for disruptions
b) There should be an apology given for any disruption however short it is
Strongly agree Agree Neither Disagree Strongly disagree
Q55 How important is to you that the train company is honest even if that means saying they do not know what is happening
Very important Quite Important Not so important Not at all important
Delivery mechanisms This section is about how information is provided when there are disruptions to your rail service
Q56 Which if any of the following apps or websites do you tend to use when your journey is disrupted TICK ALL APPLICABLE
None GO TO Q58 Rail company website Rail company app (please specify) Other travel app (please specify) National Rail Enquiries website Facebook Twitter Trainline or other booking site Friend family or fellow traveller Other (please type in) Dont knowcant remember GO TO Q59
Q57 IF MORE THAN ONE MENTIONED AT Q567 ASK Which of these do you use the most TICK ONE ONLY
IF Q56_2 = 1 Rail company website IF Q56_3 = 1 Rail company app IF Q56_4 = 1 Other travel app IF Q56_5 = 1 National Rail Enquiries website IF Q56_6 = 1 Facebook IF Q56_7 = 1 Twitter IF Q56_8 = 1 Trainline or other booking site IF Q56_9 = 1 Friend family or fellow traveller IF Q56_10 = 1 Other Dont knowcant remember
Q58 Which if any of the following do you trust most for information about disruptions TICK ALL APPLICABLE
PA announcements at station PA announcements on train Display at station Display on train Member of staff on the platform Member of staff at the station Member of staff on the train National Rail app Trainline app Rail company app (please specify) Other travel app (please specify) Email or text alert Facebook Twitter Travel news updates on radio or television Friends or family
Other (please type in) None of the above GO TO Q61
Q59
Q60 Why do you trust lsquoQ58rsquo most for getting information about disruptions
Q61 When there are disruptions how much do you value PA announcements at the station
They are essential They are important They are not so important They are not at all important
Q62 And how much do you value PA announcements on the train
They are essential They are important They are not so important They are not at all important
Q63 How often should PA announcements about disruptions to the rail service at the station be repeated
Type in helliphellip minutes
Q64 And how often should PA announcements about disruptions to the rail service on the train be repeated
Type in helliphellip minutes
Q65 Thinking about your most recent disrupted rail journey how easy to understand were the announcements about the disruption at the station
Very clear Not very clear (canrsquot make out all that is said) Very unclear (canrsquot make out much or anything that is said) Donrsquot knowNot applicable
Q66 And how clear were the announcements about disruption on the train
Very clear Not very clear (canrsquot make out all that is said) Very unclear (canrsquot make out much or anything that is said) Donrsquot knowNot applicable
Q67 How important is it to you that you are able to see rail staff when there are disruptions to the rail service
Essential Quite important Not so important Not at all important
Behavioural and sentimental responses to information Q68 Thinking about the recent disruption to your rail service did you experience any of the following
Emotional impacts Anxiety of not knowing where to gowho to ask Stress on homelife (eg childcare) Stress with respect to work (eg because late or missing meetings appointments etc) Fear (eg being alone at stations at night) Stressworry for the person collecting me from the station Other emotional impact (please type in)
Financial impacts Loss of earnings Had to buy a new rail ticket Inability to work on train Nursery fees Taxi fares Cost of car parking Cost of drinks andor food Other financial impact (please type in)
Practical impacts Missed connecting trains Lost seat reservation Lost my passenger assist Missed follow-on transport (eg air ferry bus) Missed meeting Missed social event Missed appointment Arrived home latelater than anticipated No-one to pick children up Other practical impact (please type in)
None of the above
Compensation and redress Q69 If the disruption to the rail service you experienced was long enough to warrant compensation
which of the following means would you prefer to find out about it TICK ALL THAT APPLY
Announcement at the station Announcement on the train Display at station Display on train Member of staff on the platform Member of staff at the station Member of staff on the train National rail app Trainline app An email or text alert Social Media (eg Facebook or Twitter) A claim form handed to you on the train Other (please type in)
Q70
Classification Questions Finally would you please answer some questions about yourself You do not have to answer any of these questions that you do not wish to and if you do you can withdraw your consent for us to process this information at any time The personal information you provide during this survey will be held securely and will not be shared with any third party unless you give permission (or unless we are legally required to do so) Our privacy statement is available at wwwaccent-mrcomprivacy
It will be used by Accent only for this study which is being undertaken for the Department for Transport
Q71 Which of the following age groups are you in
16-25 26-35 36-45 46-55 56-59 60-64 65 or more Prefer not to answer
Q72 What is your gender
Male Female In another way (please type in) Prefer not to answer
Q73 Are you affected by any physical or mental health conditions or illnesses lasting or expected to last 12 months or more
No none Yes Vision (eg blindness or partial sight) Yes Hearing (eg deafness or partial hearing) Yes Mobility (eg only able to walk short distances or difficulty climbing stairs) Yes Dexterity (eg difficulty lifting and carrying objects or using a keyboard) Yes Learning or understanding or concentrating Yes Memory Yes Mental health Yes Stamina or breathing or fatigue Yes Socially or behaviourally (eg associated with autism attention deficit disorder or Aspergerrsquos syndrome) Other (please type in) Prefer not to say
Q74 IF Q73=YES ASK Do you have any have specific requirements that would make the experience of experiencing disruptions less stressful or easier to manage
No comment
Q75 Do you have any other comments you would like to make about rail disruptions
No comment
-Prepared by Accent Chiswick Gate 598 608 Chiswick High Road London W4 5RT
Registered in London No 2231083 Accent Marketing amp Research Limited Registered Address 30 City Road London EC1Y 2AB
- Title Page
- Contents
- Executive Summary
- 1 Introduction
- 2 Methodology
- 3 Experiences of Past Delays and Handling of Disruption
- 4 Information During Disruption
- 5 The Impact of Disruption
- Appendix A Questionnaire
-

Although this report was commissioned by the Department for Transport (DfT) the findings and recommendations are those of the authors and do not necessarily represent the views of the DfT The information or guidance in this document (including third party information products and services) is provided by DfT on an as is basis without any representation or endorsement made and without warranty of any kind whether express or implied
The Department for Transport has actively considered the needs of blind and partially sighted people in accessing this document The text will be made available in full on the Departmentrsquos website The text may be freely downloaded and translated by individuals or organisations for conversion into other accessible formats If you have other needs in this regard please contact the Department
Department for Transport Great Minster House 33 Horseferry Road London SW1P 4DR Telephone 0300 330 3000 General enquiries httpsformsdftgovuk Website wwwgovukdft
Crown copyright 2021
Copyright in the typographical arrangement rests with the Crown
You may re-use this information (not including logos or third-party material) free of charge in any format or medium under the terms of the Open Government Licence v30 To view this licence visit httpwwwnationalarchivesgovukdocopen-government-licenceversion3 or write to the Information Policy Team The National Archives Kew London TW9 4DU or e-mail psinationalarchivesgsigovuk
Where we have identified any third-party copyright information you will need to obtain permission from the copyright holders concerned
Rail Passenger Experience of Disruption Handling
February 2021
Contents
EXECUTIVE SUMMARY i
1 Introduction 8
Background 8
Objectives 8
2 Methodology 10
Introduction 10
Qualitative Methodology 10
Quantitative Methodology 12
3 Experiences of Past Delays and Handling of Disruption 13
Disruptions Experienced 13
Waiting During Disruption 23
Handling of the Disruption 29
4 Information During Disruption 33
Reception of Information 38
Additional Information during Disruption 47
Delivery Mechanism of Information 56
5 The Impact of Disruption 63
APPENDIX A Questionnaire
APPENDIX B Fieldwork Details
Behavioural and Sentimental Responses to Disruption 63
Compensation and Redress 67
Best in Class 69
Executive Summary
Introduction
In March 2019 the Department for Transport (DfT) commissioned research to explore passengersrsquo needs during times of unplanned rail disruptions The aim of the project was to explore the needs of rail passengers from across Great Britain when they experience unplanned delays and disruption on the rail network The project incorporated a two-staged approach consisting of qualitative (journey diaries pre-tasked discussion groups and depth interviews) and quantitative (a large scale self-completion survey of disrupted travellers) methods Overall 85 travellers contributed to the qualitative stage with a further 1790 passengers entering the survey
MAIN FINDINGS1
Waiting during disruption
Most passengers waited on the platform if they experienced disruption at their boarding station or the interchange station Very few passengers waited in a waiting room or shelter
Only 38 of passengers reported that the wait was comfortable with 62 saying their wait during disruption was uncomfortable
Passengers were more likely to feel comfortable if they waited on the train or in a cafeacute or waiting room The longer the delay at the boarding station the more uncomfortable it was perceived to be 78 of passengers who experienced a delay of 60 minutes or more said their wait was uncomfortable This compares to 57 of passengers who said their wait of less than 5 minutes was comfortable
Handling of the disruption
Handling of the disruption by the TOC was perceived as poor or very poor by 38 of passengers with only 22 thinking it was handled well Longer disruptions contributed to poor ratings as did cancellations
1 This section refers to the quantitative phase only Throughout the report findings from the qualitative stage are interwoven However findings from both stages are very similar across the different aspects tested
5
Overall the information given during the disruption was perceived as negative 95 gave negative comments (eg 26 insufficient 19 unclear 19 inadequate 15 no information given) and 42 gave positive comments (eg 13 clear 9 useful 8 informative)
45 rated the information provided as poor
or very poor 25 rated the information as good or very good for example reason given for the disruption (32) and the length of delay (17)
Reception of information
39 of passengers first noticed information about the disruption via a display at the station 18 via an announcement on the train and 16 via announcements at the station
Passengers said that apps and websites are relatively unimportant sources of information on disruptions just 13 first learned about the disruption through those means
About three quarters of passengers would like information to be disseminated every 0 to 5 minutes for a slow running service or for a disruption However this is dependent on the nature of the journey being made and the length of journey
Four fifths preferred that an announcement was made with very little or no information than having to wait until there was some information
Additional information required during disruption
Even if the disruption was very severe only 5 of passengers said they would abandon the journey
During severe disruptions the most required information was about connections or alternative routes as well as the cause of disruption
For both normal and severe disruptions participants most want lsquocorrectrsquo (30) and lsquoclearrsquo (25 for normal 23 for severe) information 61 prefer very detailed information on the disruption and 37 quite detailed information
80 said it was very important that the train company be honest even if that means saying they do not know what is happening 80 wanted additional information on causes of disruption with signal and points failures (71) engineering works (67) and knock-on delays (62) the most sought-after information
6
Across the groups and depths interviews commuters were the group that experienced most delays Although they were familiar with alternatives they still wanted to be advised of what to do in case of a disruption
Even though participants in the qualitative stage showed different behaviours in journey planning at the point of disruption information needs are very similar In addition participants with particular needs required much of the same information but reported that they need more time to actionprocess
Delivery mechanism of information
During disruptions most seek information through apps or websites and half use more than one source 10 didnrsquot use any
There was a general distrust in information sources
PA announcements were the most trusted sources of information and they were seen as essential by more than half the participants
Behavioural and sentimental responses to disruption
33 cited emotional impacts 48 practical impacts and 18 financial impacts from disruption
The main impacts were stress with respect to work (55) arriving home late (51) and missed meetings (32)
Leisure travellers were often unfamiliar with routes This meant that disruptions often unsettled them and resulted in stress around missing events arriving in the dark and personal safety
7
1 Introduction
Background
How TOCs handle delays is of paramount importance to rail passengers so much so that according to the National Rail Passenger Survey (NRPS)2 it has the biggest impact on overall passenger dissatisfaction
NRPS data shows that in spring 2019 just 40 of delayed passenger journeys were rated as satisfactory for the way in which Train Operating Companies (TOCs) dealt with delays when they occurred There are large variations in the performance of TOCs during disruption as well as geographic variations in passenger satisfaction when things go wrong
However the last time any tailored research was undertaken on this subject was in 2014 when the Office of Rail and Road (ORR) commissioned Transport Focus to undertake research into passengersrsquo experiences of information handling during delays and disruption Transport Focus concluded that improvements were not being seen by passengers in the availability of information during delays and disruption The most important information for delayed passengers was understanding the impact of a disruption on their journey
This work was the last time a significant TOC wide assessment was conducted on this subject (although the ORRrsquos annual Measuring Up report analyses some aspects of the communication between passengers and TOCs)
When continued significant delays occur on the rail network understanding how best to handle disruption is paramount As such the DfT commissioned Accent to undertake research to explore passengersrsquo needs during times of unplanned rail disruption and how Train Operating Companies (TOCs) communicate with passengers during periods of delay on the rail network
The aim of the project was to explore the needs of rail passengers from across Great Britain when they experienced delays and disruption on the rail network The project captured passengersrsquo real-time experience of unplanned disruption to inform rail policy
Objectives
The aim of the research was to explore the needs of rail passengers from across Great Britain when they experience unplanned delays and disruption on the rail network The project captured passengersrsquo real-time experience of unplanned disruption
The objectives for the overall study were
2 The NRPS surveys more than 50000 passengers each year to give a network-wide picture of rail passengersrsquo satisfaction with rail travel
8
To explore perceptions of how TOCs handled recent periods of severe disruption especially the wintery weather in March 2018 and the changes to timetabling in May 2018
To capture any examples of best practice the industry could learn from when faced with handling rail disruption
To explore what passengersrsquo expectations are in terms of customer service delivery and information provision when delays occur
To understand the different sources of information passengers access at different journey stages and which of these information sources they trust most
To provide a clear and detailed recommendation as to the most appropriate actions the industry can take to meet the needs of rail passengers when they are delayed
To recommend any messaging approaches related to disruption that passengers find more or less informative as well as how the tone and timing of messages impact on different groups of passengers
9
2 Methodology
Introduction
The approach was two-staged
Qualitative journey diaries pre-tasked discussion groups and depth interviews
Quantitative a large scale self-completion survey of travellers during a disrupted rail journey or who had recently experienced a disruption
Figure 1 Research Approach
Qualitative Methodology
As one of the critical elements of this research was to understand the emotional consequence of any journey disruption and the specific information and messaging that was required at a particular journey moment a real-time methodology was adopted The LiveMinds mobile app was used by participants to record their experience of rail journey disruptions as they happened
Eighty-five passengers were recruited to use the app for three weeks prior to attending a discussion group The sample was chosen to ensure that a range of journeys were captured and
to optimise the chance of picking up journey disruptions Through the app simple questions relating to the journey and the disruption experience (where they look for information helpfulness of staff extent of TOC ownership) were asked as well as questions around information needs and how information needed to be delivered at specific pinch points
10
Following this Accent moderated eight two-hour discussion groups and eight face-to-face depth interviews with the 85 participants The face-to-face forum allowed for interrogations of the journey data and experiences collected in the three-week period via the app The groups took place in four different locations London Birmingham Manchester and St Albans Attendance was broken down by journey type (commuter business leisure) and distance and included participants who had experienced severe disruptions3 The eight in-home depth interviews covered customers with particular needs when travelling and took 45 minutes each They took place in the same cities as the discussion groups
A variety of techniques were used to dissect customersrsquo needs in both the groups and the depth interviews Key topics for both methods were their rail journey disruption experiences (eg waiting during disruptions information needs and information received) and best in class service models
Demographics of Qualitative Stage
Overall 85 travellers contributed to the qualitative stage 77 of these participated in discussion groups across four different locations and eight participants provided feedback in the form of face-to-face depth interviews
There was a mix of gender for all groups and the depths The groups were structured by customer type journey length and TOCs Figure 2 shows the structure of the discussion groups The groups took place between 11 and 19 March 2019
Figure 2 Qualitative fieldwork plan
3 For a fieldwork schedule of the qualitative stage see Figure 2
11
Quantitative Methodology
Survey Recruitment
Passengers were invited to take part through postcards distributed at stations The sampling focused on eleven stations where there was a relatively high likelihood of some disruptions such as London termini Birmingham New Street Manchester Piccadilly
Following a pilot at London Liverpool Street and London Victoria on 11 June 2019 the main stage took place between 2 July and 12 July 2019
Response Rate and Questionnaire Length
In total 1790 entered the survey equating to 16 of the cards handed out 172 were out of scope (because they had not experienced any delays) Of the 1618 in scope 1049 (65) completed and 569 did not A paper version of the questionnaire is attached as Appendix A
Demographics of Quantitative Sample
Completion of the survey link in the 11040 postcards handed out during quantitative fieldwork was left to fall out naturally There were no quotas and data has not been weighted
Overall the sample was made up of 52 male and 46 female participants (2 preferred not to answer this question) 79 of participants did not have a disability 7 had a physical or mental disability and 7 had mental health issues or a social disability 37 of participants were between 16 and 35 44 were between 36 and 55 and 18 were 56 or older
Our sample is comparable to the 2019 National Travel Survey (NTS) figures for rail users The NTS shows that males made slightly more rail trips than females in 2019 (24 compared to 21) and that users with mobility difficulties travelled less than those without and were particularly less likely to use rail On average they made 5 times fewer rail trips In addition the age spread is in line with the NTS figures with most rail trips being made by people aged between 20 and 50 Males made slightly more rail trips than females in 2019 (24 compared to 21) Users with mobility difficulties travelled less than those without and were particularly less likely to use rail On average they made 50 times fewer rail trips
12
3 Experiences of Past Delays and Handling of Disruption
Disruptions Experienced
Amongst quantitative survey participants the majority of travellers had experienced at least one disruption of 5-19 minutes (71) in the past four weeks4 The second most frequent disruption were continued short delays of up to 5 minutes (67) followed by a disruption of 20-60 minutes which half the participants experienced Under a fifth (18) experienced a disruption of over 60 minutes
Figure 3 Disruptions experienced in the past four weeks
18
50
67
71
0 10 20 30 40 50 60 70 80 90 100
A disruption of over 60 minutes
A disruption of 20 minutes-60 minutes
Continued short delays of up to 5 minutes toregular journeys
A disruption of 5-19 minutes
participants
Base 1049 more than one answer could be given so percentages add up to more than 100
Commuter journeys were significantly more often affected by delays than leisure journeys (except disruptions of 60 minutes or over) It is perhaps not surprising therefore that participants of 65 years or older were significantly less likely to have experienced delays than younger participants
4 Half the sample experienced a disruption in the past 24 hours another 31 experienced one in the last 2 to 6 days and the remaining 19 experienced the last disruption in the past one to four weeks
13
Figure 4 Delays experienced by age of participant
Base 388 (16-35) 464 (36-55) 127 (56-64) 59 (65+) more than one answer could be given so percentages add up to more than 100
Most Recent Disrupted Rail Journey
As a large proportion of quantitative survey participants had experienced more than one disruption Participants were asked to respond on the basis of their most recent disruption with 39 of passengers experiencing a disruption of 5-19 minutes 31 experienced continued delays of up to 5 minutes to regular journey 23 experienced a disruption of 20-60 minutes and 7 of participants said their disruption lasted over 60 minutes
To put into perspective the reasons for journey disruptions we asked about the nature of the most recent disruption experienced the length of the disruption and some other key aspects of the disruption For most of the remainder of the questionnaire participants were asked to focus on the most recent disrupted journey
For half of the sample the most recent disruption was experienced on that day or the day before 31 experienced a disruption to their journey within 2-6 days of completing the survey 14 within the past 2 weeks and 4 experienced a disruption between 3 and 4 weeks before completing the survey
In the qualitative stage participants spoke of recent improvements to the number of disruptions they experience However they felt that further improvements were needed still There was a sense that disruptions had settled from March-May 2018 when the timetable changed but there was still a considerable way to go
14
ndash
-
ldquoIt was complete and absolute chaos day after dayrdquo St Albans Depth interview
ldquoThe difference is that you donrsquot travel to the station expecting a delay there might be one but you are not expecting itrdquo
London Commuter
Case study 1 Thameslink
Who Female businesses traveller (45 64 years old) from Borehamwood When Uses train three times a week to go from Borehamwood to London St
Pancras What Ongoing timetable issues Problems encountered Delayed and cancelled trains inconsistency in information
(across app platform and station) dismissive staff continually late for work or late home)
Positives encountered Hot chocolate sachet
It was reported by some that in March-May 2018 they experienced disruptions every day on every service This coincided with a period of significant disruption on the rail network caused mainly by the weather due to the ldquoBeast from the Eastrdquo and the timetable changes in May 2018 During this time some passengers told us that information provision was very poor and staff were ill informed and nervous Passengers reported that they made choices about travelling by rail and often worked from home more or took alternative modes of transport to get to the office It had a significant impact on life and work for the participants
Although the level of disruption may have calmed down no consistent difference was perceived in the communications when there were disruptions During the fieldwork qualitative participants felt that disruptions still occurred but were less frequent Information provision was still perceived as poor and staff were still perceived to lack information resulting in continued lack of confidence in the services from passengersrsquo side
Purpose and Outcome of the Journey
Amongst quantitative survey participants the main purpose of the train journey of the most recently disrupted journey was commuting (64) followed by business (20) Leisure journeys formed the smallest purpose for travelling (13)
Looking at different age groups those aged 16-35 36-55 and 56-64 were significantly more likely to have experienced disruptions when commuting (72 68 and 51 respectively) Those travelling for business were significantly more likely to be 36-55 (23) or 56-64 (26) whilst almost 3 in 5 of the 65+ year old participants travelled for leisure
15
Figure 5 Purpose of disrupted journey
64
72
68
51
15
20
14
23
26
12
13
12
7
20
58
3
2
2
3
15
0 10 20 30 40 50 60 70 80 90 100
Total
16 to 35
36 to 55
56 to 64
65+
participants
Commuting Business Leisure Other
Base 1049 (total) 59 (65+) 127 (56-64) 464 (36-55) 388 (16-35)
In most cases the disruption did not result in a cancellation of the train (77) However 55 of disruptions caused by weather or seasonal factors5 were cancelled and 37 of journeys where problems with the train had caused disruptions were cancelled Service issues and when the disruption remained unexplained caused the small proportion of cancellations as Figure 6 shows
Figure 6 Proportion of cancellations by disruption cause
10
11
32
33
35
37
55
0 10 20 30 40 50 60 70 80 90 100
Service issues
No reason given
Engineering works
Infrastructure
External factors
Problem with train
Weatherseasonal factors
participants
Base 11 (weather) 120 (problem) 48 (external factors) 227 (infrastructure) 25 (engineering works) 283 (No reasons) 161 (service issues)
Cancellations had an impact on the satisfaction with how the individual TOCs handled the disruption 49 of participants who experienced a cancelled train rated the TOC experience of disruption as poor or very poor
5 Very low base n=11
16
Figure 7 Satisfaction with handling of disruption
26
15
23
23
29
34
13
17
4
5
4
6
0 10 20 30 40 50 60 70 80 90 100
Cancelled train
Total
participants
Very poorly Poorly Neither Well Very well Dont knowNo opinion
Base 1049 (total) 245 (cancelled train)
Nature of Disruption
Participants in the qualitative stage reported of a wide range of disruptions
Long Delays Overcrowding No First-Class carriages Slow running No seating Change of platform Ongoing small delays Short forming Cancellations Unexpected stop Changes to timetable
Regardless of the type of disruption qualitative participants wanted to feel in control and that they had choices to allow them to change their journey plans They showed more tolerance for disruptions that are lsquoout of Operator controlrsquo such as severe weather events powerlines suicide or trespassers and vandalism Operational issues such as staff shortagesno train driver leaves on the line last minute platform changes and train congestion6 received less tolerance as they were considered avoidable
In the LiveMinds app exercises participants discussed unintended consequences of disruptions such as extra childcare costs after missing nursery pick-up disagreements at home as spouses are waiting at the station work reputation eg continually being late for work missing out on work (missing an audition and therefore losing a part) missing social engagements such as a family party and losing property because of rushing through a station
Quantitative survey participants reported that when experiencing disruptions just under a third were not given a reason for their disruption (27) and of those disruptions a reason was given for problems with the infrastructure (22) and service issues (15) were the most common followed by problems with the train (11)
6 Other mentions here include wrong type of snow lack of foresight eg train delayed immediately after leaving a station giving people no chance for alternative and replacement bus services that donrsquot offer enough capacity
17
Figure 8 Reasons for most recent disruption
8
8
1
2
5
11
15
22
27
0 10 20 30 40 50 60 70 80 90 100
Dont knowremember
Other
Weatherseasonal factors
Engineering works
External factors
Problem with the train
Service issues
Infrastructure
No reason given
participants
Base 1049
The quantitative stage showed that problems with the train were reported significantly more often in journeys that were more than six minutes delayed with 20 reported problems causing a delay of 21-30 minutes Similarly infrastructure problems were reported significantly more often when journeys were delayed for more than 11 minutes with over half of reported problems causing a delay of more than 60 minutes The top three reasons for disruptions per delay length were
0-5 minutes delay 11-20 minutes 31-60 minutes No reason given (55) No reason given (22) Infrastructure (31) Service issues (17) Infrastructure (21) Other (15) Donrsquot know (13) Service issues (18) No reason given (14)
6-10 minutes 21-30 minutes 60+ minutes No reason given (34) Infrastructure (28) Infrastructure (58) Service issues (22) Train problems (22) Other (14) Train problems (11) No reason given (16) Train problems (11)
Base 0-5 minutes 160 6-10 minutes 250 11-20 minutes 302 21-30 minutes 155 31-60 minutes 118 60+ minutes 64
In contrast to this for over half of delays of less than five minutes no reason was given for the delay This dropped down to 34 for journeys of 6-10 minutes and to 22 for journeys delayed by between 11 and 20 minutes These differences were significantly different
Delay Length
The average length of delay experienced by quantitative survey participants was 24 minutes The distribution of delay length is shown below
18
Figure 9 Delay length
15
24
29
15
11
6
0 10 20 30 40 50 60 70 80 90 100
0-5 mins
6-10 mins
11-20 mins
21-30 mins
31-60 mins
60+ mins
participants
Base 1049
The qualitative stage explored the impact of disruptions7 Participants reported that the impact of disruptions on their lives went beyond the practical and often had emotional and financial consequences
Regardless of the length of journey qualitative participants felt that more than a few minutes of delay were unacceptable They felt equally as frustrated when the journey was delayed by a few minutes regardless of whether they were travelling from Manchester to London or from St Albans to West Hampstead8 There was a general sense of frustration around excuses for delays and a belief that trains should ldquosimply be on timerdquo
Case study 2 LiveMinds exercise
7 More on this can be found later in this report in part 311 Behavioural and Sentimental Responses to Disruption 8 However some of the Manchester audience appeared to accept longer delays on longer routes
19
20
Expected Journey Length
Asking quantitative survey participants about the most recent disruption experienced the scheduled journey time did not have a significant impact on length of the delay This reflected to a large extent the fact that the majority of journeys with disruption experiences were commuting journeys Figure 10 shows the distribution of scheduled journey length Figure 10 Scheduled journey length
2
5
22
18
31
22
0 10 20 30 40 50 60 70 80 90 100
0-5 mins
6-10 mins
11-20 mins
21-30 mins
31-60 mins
60+ mins
participants
Base 1049
Table 1 shows a matrix of delay length by scheduled journey length for quantitative participants This uses shading to indicate the highest proportions The most frequent delay length of 11-20 minutes occurred most often across all scheduled journey times Table 1 Matrix of length of delay by scheduled journey length
Length of delay
0-5 mins 6-10 mins 11-20 mins 21-30 mins 31-60 mins 60+ mins
sch
ed
ule
d jo
urn
ey
len
gth
0-5 mins 1 0
6-10 mins 1 1 2 1
11-20 mins 4 6 6 3 2 1
21-30 mins 3 4 6 3 2 1
31-60 mins 4 8 9 5 4 1
60+ mins 2 4 6 4 3 3
Base 1049 = less than 05
Journeys of a scheduled length of 60+ minutes saw the highest proportion of delays that lasted 60 minutes or longer Delays for shorter journeys were generally shorter Qualitative stage participants reported that they built in extra time for travelling in order to avoid being caught out due to disruptions This then often had an impact on their personal lives and personal value of time as it was often seen as missing an opportunity of doing other things Some participants reported that a steady erosion of confidence in disruption management meant that they were getting earlier trains to ensure they arrived
on time This then resulted in a re-evaluation of their value of time as loss of personal time Opportunity cost and financial implications were also considered when making a decision regarding train travel Participants reported that they traded in their personal time when experiencing delays travelling for example
Getting the earlier train to work everyday Setting off early from work for specific leisure events Travelling the night before for to get to the airportparty Leaving two hours to get to a meeting
ldquoIrsquom losing an extra hour every dayrdquo Manchester Commuter
ldquoIf I have to get somewhere that takes an hour ndash Irsquoll always take two hours and thatrsquos an hour I could be workingrdquo
St Albans Business
When Passengers First Heard of Disruption
The quantitative survey showed that disruptions were most likely to occur at the boarding station (67) followed by on the train (41) and at another station along the route (10) Only 7 of survey participants had a delay at an interchange station
Figure 11 Where disruption occurred
67
41
7
10
2
0 10 20 30 40 50 60 70 80 90 100
At the boarding station
On the train
At an interchange station
At another station along the routejourney
Other
participants
Base 1049
Commuting journeys were significantly more likely to be delayed on the train than leisure journeys (45 vs 31)
A delay whilst on the train was also experienced significantly more often when the nature of the disruption was a service issue (58) than when it was a problem with the train (43) external factors (32) or when no reason was given (39)
Only 7 of participants learned about the disruption to their journey before they reached the station With 67 of delays occurring are the boarding station there is clearly an
21
opportunity for more to be done in terms of letting passengers know their service is delayed (particularly as a large proportion are commuters Sixty-one per cent of participants found out about the disruption to their journey when they arrived at the boarding station A further 28 of participants found out while on the train and only 2 learned about this at an interchange station
Figure 12 Where first learnt of disruption
7
61
28
2
2
0 10 20 30 40 50 60 70 80 90 100
Before I reached the station
When I arrived at the boarding station
When I was on the train
At an interchange station
Other
participants
Base 1049
Cancellations occurred more often to trains where a disruption was noticed when arriving at the boarding station (68) than any other point of initial noticing of disruption
In the preceding six months 46 of participants had experienced rail disruptions when things were handled particularly badly and in the same time period only 14 had experienced disruptions where a TOC excelled in the way they handled the disruption
The examples of when TOCs excelled are
Good information provided - updates etc 6 Good customer servicerelations - vouchersdrinks offered 3 Staff are well-informedefficient 3 Onward travelalternative arrangements are good - information provided 2 Reclaim process good - offered refund etc 2 Good communication - clearconciseaccurate 2 Apology given 1 Timely information provided - in advance etc 1 ETA provided 1 Worked to resolve issue 1 Good servicehandling - general 1 Base 143
22
Summary9
Most participants experienced more than one disruption over the past month The most recent disrupted rail journey was typically a commuting journey (64) For 23 of reported disruptions the train was cancelled and the satisfaction with how the disruption was handled was much worse when there was a cancellation compared to delays For 27 of the disruptions no reasons were given for the disruption with this occurring more often for shorter delays Infrastructure (22) and service issues (15) were the main stated c auses of disruptions The scheduled journey time did not have a significant impact on length of the delay The most frequent delay length of 11 -20 minutes occurred most often across all scheduled journey times
Disruptions were most likely to occur at the boarding station (67) followed by on
the train (41) and at another station along the route (10) 61 first learnt about
the disruption when they arrived at the boarding station 28 while on the train and
just 7 before they arrived at the station
Waiting During Disruption
Participants were asked to think about how and where they spend the time during the disruption to their journey They were asked how they felt when they first learnt of the disruption and shown a list of potential emotions Amongst quantitative survey participants disruptions caused a mix of emotions though unsurprisingly negative emotions occurred more often than neutral or positive emotions
9 This and subsequent summaries are focusing on the quantitative findings only
23
Figure 13 Emotions when initially learning about disruption
Base 1049 more than one answer could be given so percentages add up to more than 100
A number of factors had an influence on the emotional state of participants Those with mobility issues were significantly more likely to feel anxious angry and stressed than able-bodied participants
Participants who were on a commuting journey when the disruption occurred were significantly more likely to be frustrated (63) than those travelling for business (59) or leisure (44) whilst those travelling for business or leisure were significantly more likely to feel in control than those commuting (7 and 8 respectively vs 3)
The biggest contributor to negative or positive emotions were the duration of the delay Delays of 11 minutes or more caused significantly more participants to feel frustrated angry andor stressed than delays under six minutes whilst delays of 6-10 minutes resulted in significantly more participants feeling calm than participants who experienced longer delays
The qualitative research with eight vulnerable customers showed that plug sockets on trains and in waiting rooms was even more important for those with heightened anxiety as they needed to be able to track trains in real time It was also really important for the waiting areas to be warm and for early information (with loading information) to provide people with mobility issues andor pain time and space to get from platform to the train
24
-
-
-
- ndash
ndash
Case study 3 Southern Rail
Who Female traveller with particular needs (18 45 years old) from London When Disruption to Brighton to Clapham Junction to Watford Junction journey What Monitors train as itrsquos moving on thetrainlinecom and sees that there will be
a cancellation to connecting trains Problems encountered Absence of any information no staff to ask for information
no clear alternatives battery on phone was low and nowhere to charge phone Positives encountered Using the app helped her to work out that her mother was
able to pick her up from Finchley
ldquoI really really didnrsquot know what to dordquo
Lesson Importance of having plug sockets on trains and in waiting rooms This is even more important for those with heightened anxiety that need to be able to track trains in real time
Case study 4 Northern Rail
Who Female traveller with recent back surgery and ongoing pain (18 45 years old) from Manchester
When Regularly travels from Bolton to Manchester (3 4 times a week) What Ongoing disruption to the journey and capacity problems causing
overcrowding Problems encountered Short forming trains too full to get on never a guaranteed
seat lack of real time information wants to know train loading information limited staff to ask
Positives encountered Nothing
ldquoI have to let 1 or 2 trains go by every morning people donrsquot know I have a back problemrdquo
Lesson Importance of warm waiting areas and early information (with loading information) to provide people with pain and mobility issues time and space to get from platform to the train
Waiting During the Delay
While being disrupted 54 of quantitative survey participants noticed a waiting room or cafeacute at the boarding station where they were delayed However this was not where most participants waited ndash the key area for participants to wait during a delay was at the platform 79 of participants who were delayed at the boarding station waited there (see Figure 14) as did 74 of those who were delayed at the interchange station (see Figure 19)
25
Figure 14 Where waited when disruption occurred at boarding station
Amongst the latter only 40 noticed a waiting room or cafeacute at the interchange station with an additional 21 unsure about whether these facilities were present at the interchange station This indicates that a delay increases uncertainty about further travel and travellers remain put or at least as close to that as possible to not cause further disruption to their journeys
Of those delayed at the boarding station 16-35-year olds are significantly less likely to wait on the concourse than any other age group They are more likely to wait at the platform (83 not significant)
2
1
1
2
7
8
79
0 10 20 30 40 50 60 70 80 90 100
Other
In a cafeacute
At a shelter
In a waiting room
On the train
On the concourse
At the platform
participants
Base 706 who were delayed at the boarding station
Figure 15 Where waited when disruption occurred at interchange station
14
5
4
6
74
0 10 20 30 40 50 60 70 80 90 100
Other
In a cafeacute
In a waiting room
On the concourse
At the platform
participants
Base 77 who were delayed at the interchange station
Interestingly almost nine in ten participants who found out about the disruption before reaching the station waited on the platform rather than on the concourse (2) Longer delays at the boarding station (31 minutes or more) resulted in significantly more participants waiting on the concourse (c20) rather than on the platform (c5) However this may be due to the platform number not being announced for longer delays until closer to the time that the train arrives
26
The top three locations when waiting during a disruption per delay length were
0-5 minutes delay 11-20 minutes 31-60 minutes At the platform (90) At the platform (81) At the platform (65) On the train (7) On the concourse (9) On the concourse (18) Anywhere else (4) On the train (7) On the train (5)
6-10 minutes 21-30 minutes 60+ minutes At the platform (81) At the platform (83) At the platform (54) On the train (13) On the concourse (6) On the concourse (22) On the concourse (4) On the train (4) Waiting roomon train
(10) Base 0-5 minutes 160 6-10 minutes 250 11-20 minutes 302 21-30 minutes 155 31-60 minutes 118 60+ minutes 64
Comfort During Wait
Participants were generally uncomfortable wherever they waited during the disruption Only 38 of quantitative survey participants who were delayed at the boarding station found their location of choice comfortable Those who were delayed at the interchange station were slightly more comfortable (44)
Comfort levels varied very much depending on the waiting location Waiting in a cafeacute or a waiting room resulted in the highest levels of comfort Participants who waited on the platform the main location where participants waited were significantly less comfortable than those who waited in a cafeacute or waiting room
Figure 16 Proportion who said they were comfortable by waiting location at boarding station
23
33
37
40
67
71
71
0 10 20 30 40 50 60 70 80 90 100
Other
On the concourse
At the platform
On the train
At a shelter
In a waiting room
In a cafe
participants
Base 7 (cafeacute) 14 (waiting room) 6 (shelter) 52 (train) 559 (platform) 55 (concourse) 13 (other) Very low bases for some of these subgroups
Where the disruption was first noticed (ie before reaching the station when arriving at the boarding station or when already on the train) did not have a noticeable impact on comfort levels suggesting that even if rail users are given notice of the disruption their discomfort and likely satisfaction is not impacted positively or negatively
27
However the length of the disruption of course did have an impact on levels of comfort a Figure 17 shows
Figure 17 Comfort during disruption by length of delay
57
43
34
35
25
22
38
43
57
66
65
75
78
62
0 10 20 30 40 50 60 70 80 90 100
0-5 minutes
6-10 minutes
11-20 minutes
21-30 minutes
31-60 minutes
60+ minutes
Total
participants
Comfortable Not comfortable
Base 706 (total) 37 (60+) 84 (31-60) 101 (21-30) 218 (11-20) 160 (6-10) 106 (0-5) those who were delayed at the boarding station
Longer delays at the boarding station resulted in a decrease in comfort ndash 57 of those delayed 0-5 mins were comfortable compared to only 34 of those delayed 11-20 minutes (statistically significant)
Summary
The longer the disruption the more frustrated resigned and stressed passengers get particularly when the disruption occurs during a commuting journey
79 of those at the boarding station and 74 at an interchange station waited for the disruption to end on the platform
Only 37 said the wait on the platform at the boarding station was comfortable (whereas for the few who waited at a cafeacute or a waiting room 71 said the wait was comfortable)
The longer the delay at the boarding station the more uncomfortable it was perceived to be
28
Handling of the Disruption
Overall when asked to rate how well the rail company handled the disruption quantitative survey participants felt that the travel disruption was not handled very well Only 22
10believed that it was handled well
Figure 18 Rating of how the rail company handled the disruption
Very poorly15
Poorly23
Neither34
Well17
Very well5
Dont knowno opinion
6
Base 1049
Over a quarter (27) of commuters found the handling poor compared with 15 of business travellers and 17 of those travelling for leisure Similarly commuters were significantly less likely to find the disruption was handled very well (2) than business (8) and leisure travellers (13)11
Unsurprisingly the length of the delay contributes to the dissatisfaction with the handling of the disruption as the proportion of participants viewing this as poorly rises from 6 and 11 for the shortest delays to 31 for 31-60 minute delays and 27 for delays of more than 60 minutes The mean satisfaction score (where 1 = very poorly and 5 = very well) by disruption length is shown in Figure 19
10 A further breakdown of answers to this question can be found above in Figure 7 11 However there is no correlation between purpose of the disrupted journey and satisfaction with handling the disruption The difference was statistically significant at the 95 confidence level
29
Figure 19 Mean rating of how the rail company handled the disruption by disruption length
308
29
271
251
24
251
1 2 3 4 5
0-5 mins
6-10 mins
11-20 mins
21-30 mins
31-60 mins
60+ mins
very poorly very well
Base 0-5 mins 160 6-10 mins 250 11-20 mins 302 21-30 mins 155 31-60 mins 118 60+ mins 64
Age does not correlate with the rating of how a disruption is handled to a great extent though those 65 years or older are significantly more likely to say that the disruption was handled very well (17) than any other age group
Another key driver for satisfaction with the handling of the disruption was the satisfaction with the information received during the disruption 66 of those who felt that the information received during the disruption was good or very good also felt that the rail company involved in the disruption handled this well whilst only 5 thought the rail company didnrsquot handle the disruption well this difference is statistically significant Similarly 74 of participants who felt the information received was poor or very poor also thought the handling was poor
Figure 20 Rating of information by how well the rail company handled the disruption
1
36
10
38
20
19
54
5
12 2
2
0 10 20 30 40 50 60 70 80 90 100
TOC handleddisruption well
TOC handleddisruption
poorly
participants
Very poor Poor Neither Good Very good Dont knowNo opinion
Base 234 TOC handled information well 397 TOC handled information poorly
Amongst qualitative participants there were a handful of positive disruption stories The station master at Meldreth Bern for example updated his local Facebook page to advise passengers of disruptions The information could also be seen on a blackboard that was kept up to date At the time of disruption he met and greeted passengers before they
30
parked to advise them of changes and saved them time parking their vehicle He booked taxis for passengers to neighbouring Royston if there were known disruptions to the village stations It was the helpful advice and meaningful alternatives that made this disruption handling very successful
Case study 5 Bern Station Master Meldreth
Example of best practice Up-to-the-minute communication delivered in a reliable and friendly way (f2f and local social media groups) offering helpful advice and meaningful alternatives
Furthermore Virgin West Coast were described as very good at delivering key information at point of disruption Participants reported that they provided times for each of the stations connection information and alternatives delivered in person or across tannoy offering face-to-face contact if needed and offered appropriate refreshments They further provided follow-up notices about compensation implications FGW and LNER were also singled out as having train guards with big personalities who are proud of their roles are highly personable and committed to customer service
When delays occurred it was critical to qualitative participants that TOCs are proactive and advise of potential issues to allow passengers to make alternative plans They thought a disruption was handled well if they could see the following
Reason respond remorse responsibility Human touch Cross network approach TOCs liaising with regards to connections and transferring tickets
31
Anticipating problems and advising of alternative routes eg ldquoYou could change hereas there might be some congestion which would cause delayrdquo
Summary
Handling of the disruption by the TOC was perceived as poor or very poor by 38 with only 22 thinking it was handled well Commuters were most likely to find the handling of the disruption as poor Longer disruptions contributed to poor ratings as did cancellations
32
4 Information During Disruption
Information Needs
Participants in the qualitative stage were asked to complete lsquojourney mapsrsquo focusing on the information needed at different stages of the journey they undertake
Before travelling they wanted to know Is my train running on time Will I get a seat Is my train overcrowded Have trains run on time today What platform is it on Where to stand on the platform
Once at the station they were concerned with Should I purchase my ticketcar park Is my train still due in at x time Is there a platform change Up to date loading data
If a disruption was to occur at this stage of the journey their key questions would be
Around disruption scale
Reason ndash congestion vs suicide
How long it will be delayed
Connection implications Around alternative travel arrangements
Where shall I go instead
What is the fastest route from A to B
Other relevant modal information eg busescabs
Are tickets transferable
At the point of disruption qualitative participants said they would check multiple sources so that consistency of information was a key concern for them One way of achieving this would be through development of a multi-modal app
Information about disruptions occurring before getting on the train were received in a variety of ways For example the majority opted for lsquoalertsrsquo via text or push notification and many also checked the TOCrsquos app or their Twitter feed Participants also reported that they lsquoused big datarsquo to personalise the information Whilst a blackboardwhite board outside of station or in ticket office was also cited repeatedly as source of information it became clear that station staff are now key to get up to date with travel information (Station Master or staff in high vis clothing who have iPads on the platformconcourse) Participant were looking for platform screens to include matrix touch screens video feeds
33
with real-time news which means that websites need to be updated continuously This was especially important as participants said they would continue to check journey alerts
Once on the train participants wanted to receive information mainly around disruption scale and alternative travel arrangements Questions around information needs during this stage of the journey included
Why the train has stopped What is the best alternative What is the reason for the delay Where could I get off What is the scale of the delay Whether tickets are transferable What is the ETD What are the compensation What is the ETA at each station arrangements What implications does this have for
connections
The moment the train pauses or goes unusually slowly participants were looking for an lsquoimplications explanationrsquo and wanted regular updates throughout the delay Participants would like to receive this from the train guard (longer distance journey) train driver LCDvisual displays touch screens with alternatives via a helpline or a live chat during train operating hours
Perception of information given
The information given during the disruption was perceived as more negative than positive with 95 of mentions being negative and only 42 positive
Figure 21 Perception of information given
Base 1049 more than one answer could be given so percentages add up to more than 100
Cancellation of trains resulted in considerably more negative comments as did delays of over 60 minutes
34
35
Table 2 Perception of information given by length of delay and whether train cancelled
Total
Length of delay Whether train
cancelled
0-5 mins
6-10 mins
11-20 mins
21-30 mins
31-60 mins
60+ mins
Yes
No
Insufficient 26 21 18 26 31 36 45 32 25
Adequate 21 21 29 18 20 18 16 18 22
Inadequate 19 9 11 22 26 26 36 30 16
Unclear 19 8 15 19 26 26 33 27 17
No information given 15 27 16 15 8 8 3 9 17
Clear 13 14 16 12 12 14 11 11 14
Too infrequent 10 6 6 11 10 17 23 12 10
Useful 9 11 10 10 5 6 5 7 9
Informative 8 9 10 7 8 8 6 6 9
Helpful 6 8 7 6 6 5 5 5 7
Timely 6 7 7 6 3 6 3 4 6
Inaccurate 6 3 2 8 5 10 16 9 5
Other 6 4 7 6 8 4 14 9 6
Base 1049 160 250 302 155 118 64 245 804
Tone of information
As a whole the tone of information given was perceived as neutral the inconvenience caused was acknowledged however the general tone was deemed indifferent Just over a fifth of quantitative survey participants each described the tone more positively 22 easy to understand 22 apologetic and 21 informative Figure 22 Tone of information provided
Base 895 (all those who were given information) more than one answer could be given so percentages add up to more than 100
7
1
3
3
7
9
21
22
22
25
36
0 10 20 30 40 50 60 70 80 90 100
Other
Rude
Lacked respect
Cared about my needs
No information received
Lacked care
Informative
Apologetic
Easy to understand
Indifferent
Acknowledged the inconvenience
participants
Rating of information
Overall 25 rated the information as good or very good and 45 as poor or very poor See Figure 23
Figure 23 Rating of the information received about the disruption
Base 1049
Very poor16
Poor29
Neither28
Good22
Very good3
Dont knowno opinion
2
When asked about what information was poor participants focused especially on the content of the information provided to them during the disruption a lack of or inadequate information was noted by almost a quarter of participants and a similar proportion of participants were unhappy about a delay in providing information The information was deemed vague unclear or inaudible by 10 of the participants
Similarly key information perceived as good centred around reasons given for the disruption In contrast to vague unclear inaudible information as reported by those who found the information poor it was reported as reported clear and concise by some These should be the focus of what and how TOCs provide information during disruption
36
Figure 24 Good information during disruption
6
2
3
3
3
6
8
8
9
9
13
13
14
14
15
17
32
0 10 20 30 40 50 60 70 80 90 100
Other
Information available online
Information provided via app
Information from station staff
Accurate information
Apology given
Timely information - in advance etc
Information re onward travel
Announcements
On-train information
TimingsETA given
Information on boardsscreens
Clearconcise information
Information provided (general)
Updates provided - good regular
Length of delay
Reason for disruption
participants
Q28 Base 263 (those who found information good) more than one answer could be given so percentages add up to more than 100 Chart only shows mentions gt1
During the qualitative stage participants said they would want to hear the following
An apology (more than once) The reason the train is delayed eg sheepsuicidestaff Estimated time of arrival at EVERY station Impact on connectionsticket validity We will update you again within 5 minutes We are doing everything we can to get you in on time Please check your app We know this isnrsquot acceptable We will refund ndash this is how
As with the quantitative findings participants here also said that the tone of voice was very important They were looking for information that was delivered in a very apologetic almost self-flagellating way showing genuine concern and with a reassuring optimistic and bright tone A human touch if appropriate humorous was also welcome Key to this was that the information would be given proactively via text message or email or via a TOC app
37
Figure 25 What information during disruption was poor
2
2
2
2
5
7
7
8
10
10
13
18
19
22
23
24
0 10 20 30 40 50 60 70 80 90 100
Other
No apology
Delay repaycompensation issues
Information available online
Information on boardsscreens
Noinsufficient updates
Poor communication (general)
Lack of information (onward travel)
Vagueunclearinaudible
Staff uninformedunavailable
No ETAlength of delay
Inaccurateconflicting information
No information provided
No reason for delay
Delay in providing information
Lack of or inadequate information
participants
Base 467 (those who rated the information as poor) more than one answer could be given so percentages add up to more than 100 Chart only shows mentions gt1
Summary
Overall the information given during the disruption was perceived as more negative than positive 95 negative comments (eg 26 insufficient 19 unclear 19
inadequate 15 none given) and 42 positive comments (eg 13 clear 9 useful 8 informative)
As a whole the tone of information given was perceived as neutral 36 said the
inconvenience caused was acknowledged 25 said it was indifferent Just over a fifth each described the tone more positively 22 easy to understand 22 apologetic and
21 informative
Overall 25 rated the information as good or very good and 45 as poor or very poor The main examples of poor information were lack of or inadequate information (24)
delay in providing information (23) and no reason given (23) The main examples for good information were reason given for the disruption (32) and the length of delay
(17) These findings provide clear pointers as to how TOCs should provide information during disruptions
Reception of Information
Participants were asked where they first received information about the disruption
38
Amongst qualitative stage participants there was a high demand for an app built on real-time GPS data with push notifications Participants were reliant on a range or apps for journey planning and perceiving real-time information including Citymapper National Rail Enquiries and Trainlinecom
Third party apps were viewed as independent highly trusted delivering the bigger picture eg offering more than just network data and also show early updates that are accurate However many commuters were more familiar with their TOC and would prefer apps from them These apps were viewed as good for specific routes with dedicated journeys saved in the app and many qualitative participants would check the apps first thing in the morning and before leaving the office There was a general feeling amongst participants that none of the existing apps goes far enough and that these apps are not always consistent with other information especially at times of disruptions
Participants hence were looking for something that was an all-in-one ticketpayment and information source Key for this to work would be GPS data TOC data personal data accuracy in information and real-time information Participants were looking for this app to provide disruption alerts for pre-set journeys fastest journey prediction including alternative TOCsmodes platform information and changes seat availability and loading data as well as rail driver information
ldquoThey should look at Uber Itrsquos so easy to use and you can track where your driver is at any momentrdquo
London Commuter
Amongst survey participants nearly four in ten (39) first noticed information about the disruption to their train journey via a display at the station Rail staff continues to be one of the key early delivery methods of information though predominantly via PA announcements Face-to-face information through members of staff only make up 8 of all initial points of information Only 13 of participants learned about the disruption first via an App or the internet with the National Rail app the main one
39
Figure 26 How information is first received
1
3
1
1
1
2
2
2
4
5
5
16
18
39
0 10 20 30 40 50 60 70 80 90 100
Dont know
Other
Member of staff at the station
Other travel app
Member of staff on the platform
Rail company app
Family friend or fellow traveller
Trainline app
Member of staff on the train
National Rail app
PA announcements at station
PA announcements on train
Display at station
participants
Base 1049
Amongst the survey participants who learned about the disruption before reaching the station App usage was significantly higher than amongst those who learned about the disruption at a later stage A third of all participants who learned about the disruption before reaching the station were significantly more likely to hear about this via the National Rail app 22 learned about it via the Trainline app and 8 found out through a particular rail companyrsquos app compared to almost none of the participants who learned about this later
Where the first information of the disruption was delivered via a Rail company app PA announcements on the train or members of staff on the platform participants were most likely to be satisfied with the handling of the disruption by the TOC Other travel apps and displays at the station had the opposite effect ndash here participants were significantly more likely to think the situation was handled poorly rather than well
Table 3 Rating of how TOC handled disruption by information source
TOC handled disruption well
TOC handled disruption poorly Base
Rail company app 37 32 19
PA announcements on train 33 31 187
Member of staff on the platform 31 25 16
Trainline app 28 43 40
PA announcements at station 25 34 173
Member of staff at the station 25 42 12
Twitter 25 25 8
Display on train 25 0 4
Member of staff on the train 23 42 48
National Rail app 19 42 53
Display at station 17 42 406
Other travel app 15 54 13
Family friend or fellow traveller 6 28 18
40
When asked which if any sources they recalled receiving information about the disruption during the disrupted journey this was a little different from the initial source mainly because more than one source could be mentioned although the ordering is similar
Quantitative survey participants recall receiving information about the disruption predominantly when itrsquos announced through a display at the station (45) PA announcements at the station (39) or on the train (37) The next most frequently remembered method of delivery is the National Rail app (13) followed by members of staff on the platform and on the train as well as via the Trainline app (8 each)
Figure 27 From which sources received information about the disruption during disrupted journey
1
3
3
3
4
6
8
8
8
13
37
39
45
0 10 20 30 40 50 60 70 80 90 100
Rail company app
Member of staff at the station
Family friend or fellow traveller
Display on train
No information received
Member of staff on the platform
Member of staff on the train
Trainline app
National Rail app
PA announcements on train
PA announcements at station
Display at station
participants
Base 1049
Qualitative stage participants found visual displays on the train helpful but pointed out that they needed to provide ETD implications and ETA at each station There was a keen interest for these to be used more actively answering questions such as
How long will the train be held at a red signal What time do we get in at the next station Is it now better to get off and change
Emotions When Receiving Initial Information
Finding out that their journey was disrupted caused a range of emotions in participants
Qualitative stage participants felt that poor management of disruptions and lack of communication exacerbates emotional and financial impact There was a clear desire for honest dynamic information delivered proactively to allow for passengers to regain control
41
--
-
The lack of proactive lsquoup to datersquo information dominated the range of frustrations voiced by qualitative stage participants and they had a strong desire for increased staff visibility However addressing the information hole via automateddigital channels would help all the frustrations Participants reported of a variety of frustration lsquocategoriesrsquo
lsquoHumanrsquo Absence of staff to answer questions eg on the platform Live Chat
No human response ndash they all hide
Lack of clear diction ndash do you know the Muffle Man
Dismissive staff
Need some lsquoRRRRrsquo - reason (whatrsquos happened) response (what are we doing about it) remorse (we are sorry) responsibility (we will rectify in the future by)
Connection
Knock on impact eg missing connecting trains
Implications for seat availability for longer journeys - where trains are cancelled and seat reservations get ignore
Informational
Absence of any explanation
No real time information eg train stops without reason
Inconsistency of information eg Platform screen different to App to Twitter
Lack of confidence in real time information eg expected train time keeps being delayed by 1 minute then 2 minutes then 3 minutes etc
Case study 6 Greater Anglia
Who Female commuter (45 65 years old) from London When 4 5 times a week from London Liverpool Street to Hertford East What Trouble with the power lines Problems encountered chaos at Liverpool Street Station dismissive staff
boardsannouncements not up to date and not informative no ETD or alternatives provided
Positives encountered one staff member eventually radiorsquod the train driver to get a specific ETD which allowed passenger to make a choice and to Moorgate Hertford North and then take a taxi home
ldquoThe station staff at Liverpool Street were hellip I mean she just flicked her hand at me in a dismissive way and said lsquoI donrsquot know read the boardsrsquordquo
ldquoIrsquom lucky that I have two choices of train line near me but I have a season ticket so itrsquos important that the ticket is then transferablerdquo
Quantitative survey participants reported mostly negative emotions when first receiving information about the disruption which were very similar to those recalled when initially
42
learning about a disruption (see Figure 13) though slightly more balanced Only 55 felt frustrated (rather than 63 in the previous question) and 12 felt informed
Figure 28 Emotions when receiving initial information
2
5
8
12
12
14
18
25
37
55
0 10 20 30 40 50 60 70 80 90 100
Reassured
In control
Calm
Uncertain
Informed
Anxious
Angry
Stressed
Resigned
Frustrated
participants
Base 974 (all those who were given information)
Predictably feeling angry and stressed increased as the length of disruption increased A very short delay (0-5 minutes) unsurprisingly lead to significantly fewer quantitative survey participants saying they felt frustrated (40) than delays between 11 and 60 minutes (60-69) This feeling decreased however for delays of 60 minutes or more where the percentage dropped to 57 These participants had an increased feeling of uncertainty (26) compared to those with a delay of 10 minutes or less
Some factors influenced the emotions of quantitative survey participants For example when the reason of the disruption remained unexplained or were service-related issues participants felt significantly more resigned (41 and 44 respectively) than when a problem with the train caused the disruption (22) Commuting participants felt significantly more frustrated (60) than leisure travellers Those in turn felt significantly more uncertain when experiencing disruptions (19) than commuters (11) or business travellers (9)
Listening for Announcements
To avoid those frustrations most quantitative survey participants said they always actively listen for announcements at the boarding station (73) and on the train (51)
Age seems to have an influence on the frequency of listening out for announcements Participants older than 65 generally try to listen to announcements on the boarding station (85) and on the train (63) whilst participants under 35 make less of an effort to always listen (65 and 47) At the boarding station and on the train however the younger participants are more likely to listen if they think there may a delay or disruption (26 at station and 15 on train vs 12 and 2 of the 65+ year olds)
43
Figure 29 Whether actively listen for any announcements at the boarding station
73
20
4
1
2
0 10 20 30 40 50 60 70 80 90 100
Yes always
Only if I think there may be a delay or disruption
No
My station doesnt have a PA system
Other
participants
Base 1049
Figure 30 Whether actively listen for any announcements on the train
51
33
12
3
2
0 10 20 30 40 50 60 70 80 90 100
Yes always
Yes only when I can hear them
Only if I think there may be a delay or disruption
No
Other
participants
Base 1049
Frequency of Announcements
Frustrations can also be avoided when information about disruptions are given at the right time
Overall if on a train that seems to be running slower than it should be or stops between stations 72 of quantitative survey participants wanted to receive information about the delay within five minutes and 20 within 6-10 minutes
Overall when there is a disruption to the rail service slightly more (75) would like announcements to be made within five minutes and 18 within 6-10 minutes
See Figure 31 which all shows the data disaggregated by journey purpose
Commuting participants are more likely to be interested in receiving information about slow running every 0-5 minutes 74 of participants feel that this is appropriate when being on a train that seems to be running slower than it should be or stops between station and 78 feel this is appropriate when a disruption is already occurring
44
Figure 31 Immediacy of information during slower service (left) vs during disruption (right)
Base 1049 (total) 674 (commuting) 205 (business) 138 (leisure)
Business and leisure travellers have contrasting view in the two scenarios where business travellers would like more frequent updates during slow running of service leisure travellers would like more information during disruptions
Quantitative survey participants were then asked whether it would be annoying if announcements were made more frequently than their preferred frequency For just over half it would not be annoying and for 41 it would be a little annoying Just 8 said it would be very annoying
Figure 32 Would it be annoying if announcements were made more often than preferred frequency
Very much8
A little41
No51
Base 1049
45
Leisure travellers are significantly less likely to feel very much annoyed (2) compared with commuters (9) or business travellers (10)
In summary our research shows that announcements are likely to be most welcome if they are made within five minutes for both slow running services and disruptions and most passengers would not be annoyed if it was more frequent than their preferred frequency
Participants were asked which they would prefer in situations when there are no announcements made because the train company doesnt have enough information
A) an announcement made with very little or no information B) an announcement made once there is some information
The consensus across rail passengers is that an announcement made with very little or no information is much better (80) than having to wait for an initial announcement until there is some information (20)
Summary
39 first noticed information about the disruption via a display at the station PA announcements on train (18) and PA announcements at the station (16) are also important sources Only 13 first learned about the disruption via an App or the internet with the National Rail app the main one If the information source was a rail company app PA announcements on the train or members of staff on the platform were most likely to be satisfied with the handling of the disruption by the TOC Other travel apps and displays at the station had the opposite effect
Unsurprisingly learning about a disruption to the journey resulted in negative emotions and participants tried to avoid these by always actively listen for announcements at the boarding station and on the train
Participants felt that the ideal frequency for information to be disseminated is every 0 to 5 minutes 72 for a slower running service and 75 for a disruption
If the frequency of announcement is higher than preferred most would not be annoyed
Announcements made within five minutes for both slow running services and disruptions would be most welcomed by passengers
Four fifths prefer that an announcement is made with very little or no information than having to wait until there is some information
46
Additional Information during Disruption
Participants were asked what else in addition to general information about the disruption they are looking for and what tone the information should be delivered in In addition they were asked about their likely behaviour during severe disruptions
Behaviour in Severe Disruption
A disruption of up to 45 minutes for a journey of 60 minutes length and having to change trains in order to reach your destination was classified as a severe delay in this survey
In cases of a severe delay like this a large proportion of survey participants would stay at the station waiting for updates (41) or make the journey using another train (19) Only 7 of participants would leave the station in this scenario - 5 of participants would cancel the trip altogether whilst 2 would return later to continue the disrupted journey A further 13 would make the journey using an alternative route and the remaining 11 would make the journey using another mode of travel
Figure 33 Behaviour if arrived at the station to find out about severe disruption
3
5
2
5
11
13
19
41
0 10 20 30 40 50 60 70 80 90 100
Dont know
Other
Leave the station and return later
Cancel the trip and go home
Make the journey using another mode of travel
Make the journey using an alternative route
Make the journey using another train
Stay at the station waiting for updates
participants
Base 1049
Participants who said they would stay at the station and wait for updates were asked what was the longest they would be prepared to wait for such a journey
0-5 mins 1 6-10 mins 3 11-20 mins 20 21-30 mins 31 31-60 mins 37 60+ mins 8
The average time was 45 minutes
47
Tone of Information
Quantitative survey participants were also asked which of the following tones of information they would prefer in normal and severe disruptions Qualitative research had shown that these seven tones of information were in particular demand from travellers during disruptions
Clear = easy to hear and to understand Correct = factual and up to date Concise = short and regular Confident = genuine and honest Conciliatory = apologetic and empathetic Consistent = across different channels andor providers Personal = tailored to your circumstances
The quantitative survey participants could give a maximum of three answers out of a list of seven tones specifying their first second and third choice Overall participants were looking for assurance through information provided about the disruption therefore looking predominantly for correct and clear information during normal disruption but also during severe disruption that would increase the journey time by 75
Figure 34 Preferred tone of information provided12
9
10
7
9
12
23
30
4
5
8
13
15
25
30
0 10 20 30 40 50 60 70 80 90 100
Personal
Conciliatory
Consistent
Concise
Confident
Clear
Correct
participants
Average disruption
Severe disruption
Base 1049
As the disruption gets more severe participants would like to see a conciliatory tone of voice and a more personal touch to the message
12 To distil the one preferred tone of voice the count for each tone was multiplied by three for the first choice by two for the second and by one for the third The values were then added up and divided by 6 before dividing it by 1049 to get the overall percentage
48
Level of Detail of Information during Disruption
Quantitative survey participants were asked what level of detail about the cause of the disruption they would prefer from the following
Very detailed for example this train is running 25 minutes late because of damage to the overhead electric wires between Birmingham New Street and Longbridge caused by a falling tree
Quite detailed for example this train is running 25 minutes late because of damage to the overhead electric wires between Birmingham New Street and Longbridge
Not detailed for example this train is running 25 minutes late
Figure 35 Level of detail about the cause of the disruption preferred
Very detailed61
Quite detailed37
Not detailed2
Base 1049
Over six tenths prefer very detailed information on the disruption containing for example the length and exact nature of the disruption Quite detailed information comprising of length and some information on the nature of the disruption was preferred by 37 Only very few participants would look for basic not-detailed information (2)
Some differences of opinion can be seen when looking at age of the passenger and satisfaction with handling of the disruption 16 to 35-year olds are significantly more likely to want very detailed information (67) than passengers that are 36 to 55 (57) or 56 to 64 (54) Furthermore significantly more participants who rate the TOC handling of the disruption as poor would prefer very detailed information (67) than those who rate the handling good (55)
49
Table 4 Preferred level of information
Level of information 16 -35
36 -55
56 -64
65+
Well -handled
Poorly handled
Very detailed 67 57 54 58 55 67
Quite detailed 30 40 44 41 42 31
Not detailed 3 3 2 2 3 2
Donrsquot know 1 0 0
Base 388 464 127 59 234 397
= less than 05
Preferred Staff Behaviour in Severe Disruptions
Quantitative survey participants were asked which of the following they would like staff to do if the disruption was particularly severe
Take responsibility Give you a named person for follow up Escalate to management Find me an alternative mode of transport to complete my journey Find me an alternative route to complete my journey Provide information on compensation Other
They were asked to choose the top three
As only 5 of participants would consider abandoning a severely disrupted journey participants were predominantly interested in information that would help them find an alternative arrangement to complete the journey as Figure 36 demonstrates
50
Figure 36 Preferred staff behaviour in severe disruptions13
1
3
4
16
20
26
30
0 10 20 30 40 50 60 70 80 90 100
Other
Give a named person for follow up
Escalate to management
Provide information on compensation
Take responsibility
Find an alternative mode of transport to completejourney
Find an alternative route to complete journey
participants
Base 1049
In case of a severe disruption the majority viewed information about options such as connections or alternative routes as most important (51) followed by information about the cause of disruption (44) An apology for the disruption was viewed as less important (4)
Figure 37 If the disruption was particularly severe which of the following would be most important and 2nd most important
44
4
51
47
16
37
0 10 20 30 40 50 60 70 80 90 100
Information about the cause of disruption (eg thecause and how long it will last)
An apology for the disruption
Information about options (eg connections oralternative routes)
participants
1st 2nd
Base 1049
13 the count was multiplied by three for the first choice by two for the second and by one for the third The values were then added up and divided by 6 before dividing it by 1049 to get the overall percentage
51
ndash
Case study 7 Virgin West Coast
Who Female business and leisure traveller with osteoporosis (65+ years old) from Birmingham
When First Class journey from Birmingham New Street What Severe weather (Storm Gareth) Problems encountered other than the disruption itself none Positives encountered uniformed staff on the platform equipped with iPads to
inform travellers of alternatives proactively opened the waiting room and 1st Class lounge for people to shelter and keep them warm kept everyone information of expected arrival and departure times
ldquoI canrsquot thank Virgin enough for that they are like a Swiss rail companyrdquo
Example of best practice
Importance of an Apology
Amongst quantitative survey participants taking responsibility nevertheless only came out as the third most important aspect of what staff should do 34 viewed an apology from the TOC for the disruption as very important and a further 34 as quite important Only 30 find this not at all or not so important
Figure 38 Importance of an apology from the TOC
5 25 34 34 2
0 10 20 30 40 50 60 70 80 90 100
participants
Not at all important Not so important Quite Important Very important Dont know
Base 1049
During the qualitative research participants showed that ongoing disruption experience and bad handling of it could encourage modal shift Frustrations with the rail service lead to a lack of confidence in the service which ultimately resulted in participants questioning why they were taking the train rather than driving An apology or apologetic tone could somewhat break this cycle
However quantitative survey participants did not find it very important to see rail staff when there are interruptions to the rail service only 2 thought this was essential and a further 14 found this quite important
52
Figure 39 Importance of being able to see rail staff when there are disruptions to the rail service
Essential2 Quite important
14
Not so important38
Not at all important46
Base 1049
Agreement with statements about disruptions
Overall 68 of quantitative survey participants agreed that there should be an apology for any disruption however short it is Only 14 disagreed Female passengers found it more important to hear an apology as 40 found an apology very important (29 men statistically significant)
When asked if they agreed with the statement that lsquosometimes the train company is deliberately evasive about the reason for disruptionsrsquo only 13 disagreed with this statement signalling that there is a lack of trust in TOCs
Figure 40 Agreement with statements about disruptions
22
25
36
43
29
23
13
7 2
0 10 20 30 40 50 60 70 80 90 100
Sometimes the train company is deliberately evasiveabout the reasons for disruptions
There should be an apology given for any disruptionhowever short it is
participants
Strongly agree Agree Neither Disagree Strongly disagree
Base 1049
53
Figure 42 Events about which information would be appreciated
Honesty was viewed as extremely important 80 of participants said it was very important that the train company be honest even if that means saying they do not know what is happening
Figure 41 Importance that the train company is honest even if that means saying they do not know what is happening
Base 1049
Not so important3
Quite Important17
Very important80
Content and Delivery of Additional Information
Quantitative survey participants were also asked whether and how they would like to receive information about the causes of the disruptions 80 of participants said they would like this additional information and they are interested in hearing about certain events more often than others Amongst qualitative participants similar needs were reported Figure 42 demonstrates the response from survey participants
13
38
41
43
45
48
49
52
54
62
67
71
0 10 20 30 40 50 60 70 80 90 100
None of the above Other
Leaves
Landslips
Cable theft
Buckled rails
Snow and ice
Flooding
Fatalities
Vandalism and trespass
Knock-on delays
Engineering works
Signals and points failure
participants
54
Base 835 (those who would like to receive information about causes)
Weather related causes of disruptions were less important to quantitative survey participants than infrastructure issues engineering works or external factors like vandalism Sixty-two per cent of participants would want to know about knock-on delays
Amongst the preferred method of delivery for information on these events are announcements on trains (55) through a member of staff on the platform (46) and on travel apps (45)
Figure 43 Preferred delivery method of information
2
10
13
15
18
23
28
38
41
43
45
46
55
0 10 20 30 40 50 60 70 80 90 100
Other
Leaflets at stations
Text message
In emails
On social media
Through messaging apps
Posters at stations
On NRE website
Member of staff on the train
Member of staff at the station
On travel apps
Member of staff on the platform
Announcements on trains
participants
Base 835 (those who would like to receive information about causes) more than one answer could be given so percentages add up to more than 100
Significantly more participants with a mental health andor social disability would like announcements on trains (70) or on social media (36) than participants without any disability (55 and 16 respectively)
Summary
If they experience a severe disruption only 5 would abandon the journey Almost half would stay at the station waiting for updates and be prepared to wait an average of 45 minutes In cases like this participants said they would want information about options such as connections or alternative routes but also know about the cause of disruption
For both normal and severe disruptions participants most want lsquocorrectrsquo (30 normal 30 severe) and lsquoclearrsquo (25 normal 23 severe) information As the disruption gets more severe participants would like to see a conciliatory tone of voice and a more personal touch to the message
61 prefer very detailed information on the disruption and 37 quite detailed information
55
Figure 44 Apps and websites used during disruption
-
In case of a severe disruption 51 viewed information about options such as connections or alternative routes as most important followed by information about the cause of disruption (44) An apology for the disruption is viewed as less important (4)
80 said it was very important that the train company be honest even if that means saying they do not know what is happening
80 wanted addition information on causes of disruption with signal and points failures (71) engineering works (67) and knock on delays (62) the most sought after information
Infographic style information on causes of disruptions via a variety means such as posters at stations on their apps and websites leaflets at stations etc would be welcomed by passengers
Delivery Mechanism of Information
This section focuses on how information is obtained during disruptions looking particularly at PA announcements
To stay up-to-date with journey information the majority of survey participants used at least one app or website during their journey being disrupted ndash only 10 did not use any and 50 used more than one method The most popular method to obtain information during disruption was the National Rail Enquiries website
1
10
1
1
1
1
1
1
3
4
7
9
10
10
20
29
29
41
0 10 20 30 40 50 60 70 80 90 100
Dont knowcant remember
None
Other
Rail company app
Other travel app
Realtime Trains app
Google Maps app
Google Maps
Citimapper
Trainline app
National Rail app
Specific rail company app
Friend family or fellow traveller
Rail company website
Trainline or other booking site
National Rail Enquiries website
participants
Base 1049 more than one answer could be given so percentages add up to more than 100 This code combines apps such as Thameslink app Southern app SWR app etc
56
The apps and websites used most when there is a disruption are shown in Figure 45 The two main sources were the National Rail Enquiries website (28) and Trainline or other booking site (23)
Figure 45 Apps and websites used most
1
3
2
2
6
9
13
14
23
28
0 10 20 30 40 50 60 70 80 90 100
Dont knowcant remember
Other
Friend family or fellow traveller
Other travel app
Rail company website
Rail company app
Trainline or other booking site
National Rail Enquiries website
participants
Base 931 who used one or more apps or websites
Considering that 50 of quantitative survey participants said they use more than one source of information to keep updated on disrupted journeys it is not surprising that not all of the sources available are trusted When asked which method they would trust most for information about disruptions participants gave a large range of answers with PA announcement at stations and on train most trusted followed by displays at stations The top five most trusted sources of information are linked directly to rail staff whether this is through PA announcements displays or members of staff Interestingly apps and websites were not as trusted as the more traditional means
57
Case study 8 LiveMinds exercise
Figure 46 Trusted most for information about disruption
4
1
1
1
1
2
4
4
9
14
16
24
26
28
31
37
42
53
0 10 20 30 40 50 60 70 80 90 100
None of the above
Southeastern app
Realtime Trains app
Citimapper
Email or text alert
Travel news updates on radio or television
Friends or family
Display on train
Trainline app
Member of staff at the station
National Rail app
Member of staff on the train
Member of staff on the platform
Display at station
PA announcements on train
PA announcements at station
participants
Base 1037 More than one answer could be given so percentages add up to more than 100
Qualitative stage participants also showed a higher level of trust in third party websites and apps than in individual TOCs
Quantitative survey participants were asked why they trusted the source they mentioned and the responses were lsquohand-analysedrsquo and coded to a code frame
58
The main reasons are concerned with the information being up-to-datelive (28) and accurate (20)
Figure 47 Why trust source
1
3
1
1
1
1
1
2
2
3
4
5
5
5
7
9
9
10
10
15
20
28
0 10 20 30 40 50 60 70 80 90 100
Dont know
Other
Only option available
Available to all - not everyone has internet etc
More accountableresponsible
Announcement
Chose National Rail app (not Trainline)
Consistent
Combined sources of informationoverview
First-hand information
Easily accessible
On sitevisible
Openhonesttransparent
Quicker
Experience - proven over time
Direct from source - official
Staff members
Reliabletrustworthy
Real personpersonal touch - can ask questions
Better information
Accuratecorrect
Up-to-datelive
participants
Base 1009
PA Announcements
Quantitative survey participants were asked how much they valued PA announcements when there are disruptions at the station and on the train
PA announcements are not only trusted most but the majority of participants also viewed them as essential 57 felt that PA announcements at the station were essential and 61 felt that PA announcements on the train were essential
Figure 48 How valued PA announcements are at station and on the train
1
4
4
39
35
57
61
0 10 20 30 40 50 60 70 80 90 100
at station
on train
participants
They are not at all important They are not so important They are important They are essential
Base 1049
59
The preferred interval for PA announcements was probed By a large margin participants preferred PA announcements to be every 0-5 minutes at the station and on the train
Figure 49 Preferred interval of PA announcements
1
9
25
65
1
6
22
72
0 10 20 30 40 50 60 70 80 90 100
31-60 mins
21-30 mins
11-20 mins
6-10 mins
0-5 mins
participants
At the station
On the train
Base 1049
Commuters were more likely to be in favour of a 0-5 minute frequency to updates than business or leisure travellers Participants who found the handling of the disruption by the TOC to be poor were significantly more in favour of 0-5 minute frequency that those who thought the handling was done well (76 vs 65 at stations 70 vs 55 on trains)
The length of the most recent delay and the nature of the disruption do not have a significant impact on the preference nor does when the disruption was noticed
In addition to timeliness it is important that PA announcements are easy to understand Participants thought that the PA announcements during their most recent disrupted journey were slightly less clear at the station than those on trains and overall the majority thought they were not clear
60
Figure 50 Clarity of announcements at stations and on trains
39 42
35 32
10 9
16 17
0
10
20
30
40
50
60
70
80
90
100
at station on train
p
arti
cip
ants
Dont knowNot applicable
Very unclear (cant make out muchor anything that is said)
Not very clear (cant make out allthat is said)
Very clear
Base 1049
Participants who thought the TOC had handled the disruption well found the PA announcements both at the station and on the train significantly clearer than those who thought this was handled poorly
Figure 51 Clarity of PA announcements at the station
18
17
42
24
12
3
22
63
0 10 20 30 40 50 60 70 80 90 100
Don`t know
Very unclear
Not very clear
Very clear
participants
Well handled
Poorly handled
Base 234 (well) 397 (poorly)
61
ndash -
-
Figure 52 Clarity of PA announcements on the train
18
15
37
29
11
4
23
62
0 10 20 30 40 50 60 70 80 90 100
Don`t know
Very unclear
Not very clear
Very clear
participants
Well handled
Poorly handled
Base 234 (well) 397 (poorly)
Summary
When experiencing disruptions most participants sought information through apps or websites and half of them used more than one source 10 used none The most popular method to obtain information during disruption was the National Rail Enquiries website
There seems to be a general distrust in information sources though overall PA announcements were the most trusted sources of information and they were seen as essential by more than half the participants The top five most trusted sources of information are linked directly to rail staff whether this is through PA announcements displays or members of staff Interestingly apps and websites were not as trusted as the more traditional means
Key to information via PA announcements during disruptions is timeliness 0 5 minutes was the preferred interval for around three quarters at stations and two thirds on trains The clarity of the announcements was poor with the majority assessing the PA announcements unclear at both stations and on trains
PA announcements are used trusted and seen as essential Therefore it is very important that they are frequent (every 0 5 minutes) and clear when there are disruptions
62
5 The Impact of Disruption
Behavioural and Sentimental Responses to Disruption
Qualitative stage participants reported a number of stress factors when considering the impact disruptions have on them Although there were a number of factors that impacted real-time stress levels delivery of information was the key driver of stress levels Where information was provided stress levels went down whereas a lack of information resulted in escalated stress levels
Case study 9 LiveMinds exercise
ldquoI travelled from Smethwick Galton Bridge to Birmingham Snow Hill and the train was due at 1722 There was an announcement that this train would be 3 minutes late Looking at the display information sign I could see that it then became 4 minutes then 5 minutes and each time the clock would go forward as to expecting time it eventually came 7 minutes late My anxiety increased with each minuterdquo
Birmingham Leisure
Factors that impacted stress levels negatively were
No information Ever increasing delays Finding out about delay on the train Length of delay Frequency of delays Impact on personalwork life
Factors that helped bring stress levels down were
Information to plan alternative route Predictive information Proactive information eg finding out at homebefore interchange
There was an overarching preference for Train Operating Companies to manage expectations with accurate timetables even if the journey time is slower For customers
63
managed expectations meant manageable stress levels Knowing that their train would arrive at the timetabled time was important for onward planning and for prompt arrival at work Ongoing predictable delays for commuters elevated frustrations and stress levels began to escalate after every minute that the train is held This then led to
A general sense of mismanagement Erosion of confidence in the network Modal shift to road
They also reported other factors impacting dissatisfaction with rail travel such as cleanliness and availability of toilets overall costs seat availability and safety but poor resolution of disruptions has a significantly negative influence on stress levels
On the emotional side participants reported of
In the moment anxiety of not knowing where to gowho to ask Stress of homelife eg more pressure on childcare Lower confidence from missing out on meetings Unprofessional embarrassing ndash negative impact on self-worth Fear when left at stations late and in the dark
Practical implications included
Missed connecting trains Missed meetings Missed parties Missed life changing appointments No-one to pick up children
Financial impact was felt in the form of
Loss of earnings (commutersbusiness travellers) Inability to work on train (business) Nursery fees Taxi fares Cost of car park Cost of drinksbreakfast
ldquoI was terrified and will never use that train againrdquo St Albans Leisure
ldquoI had to make up the time so it made me tired all the timerdquo London Commuter
ldquoNo -one seemed to know what they are doing and thatrsquos what happens each timerdquo ldquoEvery day itrsquos at least 3 minutes late arriving at New Street
Birmingham Commuter
64
Figure 53 Impact of disruption
Quantitative survey participants were asked about the emotional financial and practical impacts the disruption had caused them
A third of the impacts cited were emotional 48 were practical and 18 were financial On average 38 impacts were mentioned by each participant The main impacts were stress with respect to work arriving home late and missed meetings
8
1
4
5
5
7
8
8
10
10
10
11
13
14
16
21
24
25
29
32
51
55
0 10 20 30 40 50 60 70 80 90 100
None of the above
Lost my passenger assist
Nursery fees
Fear
Cost of car parking
No-one to pick children up
Had to buy a new rail ticket
Lost seat reservation
Stressworry for person collecting me
Cost of drinksfood
Missed follow-on transport
Taxi fares
Inability to work on train
Loss of earnings
Missed social event
Missed appointment
Stress on homelife
Anxiety of not knowing where to go
Missed connecting trains
Missed meeting
Arrived home late
Stress with respect to work
participants
Emotional impact
Practical impact
Financial impact
No impact
Base 1049 more than one answer could be given so percentages add up to more than 100
Quantitative survey participants with a disability experienced more emotional impacts of the disruptions than those without Particularly those with mental health issues or a social disability reported on this
In addition younger age groups were more effected emotionally than older age groups More than six out of ten of 16 to 35-year olds were more stressed with respect to work and more than a third of them experienced anxiety of not knowing where to go or who to ask
65
Figure 54 Emotional impacts by purpose
Base 388 (16-35) 674 (commuting) 205 (business) 138 (leisure) more than one answer could be given so percentages add up to more than 100
Figure 55 Practical impacts by purpose
Base 388 (16-35) 674 (commuting) 205 (business) 138 (leisure) more than one answer could be given so percentages add up to more than 100
Summary
Participants were asked about the emotional financial and practical impacts the disruption had caused them
66
33 cited emotional impacts 48 practical impacts and 18 financial impacts On average 38 impacts were mentioned by each participant The main impacts were stress with respect to work (55) arriving home late (51) and missed meetings (32)
Compensation and Redress
Qualitative stage participants were asked about their attitudes to compensation for tickets Although they welcomed Delay Repay they felt that currently this was not efficient or effective enough They welcomed
TOCs do mention it or give out forms Gets you part of your money back Once itrsquos set up itrsquos relatively easy Additional compensation (outside of Delay Repay) for ongoing timetable changes
However they thought the service needs improving because
It puts the onus on the customer The process feels cumbersome and daunting Lack of consistency across TOCs Suspect the TOC will quibble and doubts that any money will actually be repaid Itrsquos based on individual journey delays vs whole trips eg missed connections
ldquoI got over pound400 back and that was good but my season ticket is pound4500k and it doesnrsquot really account for the wider impact on my liferdquo
St Albans Depth Interview
ldquoSo I missed my connection at Watford Junction to Northampton because of a significant delay from Euston but I only could claim the first bitrdquo
St Albans Business
There was an overwhelming preference for a compensation ethos that makes customers feel valued regardless of journey purpose The minimum expected compensation would be money back for the ticket cost
Qualitative stage participants would begin to value the compensation if they received something unexpected andor if the compensation would take into account spend during the delay It was also felt that automatic refunds should be possible where travellers had purchased an e-ticket or a mobile ticket and where the TOC already had the relevant bank details to refund the costs Participants were looking for automatic compensation that demonstrates that the customer is valued and which might include multiple minimal journey disruptions eg five delayed journeys in one month
67
ldquoI just have to think about Amazon and the way that they give you your money back without even asking for the productrdquo
St Albans Commuter
ldquoThey know you donrsquot really have an alternative so it feels like they feel that they donrsquot have to do thisrdquo
London Commuter
Quantitative survey participants were asked whether if the disruption to the rail service they experienced was long enough to warrant compensation which of the following means would they prefer to find out about it
Announcement at the station Announcement on the train Display at station Display on train Member of staff on the platform Member of staff at the station Member of staff on the train National rail app Trainline app An email or text alert Social Media (eg Facebook or Twitter) A claim form handed to you on the train
Announcements on the train (55) and at the station (46) were the two preferred means
On average 34 sources were mentioned by each participant
68
Figure 56 If the disruption to the rail service experienced was long enough to warrant compensation which of the following means would they prefer to find out about it
4
8
19
20
22
23
24
25
26
31
32
46
55
0 10 20 30 40 50 60 70 80 90 100
Other
Social Media (eg Facebook or Twitter)
Trainline app
Member of staff at the station
Member of staff on the train
Display on train
National rail app
A claim form handed to you on the train
Member of staff on the platform
An email or text alert
Display at station
Announcement at the station
Announcement on the train
participants
Base 1049
Summary
If the disruption to the rail service was long enough to warrant compensation the preferred means of hearing about it were announcements on the train (55) announcements at the station (46) display at the station (32) and an email or text alert (31)
Best in Class
Qualitative stage participants were also asked about lsquoBest in Classrsquo examples for customer service to help TOCs to understand what could be done to improve this Key to thinking of brands as lsquoBest in Classrsquo was consistency in their service recovery strategies Whilst some airline companies were mentioned here no rail company was mentioned amongst lsquoBest in Classrsquo examples The list of lsquoBest in Classrsquo companies included telecoms leisure technology and rail companies such as Amazon Apple British Airways EE John Lewis MampS Premier Inn and Sonos14 Their commonalities were that they were easy to speak to they took responsibility resolved issues speedily showed flexibility proactive communication had a human touch refundedcompensated immediately and offered surprise vouchers
The blueprint of good service for TOCs as seen by qualitative stage participants is demonstrated in Figure 57 below
14 Other companies mentioned here included BT Delta Airlines JD Wetherspoons Sky and TGI Fridays
69
Figure 57 Best in Class Blueprint
The overarching implications for TOCs then come in three levels measures that are expected to be implemented if these are not already in place followed by a level of measures that would increase customersrsquo opinion of the TOCs and a third level which would really improve how customers see TOCs in the time of delay
Measures that are expected to be implemented Human face ndash approachable professional flexible Be polite take responsibility and apologise Do not make use internal operational issues as justification eg staffing No excuses
Measures that would increase customersrsquo opinion of the TOCs Ability to check disruption status through real time platform Provide realistic timing updates Make us comfortable Prompt payment of compensation Provide monetary compensation where appropriate Make it easy to report delays Provide ongoing text messages with status updates
Best in Class Do something unexpected eg vouchers for a free train ride free drinks Provide live chat messaging feed Proactive communication Automatic compensation
70
Case study 10 LiveMinds exercise
71
Appendix A
Questionnaire
Introduction
Thank you very much for agreeing to complete this on-line survey which is being conducted by Accent on behalf of the Department for Transport The closing date for completion of this survey is 16 July 2019
Anyone completing the questionnaire will be eligible for a pound5 voucher
We will just ask you a couple of questions to check that you are eligible to take part in this research
Any answer you give will be treated in confidence in accordance with the Code of Conduct of the Market Research Society If you would like to confirm Accentrsquos credentials type Accent in the search box at httpswwwmrsorgukresearchbuyersguide
IF MOBILE DEVICE SHOW This survey is best undertaken on a tablet or a PC If you do use a smartphone you can switch between desktop mode and mobile mode at any time by clicking the button at the bottom of the screen
For the purposes of administering the questionnaire and for analysis we may collect demographic information You do not have to answer any questions that you do not wish to and if you do you can withdraw your consent for us to process this information at any time Any personal data collected over the course of this survey will be held securely and will not be shared with any third party unless you give permission (or unless we are legally required to do so) Our privacy statement is available at wwwaccent-mrcomprivacy
Do you agree to proceeding with the survey on this basis Yes No THANK AND CLOSE
PLEASE ENTER THE UNIQUE CODE THAT IS PRINTED ON THE POSTCARD
ALLOW FOR SIX FIGURE ALPHA NUMERIC CODE
Q1 This questionnaire is about disruptions to your rail service and the information provided to you when that happens For the purposes of this research rail disruptions include delays (including repeated shorter delays) cancelled trains overcrowding meaning you couldnrsquot board the train and unplanned station closures
In the last month have you experienced any of the following disruptions to your rail journeys TICK ALL THAT APPLY
continued short delays of up to 5 minutes to regular journeys
a disruption of 5-19 minutes a disruption of 20 minutes-60 minutes a disruption of over 60 minutes none of the above THANK AND CLOSE
Q2 IF Q1 HAS MORE THAN ONE RESPONSE ASK Which was the most recent
IF Q1_1=1 SHOW continued short delays of up to 5 minutes to regular journeys IF Q1_2=1 SHOW a disruption of 5-19 minutes IF Q1_3=1 SHOW a disruption of 20 minutes-60 minutes IF Q1_4=1 SHOW a disruption of over 60 minutes
Q3 When did you last experience Q2Q1 IF ONLY ONE RESPONSE AT Q1
Today Yesterday 2-6 days ago 1-2 weeks ago 3-4 weeks ago More than a month ago THANK AND CLOSE
Main Questionnaire Thank you you are in scope for the survey The questionnaire will take about 15 minutes to complete
Q4 Any data collected over the course of this interview that could be used to identify you such as your name address or other contact details will be held securely and will not be shared with any third party unless you give permission (or unless we are legally required to do so)Our privacy statement is available at wwwaccent-mrcomprivacy
Do you agree to proceeding with the interview on this basis
Yes No THANK AND CLOSE
For convenience you can stop and return to complete the questionnaire as many times as you wish although once submitted you will not be able to enter again
Q5 Please describe your most recent disrupted rail journey below
Q6 What was the boarding station LIST OF STATIONS
Q7 What was the destination station LIST OF STATIONS
Q8 What was the main purpose of the train journey Commuting (including commuting for education) Business (including personal business such as job interviews dentist appointment etc) Leisure (including shopping visiting friends or relatives etc) Other (please type in)
Q9 Which train company operated the train service (If you travelled with more than one train company then you should select the company you travelled on for longest)
Transport for Wales Caledonian Sleeper c2c Chiltern Railways CrossCountry East Midlands Trains Gatwick Express Grand Central
Great Northern Great Western Railway Greater Anglia Heathrow Express Hull Trains London Northeastern Railway (LNER) London Northwestern Railway London Overground Merseyrail Northern ScotRail Southeastern Southern South Western Railway Stansted Express TfL Rail (excluding underground) Thameslink TransPennine Express Virgin Trains West Coast West Midlands Railway Dont know Other (please type in)
Q10 When did you first find out about the disruption
Before I reached the station When I arrived at the boarding station When I was on the train At an interchange station Other (please type in)
Q11 Where were you delayed TICK ALL THAT APPLY
IF Q10=4 DONrsquoT SHOW At the boarding station On the train At an interchange station At another station along the routejourney Other (please type in)
Q12 How long was the delay
helliphellip minutes
Q13 And how long was the rail journey scheduled to take
helliphellip minutes
Q14 What was the nature of the disruption
Problem with the train (eg faulty train waiting for a platform no driver) Infrastructure (eg signalling problem broken rail overhead wire problems unplanned station closure) Engineering works (eg emergency engineering works planned engineering work over running) External factors (eg person on the line vandalism passenger taken ill obstruction on the line) Weatherseasonal factors (eg flooding leaves ice) Service issues (eg Train congestion last minute platform changes overcrowding due to latecancelled trains) No reason given Other (Please type in) Dont knowcant remember
Q15 Was the train cancelled
Yes No
Q16 IF Q11_1=1 (DELAY AT BOARDING STATION) ASK Where did you wait at the station during the delay
At the platform On the concourse In a waiting room In a cafeacute On the train At a shelter Other (please type in)
Q17 Was this a comfortable place to wait
Yes No
Q18 IF Q16_3ltgt1 AND IF Q16_4ltgt1 (DIDNrsquoT WAIT IN WAITING ROOM OR CAFEacute) ASK Was there a waiting room or cafeacute you could have waited in
Yes No
Q19 IF Q11_3=1 (DELAY AT INTERCHANGE STATION) ASK Where did you wait at the station during the delay
At the platform On the concourse In a waiting room In a cafeacute At a shelter Other (please type in)
Q20 Was it a comfortable place to wait
Yes No
Q21 IF Q19_3ltgt1 AND IF Q19_4ltgt1 (DIDNrsquoT WAIT IN WAITING ROOM OR CAFEacute) ASK Was there a waiting room or cafeacute you could have waited in
Yes No Donrsquot know
Q22 IF Q15=2 ASK Thinking about the most recent rail disruption you experienced how did you feel when you first found out there was a disruption TICK ALL THAT APPLY IF Q15=1 ASK Thinking about the most recent rail disruption you experienced how did you feel when you first found out there was a cancellation TICK ALL THAT APPLY
RANDOMISE ORDER Uncertain Frustrated Anxious Angry Scared Stressed
Resigned Calm In control Content Determined Tired Other (please type in)
Past and current experiences of messaging during disruption Q23 Again thinking about the most recent rail disruption you experienced how do you rate how the rail
company handled the disruption
Very well Well Neither Poorly Very poorly Dont knowNo opinion
Q24 Overall how would you rate the information provided about that disruption
Very good Good Neither Poor Very poor Dont knowNo opinion
Q25 How would you describe the information provided about that disruption TICK ALL THAT APPLY
RANDOMISE ORDER Useful Helpful Informative Adequate Clear Timely Inadequate Inaccurate Insufficient Too infrequent Unclear No information given GO TO Q27 Other (please type in)
Q26 How would you describe the tone of the information provided about that disruption TICK ALL THAT APPLY
RANDOMISE ORDER Apologetic Rude Indifferent Lacked care Lacked respect Cared about my needs Acknowledged the inconvenience Easy to understand Informative
No information received Other (please type in)
Q27 And thinking more generally about when there are disruptions to your rail service how do you rate the information you received about the disruption
Very good Good Neither Poor Very poor Dont knowNo opinion
Q28 IF Q27=1 OR 2 ASK What information was good IF Q27=4 OR 5 ASK What information was bad
Q29 In the last six months have you experienced any rail disruptions when things were handled particularly badly
Yes PLEASE DESCRIBE No
Q30 In the last six months have you experienced any rail disruptions where a train company excelled in the way they handled the disruption (including the information they gave you)
Yes PLEASE DESCRIBE No
Q31 Thinking about when you experience disruptions on other forms of transport such as air the Underground or coach do you have any examples where the disruption was handled particularly well (including the information you received during this time)
Yes PLEASESTATE THE FORM OF TRANSPORT ANDDESCRIBE IN WHAT WAY IT WAS GOOD No
Timeliness of delivery The next set of questions are about when and where the information about the rail disruption was delivered
Q32 And where did you first receive information about the disruption
PA announcements at station PA announcements on train Display at station Display on train Member of staff on the platform Member of staff at the station Member of staff on the train National Rail app Trainline app Rail company app (please specify) Other travel app (please specify) Facebook Twitter Family friend or fellow traveller Other (please type in)
Donrsquot know
Q33 From which if any of the following sources do you remember receiving information about the disruption during your disrupted journey TICK ALL THAT APPLY
PA announcements at station PA announcements on train Display at station Display on train Member of staff on the platform Member of staff at the station Member of staff on the train National Rail app Trainline app Rail company app (please specify) Other travel app (please specify) Facebook Twitter Family friend or fellow traveller Other (please type in) No information received GO TO Q35 Donrsquot know GO TO Q35
Q34 And how did you feel when you first received the information TICK ALL THAT APPLY
RANDOMISE ORDER Uncertain Frustrated Anxious Angry Scared Stressed Resigned Reassured Calm In control Informed Pleased Relieved Other (please type in)
Q35 When you travel by rail do you actively listen for any announcements at the boarding station
Yes always Only if I think there may be a delay or disruption No My station doesnrsquot have a PA system Other (please type in)
Q36 And do you actively listen for announcements on the train
Yes always Yes only when I can hear them Only if I think there may be a delay or disruption No Other (please type in)
Q37 If you are on a train that seems to be running slower than it should be or stops between stations how quickly do you want to receive information about the delay
Type in helliphellip minutes
Q38 When there is a disruption to your rail service how often would you like announcements to be made
Type in Every hellipminutes
Q39 If announcements were made more often than every [Q38 answer] would that annoy you
Very much A little No
Q40 Sometimes there are no announcements made because the train company doesnrsquot have enough information In such situations would you prefer
a) an announcement made with very little or no information b) an announcement made once there is some information
Q41
Tone and content This section is about the tone and content of messages or information delivered when there are disruptions to your rail service
Q42 Overall when information is provided about disruptions which of the following styles would you prefer PLEASE PICK THE TOP THREE
RANDOMISE ORDER Clear = easy to hear and to understand Correct = factual and up to date Concise = short and regular Confident = genuine and honest Conciliatory = apologetic and empathetic Consistent = across different channels andor providers Personal = tailored to your circumstances Other (please type in)
Q43 Would your preference change if the disruption was particularly severe Imagine that you were taking a rail journey for Q8 [purpose] which was expected to last 1 hour However due to disruption your journey was now going to take 1 hour 45 minutes and that you had to change trains in order to reach your destination In that situation which of the following styles would you prefer PLEASE PICK THE TOP THREE
RANDOMISE ORDER Clear = easy to hear and to understand Correct = factual and up to date Concise = short and regular Confident = genuine and honest Conciliatory = apologetic and empathetic Consistent = across different channels andor providers Personal = tailored to your circumstances
Other (please type in)
Q44 Still imagine that you are making that journey and you arrived at the station to find out about the disruption What do you think you would do
Stay at the station waiting for updates Cancel the trip and go home Make the journey using another train Make the journey using another mode of travel Make the journey using an alternative route Leave the station and return later Other (please type in) Donrsquot know
Q45 IF Q44=1 ASK What is the longest you would be prepared to wait for this type of journey
Enter minutes
Q46 If the disruption was particularly severe which of the following would you like staff to do PLEASE PICK THE TOP THREE
Take responsibility Give you a named person for follow up Escalate to management Find me an alternative mode of transport to complete my journey Find me an alternative route to complete my journey Provide information on compensation Other (please type in)
Q47 What level of detail about the cause of the disruption would you prefer
Very detailed for example this train is running 25 minutes late because of damage to the overhead electric wires between Birmingham New Street and Longbridge caused by a falling tree Quite detailed for example this train is running 25 minutes late because of damage to the overhead electric wires between Birmingham New Street and Longbridge Not detailed for example this train is running 25 minutes late Donrsquot know
Q48 Again if the disruption was particularly severe which of the following would be most important to you
Information about the cause of disruption (eg the cause and how long it will last) An apology for the disruption Information about options (eg connections or alternative routes)
Q49 And the second most important
IF NOT TICKED AT Q48 Information about the cause of disruption (eg the cause and how long it will last) IF NOT TICKED AT Q48 An apology for the disruption IF NOT TICKED AT Q48 Information about options (eg connections or alternative routes)
Q50 Would you like to receive information about the causes of some of the disruptions such as signalling problems leaves on the line etc Some examples are shown below
httpswwwnetworkrailcoukrunning-the-railwaylooking-after-the-railwaydelays-explainedleaves httpswwwnetworkrailcoukrunning-the-railwaylooking-after-the-railwaydelays-explainedsignals-points-failure httpswwwnetworkrailcoukrunning-the-railwaylooking-after-the-railwaydelays-explainedvandalism-and-trespass etc
Yes No
Q51 IF Q50=1 ASK Some events can cause regular disruption to the railways Which of the following would you most like to receive further information on during instances of disruption to your journey TICK ALL THAT APPLY
Buckled rails Cable theft Engineering works Fatalities Flooding Knock-on delays Landslips Leaves Signals and points failure Snow and ice Vandalism and trespass None of the above Other (please type in)
Q52 IF Q50=1 ASK How would you like to receive such information TICK ALL THAT APPLY
Posters at stations Leaflets at stations In emails Notifications through messaging apps such as Facebook Messenger and WhatsApp Member of staff on the platform Member of staff at the station Member of staff on the train On National Rail Enquiries website On travel apps Announcements on trains (eg Did you knowhellip) On social media Text message Other (please type in)
Q53 How important is it to you that the train company apologises for the disruption
Very important Quite Important Not so important Not at all important Donrsquot know
Q54 Please say whether you agree or disagree with the following statements about rail disruptions
a) Sometimes the train company is deliberately evasive about the reasons for disruptions
b) There should be an apology given for any disruption however short it is
Strongly agree Agree Neither Disagree Strongly disagree
Q55 How important is to you that the train company is honest even if that means saying they do not know what is happening
Very important Quite Important Not so important Not at all important
Delivery mechanisms This section is about how information is provided when there are disruptions to your rail service
Q56 Which if any of the following apps or websites do you tend to use when your journey is disrupted TICK ALL APPLICABLE
None GO TO Q58 Rail company website Rail company app (please specify) Other travel app (please specify) National Rail Enquiries website Facebook Twitter Trainline or other booking site Friend family or fellow traveller Other (please type in) Dont knowcant remember GO TO Q59
Q57 IF MORE THAN ONE MENTIONED AT Q567 ASK Which of these do you use the most TICK ONE ONLY
IF Q56_2 = 1 Rail company website IF Q56_3 = 1 Rail company app IF Q56_4 = 1 Other travel app IF Q56_5 = 1 National Rail Enquiries website IF Q56_6 = 1 Facebook IF Q56_7 = 1 Twitter IF Q56_8 = 1 Trainline or other booking site IF Q56_9 = 1 Friend family or fellow traveller IF Q56_10 = 1 Other Dont knowcant remember
Q58 Which if any of the following do you trust most for information about disruptions TICK ALL APPLICABLE
PA announcements at station PA announcements on train Display at station Display on train Member of staff on the platform Member of staff at the station Member of staff on the train National Rail app Trainline app Rail company app (please specify) Other travel app (please specify) Email or text alert Facebook Twitter Travel news updates on radio or television Friends or family
Other (please type in) None of the above GO TO Q61
Q59
Q60 Why do you trust lsquoQ58rsquo most for getting information about disruptions
Q61 When there are disruptions how much do you value PA announcements at the station
They are essential They are important They are not so important They are not at all important
Q62 And how much do you value PA announcements on the train
They are essential They are important They are not so important They are not at all important
Q63 How often should PA announcements about disruptions to the rail service at the station be repeated
Type in helliphellip minutes
Q64 And how often should PA announcements about disruptions to the rail service on the train be repeated
Type in helliphellip minutes
Q65 Thinking about your most recent disrupted rail journey how easy to understand were the announcements about the disruption at the station
Very clear Not very clear (canrsquot make out all that is said) Very unclear (canrsquot make out much or anything that is said) Donrsquot knowNot applicable
Q66 And how clear were the announcements about disruption on the train
Very clear Not very clear (canrsquot make out all that is said) Very unclear (canrsquot make out much or anything that is said) Donrsquot knowNot applicable
Q67 How important is it to you that you are able to see rail staff when there are disruptions to the rail service
Essential Quite important Not so important Not at all important
Behavioural and sentimental responses to information Q68 Thinking about the recent disruption to your rail service did you experience any of the following
Emotional impacts Anxiety of not knowing where to gowho to ask Stress on homelife (eg childcare) Stress with respect to work (eg because late or missing meetings appointments etc) Fear (eg being alone at stations at night) Stressworry for the person collecting me from the station Other emotional impact (please type in)
Financial impacts Loss of earnings Had to buy a new rail ticket Inability to work on train Nursery fees Taxi fares Cost of car parking Cost of drinks andor food Other financial impact (please type in)
Practical impacts Missed connecting trains Lost seat reservation Lost my passenger assist Missed follow-on transport (eg air ferry bus) Missed meeting Missed social event Missed appointment Arrived home latelater than anticipated No-one to pick children up Other practical impact (please type in)
None of the above
Compensation and redress Q69 If the disruption to the rail service you experienced was long enough to warrant compensation
which of the following means would you prefer to find out about it TICK ALL THAT APPLY
Announcement at the station Announcement on the train Display at station Display on train Member of staff on the platform Member of staff at the station Member of staff on the train National rail app Trainline app An email or text alert Social Media (eg Facebook or Twitter) A claim form handed to you on the train Other (please type in)
Q70
Classification Questions Finally would you please answer some questions about yourself You do not have to answer any of these questions that you do not wish to and if you do you can withdraw your consent for us to process this information at any time The personal information you provide during this survey will be held securely and will not be shared with any third party unless you give permission (or unless we are legally required to do so) Our privacy statement is available at wwwaccent-mrcomprivacy
It will be used by Accent only for this study which is being undertaken for the Department for Transport
Q71 Which of the following age groups are you in
16-25 26-35 36-45 46-55 56-59 60-64 65 or more Prefer not to answer
Q72 What is your gender
Male Female In another way (please type in) Prefer not to answer
Q73 Are you affected by any physical or mental health conditions or illnesses lasting or expected to last 12 months or more
No none Yes Vision (eg blindness or partial sight) Yes Hearing (eg deafness or partial hearing) Yes Mobility (eg only able to walk short distances or difficulty climbing stairs) Yes Dexterity (eg difficulty lifting and carrying objects or using a keyboard) Yes Learning or understanding or concentrating Yes Memory Yes Mental health Yes Stamina or breathing or fatigue Yes Socially or behaviourally (eg associated with autism attention deficit disorder or Aspergerrsquos syndrome) Other (please type in) Prefer not to say
Q74 IF Q73=YES ASK Do you have any have specific requirements that would make the experience of experiencing disruptions less stressful or easier to manage
No comment
Q75 Do you have any other comments you would like to make about rail disruptions
No comment
-Prepared by Accent Chiswick Gate 598 608 Chiswick High Road London W4 5RT
Registered in London No 2231083 Accent Marketing amp Research Limited Registered Address 30 City Road London EC1Y 2AB
- Title Page
- Contents
- Executive Summary
- 1 Introduction
- 2 Methodology
- 3 Experiences of Past Delays and Handling of Disruption
- 4 Information During Disruption
- 5 The Impact of Disruption
- Appendix A Questionnaire
-
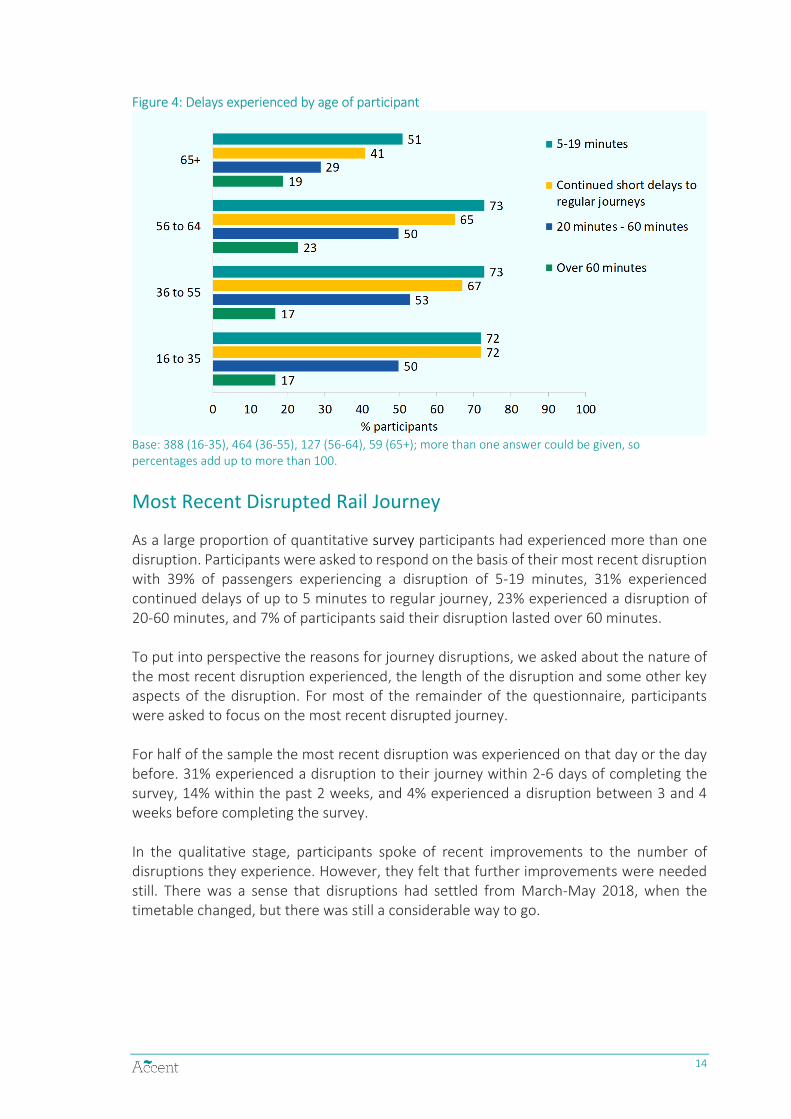

ndash
-
ldquoIt was complete and absolute chaos day after dayrdquo St Albans Depth interview
ldquoThe difference is that you donrsquot travel to the station expecting a delay there might be one but you are not expecting itrdquo
London Commuter
Case study 1 Thameslink
Who Female businesses traveller (45 64 years old) from Borehamwood When Uses train three times a week to go from Borehamwood to London St
Pancras What Ongoing timetable issues Problems encountered Delayed and cancelled trains inconsistency in information
(across app platform and station) dismissive staff continually late for work or late home)
Positives encountered Hot chocolate sachet
It was reported by some that in March-May 2018 they experienced disruptions every day on every service This coincided with a period of significant disruption on the rail network caused mainly by the weather due to the ldquoBeast from the Eastrdquo and the timetable changes in May 2018 During this time some passengers told us that information provision was very poor and staff were ill informed and nervous Passengers reported that they made choices about travelling by rail and often worked from home more or took alternative modes of transport to get to the office It had a significant impact on life and work for the participants
Although the level of disruption may have calmed down no consistent difference was perceived in the communications when there were disruptions During the fieldwork qualitative participants felt that disruptions still occurred but were less frequent Information provision was still perceived as poor and staff were still perceived to lack information resulting in continued lack of confidence in the services from passengersrsquo side
Purpose and Outcome of the Journey
Amongst quantitative survey participants the main purpose of the train journey of the most recently disrupted journey was commuting (64) followed by business (20) Leisure journeys formed the smallest purpose for travelling (13)
Looking at different age groups those aged 16-35 36-55 and 56-64 were significantly more likely to have experienced disruptions when commuting (72 68 and 51 respectively) Those travelling for business were significantly more likely to be 36-55 (23) or 56-64 (26) whilst almost 3 in 5 of the 65+ year old participants travelled for leisure
15
Figure 5 Purpose of disrupted journey
64
72
68
51
15
20
14
23
26
12
13
12
7
20
58
3
2
2
3
15
0 10 20 30 40 50 60 70 80 90 100
Total
16 to 35
36 to 55
56 to 64
65+
participants
Commuting Business Leisure Other
Base 1049 (total) 59 (65+) 127 (56-64) 464 (36-55) 388 (16-35)
In most cases the disruption did not result in a cancellation of the train (77) However 55 of disruptions caused by weather or seasonal factors5 were cancelled and 37 of journeys where problems with the train had caused disruptions were cancelled Service issues and when the disruption remained unexplained caused the small proportion of cancellations as Figure 6 shows
Figure 6 Proportion of cancellations by disruption cause
10
11
32
33
35
37
55
0 10 20 30 40 50 60 70 80 90 100
Service issues
No reason given
Engineering works
Infrastructure
External factors
Problem with train
Weatherseasonal factors
participants
Base 11 (weather) 120 (problem) 48 (external factors) 227 (infrastructure) 25 (engineering works) 283 (No reasons) 161 (service issues)
Cancellations had an impact on the satisfaction with how the individual TOCs handled the disruption 49 of participants who experienced a cancelled train rated the TOC experience of disruption as poor or very poor
5 Very low base n=11
16
Figure 7 Satisfaction with handling of disruption
26
15
23
23
29
34
13
17
4
5
4
6
0 10 20 30 40 50 60 70 80 90 100
Cancelled train
Total
participants
Very poorly Poorly Neither Well Very well Dont knowNo opinion
Base 1049 (total) 245 (cancelled train)
Nature of Disruption
Participants in the qualitative stage reported of a wide range of disruptions
Long Delays Overcrowding No First-Class carriages Slow running No seating Change of platform Ongoing small delays Short forming Cancellations Unexpected stop Changes to timetable
Regardless of the type of disruption qualitative participants wanted to feel in control and that they had choices to allow them to change their journey plans They showed more tolerance for disruptions that are lsquoout of Operator controlrsquo such as severe weather events powerlines suicide or trespassers and vandalism Operational issues such as staff shortagesno train driver leaves on the line last minute platform changes and train congestion6 received less tolerance as they were considered avoidable
In the LiveMinds app exercises participants discussed unintended consequences of disruptions such as extra childcare costs after missing nursery pick-up disagreements at home as spouses are waiting at the station work reputation eg continually being late for work missing out on work (missing an audition and therefore losing a part) missing social engagements such as a family party and losing property because of rushing through a station
Quantitative survey participants reported that when experiencing disruptions just under a third were not given a reason for their disruption (27) and of those disruptions a reason was given for problems with the infrastructure (22) and service issues (15) were the most common followed by problems with the train (11)
6 Other mentions here include wrong type of snow lack of foresight eg train delayed immediately after leaving a station giving people no chance for alternative and replacement bus services that donrsquot offer enough capacity
17
Figure 8 Reasons for most recent disruption
8
8
1
2
5
11
15
22
27
0 10 20 30 40 50 60 70 80 90 100
Dont knowremember
Other
Weatherseasonal factors
Engineering works
External factors
Problem with the train
Service issues
Infrastructure
No reason given
participants
Base 1049
The quantitative stage showed that problems with the train were reported significantly more often in journeys that were more than six minutes delayed with 20 reported problems causing a delay of 21-30 minutes Similarly infrastructure problems were reported significantly more often when journeys were delayed for more than 11 minutes with over half of reported problems causing a delay of more than 60 minutes The top three reasons for disruptions per delay length were
0-5 minutes delay 11-20 minutes 31-60 minutes No reason given (55) No reason given (22) Infrastructure (31) Service issues (17) Infrastructure (21) Other (15) Donrsquot know (13) Service issues (18) No reason given (14)
6-10 minutes 21-30 minutes 60+ minutes No reason given (34) Infrastructure (28) Infrastructure (58) Service issues (22) Train problems (22) Other (14) Train problems (11) No reason given (16) Train problems (11)
Base 0-5 minutes 160 6-10 minutes 250 11-20 minutes 302 21-30 minutes 155 31-60 minutes 118 60+ minutes 64
In contrast to this for over half of delays of less than five minutes no reason was given for the delay This dropped down to 34 for journeys of 6-10 minutes and to 22 for journeys delayed by between 11 and 20 minutes These differences were significantly different
Delay Length
The average length of delay experienced by quantitative survey participants was 24 minutes The distribution of delay length is shown below
18
Figure 9 Delay length
15
24
29
15
11
6
0 10 20 30 40 50 60 70 80 90 100
0-5 mins
6-10 mins
11-20 mins
21-30 mins
31-60 mins
60+ mins
participants
Base 1049
The qualitative stage explored the impact of disruptions7 Participants reported that the impact of disruptions on their lives went beyond the practical and often had emotional and financial consequences
Regardless of the length of journey qualitative participants felt that more than a few minutes of delay were unacceptable They felt equally as frustrated when the journey was delayed by a few minutes regardless of whether they were travelling from Manchester to London or from St Albans to West Hampstead8 There was a general sense of frustration around excuses for delays and a belief that trains should ldquosimply be on timerdquo
Case study 2 LiveMinds exercise
7 More on this can be found later in this report in part 311 Behavioural and Sentimental Responses to Disruption 8 However some of the Manchester audience appeared to accept longer delays on longer routes
19
20
Expected Journey Length
Asking quantitative survey participants about the most recent disruption experienced the scheduled journey time did not have a significant impact on length of the delay This reflected to a large extent the fact that the majority of journeys with disruption experiences were commuting journeys Figure 10 shows the distribution of scheduled journey length Figure 10 Scheduled journey length
2
5
22
18
31
22
0 10 20 30 40 50 60 70 80 90 100
0-5 mins
6-10 mins
11-20 mins
21-30 mins
31-60 mins
60+ mins
participants
Base 1049
Table 1 shows a matrix of delay length by scheduled journey length for quantitative participants This uses shading to indicate the highest proportions The most frequent delay length of 11-20 minutes occurred most often across all scheduled journey times Table 1 Matrix of length of delay by scheduled journey length
Length of delay
0-5 mins 6-10 mins 11-20 mins 21-30 mins 31-60 mins 60+ mins
sch
ed
ule
d jo
urn
ey
len
gth
0-5 mins 1 0
6-10 mins 1 1 2 1
11-20 mins 4 6 6 3 2 1
21-30 mins 3 4 6 3 2 1
31-60 mins 4 8 9 5 4 1
60+ mins 2 4 6 4 3 3
Base 1049 = less than 05
Journeys of a scheduled length of 60+ minutes saw the highest proportion of delays that lasted 60 minutes or longer Delays for shorter journeys were generally shorter Qualitative stage participants reported that they built in extra time for travelling in order to avoid being caught out due to disruptions This then often had an impact on their personal lives and personal value of time as it was often seen as missing an opportunity of doing other things Some participants reported that a steady erosion of confidence in disruption management meant that they were getting earlier trains to ensure they arrived
on time This then resulted in a re-evaluation of their value of time as loss of personal time Opportunity cost and financial implications were also considered when making a decision regarding train travel Participants reported that they traded in their personal time when experiencing delays travelling for example
Getting the earlier train to work everyday Setting off early from work for specific leisure events Travelling the night before for to get to the airportparty Leaving two hours to get to a meeting
ldquoIrsquom losing an extra hour every dayrdquo Manchester Commuter
ldquoIf I have to get somewhere that takes an hour ndash Irsquoll always take two hours and thatrsquos an hour I could be workingrdquo
St Albans Business
When Passengers First Heard of Disruption
The quantitative survey showed that disruptions were most likely to occur at the boarding station (67) followed by on the train (41) and at another station along the route (10) Only 7 of survey participants had a delay at an interchange station
Figure 11 Where disruption occurred
67
41
7
10
2
0 10 20 30 40 50 60 70 80 90 100
At the boarding station
On the train
At an interchange station
At another station along the routejourney
Other
participants
Base 1049
Commuting journeys were significantly more likely to be delayed on the train than leisure journeys (45 vs 31)
A delay whilst on the train was also experienced significantly more often when the nature of the disruption was a service issue (58) than when it was a problem with the train (43) external factors (32) or when no reason was given (39)
Only 7 of participants learned about the disruption to their journey before they reached the station With 67 of delays occurring are the boarding station there is clearly an
21
opportunity for more to be done in terms of letting passengers know their service is delayed (particularly as a large proportion are commuters Sixty-one per cent of participants found out about the disruption to their journey when they arrived at the boarding station A further 28 of participants found out while on the train and only 2 learned about this at an interchange station
Figure 12 Where first learnt of disruption
7
61
28
2
2
0 10 20 30 40 50 60 70 80 90 100
Before I reached the station
When I arrived at the boarding station
When I was on the train
At an interchange station
Other
participants
Base 1049
Cancellations occurred more often to trains where a disruption was noticed when arriving at the boarding station (68) than any other point of initial noticing of disruption
In the preceding six months 46 of participants had experienced rail disruptions when things were handled particularly badly and in the same time period only 14 had experienced disruptions where a TOC excelled in the way they handled the disruption
The examples of when TOCs excelled are
Good information provided - updates etc 6 Good customer servicerelations - vouchersdrinks offered 3 Staff are well-informedefficient 3 Onward travelalternative arrangements are good - information provided 2 Reclaim process good - offered refund etc 2 Good communication - clearconciseaccurate 2 Apology given 1 Timely information provided - in advance etc 1 ETA provided 1 Worked to resolve issue 1 Good servicehandling - general 1 Base 143
22
Summary9
Most participants experienced more than one disruption over the past month The most recent disrupted rail journey was typically a commuting journey (64) For 23 of reported disruptions the train was cancelled and the satisfaction with how the disruption was handled was much worse when there was a cancellation compared to delays For 27 of the disruptions no reasons were given for the disruption with this occurring more often for shorter delays Infrastructure (22) and service issues (15) were the main stated c auses of disruptions The scheduled journey time did not have a significant impact on length of the delay The most frequent delay length of 11 -20 minutes occurred most often across all scheduled journey times
Disruptions were most likely to occur at the boarding station (67) followed by on
the train (41) and at another station along the route (10) 61 first learnt about
the disruption when they arrived at the boarding station 28 while on the train and
just 7 before they arrived at the station
Waiting During Disruption
Participants were asked to think about how and where they spend the time during the disruption to their journey They were asked how they felt when they first learnt of the disruption and shown a list of potential emotions Amongst quantitative survey participants disruptions caused a mix of emotions though unsurprisingly negative emotions occurred more often than neutral or positive emotions
9 This and subsequent summaries are focusing on the quantitative findings only
23
Figure 13 Emotions when initially learning about disruption
Base 1049 more than one answer could be given so percentages add up to more than 100
A number of factors had an influence on the emotional state of participants Those with mobility issues were significantly more likely to feel anxious angry and stressed than able-bodied participants
Participants who were on a commuting journey when the disruption occurred were significantly more likely to be frustrated (63) than those travelling for business (59) or leisure (44) whilst those travelling for business or leisure were significantly more likely to feel in control than those commuting (7 and 8 respectively vs 3)
The biggest contributor to negative or positive emotions were the duration of the delay Delays of 11 minutes or more caused significantly more participants to feel frustrated angry andor stressed than delays under six minutes whilst delays of 6-10 minutes resulted in significantly more participants feeling calm than participants who experienced longer delays
The qualitative research with eight vulnerable customers showed that plug sockets on trains and in waiting rooms was even more important for those with heightened anxiety as they needed to be able to track trains in real time It was also really important for the waiting areas to be warm and for early information (with loading information) to provide people with mobility issues andor pain time and space to get from platform to the train
24
-
-
-
- ndash
ndash
Case study 3 Southern Rail
Who Female traveller with particular needs (18 45 years old) from London When Disruption to Brighton to Clapham Junction to Watford Junction journey What Monitors train as itrsquos moving on thetrainlinecom and sees that there will be
a cancellation to connecting trains Problems encountered Absence of any information no staff to ask for information
no clear alternatives battery on phone was low and nowhere to charge phone Positives encountered Using the app helped her to work out that her mother was
able to pick her up from Finchley
ldquoI really really didnrsquot know what to dordquo
Lesson Importance of having plug sockets on trains and in waiting rooms This is even more important for those with heightened anxiety that need to be able to track trains in real time
Case study 4 Northern Rail
Who Female traveller with recent back surgery and ongoing pain (18 45 years old) from Manchester
When Regularly travels from Bolton to Manchester (3 4 times a week) What Ongoing disruption to the journey and capacity problems causing
overcrowding Problems encountered Short forming trains too full to get on never a guaranteed
seat lack of real time information wants to know train loading information limited staff to ask
Positives encountered Nothing
ldquoI have to let 1 or 2 trains go by every morning people donrsquot know I have a back problemrdquo
Lesson Importance of warm waiting areas and early information (with loading information) to provide people with pain and mobility issues time and space to get from platform to the train
Waiting During the Delay
While being disrupted 54 of quantitative survey participants noticed a waiting room or cafeacute at the boarding station where they were delayed However this was not where most participants waited ndash the key area for participants to wait during a delay was at the platform 79 of participants who were delayed at the boarding station waited there (see Figure 14) as did 74 of those who were delayed at the interchange station (see Figure 19)
25
Figure 14 Where waited when disruption occurred at boarding station
Amongst the latter only 40 noticed a waiting room or cafeacute at the interchange station with an additional 21 unsure about whether these facilities were present at the interchange station This indicates that a delay increases uncertainty about further travel and travellers remain put or at least as close to that as possible to not cause further disruption to their journeys
Of those delayed at the boarding station 16-35-year olds are significantly less likely to wait on the concourse than any other age group They are more likely to wait at the platform (83 not significant)
2
1
1
2
7
8
79
0 10 20 30 40 50 60 70 80 90 100
Other
In a cafeacute
At a shelter
In a waiting room
On the train
On the concourse
At the platform
participants
Base 706 who were delayed at the boarding station
Figure 15 Where waited when disruption occurred at interchange station
14
5
4
6
74
0 10 20 30 40 50 60 70 80 90 100
Other
In a cafeacute
In a waiting room
On the concourse
At the platform
participants
Base 77 who were delayed at the interchange station
Interestingly almost nine in ten participants who found out about the disruption before reaching the station waited on the platform rather than on the concourse (2) Longer delays at the boarding station (31 minutes or more) resulted in significantly more participants waiting on the concourse (c20) rather than on the platform (c5) However this may be due to the platform number not being announced for longer delays until closer to the time that the train arrives
26
The top three locations when waiting during a disruption per delay length were
0-5 minutes delay 11-20 minutes 31-60 minutes At the platform (90) At the platform (81) At the platform (65) On the train (7) On the concourse (9) On the concourse (18) Anywhere else (4) On the train (7) On the train (5)
6-10 minutes 21-30 minutes 60+ minutes At the platform (81) At the platform (83) At the platform (54) On the train (13) On the concourse (6) On the concourse (22) On the concourse (4) On the train (4) Waiting roomon train
(10) Base 0-5 minutes 160 6-10 minutes 250 11-20 minutes 302 21-30 minutes 155 31-60 minutes 118 60+ minutes 64
Comfort During Wait
Participants were generally uncomfortable wherever they waited during the disruption Only 38 of quantitative survey participants who were delayed at the boarding station found their location of choice comfortable Those who were delayed at the interchange station were slightly more comfortable (44)
Comfort levels varied very much depending on the waiting location Waiting in a cafeacute or a waiting room resulted in the highest levels of comfort Participants who waited on the platform the main location where participants waited were significantly less comfortable than those who waited in a cafeacute or waiting room
Figure 16 Proportion who said they were comfortable by waiting location at boarding station
23
33
37
40
67
71
71
0 10 20 30 40 50 60 70 80 90 100
Other
On the concourse
At the platform
On the train
At a shelter
In a waiting room
In a cafe
participants
Base 7 (cafeacute) 14 (waiting room) 6 (shelter) 52 (train) 559 (platform) 55 (concourse) 13 (other) Very low bases for some of these subgroups
Where the disruption was first noticed (ie before reaching the station when arriving at the boarding station or when already on the train) did not have a noticeable impact on comfort levels suggesting that even if rail users are given notice of the disruption their discomfort and likely satisfaction is not impacted positively or negatively
27
However the length of the disruption of course did have an impact on levels of comfort a Figure 17 shows
Figure 17 Comfort during disruption by length of delay
57
43
34
35
25
22
38
43
57
66
65
75
78
62
0 10 20 30 40 50 60 70 80 90 100
0-5 minutes
6-10 minutes
11-20 minutes
21-30 minutes
31-60 minutes
60+ minutes
Total
participants
Comfortable Not comfortable
Base 706 (total) 37 (60+) 84 (31-60) 101 (21-30) 218 (11-20) 160 (6-10) 106 (0-5) those who were delayed at the boarding station
Longer delays at the boarding station resulted in a decrease in comfort ndash 57 of those delayed 0-5 mins were comfortable compared to only 34 of those delayed 11-20 minutes (statistically significant)
Summary
The longer the disruption the more frustrated resigned and stressed passengers get particularly when the disruption occurs during a commuting journey
79 of those at the boarding station and 74 at an interchange station waited for the disruption to end on the platform
Only 37 said the wait on the platform at the boarding station was comfortable (whereas for the few who waited at a cafeacute or a waiting room 71 said the wait was comfortable)
The longer the delay at the boarding station the more uncomfortable it was perceived to be
28
Handling of the Disruption
Overall when asked to rate how well the rail company handled the disruption quantitative survey participants felt that the travel disruption was not handled very well Only 22
10believed that it was handled well
Figure 18 Rating of how the rail company handled the disruption
Very poorly15
Poorly23
Neither34
Well17
Very well5
Dont knowno opinion
6
Base 1049
Over a quarter (27) of commuters found the handling poor compared with 15 of business travellers and 17 of those travelling for leisure Similarly commuters were significantly less likely to find the disruption was handled very well (2) than business (8) and leisure travellers (13)11
Unsurprisingly the length of the delay contributes to the dissatisfaction with the handling of the disruption as the proportion of participants viewing this as poorly rises from 6 and 11 for the shortest delays to 31 for 31-60 minute delays and 27 for delays of more than 60 minutes The mean satisfaction score (where 1 = very poorly and 5 = very well) by disruption length is shown in Figure 19
10 A further breakdown of answers to this question can be found above in Figure 7 11 However there is no correlation between purpose of the disrupted journey and satisfaction with handling the disruption The difference was statistically significant at the 95 confidence level
29
Figure 19 Mean rating of how the rail company handled the disruption by disruption length
308
29
271
251
24
251
1 2 3 4 5
0-5 mins
6-10 mins
11-20 mins
21-30 mins
31-60 mins
60+ mins
very poorly very well
Base 0-5 mins 160 6-10 mins 250 11-20 mins 302 21-30 mins 155 31-60 mins 118 60+ mins 64
Age does not correlate with the rating of how a disruption is handled to a great extent though those 65 years or older are significantly more likely to say that the disruption was handled very well (17) than any other age group
Another key driver for satisfaction with the handling of the disruption was the satisfaction with the information received during the disruption 66 of those who felt that the information received during the disruption was good or very good also felt that the rail company involved in the disruption handled this well whilst only 5 thought the rail company didnrsquot handle the disruption well this difference is statistically significant Similarly 74 of participants who felt the information received was poor or very poor also thought the handling was poor
Figure 20 Rating of information by how well the rail company handled the disruption
1
36
10
38
20
19
54
5
12 2
2
0 10 20 30 40 50 60 70 80 90 100
TOC handleddisruption well
TOC handleddisruption
poorly
participants
Very poor Poor Neither Good Very good Dont knowNo opinion
Base 234 TOC handled information well 397 TOC handled information poorly
Amongst qualitative participants there were a handful of positive disruption stories The station master at Meldreth Bern for example updated his local Facebook page to advise passengers of disruptions The information could also be seen on a blackboard that was kept up to date At the time of disruption he met and greeted passengers before they
30
parked to advise them of changes and saved them time parking their vehicle He booked taxis for passengers to neighbouring Royston if there were known disruptions to the village stations It was the helpful advice and meaningful alternatives that made this disruption handling very successful
Case study 5 Bern Station Master Meldreth
Example of best practice Up-to-the-minute communication delivered in a reliable and friendly way (f2f and local social media groups) offering helpful advice and meaningful alternatives
Furthermore Virgin West Coast were described as very good at delivering key information at point of disruption Participants reported that they provided times for each of the stations connection information and alternatives delivered in person or across tannoy offering face-to-face contact if needed and offered appropriate refreshments They further provided follow-up notices about compensation implications FGW and LNER were also singled out as having train guards with big personalities who are proud of their roles are highly personable and committed to customer service
When delays occurred it was critical to qualitative participants that TOCs are proactive and advise of potential issues to allow passengers to make alternative plans They thought a disruption was handled well if they could see the following
Reason respond remorse responsibility Human touch Cross network approach TOCs liaising with regards to connections and transferring tickets
31
Anticipating problems and advising of alternative routes eg ldquoYou could change hereas there might be some congestion which would cause delayrdquo
Summary
Handling of the disruption by the TOC was perceived as poor or very poor by 38 with only 22 thinking it was handled well Commuters were most likely to find the handling of the disruption as poor Longer disruptions contributed to poor ratings as did cancellations
32
4 Information During Disruption
Information Needs
Participants in the qualitative stage were asked to complete lsquojourney mapsrsquo focusing on the information needed at different stages of the journey they undertake
Before travelling they wanted to know Is my train running on time Will I get a seat Is my train overcrowded Have trains run on time today What platform is it on Where to stand on the platform
Once at the station they were concerned with Should I purchase my ticketcar park Is my train still due in at x time Is there a platform change Up to date loading data
If a disruption was to occur at this stage of the journey their key questions would be
Around disruption scale
Reason ndash congestion vs suicide
How long it will be delayed
Connection implications Around alternative travel arrangements
Where shall I go instead
What is the fastest route from A to B
Other relevant modal information eg busescabs
Are tickets transferable
At the point of disruption qualitative participants said they would check multiple sources so that consistency of information was a key concern for them One way of achieving this would be through development of a multi-modal app
Information about disruptions occurring before getting on the train were received in a variety of ways For example the majority opted for lsquoalertsrsquo via text or push notification and many also checked the TOCrsquos app or their Twitter feed Participants also reported that they lsquoused big datarsquo to personalise the information Whilst a blackboardwhite board outside of station or in ticket office was also cited repeatedly as source of information it became clear that station staff are now key to get up to date with travel information (Station Master or staff in high vis clothing who have iPads on the platformconcourse) Participant were looking for platform screens to include matrix touch screens video feeds
33
with real-time news which means that websites need to be updated continuously This was especially important as participants said they would continue to check journey alerts
Once on the train participants wanted to receive information mainly around disruption scale and alternative travel arrangements Questions around information needs during this stage of the journey included
Why the train has stopped What is the best alternative What is the reason for the delay Where could I get off What is the scale of the delay Whether tickets are transferable What is the ETD What are the compensation What is the ETA at each station arrangements What implications does this have for
connections
The moment the train pauses or goes unusually slowly participants were looking for an lsquoimplications explanationrsquo and wanted regular updates throughout the delay Participants would like to receive this from the train guard (longer distance journey) train driver LCDvisual displays touch screens with alternatives via a helpline or a live chat during train operating hours
Perception of information given
The information given during the disruption was perceived as more negative than positive with 95 of mentions being negative and only 42 positive
Figure 21 Perception of information given
Base 1049 more than one answer could be given so percentages add up to more than 100
Cancellation of trains resulted in considerably more negative comments as did delays of over 60 minutes
34
35
Table 2 Perception of information given by length of delay and whether train cancelled
Total
Length of delay Whether train
cancelled
0-5 mins
6-10 mins
11-20 mins
21-30 mins
31-60 mins
60+ mins
Yes
No
Insufficient 26 21 18 26 31 36 45 32 25
Adequate 21 21 29 18 20 18 16 18 22
Inadequate 19 9 11 22 26 26 36 30 16
Unclear 19 8 15 19 26 26 33 27 17
No information given 15 27 16 15 8 8 3 9 17
Clear 13 14 16 12 12 14 11 11 14
Too infrequent 10 6 6 11 10 17 23 12 10
Useful 9 11 10 10 5 6 5 7 9
Informative 8 9 10 7 8 8 6 6 9
Helpful 6 8 7 6 6 5 5 5 7
Timely 6 7 7 6 3 6 3 4 6
Inaccurate 6 3 2 8 5 10 16 9 5
Other 6 4 7 6 8 4 14 9 6
Base 1049 160 250 302 155 118 64 245 804
Tone of information
As a whole the tone of information given was perceived as neutral the inconvenience caused was acknowledged however the general tone was deemed indifferent Just over a fifth of quantitative survey participants each described the tone more positively 22 easy to understand 22 apologetic and 21 informative Figure 22 Tone of information provided
Base 895 (all those who were given information) more than one answer could be given so percentages add up to more than 100
7
1
3
3
7
9
21
22
22
25
36
0 10 20 30 40 50 60 70 80 90 100
Other
Rude
Lacked respect
Cared about my needs
No information received
Lacked care
Informative
Apologetic
Easy to understand
Indifferent
Acknowledged the inconvenience
participants
Rating of information
Overall 25 rated the information as good or very good and 45 as poor or very poor See Figure 23
Figure 23 Rating of the information received about the disruption
Base 1049
Very poor16
Poor29
Neither28
Good22
Very good3
Dont knowno opinion
2
When asked about what information was poor participants focused especially on the content of the information provided to them during the disruption a lack of or inadequate information was noted by almost a quarter of participants and a similar proportion of participants were unhappy about a delay in providing information The information was deemed vague unclear or inaudible by 10 of the participants
Similarly key information perceived as good centred around reasons given for the disruption In contrast to vague unclear inaudible information as reported by those who found the information poor it was reported as reported clear and concise by some These should be the focus of what and how TOCs provide information during disruption
36
Figure 24 Good information during disruption
6
2
3
3
3
6
8
8
9
9
13
13
14
14
15
17
32
0 10 20 30 40 50 60 70 80 90 100
Other
Information available online
Information provided via app
Information from station staff
Accurate information
Apology given
Timely information - in advance etc
Information re onward travel
Announcements
On-train information
TimingsETA given
Information on boardsscreens
Clearconcise information
Information provided (general)
Updates provided - good regular
Length of delay
Reason for disruption
participants
Q28 Base 263 (those who found information good) more than one answer could be given so percentages add up to more than 100 Chart only shows mentions gt1
During the qualitative stage participants said they would want to hear the following
An apology (more than once) The reason the train is delayed eg sheepsuicidestaff Estimated time of arrival at EVERY station Impact on connectionsticket validity We will update you again within 5 minutes We are doing everything we can to get you in on time Please check your app We know this isnrsquot acceptable We will refund ndash this is how
As with the quantitative findings participants here also said that the tone of voice was very important They were looking for information that was delivered in a very apologetic almost self-flagellating way showing genuine concern and with a reassuring optimistic and bright tone A human touch if appropriate humorous was also welcome Key to this was that the information would be given proactively via text message or email or via a TOC app
37
Figure 25 What information during disruption was poor
2
2
2
2
5
7
7
8
10
10
13
18
19
22
23
24
0 10 20 30 40 50 60 70 80 90 100
Other
No apology
Delay repaycompensation issues
Information available online
Information on boardsscreens
Noinsufficient updates
Poor communication (general)
Lack of information (onward travel)
Vagueunclearinaudible
Staff uninformedunavailable
No ETAlength of delay
Inaccurateconflicting information
No information provided
No reason for delay
Delay in providing information
Lack of or inadequate information
participants
Base 467 (those who rated the information as poor) more than one answer could be given so percentages add up to more than 100 Chart only shows mentions gt1
Summary
Overall the information given during the disruption was perceived as more negative than positive 95 negative comments (eg 26 insufficient 19 unclear 19
inadequate 15 none given) and 42 positive comments (eg 13 clear 9 useful 8 informative)
As a whole the tone of information given was perceived as neutral 36 said the
inconvenience caused was acknowledged 25 said it was indifferent Just over a fifth each described the tone more positively 22 easy to understand 22 apologetic and
21 informative
Overall 25 rated the information as good or very good and 45 as poor or very poor The main examples of poor information were lack of or inadequate information (24)
delay in providing information (23) and no reason given (23) The main examples for good information were reason given for the disruption (32) and the length of delay
(17) These findings provide clear pointers as to how TOCs should provide information during disruptions
Reception of Information
Participants were asked where they first received information about the disruption
38
Amongst qualitative stage participants there was a high demand for an app built on real-time GPS data with push notifications Participants were reliant on a range or apps for journey planning and perceiving real-time information including Citymapper National Rail Enquiries and Trainlinecom
Third party apps were viewed as independent highly trusted delivering the bigger picture eg offering more than just network data and also show early updates that are accurate However many commuters were more familiar with their TOC and would prefer apps from them These apps were viewed as good for specific routes with dedicated journeys saved in the app and many qualitative participants would check the apps first thing in the morning and before leaving the office There was a general feeling amongst participants that none of the existing apps goes far enough and that these apps are not always consistent with other information especially at times of disruptions
Participants hence were looking for something that was an all-in-one ticketpayment and information source Key for this to work would be GPS data TOC data personal data accuracy in information and real-time information Participants were looking for this app to provide disruption alerts for pre-set journeys fastest journey prediction including alternative TOCsmodes platform information and changes seat availability and loading data as well as rail driver information
ldquoThey should look at Uber Itrsquos so easy to use and you can track where your driver is at any momentrdquo
London Commuter
Amongst survey participants nearly four in ten (39) first noticed information about the disruption to their train journey via a display at the station Rail staff continues to be one of the key early delivery methods of information though predominantly via PA announcements Face-to-face information through members of staff only make up 8 of all initial points of information Only 13 of participants learned about the disruption first via an App or the internet with the National Rail app the main one
39
Figure 26 How information is first received
1
3
1
1
1
2
2
2
4
5
5
16
18
39
0 10 20 30 40 50 60 70 80 90 100
Dont know
Other
Member of staff at the station
Other travel app
Member of staff on the platform
Rail company app
Family friend or fellow traveller
Trainline app
Member of staff on the train
National Rail app
PA announcements at station
PA announcements on train
Display at station
participants
Base 1049
Amongst the survey participants who learned about the disruption before reaching the station App usage was significantly higher than amongst those who learned about the disruption at a later stage A third of all participants who learned about the disruption before reaching the station were significantly more likely to hear about this via the National Rail app 22 learned about it via the Trainline app and 8 found out through a particular rail companyrsquos app compared to almost none of the participants who learned about this later
Where the first information of the disruption was delivered via a Rail company app PA announcements on the train or members of staff on the platform participants were most likely to be satisfied with the handling of the disruption by the TOC Other travel apps and displays at the station had the opposite effect ndash here participants were significantly more likely to think the situation was handled poorly rather than well
Table 3 Rating of how TOC handled disruption by information source
TOC handled disruption well
TOC handled disruption poorly Base
Rail company app 37 32 19
PA announcements on train 33 31 187
Member of staff on the platform 31 25 16
Trainline app 28 43 40
PA announcements at station 25 34 173
Member of staff at the station 25 42 12
Twitter 25 25 8
Display on train 25 0 4
Member of staff on the train 23 42 48
National Rail app 19 42 53
Display at station 17 42 406
Other travel app 15 54 13
Family friend or fellow traveller 6 28 18
40
When asked which if any sources they recalled receiving information about the disruption during the disrupted journey this was a little different from the initial source mainly because more than one source could be mentioned although the ordering is similar
Quantitative survey participants recall receiving information about the disruption predominantly when itrsquos announced through a display at the station (45) PA announcements at the station (39) or on the train (37) The next most frequently remembered method of delivery is the National Rail app (13) followed by members of staff on the platform and on the train as well as via the Trainline app (8 each)
Figure 27 From which sources received information about the disruption during disrupted journey
1
3
3
3
4
6
8
8
8
13
37
39
45
0 10 20 30 40 50 60 70 80 90 100
Rail company app
Member of staff at the station
Family friend or fellow traveller
Display on train
No information received
Member of staff on the platform
Member of staff on the train
Trainline app
National Rail app
PA announcements on train
PA announcements at station
Display at station
participants
Base 1049
Qualitative stage participants found visual displays on the train helpful but pointed out that they needed to provide ETD implications and ETA at each station There was a keen interest for these to be used more actively answering questions such as
How long will the train be held at a red signal What time do we get in at the next station Is it now better to get off and change
Emotions When Receiving Initial Information
Finding out that their journey was disrupted caused a range of emotions in participants
Qualitative stage participants felt that poor management of disruptions and lack of communication exacerbates emotional and financial impact There was a clear desire for honest dynamic information delivered proactively to allow for passengers to regain control
41
--
-
The lack of proactive lsquoup to datersquo information dominated the range of frustrations voiced by qualitative stage participants and they had a strong desire for increased staff visibility However addressing the information hole via automateddigital channels would help all the frustrations Participants reported of a variety of frustration lsquocategoriesrsquo
lsquoHumanrsquo Absence of staff to answer questions eg on the platform Live Chat
No human response ndash they all hide
Lack of clear diction ndash do you know the Muffle Man
Dismissive staff
Need some lsquoRRRRrsquo - reason (whatrsquos happened) response (what are we doing about it) remorse (we are sorry) responsibility (we will rectify in the future by)
Connection
Knock on impact eg missing connecting trains
Implications for seat availability for longer journeys - where trains are cancelled and seat reservations get ignore
Informational
Absence of any explanation
No real time information eg train stops without reason
Inconsistency of information eg Platform screen different to App to Twitter
Lack of confidence in real time information eg expected train time keeps being delayed by 1 minute then 2 minutes then 3 minutes etc
Case study 6 Greater Anglia
Who Female commuter (45 65 years old) from London When 4 5 times a week from London Liverpool Street to Hertford East What Trouble with the power lines Problems encountered chaos at Liverpool Street Station dismissive staff
boardsannouncements not up to date and not informative no ETD or alternatives provided
Positives encountered one staff member eventually radiorsquod the train driver to get a specific ETD which allowed passenger to make a choice and to Moorgate Hertford North and then take a taxi home
ldquoThe station staff at Liverpool Street were hellip I mean she just flicked her hand at me in a dismissive way and said lsquoI donrsquot know read the boardsrsquordquo
ldquoIrsquom lucky that I have two choices of train line near me but I have a season ticket so itrsquos important that the ticket is then transferablerdquo
Quantitative survey participants reported mostly negative emotions when first receiving information about the disruption which were very similar to those recalled when initially
42
learning about a disruption (see Figure 13) though slightly more balanced Only 55 felt frustrated (rather than 63 in the previous question) and 12 felt informed
Figure 28 Emotions when receiving initial information
2
5
8
12
12
14
18
25
37
55
0 10 20 30 40 50 60 70 80 90 100
Reassured
In control
Calm
Uncertain
Informed
Anxious
Angry
Stressed
Resigned
Frustrated
participants
Base 974 (all those who were given information)
Predictably feeling angry and stressed increased as the length of disruption increased A very short delay (0-5 minutes) unsurprisingly lead to significantly fewer quantitative survey participants saying they felt frustrated (40) than delays between 11 and 60 minutes (60-69) This feeling decreased however for delays of 60 minutes or more where the percentage dropped to 57 These participants had an increased feeling of uncertainty (26) compared to those with a delay of 10 minutes or less
Some factors influenced the emotions of quantitative survey participants For example when the reason of the disruption remained unexplained or were service-related issues participants felt significantly more resigned (41 and 44 respectively) than when a problem with the train caused the disruption (22) Commuting participants felt significantly more frustrated (60) than leisure travellers Those in turn felt significantly more uncertain when experiencing disruptions (19) than commuters (11) or business travellers (9)
Listening for Announcements
To avoid those frustrations most quantitative survey participants said they always actively listen for announcements at the boarding station (73) and on the train (51)
Age seems to have an influence on the frequency of listening out for announcements Participants older than 65 generally try to listen to announcements on the boarding station (85) and on the train (63) whilst participants under 35 make less of an effort to always listen (65 and 47) At the boarding station and on the train however the younger participants are more likely to listen if they think there may a delay or disruption (26 at station and 15 on train vs 12 and 2 of the 65+ year olds)
43
Figure 29 Whether actively listen for any announcements at the boarding station
73
20
4
1
2
0 10 20 30 40 50 60 70 80 90 100
Yes always
Only if I think there may be a delay or disruption
No
My station doesnt have a PA system
Other
participants
Base 1049
Figure 30 Whether actively listen for any announcements on the train
51
33
12
3
2
0 10 20 30 40 50 60 70 80 90 100
Yes always
Yes only when I can hear them
Only if I think there may be a delay or disruption
No
Other
participants
Base 1049
Frequency of Announcements
Frustrations can also be avoided when information about disruptions are given at the right time
Overall if on a train that seems to be running slower than it should be or stops between stations 72 of quantitative survey participants wanted to receive information about the delay within five minutes and 20 within 6-10 minutes
Overall when there is a disruption to the rail service slightly more (75) would like announcements to be made within five minutes and 18 within 6-10 minutes
See Figure 31 which all shows the data disaggregated by journey purpose
Commuting participants are more likely to be interested in receiving information about slow running every 0-5 minutes 74 of participants feel that this is appropriate when being on a train that seems to be running slower than it should be or stops between station and 78 feel this is appropriate when a disruption is already occurring
44
Figure 31 Immediacy of information during slower service (left) vs during disruption (right)
Base 1049 (total) 674 (commuting) 205 (business) 138 (leisure)
Business and leisure travellers have contrasting view in the two scenarios where business travellers would like more frequent updates during slow running of service leisure travellers would like more information during disruptions
Quantitative survey participants were then asked whether it would be annoying if announcements were made more frequently than their preferred frequency For just over half it would not be annoying and for 41 it would be a little annoying Just 8 said it would be very annoying
Figure 32 Would it be annoying if announcements were made more often than preferred frequency
Very much8
A little41
No51
Base 1049
45
Leisure travellers are significantly less likely to feel very much annoyed (2) compared with commuters (9) or business travellers (10)
In summary our research shows that announcements are likely to be most welcome if they are made within five minutes for both slow running services and disruptions and most passengers would not be annoyed if it was more frequent than their preferred frequency
Participants were asked which they would prefer in situations when there are no announcements made because the train company doesnt have enough information
A) an announcement made with very little or no information B) an announcement made once there is some information
The consensus across rail passengers is that an announcement made with very little or no information is much better (80) than having to wait for an initial announcement until there is some information (20)
Summary
39 first noticed information about the disruption via a display at the station PA announcements on train (18) and PA announcements at the station (16) are also important sources Only 13 first learned about the disruption via an App or the internet with the National Rail app the main one If the information source was a rail company app PA announcements on the train or members of staff on the platform were most likely to be satisfied with the handling of the disruption by the TOC Other travel apps and displays at the station had the opposite effect
Unsurprisingly learning about a disruption to the journey resulted in negative emotions and participants tried to avoid these by always actively listen for announcements at the boarding station and on the train
Participants felt that the ideal frequency for information to be disseminated is every 0 to 5 minutes 72 for a slower running service and 75 for a disruption
If the frequency of announcement is higher than preferred most would not be annoyed
Announcements made within five minutes for both slow running services and disruptions would be most welcomed by passengers
Four fifths prefer that an announcement is made with very little or no information than having to wait until there is some information
46
Additional Information during Disruption
Participants were asked what else in addition to general information about the disruption they are looking for and what tone the information should be delivered in In addition they were asked about their likely behaviour during severe disruptions
Behaviour in Severe Disruption
A disruption of up to 45 minutes for a journey of 60 minutes length and having to change trains in order to reach your destination was classified as a severe delay in this survey
In cases of a severe delay like this a large proportion of survey participants would stay at the station waiting for updates (41) or make the journey using another train (19) Only 7 of participants would leave the station in this scenario - 5 of participants would cancel the trip altogether whilst 2 would return later to continue the disrupted journey A further 13 would make the journey using an alternative route and the remaining 11 would make the journey using another mode of travel
Figure 33 Behaviour if arrived at the station to find out about severe disruption
3
5
2
5
11
13
19
41
0 10 20 30 40 50 60 70 80 90 100
Dont know
Other
Leave the station and return later
Cancel the trip and go home
Make the journey using another mode of travel
Make the journey using an alternative route
Make the journey using another train
Stay at the station waiting for updates
participants
Base 1049
Participants who said they would stay at the station and wait for updates were asked what was the longest they would be prepared to wait for such a journey
0-5 mins 1 6-10 mins 3 11-20 mins 20 21-30 mins 31 31-60 mins 37 60+ mins 8
The average time was 45 minutes
47
Tone of Information
Quantitative survey participants were also asked which of the following tones of information they would prefer in normal and severe disruptions Qualitative research had shown that these seven tones of information were in particular demand from travellers during disruptions
Clear = easy to hear and to understand Correct = factual and up to date Concise = short and regular Confident = genuine and honest Conciliatory = apologetic and empathetic Consistent = across different channels andor providers Personal = tailored to your circumstances
The quantitative survey participants could give a maximum of three answers out of a list of seven tones specifying their first second and third choice Overall participants were looking for assurance through information provided about the disruption therefore looking predominantly for correct and clear information during normal disruption but also during severe disruption that would increase the journey time by 75
Figure 34 Preferred tone of information provided12
9
10
7
9
12
23
30
4
5
8
13
15
25
30
0 10 20 30 40 50 60 70 80 90 100
Personal
Conciliatory
Consistent
Concise
Confident
Clear
Correct
participants
Average disruption
Severe disruption
Base 1049
As the disruption gets more severe participants would like to see a conciliatory tone of voice and a more personal touch to the message
12 To distil the one preferred tone of voice the count for each tone was multiplied by three for the first choice by two for the second and by one for the third The values were then added up and divided by 6 before dividing it by 1049 to get the overall percentage
48
Level of Detail of Information during Disruption
Quantitative survey participants were asked what level of detail about the cause of the disruption they would prefer from the following
Very detailed for example this train is running 25 minutes late because of damage to the overhead electric wires between Birmingham New Street and Longbridge caused by a falling tree
Quite detailed for example this train is running 25 minutes late because of damage to the overhead electric wires between Birmingham New Street and Longbridge
Not detailed for example this train is running 25 minutes late
Figure 35 Level of detail about the cause of the disruption preferred
Very detailed61
Quite detailed37
Not detailed2
Base 1049
Over six tenths prefer very detailed information on the disruption containing for example the length and exact nature of the disruption Quite detailed information comprising of length and some information on the nature of the disruption was preferred by 37 Only very few participants would look for basic not-detailed information (2)
Some differences of opinion can be seen when looking at age of the passenger and satisfaction with handling of the disruption 16 to 35-year olds are significantly more likely to want very detailed information (67) than passengers that are 36 to 55 (57) or 56 to 64 (54) Furthermore significantly more participants who rate the TOC handling of the disruption as poor would prefer very detailed information (67) than those who rate the handling good (55)
49
Table 4 Preferred level of information
Level of information 16 -35
36 -55
56 -64
65+
Well -handled
Poorly handled
Very detailed 67 57 54 58 55 67
Quite detailed 30 40 44 41 42 31
Not detailed 3 3 2 2 3 2
Donrsquot know 1 0 0
Base 388 464 127 59 234 397
= less than 05
Preferred Staff Behaviour in Severe Disruptions
Quantitative survey participants were asked which of the following they would like staff to do if the disruption was particularly severe
Take responsibility Give you a named person for follow up Escalate to management Find me an alternative mode of transport to complete my journey Find me an alternative route to complete my journey Provide information on compensation Other
They were asked to choose the top three
As only 5 of participants would consider abandoning a severely disrupted journey participants were predominantly interested in information that would help them find an alternative arrangement to complete the journey as Figure 36 demonstrates
50
Figure 36 Preferred staff behaviour in severe disruptions13
1
3
4
16
20
26
30
0 10 20 30 40 50 60 70 80 90 100
Other
Give a named person for follow up
Escalate to management
Provide information on compensation
Take responsibility
Find an alternative mode of transport to completejourney
Find an alternative route to complete journey
participants
Base 1049
In case of a severe disruption the majority viewed information about options such as connections or alternative routes as most important (51) followed by information about the cause of disruption (44) An apology for the disruption was viewed as less important (4)
Figure 37 If the disruption was particularly severe which of the following would be most important and 2nd most important
44
4
51
47
16
37
0 10 20 30 40 50 60 70 80 90 100
Information about the cause of disruption (eg thecause and how long it will last)
An apology for the disruption
Information about options (eg connections oralternative routes)
participants
1st 2nd
Base 1049
13 the count was multiplied by three for the first choice by two for the second and by one for the third The values were then added up and divided by 6 before dividing it by 1049 to get the overall percentage
51
ndash
Case study 7 Virgin West Coast
Who Female business and leisure traveller with osteoporosis (65+ years old) from Birmingham
When First Class journey from Birmingham New Street What Severe weather (Storm Gareth) Problems encountered other than the disruption itself none Positives encountered uniformed staff on the platform equipped with iPads to
inform travellers of alternatives proactively opened the waiting room and 1st Class lounge for people to shelter and keep them warm kept everyone information of expected arrival and departure times
ldquoI canrsquot thank Virgin enough for that they are like a Swiss rail companyrdquo
Example of best practice
Importance of an Apology
Amongst quantitative survey participants taking responsibility nevertheless only came out as the third most important aspect of what staff should do 34 viewed an apology from the TOC for the disruption as very important and a further 34 as quite important Only 30 find this not at all or not so important
Figure 38 Importance of an apology from the TOC
5 25 34 34 2
0 10 20 30 40 50 60 70 80 90 100
participants
Not at all important Not so important Quite Important Very important Dont know
Base 1049
During the qualitative research participants showed that ongoing disruption experience and bad handling of it could encourage modal shift Frustrations with the rail service lead to a lack of confidence in the service which ultimately resulted in participants questioning why they were taking the train rather than driving An apology or apologetic tone could somewhat break this cycle
However quantitative survey participants did not find it very important to see rail staff when there are interruptions to the rail service only 2 thought this was essential and a further 14 found this quite important
52
Figure 39 Importance of being able to see rail staff when there are disruptions to the rail service
Essential2 Quite important
14
Not so important38
Not at all important46
Base 1049
Agreement with statements about disruptions
Overall 68 of quantitative survey participants agreed that there should be an apology for any disruption however short it is Only 14 disagreed Female passengers found it more important to hear an apology as 40 found an apology very important (29 men statistically significant)
When asked if they agreed with the statement that lsquosometimes the train company is deliberately evasive about the reason for disruptionsrsquo only 13 disagreed with this statement signalling that there is a lack of trust in TOCs
Figure 40 Agreement with statements about disruptions
22
25
36
43
29
23
13
7 2
0 10 20 30 40 50 60 70 80 90 100
Sometimes the train company is deliberately evasiveabout the reasons for disruptions
There should be an apology given for any disruptionhowever short it is
participants
Strongly agree Agree Neither Disagree Strongly disagree
Base 1049
53
Figure 42 Events about which information would be appreciated
Honesty was viewed as extremely important 80 of participants said it was very important that the train company be honest even if that means saying they do not know what is happening
Figure 41 Importance that the train company is honest even if that means saying they do not know what is happening
Base 1049
Not so important3
Quite Important17
Very important80
Content and Delivery of Additional Information
Quantitative survey participants were also asked whether and how they would like to receive information about the causes of the disruptions 80 of participants said they would like this additional information and they are interested in hearing about certain events more often than others Amongst qualitative participants similar needs were reported Figure 42 demonstrates the response from survey participants
13
38
41
43
45
48
49
52
54
62
67
71
0 10 20 30 40 50 60 70 80 90 100
None of the above Other
Leaves
Landslips
Cable theft
Buckled rails
Snow and ice
Flooding
Fatalities
Vandalism and trespass
Knock-on delays
Engineering works
Signals and points failure
participants
54
Base 835 (those who would like to receive information about causes)
Weather related causes of disruptions were less important to quantitative survey participants than infrastructure issues engineering works or external factors like vandalism Sixty-two per cent of participants would want to know about knock-on delays
Amongst the preferred method of delivery for information on these events are announcements on trains (55) through a member of staff on the platform (46) and on travel apps (45)
Figure 43 Preferred delivery method of information
2
10
13
15
18
23
28
38
41
43
45
46
55
0 10 20 30 40 50 60 70 80 90 100
Other
Leaflets at stations
Text message
In emails
On social media
Through messaging apps
Posters at stations
On NRE website
Member of staff on the train
Member of staff at the station
On travel apps
Member of staff on the platform
Announcements on trains
participants
Base 835 (those who would like to receive information about causes) more than one answer could be given so percentages add up to more than 100
Significantly more participants with a mental health andor social disability would like announcements on trains (70) or on social media (36) than participants without any disability (55 and 16 respectively)
Summary
If they experience a severe disruption only 5 would abandon the journey Almost half would stay at the station waiting for updates and be prepared to wait an average of 45 minutes In cases like this participants said they would want information about options such as connections or alternative routes but also know about the cause of disruption
For both normal and severe disruptions participants most want lsquocorrectrsquo (30 normal 30 severe) and lsquoclearrsquo (25 normal 23 severe) information As the disruption gets more severe participants would like to see a conciliatory tone of voice and a more personal touch to the message
61 prefer very detailed information on the disruption and 37 quite detailed information
55
Figure 44 Apps and websites used during disruption
-
In case of a severe disruption 51 viewed information about options such as connections or alternative routes as most important followed by information about the cause of disruption (44) An apology for the disruption is viewed as less important (4)
80 said it was very important that the train company be honest even if that means saying they do not know what is happening
80 wanted addition information on causes of disruption with signal and points failures (71) engineering works (67) and knock on delays (62) the most sought after information
Infographic style information on causes of disruptions via a variety means such as posters at stations on their apps and websites leaflets at stations etc would be welcomed by passengers
Delivery Mechanism of Information
This section focuses on how information is obtained during disruptions looking particularly at PA announcements
To stay up-to-date with journey information the majority of survey participants used at least one app or website during their journey being disrupted ndash only 10 did not use any and 50 used more than one method The most popular method to obtain information during disruption was the National Rail Enquiries website
1
10
1
1
1
1
1
1
3
4
7
9
10
10
20
29
29
41
0 10 20 30 40 50 60 70 80 90 100
Dont knowcant remember
None
Other
Rail company app
Other travel app
Realtime Trains app
Google Maps app
Google Maps
Citimapper
Trainline app
National Rail app
Specific rail company app
Friend family or fellow traveller
Rail company website
Trainline or other booking site
National Rail Enquiries website
participants
Base 1049 more than one answer could be given so percentages add up to more than 100 This code combines apps such as Thameslink app Southern app SWR app etc
56
The apps and websites used most when there is a disruption are shown in Figure 45 The two main sources were the National Rail Enquiries website (28) and Trainline or other booking site (23)
Figure 45 Apps and websites used most
1
3
2
2
6
9
13
14
23
28
0 10 20 30 40 50 60 70 80 90 100
Dont knowcant remember
Other
Friend family or fellow traveller
Other travel app
Rail company website
Rail company app
Trainline or other booking site
National Rail Enquiries website
participants
Base 931 who used one or more apps or websites
Considering that 50 of quantitative survey participants said they use more than one source of information to keep updated on disrupted journeys it is not surprising that not all of the sources available are trusted When asked which method they would trust most for information about disruptions participants gave a large range of answers with PA announcement at stations and on train most trusted followed by displays at stations The top five most trusted sources of information are linked directly to rail staff whether this is through PA announcements displays or members of staff Interestingly apps and websites were not as trusted as the more traditional means
57
Case study 8 LiveMinds exercise
Figure 46 Trusted most for information about disruption
4
1
1
1
1
2
4
4
9
14
16
24
26
28
31
37
42
53
0 10 20 30 40 50 60 70 80 90 100
None of the above
Southeastern app
Realtime Trains app
Citimapper
Email or text alert
Travel news updates on radio or television
Friends or family
Display on train
Trainline app
Member of staff at the station
National Rail app
Member of staff on the train
Member of staff on the platform
Display at station
PA announcements on train
PA announcements at station
participants
Base 1037 More than one answer could be given so percentages add up to more than 100
Qualitative stage participants also showed a higher level of trust in third party websites and apps than in individual TOCs
Quantitative survey participants were asked why they trusted the source they mentioned and the responses were lsquohand-analysedrsquo and coded to a code frame
58
The main reasons are concerned with the information being up-to-datelive (28) and accurate (20)
Figure 47 Why trust source
1
3
1
1
1
1
1
2
2
3
4
5
5
5
7
9
9
10
10
15
20
28
0 10 20 30 40 50 60 70 80 90 100
Dont know
Other
Only option available
Available to all - not everyone has internet etc
More accountableresponsible
Announcement
Chose National Rail app (not Trainline)
Consistent
Combined sources of informationoverview
First-hand information
Easily accessible
On sitevisible
Openhonesttransparent
Quicker
Experience - proven over time
Direct from source - official
Staff members
Reliabletrustworthy
Real personpersonal touch - can ask questions
Better information
Accuratecorrect
Up-to-datelive
participants
Base 1009
PA Announcements
Quantitative survey participants were asked how much they valued PA announcements when there are disruptions at the station and on the train
PA announcements are not only trusted most but the majority of participants also viewed them as essential 57 felt that PA announcements at the station were essential and 61 felt that PA announcements on the train were essential
Figure 48 How valued PA announcements are at station and on the train
1
4
4
39
35
57
61
0 10 20 30 40 50 60 70 80 90 100
at station
on train
participants
They are not at all important They are not so important They are important They are essential
Base 1049
59
The preferred interval for PA announcements was probed By a large margin participants preferred PA announcements to be every 0-5 minutes at the station and on the train
Figure 49 Preferred interval of PA announcements
1
9
25
65
1
6
22
72
0 10 20 30 40 50 60 70 80 90 100
31-60 mins
21-30 mins
11-20 mins
6-10 mins
0-5 mins
participants
At the station
On the train
Base 1049
Commuters were more likely to be in favour of a 0-5 minute frequency to updates than business or leisure travellers Participants who found the handling of the disruption by the TOC to be poor were significantly more in favour of 0-5 minute frequency that those who thought the handling was done well (76 vs 65 at stations 70 vs 55 on trains)
The length of the most recent delay and the nature of the disruption do not have a significant impact on the preference nor does when the disruption was noticed
In addition to timeliness it is important that PA announcements are easy to understand Participants thought that the PA announcements during their most recent disrupted journey were slightly less clear at the station than those on trains and overall the majority thought they were not clear
60
Figure 50 Clarity of announcements at stations and on trains
39 42
35 32
10 9
16 17
0
10
20
30
40
50
60
70
80
90
100
at station on train
p
arti
cip
ants
Dont knowNot applicable
Very unclear (cant make out muchor anything that is said)
Not very clear (cant make out allthat is said)
Very clear
Base 1049
Participants who thought the TOC had handled the disruption well found the PA announcements both at the station and on the train significantly clearer than those who thought this was handled poorly
Figure 51 Clarity of PA announcements at the station
18
17
42
24
12
3
22
63
0 10 20 30 40 50 60 70 80 90 100
Don`t know
Very unclear
Not very clear
Very clear
participants
Well handled
Poorly handled
Base 234 (well) 397 (poorly)
61
ndash -
-
Figure 52 Clarity of PA announcements on the train
18
15
37
29
11
4
23
62
0 10 20 30 40 50 60 70 80 90 100
Don`t know
Very unclear
Not very clear
Very clear
participants
Well handled
Poorly handled
Base 234 (well) 397 (poorly)
Summary
When experiencing disruptions most participants sought information through apps or websites and half of them used more than one source 10 used none The most popular method to obtain information during disruption was the National Rail Enquiries website
There seems to be a general distrust in information sources though overall PA announcements were the most trusted sources of information and they were seen as essential by more than half the participants The top five most trusted sources of information are linked directly to rail staff whether this is through PA announcements displays or members of staff Interestingly apps and websites were not as trusted as the more traditional means
Key to information via PA announcements during disruptions is timeliness 0 5 minutes was the preferred interval for around three quarters at stations and two thirds on trains The clarity of the announcements was poor with the majority assessing the PA announcements unclear at both stations and on trains
PA announcements are used trusted and seen as essential Therefore it is very important that they are frequent (every 0 5 minutes) and clear when there are disruptions
62
5 The Impact of Disruption
Behavioural and Sentimental Responses to Disruption
Qualitative stage participants reported a number of stress factors when considering the impact disruptions have on them Although there were a number of factors that impacted real-time stress levels delivery of information was the key driver of stress levels Where information was provided stress levels went down whereas a lack of information resulted in escalated stress levels
Case study 9 LiveMinds exercise
ldquoI travelled from Smethwick Galton Bridge to Birmingham Snow Hill and the train was due at 1722 There was an announcement that this train would be 3 minutes late Looking at the display information sign I could see that it then became 4 minutes then 5 minutes and each time the clock would go forward as to expecting time it eventually came 7 minutes late My anxiety increased with each minuterdquo
Birmingham Leisure
Factors that impacted stress levels negatively were
No information Ever increasing delays Finding out about delay on the train Length of delay Frequency of delays Impact on personalwork life
Factors that helped bring stress levels down were
Information to plan alternative route Predictive information Proactive information eg finding out at homebefore interchange
There was an overarching preference for Train Operating Companies to manage expectations with accurate timetables even if the journey time is slower For customers
63
managed expectations meant manageable stress levels Knowing that their train would arrive at the timetabled time was important for onward planning and for prompt arrival at work Ongoing predictable delays for commuters elevated frustrations and stress levels began to escalate after every minute that the train is held This then led to
A general sense of mismanagement Erosion of confidence in the network Modal shift to road
They also reported other factors impacting dissatisfaction with rail travel such as cleanliness and availability of toilets overall costs seat availability and safety but poor resolution of disruptions has a significantly negative influence on stress levels
On the emotional side participants reported of
In the moment anxiety of not knowing where to gowho to ask Stress of homelife eg more pressure on childcare Lower confidence from missing out on meetings Unprofessional embarrassing ndash negative impact on self-worth Fear when left at stations late and in the dark
Practical implications included
Missed connecting trains Missed meetings Missed parties Missed life changing appointments No-one to pick up children
Financial impact was felt in the form of
Loss of earnings (commutersbusiness travellers) Inability to work on train (business) Nursery fees Taxi fares Cost of car park Cost of drinksbreakfast
ldquoI was terrified and will never use that train againrdquo St Albans Leisure
ldquoI had to make up the time so it made me tired all the timerdquo London Commuter
ldquoNo -one seemed to know what they are doing and thatrsquos what happens each timerdquo ldquoEvery day itrsquos at least 3 minutes late arriving at New Street
Birmingham Commuter
64
Figure 53 Impact of disruption
Quantitative survey participants were asked about the emotional financial and practical impacts the disruption had caused them
A third of the impacts cited were emotional 48 were practical and 18 were financial On average 38 impacts were mentioned by each participant The main impacts were stress with respect to work arriving home late and missed meetings
8
1
4
5
5
7
8
8
10
10
10
11
13
14
16
21
24
25
29
32
51
55
0 10 20 30 40 50 60 70 80 90 100
None of the above
Lost my passenger assist
Nursery fees
Fear
Cost of car parking
No-one to pick children up
Had to buy a new rail ticket
Lost seat reservation
Stressworry for person collecting me
Cost of drinksfood
Missed follow-on transport
Taxi fares
Inability to work on train
Loss of earnings
Missed social event
Missed appointment
Stress on homelife
Anxiety of not knowing where to go
Missed connecting trains
Missed meeting
Arrived home late
Stress with respect to work
participants
Emotional impact
Practical impact
Financial impact
No impact
Base 1049 more than one answer could be given so percentages add up to more than 100
Quantitative survey participants with a disability experienced more emotional impacts of the disruptions than those without Particularly those with mental health issues or a social disability reported on this
In addition younger age groups were more effected emotionally than older age groups More than six out of ten of 16 to 35-year olds were more stressed with respect to work and more than a third of them experienced anxiety of not knowing where to go or who to ask
65
Figure 54 Emotional impacts by purpose
Base 388 (16-35) 674 (commuting) 205 (business) 138 (leisure) more than one answer could be given so percentages add up to more than 100
Figure 55 Practical impacts by purpose
Base 388 (16-35) 674 (commuting) 205 (business) 138 (leisure) more than one answer could be given so percentages add up to more than 100
Summary
Participants were asked about the emotional financial and practical impacts the disruption had caused them
66
33 cited emotional impacts 48 practical impacts and 18 financial impacts On average 38 impacts were mentioned by each participant The main impacts were stress with respect to work (55) arriving home late (51) and missed meetings (32)
Compensation and Redress
Qualitative stage participants were asked about their attitudes to compensation for tickets Although they welcomed Delay Repay they felt that currently this was not efficient or effective enough They welcomed
TOCs do mention it or give out forms Gets you part of your money back Once itrsquos set up itrsquos relatively easy Additional compensation (outside of Delay Repay) for ongoing timetable changes
However they thought the service needs improving because
It puts the onus on the customer The process feels cumbersome and daunting Lack of consistency across TOCs Suspect the TOC will quibble and doubts that any money will actually be repaid Itrsquos based on individual journey delays vs whole trips eg missed connections
ldquoI got over pound400 back and that was good but my season ticket is pound4500k and it doesnrsquot really account for the wider impact on my liferdquo
St Albans Depth Interview
ldquoSo I missed my connection at Watford Junction to Northampton because of a significant delay from Euston but I only could claim the first bitrdquo
St Albans Business
There was an overwhelming preference for a compensation ethos that makes customers feel valued regardless of journey purpose The minimum expected compensation would be money back for the ticket cost
Qualitative stage participants would begin to value the compensation if they received something unexpected andor if the compensation would take into account spend during the delay It was also felt that automatic refunds should be possible where travellers had purchased an e-ticket or a mobile ticket and where the TOC already had the relevant bank details to refund the costs Participants were looking for automatic compensation that demonstrates that the customer is valued and which might include multiple minimal journey disruptions eg five delayed journeys in one month
67
ldquoI just have to think about Amazon and the way that they give you your money back without even asking for the productrdquo
St Albans Commuter
ldquoThey know you donrsquot really have an alternative so it feels like they feel that they donrsquot have to do thisrdquo
London Commuter
Quantitative survey participants were asked whether if the disruption to the rail service they experienced was long enough to warrant compensation which of the following means would they prefer to find out about it
Announcement at the station Announcement on the train Display at station Display on train Member of staff on the platform Member of staff at the station Member of staff on the train National rail app Trainline app An email or text alert Social Media (eg Facebook or Twitter) A claim form handed to you on the train
Announcements on the train (55) and at the station (46) were the two preferred means
On average 34 sources were mentioned by each participant
68
Figure 56 If the disruption to the rail service experienced was long enough to warrant compensation which of the following means would they prefer to find out about it
4
8
19
20
22
23
24
25
26
31
32
46
55
0 10 20 30 40 50 60 70 80 90 100
Other
Social Media (eg Facebook or Twitter)
Trainline app
Member of staff at the station
Member of staff on the train
Display on train
National rail app
A claim form handed to you on the train
Member of staff on the platform
An email or text alert
Display at station
Announcement at the station
Announcement on the train
participants
Base 1049
Summary
If the disruption to the rail service was long enough to warrant compensation the preferred means of hearing about it were announcements on the train (55) announcements at the station (46) display at the station (32) and an email or text alert (31)
Best in Class
Qualitative stage participants were also asked about lsquoBest in Classrsquo examples for customer service to help TOCs to understand what could be done to improve this Key to thinking of brands as lsquoBest in Classrsquo was consistency in their service recovery strategies Whilst some airline companies were mentioned here no rail company was mentioned amongst lsquoBest in Classrsquo examples The list of lsquoBest in Classrsquo companies included telecoms leisure technology and rail companies such as Amazon Apple British Airways EE John Lewis MampS Premier Inn and Sonos14 Their commonalities were that they were easy to speak to they took responsibility resolved issues speedily showed flexibility proactive communication had a human touch refundedcompensated immediately and offered surprise vouchers
The blueprint of good service for TOCs as seen by qualitative stage participants is demonstrated in Figure 57 below
14 Other companies mentioned here included BT Delta Airlines JD Wetherspoons Sky and TGI Fridays
69
Figure 57 Best in Class Blueprint
The overarching implications for TOCs then come in three levels measures that are expected to be implemented if these are not already in place followed by a level of measures that would increase customersrsquo opinion of the TOCs and a third level which would really improve how customers see TOCs in the time of delay
Measures that are expected to be implemented Human face ndash approachable professional flexible Be polite take responsibility and apologise Do not make use internal operational issues as justification eg staffing No excuses
Measures that would increase customersrsquo opinion of the TOCs Ability to check disruption status through real time platform Provide realistic timing updates Make us comfortable Prompt payment of compensation Provide monetary compensation where appropriate Make it easy to report delays Provide ongoing text messages with status updates
Best in Class Do something unexpected eg vouchers for a free train ride free drinks Provide live chat messaging feed Proactive communication Automatic compensation
70
Case study 10 LiveMinds exercise
71
Appendix A
Questionnaire
Introduction
Thank you very much for agreeing to complete this on-line survey which is being conducted by Accent on behalf of the Department for Transport The closing date for completion of this survey is 16 July 2019
Anyone completing the questionnaire will be eligible for a pound5 voucher
We will just ask you a couple of questions to check that you are eligible to take part in this research
Any answer you give will be treated in confidence in accordance with the Code of Conduct of the Market Research Society If you would like to confirm Accentrsquos credentials type Accent in the search box at httpswwwmrsorgukresearchbuyersguide
IF MOBILE DEVICE SHOW This survey is best undertaken on a tablet or a PC If you do use a smartphone you can switch between desktop mode and mobile mode at any time by clicking the button at the bottom of the screen
For the purposes of administering the questionnaire and for analysis we may collect demographic information You do not have to answer any questions that you do not wish to and if you do you can withdraw your consent for us to process this information at any time Any personal data collected over the course of this survey will be held securely and will not be shared with any third party unless you give permission (or unless we are legally required to do so) Our privacy statement is available at wwwaccent-mrcomprivacy
Do you agree to proceeding with the survey on this basis Yes No THANK AND CLOSE
PLEASE ENTER THE UNIQUE CODE THAT IS PRINTED ON THE POSTCARD
ALLOW FOR SIX FIGURE ALPHA NUMERIC CODE
Q1 This questionnaire is about disruptions to your rail service and the information provided to you when that happens For the purposes of this research rail disruptions include delays (including repeated shorter delays) cancelled trains overcrowding meaning you couldnrsquot board the train and unplanned station closures
In the last month have you experienced any of the following disruptions to your rail journeys TICK ALL THAT APPLY
continued short delays of up to 5 minutes to regular journeys
a disruption of 5-19 minutes a disruption of 20 minutes-60 minutes a disruption of over 60 minutes none of the above THANK AND CLOSE
Q2 IF Q1 HAS MORE THAN ONE RESPONSE ASK Which was the most recent
IF Q1_1=1 SHOW continued short delays of up to 5 minutes to regular journeys IF Q1_2=1 SHOW a disruption of 5-19 minutes IF Q1_3=1 SHOW a disruption of 20 minutes-60 minutes IF Q1_4=1 SHOW a disruption of over 60 minutes
Q3 When did you last experience Q2Q1 IF ONLY ONE RESPONSE AT Q1
Today Yesterday 2-6 days ago 1-2 weeks ago 3-4 weeks ago More than a month ago THANK AND CLOSE
Main Questionnaire Thank you you are in scope for the survey The questionnaire will take about 15 minutes to complete
Q4 Any data collected over the course of this interview that could be used to identify you such as your name address or other contact details will be held securely and will not be shared with any third party unless you give permission (or unless we are legally required to do so)Our privacy statement is available at wwwaccent-mrcomprivacy
Do you agree to proceeding with the interview on this basis
Yes No THANK AND CLOSE
For convenience you can stop and return to complete the questionnaire as many times as you wish although once submitted you will not be able to enter again
Q5 Please describe your most recent disrupted rail journey below
Q6 What was the boarding station LIST OF STATIONS
Q7 What was the destination station LIST OF STATIONS
Q8 What was the main purpose of the train journey Commuting (including commuting for education) Business (including personal business such as job interviews dentist appointment etc) Leisure (including shopping visiting friends or relatives etc) Other (please type in)
Q9 Which train company operated the train service (If you travelled with more than one train company then you should select the company you travelled on for longest)
Transport for Wales Caledonian Sleeper c2c Chiltern Railways CrossCountry East Midlands Trains Gatwick Express Grand Central
Great Northern Great Western Railway Greater Anglia Heathrow Express Hull Trains London Northeastern Railway (LNER) London Northwestern Railway London Overground Merseyrail Northern ScotRail Southeastern Southern South Western Railway Stansted Express TfL Rail (excluding underground) Thameslink TransPennine Express Virgin Trains West Coast West Midlands Railway Dont know Other (please type in)
Q10 When did you first find out about the disruption
Before I reached the station When I arrived at the boarding station When I was on the train At an interchange station Other (please type in)
Q11 Where were you delayed TICK ALL THAT APPLY
IF Q10=4 DONrsquoT SHOW At the boarding station On the train At an interchange station At another station along the routejourney Other (please type in)
Q12 How long was the delay
helliphellip minutes
Q13 And how long was the rail journey scheduled to take
helliphellip minutes
Q14 What was the nature of the disruption
Problem with the train (eg faulty train waiting for a platform no driver) Infrastructure (eg signalling problem broken rail overhead wire problems unplanned station closure) Engineering works (eg emergency engineering works planned engineering work over running) External factors (eg person on the line vandalism passenger taken ill obstruction on the line) Weatherseasonal factors (eg flooding leaves ice) Service issues (eg Train congestion last minute platform changes overcrowding due to latecancelled trains) No reason given Other (Please type in) Dont knowcant remember
Q15 Was the train cancelled
Yes No
Q16 IF Q11_1=1 (DELAY AT BOARDING STATION) ASK Where did you wait at the station during the delay
At the platform On the concourse In a waiting room In a cafeacute On the train At a shelter Other (please type in)
Q17 Was this a comfortable place to wait
Yes No
Q18 IF Q16_3ltgt1 AND IF Q16_4ltgt1 (DIDNrsquoT WAIT IN WAITING ROOM OR CAFEacute) ASK Was there a waiting room or cafeacute you could have waited in
Yes No
Q19 IF Q11_3=1 (DELAY AT INTERCHANGE STATION) ASK Where did you wait at the station during the delay
At the platform On the concourse In a waiting room In a cafeacute At a shelter Other (please type in)
Q20 Was it a comfortable place to wait
Yes No
Q21 IF Q19_3ltgt1 AND IF Q19_4ltgt1 (DIDNrsquoT WAIT IN WAITING ROOM OR CAFEacute) ASK Was there a waiting room or cafeacute you could have waited in
Yes No Donrsquot know
Q22 IF Q15=2 ASK Thinking about the most recent rail disruption you experienced how did you feel when you first found out there was a disruption TICK ALL THAT APPLY IF Q15=1 ASK Thinking about the most recent rail disruption you experienced how did you feel when you first found out there was a cancellation TICK ALL THAT APPLY
RANDOMISE ORDER Uncertain Frustrated Anxious Angry Scared Stressed
Resigned Calm In control Content Determined Tired Other (please type in)
Past and current experiences of messaging during disruption Q23 Again thinking about the most recent rail disruption you experienced how do you rate how the rail
company handled the disruption
Very well Well Neither Poorly Very poorly Dont knowNo opinion
Q24 Overall how would you rate the information provided about that disruption
Very good Good Neither Poor Very poor Dont knowNo opinion
Q25 How would you describe the information provided about that disruption TICK ALL THAT APPLY
RANDOMISE ORDER Useful Helpful Informative Adequate Clear Timely Inadequate Inaccurate Insufficient Too infrequent Unclear No information given GO TO Q27 Other (please type in)
Q26 How would you describe the tone of the information provided about that disruption TICK ALL THAT APPLY
RANDOMISE ORDER Apologetic Rude Indifferent Lacked care Lacked respect Cared about my needs Acknowledged the inconvenience Easy to understand Informative
No information received Other (please type in)
Q27 And thinking more generally about when there are disruptions to your rail service how do you rate the information you received about the disruption
Very good Good Neither Poor Very poor Dont knowNo opinion
Q28 IF Q27=1 OR 2 ASK What information was good IF Q27=4 OR 5 ASK What information was bad
Q29 In the last six months have you experienced any rail disruptions when things were handled particularly badly
Yes PLEASE DESCRIBE No
Q30 In the last six months have you experienced any rail disruptions where a train company excelled in the way they handled the disruption (including the information they gave you)
Yes PLEASE DESCRIBE No
Q31 Thinking about when you experience disruptions on other forms of transport such as air the Underground or coach do you have any examples where the disruption was handled particularly well (including the information you received during this time)
Yes PLEASESTATE THE FORM OF TRANSPORT ANDDESCRIBE IN WHAT WAY IT WAS GOOD No
Timeliness of delivery The next set of questions are about when and where the information about the rail disruption was delivered
Q32 And where did you first receive information about the disruption
PA announcements at station PA announcements on train Display at station Display on train Member of staff on the platform Member of staff at the station Member of staff on the train National Rail app Trainline app Rail company app (please specify) Other travel app (please specify) Facebook Twitter Family friend or fellow traveller Other (please type in)
Donrsquot know
Q33 From which if any of the following sources do you remember receiving information about the disruption during your disrupted journey TICK ALL THAT APPLY
PA announcements at station PA announcements on train Display at station Display on train Member of staff on the platform Member of staff at the station Member of staff on the train National Rail app Trainline app Rail company app (please specify) Other travel app (please specify) Facebook Twitter Family friend or fellow traveller Other (please type in) No information received GO TO Q35 Donrsquot know GO TO Q35
Q34 And how did you feel when you first received the information TICK ALL THAT APPLY
RANDOMISE ORDER Uncertain Frustrated Anxious Angry Scared Stressed Resigned Reassured Calm In control Informed Pleased Relieved Other (please type in)
Q35 When you travel by rail do you actively listen for any announcements at the boarding station
Yes always Only if I think there may be a delay or disruption No My station doesnrsquot have a PA system Other (please type in)
Q36 And do you actively listen for announcements on the train
Yes always Yes only when I can hear them Only if I think there may be a delay or disruption No Other (please type in)
Q37 If you are on a train that seems to be running slower than it should be or stops between stations how quickly do you want to receive information about the delay
Type in helliphellip minutes
Q38 When there is a disruption to your rail service how often would you like announcements to be made
Type in Every hellipminutes
Q39 If announcements were made more often than every [Q38 answer] would that annoy you
Very much A little No
Q40 Sometimes there are no announcements made because the train company doesnrsquot have enough information In such situations would you prefer
a) an announcement made with very little or no information b) an announcement made once there is some information
Q41
Tone and content This section is about the tone and content of messages or information delivered when there are disruptions to your rail service
Q42 Overall when information is provided about disruptions which of the following styles would you prefer PLEASE PICK THE TOP THREE
RANDOMISE ORDER Clear = easy to hear and to understand Correct = factual and up to date Concise = short and regular Confident = genuine and honest Conciliatory = apologetic and empathetic Consistent = across different channels andor providers Personal = tailored to your circumstances Other (please type in)
Q43 Would your preference change if the disruption was particularly severe Imagine that you were taking a rail journey for Q8 [purpose] which was expected to last 1 hour However due to disruption your journey was now going to take 1 hour 45 minutes and that you had to change trains in order to reach your destination In that situation which of the following styles would you prefer PLEASE PICK THE TOP THREE
RANDOMISE ORDER Clear = easy to hear and to understand Correct = factual and up to date Concise = short and regular Confident = genuine and honest Conciliatory = apologetic and empathetic Consistent = across different channels andor providers Personal = tailored to your circumstances
Other (please type in)
Q44 Still imagine that you are making that journey and you arrived at the station to find out about the disruption What do you think you would do
Stay at the station waiting for updates Cancel the trip and go home Make the journey using another train Make the journey using another mode of travel Make the journey using an alternative route Leave the station and return later Other (please type in) Donrsquot know
Q45 IF Q44=1 ASK What is the longest you would be prepared to wait for this type of journey
Enter minutes
Q46 If the disruption was particularly severe which of the following would you like staff to do PLEASE PICK THE TOP THREE
Take responsibility Give you a named person for follow up Escalate to management Find me an alternative mode of transport to complete my journey Find me an alternative route to complete my journey Provide information on compensation Other (please type in)
Q47 What level of detail about the cause of the disruption would you prefer
Very detailed for example this train is running 25 minutes late because of damage to the overhead electric wires between Birmingham New Street and Longbridge caused by a falling tree Quite detailed for example this train is running 25 minutes late because of damage to the overhead electric wires between Birmingham New Street and Longbridge Not detailed for example this train is running 25 minutes late Donrsquot know
Q48 Again if the disruption was particularly severe which of the following would be most important to you
Information about the cause of disruption (eg the cause and how long it will last) An apology for the disruption Information about options (eg connections or alternative routes)
Q49 And the second most important
IF NOT TICKED AT Q48 Information about the cause of disruption (eg the cause and how long it will last) IF NOT TICKED AT Q48 An apology for the disruption IF NOT TICKED AT Q48 Information about options (eg connections or alternative routes)
Q50 Would you like to receive information about the causes of some of the disruptions such as signalling problems leaves on the line etc Some examples are shown below
httpswwwnetworkrailcoukrunning-the-railwaylooking-after-the-railwaydelays-explainedleaves httpswwwnetworkrailcoukrunning-the-railwaylooking-after-the-railwaydelays-explainedsignals-points-failure httpswwwnetworkrailcoukrunning-the-railwaylooking-after-the-railwaydelays-explainedvandalism-and-trespass etc
Yes No
Q51 IF Q50=1 ASK Some events can cause regular disruption to the railways Which of the following would you most like to receive further information on during instances of disruption to your journey TICK ALL THAT APPLY
Buckled rails Cable theft Engineering works Fatalities Flooding Knock-on delays Landslips Leaves Signals and points failure Snow and ice Vandalism and trespass None of the above Other (please type in)
Q52 IF Q50=1 ASK How would you like to receive such information TICK ALL THAT APPLY
Posters at stations Leaflets at stations In emails Notifications through messaging apps such as Facebook Messenger and WhatsApp Member of staff on the platform Member of staff at the station Member of staff on the train On National Rail Enquiries website On travel apps Announcements on trains (eg Did you knowhellip) On social media Text message Other (please type in)
Q53 How important is it to you that the train company apologises for the disruption
Very important Quite Important Not so important Not at all important Donrsquot know
Q54 Please say whether you agree or disagree with the following statements about rail disruptions
a) Sometimes the train company is deliberately evasive about the reasons for disruptions
b) There should be an apology given for any disruption however short it is
Strongly agree Agree Neither Disagree Strongly disagree
Q55 How important is to you that the train company is honest even if that means saying they do not know what is happening
Very important Quite Important Not so important Not at all important
Delivery mechanisms This section is about how information is provided when there are disruptions to your rail service
Q56 Which if any of the following apps or websites do you tend to use when your journey is disrupted TICK ALL APPLICABLE
None GO TO Q58 Rail company website Rail company app (please specify) Other travel app (please specify) National Rail Enquiries website Facebook Twitter Trainline or other booking site Friend family or fellow traveller Other (please type in) Dont knowcant remember GO TO Q59
Q57 IF MORE THAN ONE MENTIONED AT Q567 ASK Which of these do you use the most TICK ONE ONLY
IF Q56_2 = 1 Rail company website IF Q56_3 = 1 Rail company app IF Q56_4 = 1 Other travel app IF Q56_5 = 1 National Rail Enquiries website IF Q56_6 = 1 Facebook IF Q56_7 = 1 Twitter IF Q56_8 = 1 Trainline or other booking site IF Q56_9 = 1 Friend family or fellow traveller IF Q56_10 = 1 Other Dont knowcant remember
Q58 Which if any of the following do you trust most for information about disruptions TICK ALL APPLICABLE
PA announcements at station PA announcements on train Display at station Display on train Member of staff on the platform Member of staff at the station Member of staff on the train National Rail app Trainline app Rail company app (please specify) Other travel app (please specify) Email or text alert Facebook Twitter Travel news updates on radio or television Friends or family
Other (please type in) None of the above GO TO Q61
Q59
Q60 Why do you trust lsquoQ58rsquo most for getting information about disruptions
Q61 When there are disruptions how much do you value PA announcements at the station
They are essential They are important They are not so important They are not at all important
Q62 And how much do you value PA announcements on the train
They are essential They are important They are not so important They are not at all important
Q63 How often should PA announcements about disruptions to the rail service at the station be repeated
Type in helliphellip minutes
Q64 And how often should PA announcements about disruptions to the rail service on the train be repeated
Type in helliphellip minutes
Q65 Thinking about your most recent disrupted rail journey how easy to understand were the announcements about the disruption at the station
Very clear Not very clear (canrsquot make out all that is said) Very unclear (canrsquot make out much or anything that is said) Donrsquot knowNot applicable
Q66 And how clear were the announcements about disruption on the train
Very clear Not very clear (canrsquot make out all that is said) Very unclear (canrsquot make out much or anything that is said) Donrsquot knowNot applicable
Q67 How important is it to you that you are able to see rail staff when there are disruptions to the rail service
Essential Quite important Not so important Not at all important
Behavioural and sentimental responses to information Q68 Thinking about the recent disruption to your rail service did you experience any of the following
Emotional impacts Anxiety of not knowing where to gowho to ask Stress on homelife (eg childcare) Stress with respect to work (eg because late or missing meetings appointments etc) Fear (eg being alone at stations at night) Stressworry for the person collecting me from the station Other emotional impact (please type in)
Financial impacts Loss of earnings Had to buy a new rail ticket Inability to work on train Nursery fees Taxi fares Cost of car parking Cost of drinks andor food Other financial impact (please type in)
Practical impacts Missed connecting trains Lost seat reservation Lost my passenger assist Missed follow-on transport (eg air ferry bus) Missed meeting Missed social event Missed appointment Arrived home latelater than anticipated No-one to pick children up Other practical impact (please type in)
None of the above
Compensation and redress Q69 If the disruption to the rail service you experienced was long enough to warrant compensation
which of the following means would you prefer to find out about it TICK ALL THAT APPLY
Announcement at the station Announcement on the train Display at station Display on train Member of staff on the platform Member of staff at the station Member of staff on the train National rail app Trainline app An email or text alert Social Media (eg Facebook or Twitter) A claim form handed to you on the train Other (please type in)
Q70
Classification Questions Finally would you please answer some questions about yourself You do not have to answer any of these questions that you do not wish to and if you do you can withdraw your consent for us to process this information at any time The personal information you provide during this survey will be held securely and will not be shared with any third party unless you give permission (or unless we are legally required to do so) Our privacy statement is available at wwwaccent-mrcomprivacy
It will be used by Accent only for this study which is being undertaken for the Department for Transport
Q71 Which of the following age groups are you in
16-25 26-35 36-45 46-55 56-59 60-64 65 or more Prefer not to answer
Q72 What is your gender
Male Female In another way (please type in) Prefer not to answer
Q73 Are you affected by any physical or mental health conditions or illnesses lasting or expected to last 12 months or more
No none Yes Vision (eg blindness or partial sight) Yes Hearing (eg deafness or partial hearing) Yes Mobility (eg only able to walk short distances or difficulty climbing stairs) Yes Dexterity (eg difficulty lifting and carrying objects or using a keyboard) Yes Learning or understanding or concentrating Yes Memory Yes Mental health Yes Stamina or breathing or fatigue Yes Socially or behaviourally (eg associated with autism attention deficit disorder or Aspergerrsquos syndrome) Other (please type in) Prefer not to say
Q74 IF Q73=YES ASK Do you have any have specific requirements that would make the experience of experiencing disruptions less stressful or easier to manage
No comment
Q75 Do you have any other comments you would like to make about rail disruptions
No comment
-Prepared by Accent Chiswick Gate 598 608 Chiswick High Road London W4 5RT
Registered in London No 2231083 Accent Marketing amp Research Limited Registered Address 30 City Road London EC1Y 2AB
- Title Page
- Contents
- Executive Summary
- 1 Introduction
- 2 Methodology
- 3 Experiences of Past Delays and Handling of Disruption
- 4 Information During Disruption
- 5 The Impact of Disruption
- Appendix A Questionnaire
-