railway sleeper modelling with deterministic and …510879/...railway sleeper modelling with...
TRANSCRIPT

Railway Sleeper Modelling with
Deterministic and Non-deterministic
Support Conditions
Master Degree Project
Shan Li
Division of Highway and Railway Engineering
Department of Transport Science
School of Architecture and the Built Environment
Royal Institute of Technology
SE-100 44 Stockholm
TSC-MT 12-001
Stockholm 2012


i
Preface
This master thesis was carried out during the autumn 2011 to the winter 2012 at the Division
of Highway and Railway Engineering, the Royal Institute of Technology (KTH) in Stockholm,
Sweden. First I would like to thank my supervisor Assistant Prof. Elias Kassa. He was always
there to support and guide me, and also provided me useful literature related to this topic
which helped me a lot. Without my supervisor Elias I wouldn’t finish my thesis. Second I want
to thank my family for loving and encouraging me, and especially many thanks to my darling
Fang, for his patience and smiling face when I got stuck with my research.
Stockholm, March 2012
Shan Li

ii

iii
Railway Sleeper Modelling with Deterministic and
Non-deterministic Support Conditions
Shan Li
Graduate student
Infrastructure Engineering
Division of Highway and Railway Engineering
KTH Royal Institute of Technology
Abstract: Railway sleepers have important roles in the complex railway system. Due to
different loading condition, poor maintenance of sleeper or bad quality of ballast, a random
load distribution along the sleeper-ballast interface may occur. A sleeper design, and also the
track system design, which do not consider the random load distribution, could influence the
performance of the sleeper and even damage the whole railway system. Thus, a numerical
static and dynamic analysis for a pre-stressed concrete mono-block railway sleeper is carried
out using finite element method. The structural behaviour of a single sleeper subjected to a
random sleeper-ballast interaction is studied in three steps. First, four typical scenarios of
support condition for sleeper are discussed in numerical analysis. Second, large enough
numerical results under different random support conditions are conducted. Finally, Neural
Network methodology is used to study the performance of sleeper under a stochastic support
condition. Results of vertical displacement of rail seat, tensile stress at midpoint and
underneath rail seat are presented. Moreover, the worst support condition is also identified.
Keywords: railway sleeper, sleeper-ballast interaction, random support condition, finite
element modelling, Neural Network

iv
Abstrakt
Järnvägssliper spelar viktig roll i den komplexa järnvägssystem. På grund av olika trafik
villkor, otillräcklig kontroll, dåligt underhåll av sliper eller dålig kvalitet på ballast, en
slumpmässig sliper-ballast kontakt förhållande sker som påverkar prestanda av sliper. Därför
genomförs en numerisk statisk och dynamisk analys för en förspänd betong monoblock sliper
med finita element (FE) metoden. Den strukturella sliperstillstånd under en slumpvis
sliper-ballast samverkan studeras i tre steg. Först, fyra typiska sliper stöd scenarier diskuteras i
numerisk analys. För det andra genomfördes tillräckligt många numeriska resultat under olika
slumpvis interaktion. Slutligen Neural Network metod använts för att studera prestanda av
sliprar i en stokastisk ballast stöd villkor. Resultat av vertikala förskjutning av rälsfot,
dragspänning vid mittpunkten och under rälsfot presenteras. Dessutom är det sämsta stödet
villkor även identifierats.
Nyckelord: järnvägssliper, sliper-ballast interaktion, stokastiska sliper stöd villkor, finita
element modellering, Neural Network

v
Nomenclature
Α Thermal expansion
a1-a3 Corresponding distribution coefficient
аk Learning rate
B Width of cross section of sleeper
DF Distribution factor
Εc Young’s modulus of concrete
Εs Young’s modulus of steel
F Dynamic loading
G Distance between rail centres
GF Fracture energy
gk Current gradient
H Height of cross section of sleeper
I Second moment of inertia
K Total ballast stiffness under a half sleeper
K1-K3 Ballast stiffness for each part
L Sleeper length
M Bending moment
Mc Bending moment in centre
Mr Bending moment at rail seat
Ps Static wheel load
qr Rail seat load
W Uniformly distributed load
Xk Current weights and biases vector
Z Distance between neutral axis and calculated point
νc Poisson’s ratio of concrete
νs Poisson’s ratio of steel
ρc Density of concrete
ρs Density of steel
Σ Compressive or tensile stress
σcc Compressive strength of concrete
σct Tensile strength of concrete
σm Tensile stress at midpoint
σr Tensile stress under rail seat
Φ Impact factor

vi

vii
Contents
Preface ......................................................................................................................................... i
Abstract ..................................................................................................................................... iv
Nomenclature ............................................................................................................................. v
1. Introduction ....................................................................................................................... 1
1.1 Background ................................................................................................................................................ 1
1.2 Project objectives ....................................................................................................................................... 1
1.3 Development of sleeper ............................................................................................................................. 2
1.4 Types of sleeper ......................................................................................................................................... 2
1.4.1 Wooden sleeper ................................................................................................................................ 2
1.4.2 Steel sleeper ...................................................................................................................................... 3
1.4.3 Concrete sleeper ............................................................................................................................... 3
2. Literature Review .............................................................................................................. 7
2.1 Static modelling ......................................................................................................................................... 7
2.2 Dynamic modelling .................................................................................................................................... 8
2.3 Deterministic and non-deterministic modelling ......................................................................................... 8
3. Design of prestressed concrete sleeper ............................................................................ 9
3.1 Material properties ................................................................................................................................... 10
3.1.1 Concrete material ........................................................................................................................... 10
3.1.2 Pre-stressing reinforcement material .............................................................................................. 10
3.2 Stages of pre-tensioning ........................................................................................................................... 11
3.3 Flexural capacity of sleeper ..................................................................................................................... 12
4. Sleeper modelling and validation ................................................................................... 15
4.1 Static modelling of sleeper with fixed support ......................................................................................... 15
4.1.1 Modelling of sleeper ....................................................................................................................... 15
4.1.2 Numerical results ............................................................................................................................ 16
4.1.3 Discussion ...................................................................................................................................... 18
4.2 Dynamic modelling of sleeper with uniform support .............................................................................. 18
4.2.1 Modelling of sleeper ....................................................................................................................... 19
4.2.2 Numerical results ............................................................................................................................ 20
4.2.3 Discussion ...................................................................................................................................... 24
5. Sleeper modelling with deterministic support conditions ........................................... 25
5.1 Static analysis........................................................................................................................................... 26
5.2 Dynamic analysis ..................................................................................................................................... 28
5.3 Discussion ................................................................................................................................................ 30
6. Sleeper modelling with stochastic support condition ................................................... 31
6.1 Methodology ............................................................................................................................................ 31
6.2 The finite element model ......................................................................................................................... 33

viii
6.3 Neural network prediction ....................................................................................................................... 34
6.4 Statistical analysis .................................................................................................................................... 36
7. Conclusion and further research ................................................................................... 41
8. References ........................................................................................................................ 43
9. Appendix .......................................................................................................................... 45

1
1. Introduction
1.1 Background
Nowadays, railway transport plays a very important role in the transport system in a period of
positive growth of commerce, economy and industry. Compared to other forms of transport,
railway is the most reliable mode for transporting bulky goods and passengers over long
distance all over the world. In addition, in the aspects of energy consumption, safety, carrying
capacity, social and economic benefits, railway transport is the primary choice and is
increasing considerably in many countries.
Several researches of different modes of rail failures show that railway sleeper take significant
part as other components like rail, ballast, etc. Inspection and maintenance of sleeper is
therefore required to insure that the sleeper keeps in good condition to:
1. maintain track gauge and rail inclination
2. distribute and transmit forces to the ballast bed or slab track
3. provide adequate strength both in the vertical and horizontal direction
4. insulate electrically one rail from the other
5. dampen rail vibration and reduce the influence of sound and impact waves on the
environment
In Sweden a large amount of sleepers have been in service for many years and the inspection
of sleepers is done just visually, also railway engineers do the judgment of the condition of the
sleepers largely based on human intuition, see Siril (2007). Only basic visual inspection is not
sufficient, therefore a reliable and accurate experimental and numerical analysis for sleeper
should be carried out under static and dynamic conditions both at the design and operation
stage, in order to prevent damage, increase the lifetime, improve the track performance, etc.
1.2 Project objectives
Because of a poor quality of ballast, a situation happens frequently where sleeper is isolated
from ballast or penetrated into a ballast bed. For instance, surface infiltration, and sleeper wear
due to repetitive traffic loading may cause ballast fouling and softer deformable ballast
structure. Thus various interactions between sleeper and ballast provide different types of
support conditions, which increase the possibility of fatigue and crack failure of sleeper.
This thesis focuses on modelling a specific prestressed concrete monoblock railway sleeper
using finite element tool. This study also focuses in assessing the behaviour of the sleeper in

2
different kinds of sleeper-ballast interaction, both in deterministic and non-deterministic
support condition of sleeper. The thesis also investigates the influence of different kinds of
ballast support on sleeper, by judging some remarkable factors such as high tensile stress,
large bending moment, and unacceptable vertical displacement.
1.3 Development of sleeper
Railway sleeper has been developed for over hundred years, and according to the nature of its
purpose, sleeper need to be durable enough to resist the heavy traffic loads. Traditionally,
railway sleeper were always made from wood, and it had continued for 50 years. With the
intense steel production, steel sleeper was used for about 50 years. But nowadays, concrete
sleeper is widely chosen with a demand for increased axle loads. The first concrete sleeper
was introduced at the end of 19th
century, and the first concrete sleeper experiment was made
in Germany in 1906 between the line Nuremberg and Bamberg. In the period of World War II
the production of concrete sleeper was largely increased, and in 1939 the steel sleeper was
stopped producing. The comparison between different materials of sleepers will be
summarized in the following section.
1.4 Types of sleeper
According to material aspects, sleeper can be sorted as wooden, steel and reinforced concrete
sleeper. Following is comparison of different kinds of sleepers, mainly focusing on advantage
and disadvantage, see Bernhard (2005).
1.4.1 Wooden sleeper
Wooden sleeper is only suitable for low speed lines with the speed limit of 160 km/h.
Acceptable species of wood for this type of sleeper are European oak, beech, pine and etc.
Nowadays in some countries, wooden sleeper is being replaced by concrete sleeper. The
advantages of wooden sleeper are:
Easy to handle
Good resilience
Good electrical insulation
Easily adapted to non-standard situations
The disadvantages are:
Expensive
Non reusable due to preservative chemicals

3
To investigate the capacity of used wooden sleeper, a compliance test can be conducted, which
consists of three experimental procedures, namely Rail Seat Vertical Load Test under Negative
Moment (TRSN), Positive Moment (TRSP) and Centre Positive Bending Moment Test (CPM),
see Siti (2008). For each test two samples are used. Test results can be seen in figure 1.
Wooden sleeper is more slender than concrete sleeper and the vertical central displacement for
wooden sleeper is larger than concrete sleeper. This could be one of the reasons why wooden
sleeper has been replaced by concrete sleeper.
Figure 1 Load-deflection of CPM, TRSP and TRSN test, Siti (2008)
1.4.2 Steel sleeper
Classic steel sleeper is out of production today. Therefore, in this thesis, it will not be
presented in detail, only the pros and cons of steel sleepers are discussed below.
The advantage of steel sleeper is:
Easy to manufacture and install
But the main disadvantages are:
Low transverse resistance
Difficult to maintenance
Sensitive to chemical attacks
1.4.3 Concrete sleeper
Concrete sleeper do not rot like wooden sleeper, and it has longer life, much stabilizes and
needs less maintenance than other types of sleeper. For these reasons, nowadays concrete
sleeper is widely used all over the world. The advantages of concrete sleeper compared to
wooden sleeper are:

4
Longer life cycle time
Cheaper
Lower maintenance cost of fastening
Smaller lateral displacement on account of large weight
But concrete sleeper still has some disadvantages:
Vulnerable to impact
difficult to handle because of large weight
difficult to maintain longitudinal level due to higher inertia moment and lower elasticity
In general, concrete sleeper can be divided into reinforced twin block concrete sleeper and
prestressed monoblock concrete sleeper. They are presented in detail in the following section.
1.4.3.1 Twin block sleeper
Reinforced twin block sleeper is a type of sleeper where two concrete blocks are connected to
each other through a steel rod or rigid steel beam, see figure 2. It was first developed in France.
Increased lateral resistance and lower weight are the main advantages of this sleeper type. It
can be used under various loading conditions and its service life is about 50 years. Recently it
is being used in France, Belgium, Denmark, Netherlands, Greece, etc.
Figure 2 Twin block sleeper, Bernhard (2005)
The advantages of this type are:
Better lateral displacement resistance
More elastic behaviour
Easy to handle due to low weight

5
The disadvantages are:
Require elastic fastening
Declination of sleeper to the track centre
Require special insulating accessories
Defect because of corrosion and fatigue of steel
Load distribution and flexibility less satisfactory
1.4.3.2 Monoblock sleeper
Prestressed monoblock sleeper which consists of one prestressing reinforced concrete beam
was developed in UK, see figure 3. It can be used for high speed railway and heavy loading.
And the service life would be also about 50 years. Nowadays it is used in USA, Canada,
Sweden, Australia, England, Germany, China and etc.
Figure 3 Different types of monoblock sleeper, see Bernhard (2005)
The advantages are:
Maintain track gauge in a good manner
Longer life time
Load distribution better than twin block
Good surface for maintenance inspection staff

6
The disadvantages are:
Require elastic fastening
Require special insulating accessories
No reinforcement against shear and torsional forces

7
2. Literature Review
In order to understand the leading edge of concrete sleeper design and analysis, literatures has
been studied related to this topic. In this section, some important and useful articles are
summarized. This literature survey is mainly focusing on static and dynamic modelling of
prestressed concrete sleeper, as well as the deterministic and non-deterministic modelling.
2.1 Static modelling
In Rikard (2000), a sleeper subjected to constant impact loads is modelled and analysed. By
using one of the finite element tools Abaqus, a three dimensional sleeper is established and
simulation in static situation is conducted. After that, results from modelling are used to
compare with experimental results from a static full-scale test, to validate the finite element
model. The static test is carried out using a hydraulic jack, which means displacement at rail
seat will increase at a constant rate. The support condition in this case is fixed where sleeper is
tied on the ground on four locations, see figure 4. Sleeper type A9P is chosen, figure 5.
Figure 4: The static full-scale test, Rikard (2000)
In Rikard’s thesis, the numerical results of the crack propagation, and strain and stress relation
of sleeper in various zones are captured and evaluated, see Rikard (2000). The most weakness
of static modelling is that only static analysis is not far enough, and dynamic modelling should
also be presented where stress waves and time-dependent parameters will be included.
8
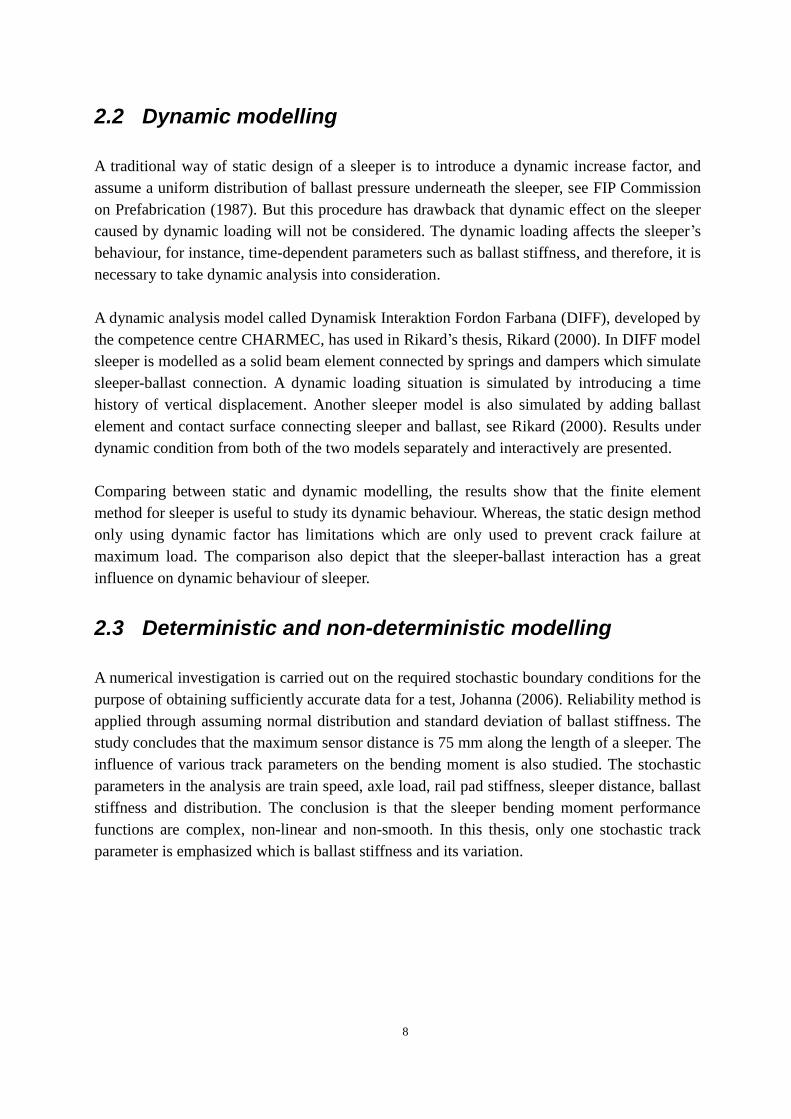
2.2 Dynamic modelling
A traditional way of static design of a sleeper is to introduce a dynamic increase factor, and
assume a uniform distribution of ballast pressure underneath the sleeper, see FIP Commission
on Prefabrication (1987). But this procedure has drawback that dynamic effect on the sleeper
caused by dynamic loading will not be considered. The dynamic loading affects the sleeper’s
behaviour, for instance, time-dependent parameters such as ballast stiffness, and therefore, it is
necessary to take dynamic analysis into consideration.
A dynamic analysis model called Dynamisk Interaktion Fordon Farbana (DIFF), developed by
the competence centre CHARMEC, has used in Rikard’s thesis, Rikard (2000). In DIFF model
sleeper is modelled as a solid beam element connected by springs and dampers which simulate
sleeper-ballast connection. A dynamic loading situation is simulated by introducing a time
history of vertical displacement. Another sleeper model is also simulated by adding ballast
element and contact surface connecting sleeper and ballast, see Rikard (2000). Results under
dynamic condition from both of the two models separately and interactively are presented.
Comparing between static and dynamic modelling, the results show that the finite element
method for sleeper is useful to study its dynamic behaviour. Whereas, the static design method
only using dynamic factor has limitations which are only used to prevent crack failure at
maximum load. The comparison also depict that the sleeper-ballast interaction has a great
influence on dynamic behaviour of sleeper.
2.3 Deterministic and non-deterministic modelling
A numerical investigation is carried out on the required stochastic boundary conditions for the
purpose of obtaining sufficiently accurate data for a test, Johanna (2006). Reliability method is
applied through assuming normal distribution and standard deviation of ballast stiffness. The
study concludes that the maximum sensor distance is 75 mm along the length of a sleeper. The
influence of various track parameters on the bending moment is also studied. The stochastic
parameters in the analysis are train speed, axle load, rail pad stiffness, sleeper distance, ballast
stiffness and distribution. The conclusion is that the sleeper bending moment performance
functions are complex, non-linear and non-smooth. In this thesis, only one stochastic track
parameter is emphasized which is ballast stiffness and its variation.
9
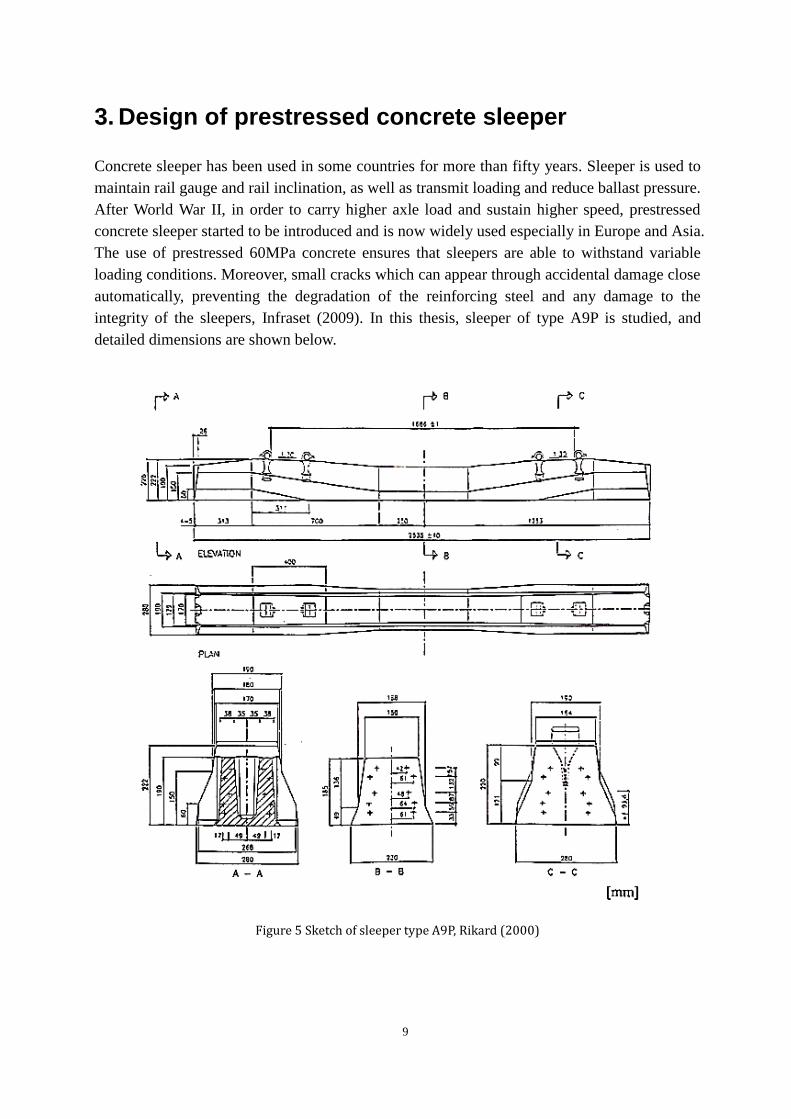
3. Design of prestressed concrete sleeper
Concrete sleeper has been used in some countries for more than fifty years. Sleeper is used to
maintain rail gauge and rail inclination, as well as transmit loading and reduce ballast pressure.
After World War II, in order to carry higher axle load and sustain higher speed, prestressed
concrete sleeper started to be introduced and is now widely used especially in Europe and Asia.
The use of prestressed 60MPa concrete ensures that sleepers are able to withstand variable
loading conditions. Moreover, small cracks which can appear through accidental damage close
automatically, preventing the degradation of the reinforcing steel and any damage to the
integrity of the sleepers, Infraset (2009). In this thesis, sleeper of type A9P is studied, and
detailed dimensions are shown below.
Figure 5 Sketch of sleeper type A9P, Rikard (2000)

10
3.1 Material properties
In order to capture the crushing and cracking of sleeper, the most critical parameters should be
analysed such as the maximum tensile stress and strain which can be used to determine crack
propagation of sleeper especially in static situation. Because stress and strain relation is
relevant to material properties, the properties of concrete and steel used as input value in finite
element analysis are given in this section.
3.1.1 Concrete material
The railway sleeper is made of concrete material. The typical properties of normal strength
concrete C55/67 used as input data:
Density: ρc = 2400 kg / m3
Young’s modulus: Εc = 30200 MPa
Poisson’s ratio: νc = 0.2
Compressive strength: σcc = 52 MPa
Tensile strength: σct = 2.85 MPa
Fracture energy: GF = 154 N / m
The non-linear elastoplastic behaviour of concrete is assumed when modelling in order to
capture crushing and cracking of sleeper. Thus, plastic behaviour is presented below:
Table 1 Plastic stress-strain relation for concrete
Yield stress (MPa) Plastic strain
30 0
50 0.001
48 0.003
3.1.2 Pre-stressing reinforcement material
Prestressed reinforcement in sleeper which can increase tensile capacity of the sleeper is also
of importance. Typical properties of reinforcement are indicated below:
Density: ρs = 7.8 g / cm3
Young’s modulus: Εs = 200 GPa
Poisson’s ratio: νs = 0.3
Thermal expansion: α = 1.1 * 10-5
/ oC

11
Plastic stress-strain relation for steel material is shown below:
Table 2 Plastic stress-strain relation for steel
Yield stress (MPa) Plastic strain
0.01 0
1703 0.0085
1750 0.0097
1797 0.01
1978 0.064
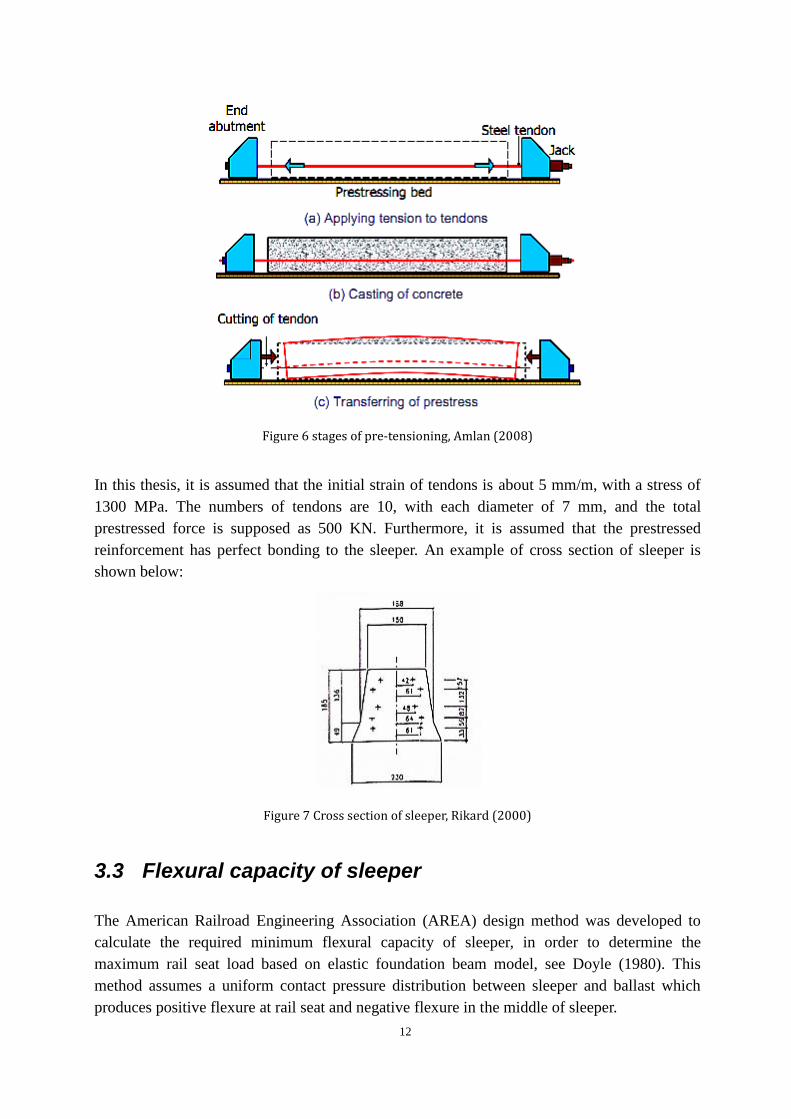
3.2 Stages of pre-tensioning
Pre-stressing technology has been developed for many years, and it is divided into pre-tension
and post-tension. For concrete railway sleeper, pre-tensioning is widely used where tension is
applied to tendons before casting of concrete. The stages of pre-tensioning are mainly
described below.
The pre-tensioning is carried out in a prestressing bed equipped with end anchorages which
take up tension. The high strength reinforcement tendons are pulled between two end
anchorages which are fixed upon the prestressing bed before concrete sleeper is cast in the
form. Once the concrete has attained a sufficient prestressing strength, the tendons are cut
from the end anchorages, and the tensile force is transferred to the concrete through the
tendons, because of the bonding between the concrete and the embedded reinforcement. See
Johan (2008) and Amlan (2008).
The stages of the pre-tensioning procedure are summarized in the following, see Amlan
(2008):
1) Anchoring of tendons against the end abutments
2) Placing jacks
3) Applying tension to the tendons
4) Casting of concrete
5) Cutting of the tendons
12
Figure 6 stages of pre-tensioning, Amlan (2008)
In this thesis, it is assumed that the initial strain of tendons is about 5 mm/m, with a stress of
1300 MPa. The numbers of tendons are 10, with each diameter of 7 mm, and the total
prestressed force is supposed as 500 KN. Furthermore, it is assumed that the prestressed
reinforcement has perfect bonding to the sleeper. An example of cross section of sleeper is
shown below:
Figure 7 Cross section of sleeper, Rikard (2000)
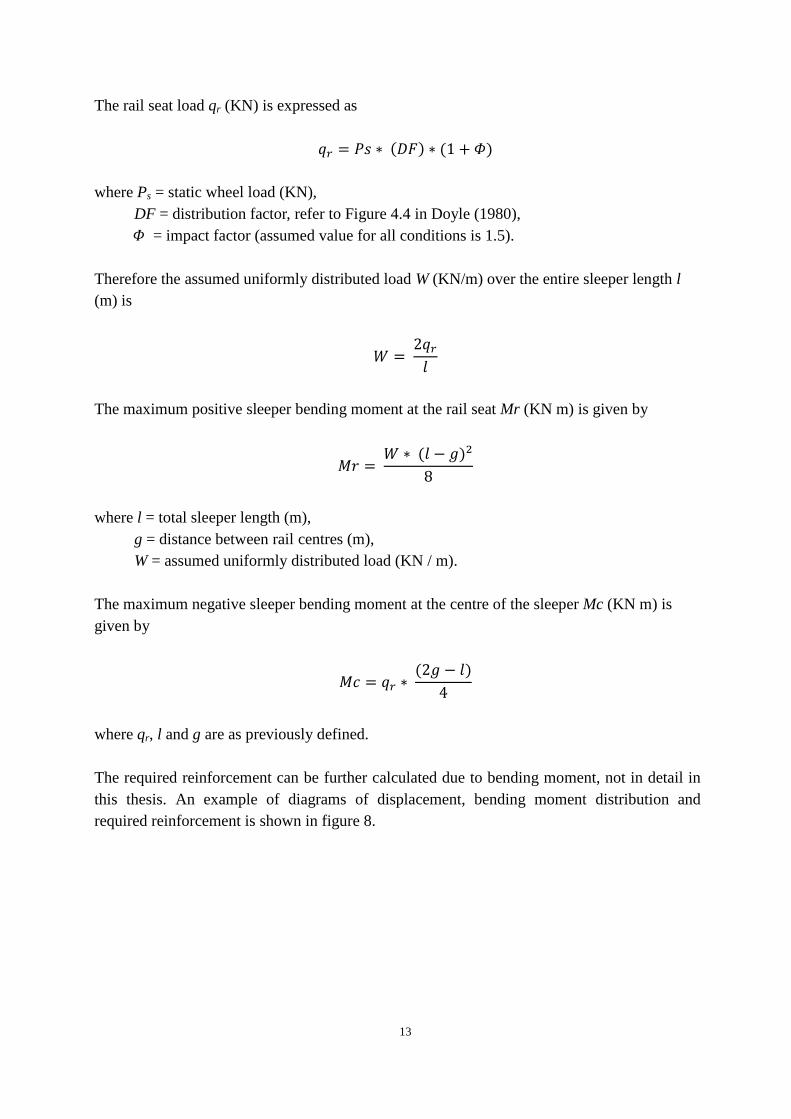
3.3 Flexural capacity of sleeper
The American Railroad Engineering Association (AREA) design method was developed to
calculate the required minimum flexural capacity of sleeper, in order to determine the
maximum rail seat load based on elastic foundation beam model, see Doyle (1980). This
method assumes a uniform contact pressure distribution between sleeper and ballast which
produces positive flexure at rail seat and negative flexure in the middle of sleeper.
13
The rail seat load qr (KN) is expressed as
where Ps = static wheel load (KN),
DF = distribution factor, refer to Figure 4.4 in Doyle (1980),
= impact factor (assumed value for all conditions is 1.5).
Therefore the assumed uniformly distributed load W (KN/m) over the entire sleeper length l
(m) is
The maximum positive sleeper bending moment at the rail seat Mr (KN m) is given by
where l = total sleeper length (m),
g = distance between rail centres (m),
W = assumed uniformly distributed load (KN / m).
The maximum negative sleeper bending moment at the centre of the sleeper Mc (KN m) is
given by
where qr, l and g are as previously defined.
The required reinforcement can be further calculated due to bending moment, not in detail in
this thesis. An example of diagrams of displacement, bending moment distribution and
required reinforcement is shown in figure 8.

14
Figure 8 Example of displacement, bending moment and required reinforcement for sleeper

15
4. Sleeper modelling and validation
In this section, a finite element model (FEM) for sleeper is discussed. The model is established
using Finite Element package – Abaqus, which is a numerical tool used to model and simulate
the mechanics behaviour and response of sleeper. In this study, the sleeper is modelled as a
three dimensional solid element, SOLID 65, while prestressed tendon is modelled as an
embedded truss element, LINK 8, which is subjected to initial prestressed force. Bond slip
between concrete and reinforcement is ignored. Cross section of the sleeper is simplified as
rectangle. The non-linear material inputs have been given in the previous chapter.
4.1 Static modelling of sleeper with fixed support
At first, a simple static sleeper model with fixed support condition is modelled, analysed and
compared with Rikard (2000), see figure 4. This part of the work is used to make assessment
the quality of FE model and validate the model with respect to existing ones.
4.1.1 Modelling of sleeper
As the validation step, a sleeper is subjected to the same hydraulic jack loading as Rikard
(2000), see section 2.1. This loading makes the sleeper deflect at a constant velocity of 0.05
mm/min. Hydraulic jack is applied to a rigid steel plate which locates just above the surface of
rail seat, which closes to the real situation in the static full-scale test, see figure 4. And the
loading duration is about 1.5 hours. In addition, a uniformly distributed gravity is applied to
the body of sleeper as well. The support condition is fixed both in vertical direction at four
points of the bottom of the sleeper like those in the test, see figure 9. Furthermore, a friction in
lateral direction applied along the bottom of the sleeper is modelled as the boundary condition
in the model.
Figure 9 Static sleeper model with fixed support
16
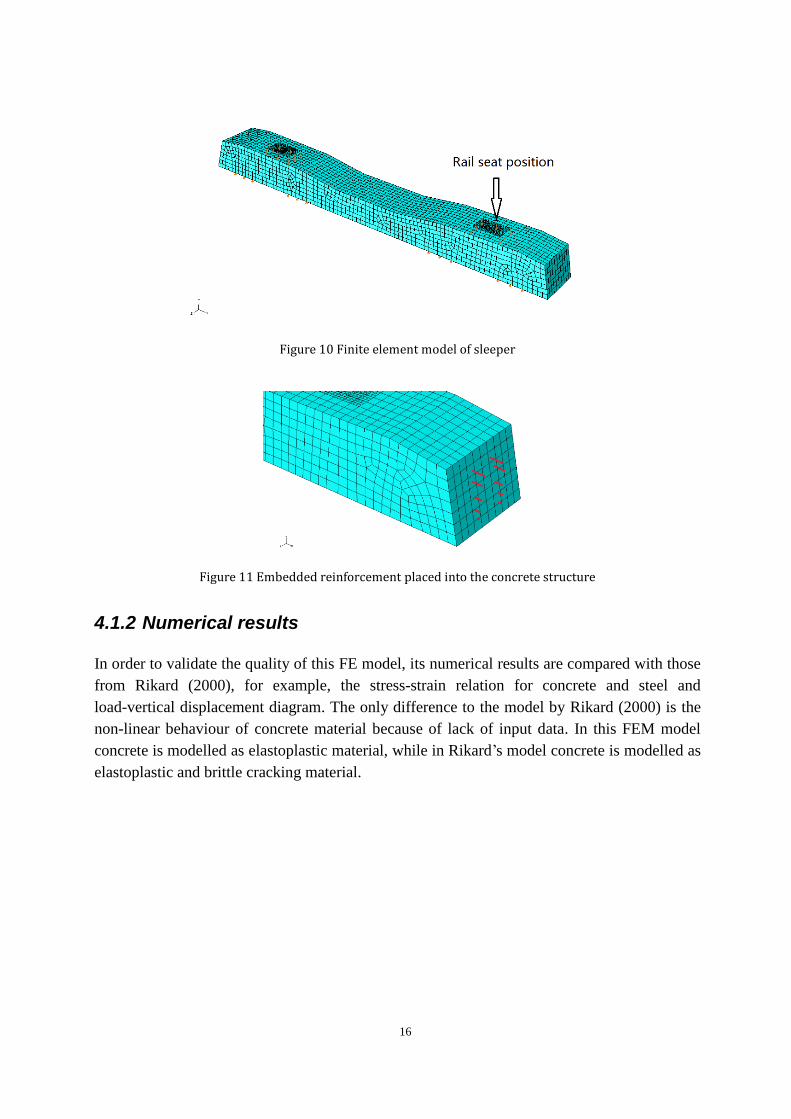
Figure 10 Finite element model of sleeper
Figure 11 Embedded reinforcement placed into the concrete structure
4.1.2 Numerical results
In order to validate the quality of this FE model, its numerical results are compared with those
from Rikard (2000), for example, the stress-strain relation for concrete and steel and
load-vertical displacement diagram. The only difference to the model by Rikard (2000) is the
non-linear behaviour of concrete material because of lack of input data. In this FEM model
concrete is modelled as elastoplastic material, while in Rikard’s model concrete is modelled as
elastoplastic and brittle cracking material.

17
Figure 12 Stress-strain relation of reinforcement (solid line represents the FE result and dotted line
represents the input data of steel)
Figure 13 Stress-strain of concrete (solid line represents FE result and dotted line represents result from
Rikard (2000))
From figures 12 and 13, it is seen that the stress-strain relations between concrete and steel
material from FE model are quite similar to the input data and the results by Rikard (2000).
This is used as an assurance that the quality of this sleeper model looks good. In fact, after
concrete reaches its ultimate compressive strength, the stress will start to decrease due to
cracks occur, which can be defined as brittle cracking behaviour. Modelling of brittle cracking
material is used to capture brittle cracks in sleeper, but because there are not sufficient input
values for this kind of concrete non-linear behaviour, therefore in the following analysis, the
duration time for applying hydraulic jack load is shorten from 1.5 hour to 1 hour to ensure that
the compressive strength of concrete material will not decrease.

18
Figure 14 Force-displacement of underneath the rail seat (dotted line represents FEM result and solid line
represents result from Rikard (2000))
It is clear from figure 14 that the force and vertical displacement diagram matches well to
Rikard (2000), which proves again that the quality of FE model is good.
4.1.3 Discussion
The aim of this section is to assess the quality of FE model, and numerical results regarding
structural behaviour of sleeper will not be analysed in detail, because fixed support condition
occurs rarely. Once the model is validated with respect to test results, further analysis using
this FE-model can be processed on the next step. Since only static analysis is not enough and
the most severe damage mainly come from dynamic loading, dynamic model of sleeper is
studied in order to get a reliable response for sleeper, such as critical displacement, and stress
and strain distribution.
4.2 Dynamic modelling of sleeper with uniform support
Much severe damage occurs due to dynamic loads where its magnitude, direction or position
varies with time applied to the sleeper instead of static loads; as a result dynamic analysis is of
vital. In order to study the dynamic behaviour of sleeper, modal superposition procedure will
be carried out, this procedure mainly applies to linear dynamic analysis, using through linear
perturbation step in Abaqus / Standard, and the foundation of this method is eigenmode of
structure. This analysis is suitable for calculating linear problems on dynamic structural
response in time domain, for instance time varying deflections and stresses. Firstly a
frequency extraction should be defined; secondly the dynamic characteristics of sleeper can be
obtained, such as natural frequency and mode shapes; finally transient modal dynamic analysis
can be achieved.

19
4.2.1 Modelling of sleeper
The sleeper is modelled as solid element as previous static model. But most importantly, the
sleeper model is supported by a viscously damped, massless elastic foundation with certain
stiffness that simulates the simplified underlying ballast supports which allows the sleeper
move up and down, see figure 15.
The non-linear behaviour of concrete material is not taken into account, as well as the possible
cracking condition. Furthermore, for the sleeper and ballast interaction, instead of fixed
support, discrete spring elements with uniform stiffness of 20 MN/m2 are connected to the
ground with at the interval of 75 mm, which means with the total length of a sleeper, around
30 spring elements connected to the bottom of sleeper are modelled as the sleeper and ballast
interaction. This roughness of approximation is good enough because what are concerned with
are only the peak values and ballpark variations from Abaqus outputs. The boundary condition
is the constant friction at the bottom interface of the sleeper with a frictional coefficient of 0.2.
To simplify the dynamic modelling, a sine-curve dynamic loading is introduced, when
assuming one single dynamic loading wave passes one single sleeper with the speed of 130
km/h, and with no irregularities of the rail or the wheel profile. The time history of this
dynamic rail seat load is illustrated as figure 16. Damping is also included using direct
damping data equals to 3.
Figure 15 Uniform interaction between sleeper and ballast

20
Figure 16 Time history of dynamic rail seat load
4.2.2 Numerical results
Two parts of numerical results which can be obtained from modal superposition analysis is
presented in the following two sections. First the natural frequency extraction is discussed, and
is followed by the important dynamic structural response, like vertical displacement and
reaction force plotted from transient modal dynamic analysis.
4.2.2.1 Natural frequency extraction
Eigenvalue extraction is performed to calculate the natural frequencies and the corresponding
mode shapes of sleeper. Eigenvalue, participation factor and effective mass are necessary in
this step. When using the modal superposition method, the number of eigenvalues extracted
must be sufficient, and the criterion is the effective mass need to exceed 90% of the total mass
of model in the strongest motional direction. In this model, it is enough to extract 20 mode
shapes. Examples of mode shapes on sleeper are shown below in figure 17.
-10
0
10
20
30
40
50
0 0,002 0,004 0,006 0,008
dynamic load
t (s)
F (KN
)

21
Figure 17 Mode shape No.1, 2, 4, 6
4.2.2.2 Vertical displacement and reaction force
Dynamic analysis is carried out on one single sleeper. The most interesting numerical results
of dynamic structural response are considered as vertical displacement at rail seat and the
reaction force of the sleeper. Vertical displacement at rail seat can be plotted from Abaqus
directly, and the reaction force of the sleeper can be calculated as spring stiffness multiplies
vertical displacements for the positions where there are spring elements underlying. These two
curves under dynamic condition are put forward as figure 18 and 19.
Figure 18 Vertical displacement at rail seat
22
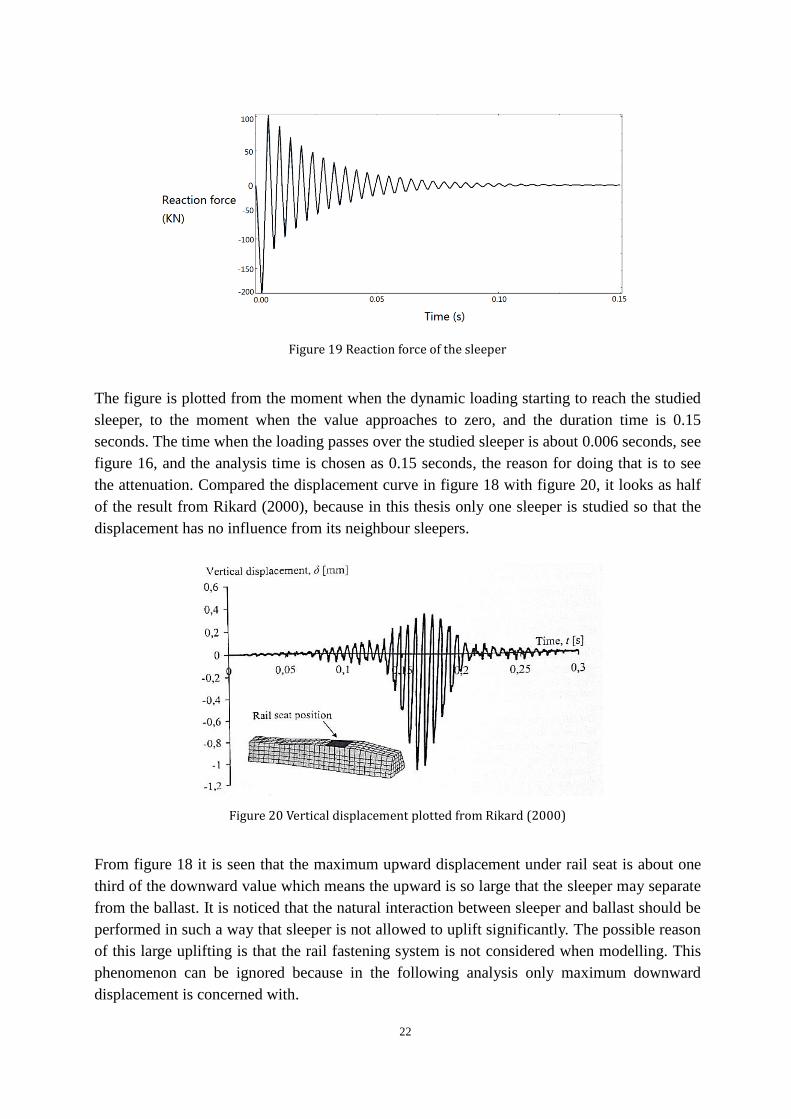
Figure 19 Reaction force of the sleeper
The figure is plotted from the moment when the dynamic loading starting to reach the studied
sleeper, to the moment when the value approaches to zero, and the duration time is 0.15
seconds. The time when the loading passes over the studied sleeper is about 0.006 seconds, see
figure 16, and the analysis time is chosen as 0.15 seconds, the reason for doing that is to see
the attenuation. Compared the displacement curve in figure 18 with figure 20, it looks as half
of the result from Rikard (2000), because in this thesis only one sleeper is studied so that the
displacement has no influence from its neighbour sleepers.
Figure 20 Vertical displacement plotted from Rikard (2000)
From figure 18 it is seen that the maximum upward displacement under rail seat is about one
third of the downward value which means the upward is so large that the sleeper may separate
from the ballast. It is noticed that the natural interaction between sleeper and ballast should be
performed in such a way that sleeper is not allowed to uplift significantly. The possible reason
of this large uplifting is that the rail fastening system is not considered when modelling. This
phenomenon can be ignored because in the following analysis only maximum downward
displacement is concerned with.

23
In addition, due to the reaction force at rail seat is calculated according to displacement, the
variation of reaction force is similar to displacement as shown from figure 19. The maximum
reaction force with uniform support under dynamic condition is approximate 200 KN.
For design procedure, bending moment distribution is also of important when placing
reinforcement. It is noticed that it is difficult to plot sectional moment from Abaqus when
sleeper is modelled as a solid element in three dimensions, but it can easily provide numerical
results of compressive and tensile stress for each node. Thus, alternatively bending moment
can be calculated based on stress using below formula:
where M = negative or positive bending moment,
= compressive or tensile stress (output from Abaqus),
Z = distance between the neutral axis and the calculated point,
I = second moment of inertia.
In this thesis, width (b) and height (h) of cross section of a sleeper are chosen as 300 mm and
210 mm. And maximum compressive stress under rail seat r (negative) and tensile stress at
midpoint m (positive) are given as 8 MPa and 1.6 MPa respectively, see case 1 in figure 28
and 29. So the maximum negative and positive bending moment under rail seat and in
centre can be calculated respectively like below:
As a result, the bending moment diagram along the sleeper can be roughly plotted and the
required prestressed reinforcement can be therefore placed as below:

24
Figure 21 Bending moment distribution along the sleeper (The symbol ‘+’ means positive moment and ‘-’
means negative moment)
4.2.3 Discussion
Again, after comparison between numerical results and corresponding curves from Rikard
(2000), the good fit represents the model has a good quality; therefore, this FE-model can be
continued using in the next section when applying different scenarios of support condition.
-5
0
5
10
15
20
0 500 1000 1500 2000 2500 3000
Bending moment
Reinforcement
Distance along the sleeper (mm)
Mo
men
t (KN
m)

25
5. Sleeper modelling with deterministic support
conditions
In reality, the sleeper-ballast interaction is not as simple as that in the previous sections, and
the interaction is neither uniformly distributed, nor fixed. Usually the real contact situation
between sleeper and ballast is too difficult to be known. Thus, in the following two chapters,
sleeper with uncertain support which is so called stochastic support condition will be
discussed. Before stochastic sleeper-ballast interaction investigation, four different possible
simple scenarios of support condition are conducted. The four support scenarios has been
studied in order to study the internal pattern of sleeper’s behaviour under different typical
support conditions, see figure 22, and these four typical conditions will be chosen as mean
values when stochastic analysis, and then the most severe case will be identified.
Table 3 lists the inputs of stiffness of elastic foundation for different cases, and these values
are selected depending on whether it is a soft or stiff ballast bed, given in Tore (2003).
Figure 22 Different cases of support conditions

26
Table 3 Stiffness for different cases of support condition
Case/Stiffness Stiffness (MN/m2)
side centre
case 1 20
case 2 26 13
case 3 26
case 4 20
5.1 Static analysis
In this static model, hydraulic jack loading is still used. Except the different support conditions,
other input parameters remain the same as section 4.1. Figure 23-25 describe over a certain
loading period some comparisons under different static support cases, see figure 22, such as:
Vertical displacement along the sleeper
Sectional moment distribution along the sleeper
Sectional moment variation at the rail seat with time
Figure 23 Vertical displacement along the sleeper
-1,2
-1
-0,8
-0,6
-0,4
-0,2
0
0 500 1000 1500 2000 2500
case1
case2
case3
case4
Distance along the sleeper (mm)
Disp
lacemen
t (mm
)

27
Figure 24 Sectional moment distribution along the sleeper
Figure 25 Sectional moment variation at the rail seat with time
In the design process (case 1) where uniform support is assumed, under rail seat there is
positive moment where we place reinforcement in the lower part of sleeper, in the centre there
is negative moment where we place reinforcement in the upper part of sleeper. But as it is seen
from figure 24, in case 4 the moment has opposite sign, plus this figure is plotted on a position
where there is no reinforcement, thus the sleeper might have tensile problems because it may
have not enough tensile capacity to bear moment. Measures can be done by adding rebar to the
right positions both at rail seat and in the middle part of the sleeper, or prestressed force is
required to increase. Therefore case 4 which has the worst moment distribution and quite large
displacement, need to be avoided due to regulations, operational performance and safely
aspect.
-2,00E+07
-1,50E+07
-1,00E+07
-5,00E+06
0,00E+00
5,00E+06
1,00E+07
0 500 1000 1500 2000 2500 3000
case4
case3
case2
case1
Mo
men
t (*1
0-3 P
a)
Distance along the sleeper (mm)
-1,80E+07
-1,60E+07
-1,40E+07
-1,20E+07
-1,00E+07
-8,00E+06
-6,00E+06
-4,00E+06
-2,00E+06
0,00E+00
2,00E+06
4,00E+06
0 200 400 600 800 1000 1200 1400
case4
case3
case2
case1
Mo
men
t (*10
-3 Pa)
Time (s)
28
5.2 Dynamic analysis
In this section, except the different support conditions, according to figure 22, other input
parameters remain the same as section 4.2. Comparison of numerical results under these four
typical support conditions will be discussed, such as vertical displacement, reaction force and
stress both underneath the rail seat and in the centre of the sleeper, see figure 26-29.
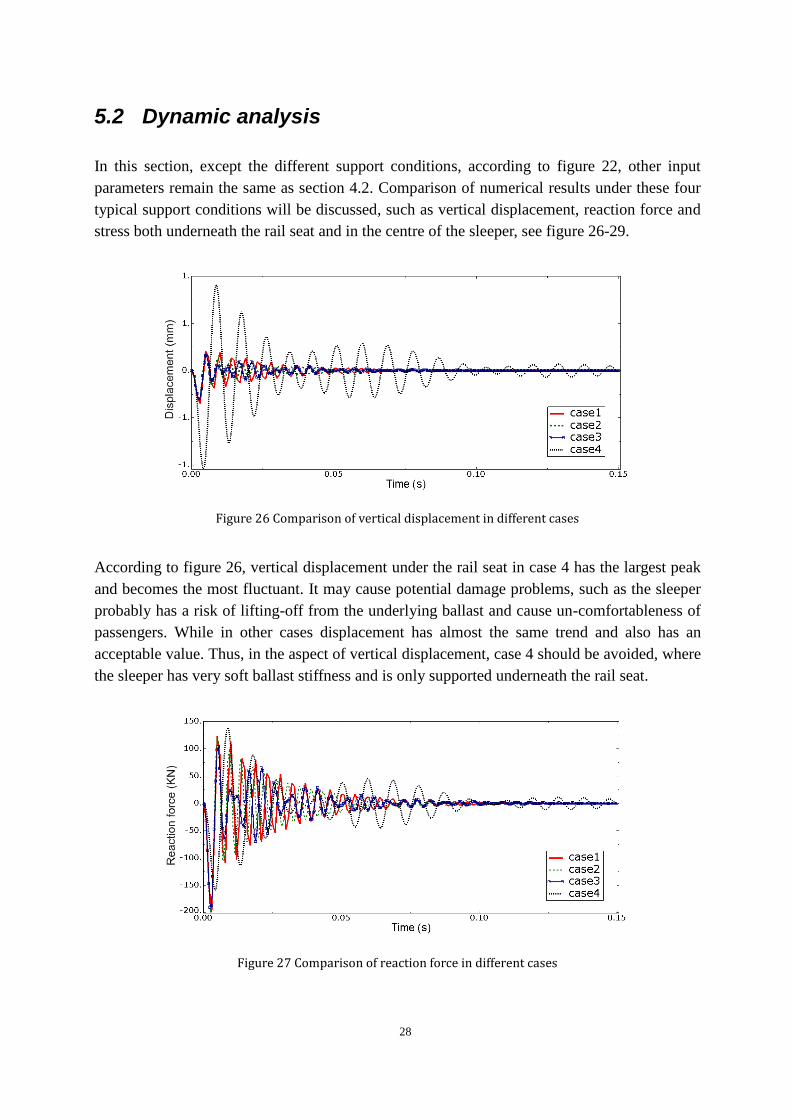
Figure 26 Comparison of vertical displacement in different cases
According to figure 26, vertical displacement under the rail seat in case 4 has the largest peak
and becomes the most fluctuant. It may cause potential damage problems, such as the sleeper
probably has a risk of lifting-off from the underlying ballast and cause un-comfortableness of
passengers. While in other cases displacement has almost the same trend and also has an
acceptable value. Thus, in the aspect of vertical displacement, case 4 should be avoided, where
the sleeper has very soft ballast stiffness and is only supported underneath the rail seat.
Figure 27 Comparison of reaction force in different cases

29
As can be seen from figure 27, it describes reaction force under the rail seat for different cases.
At the beginning, reaction forces in all cases have a similar trend, but as time pass by, case 4 is
still fluctuant while other cases start to level off to zero after 0.05 seconds. Again case 4 is not
an appropriate choice as support condition for sleeper.
Figure 28 Comparison of stress underneath the rail seat in different cases
It is clear from figure 28 that the stress variation under the rail seat is similar as the vertical
displacement for different cases in figure 26. Both the compressive (negative sign) and tensile
stress (positive sign) in case 4 have the largest peak values and the most fluctuant. Luckily it
might not be a problem since in case 4 the largest tensile stress which is 2 MPa does not
exceed the sleeper’s tensile capacity.
Figure 29 Comparison of stress in the centre in different cases
Stress in different cases is also plotted for a position which locates on the top surface of the
middle part of sleeper where no rebar placed, shown in figure 29. It illustrates that in case 4 it
also has the largest tensile stress in the centre of sleeper, and it is noticed that the maximum
tensile stress in case 4 which is 10 MPa is far above the concrete tensile capacity of 3 MPa, it
means it will probably cause the sleeper tensile damages. Measures can be done by placing
30
new prestressed reinforcement on this position if a sleeper is subjected to case 4. Therefore, it
is apparent that case 4 is not a desired support condition because of the largest value and
fluctuation, compared with other support cases.
5.3 Discussion
Combined the static and dynamic analysis in section 5.1 and 5.2, the worst support condition
is case 4 where there is sleeper-ballast interaction only underneath the rail seat, while there is
no ballast underlying in the centre of the sleeper or on both sides, see figure 22.
In this chapter, the most four common deterministic support conditions are listed and analysed.
But in reality, support condition varies much and unknown, this can be called
non-deterministic or stochastic, as a result stochastic sleeper-ballast interaction will be
investigated in the next section.
What is worth mentioning is that after static and dynamic modelling the maximum
compressive stress under rail seat or at midpoint is far below the strength capacity of concrete,
which means for stochastic support condition analysis by applying different ballast stiffness
the compressive stress will not be a problem, therefore for the stress of sleeper, only maximum
tensile stress will be focused on in the following chapter.

31
6. Sleeper modelling with stochastic support
condition
In chapter 5, four possible ballast support conditions have been discussed. In this chapter, for
non-deterministic analysis of one single sleeper, only the sleeper-ballast interaction variation is
considered along the length of sleeper. The objective of this chapter is to study the effect of
stochastic ballast support condition on structural behaviour of one single sleeper and
investigate the most undesirable support condition. Due to lack of formulas for sleeper design
under stochastic support, artificial neural network is performed in order to predict the
structural behaviour of sleeper under any given stochastic ballast stiffness, based on adequate
statistical data. Neural network is usually used to find internal patterns between input and
output. Hence, this method is used as a mathematical modelling tool to study the internal
non-linear relationship between variable stochastic support conditions and dynamic structural
behaviour of sleeper.
First step is to obtain sufficient data on how sleeper performs under different random ballast
stiffness using FE analysis, which is proved to be reliable according to the previous sections.
Second step is to predict the interesting dynamic response on sleeper under any sleeper-ballast
interaction using back-propagation neural network. Third step is to assess the quality of neural
network prediction compared the results with those from FE model. The final step is statistical
analysis based on the results from both FE model and neural network in order to find the most
unfavourable support condition that may cause damage not only for sleeper but also for the
whole railway system.
6.1 Methodology
Neural network is a network of neurons as found in real human brains. An artificial neural
network (ANN), also called neural network (NN) or connection model, is a mathematical
model or computational model which is inspired by the structure and functional aspects of
biological neural networks, see Wikipedia on ‘‘artificial neural network’’. In other word, it is a
distributed parallel processor consisting of lots of processing elements which are connected
together in a particular pattern to achieve a target. The network consists of different simple
artificial neuron’s inputs interconnected by the network activation function. The activation
function can convert from neuron’s inputs which are multiplied by weights to outputs. In this
network weights play a similar role as synapses via which one neuron sends data to another
neuron in biological neural network. The network can train itself automatically to perform the
most precise activation function by adjusting weights in order to make outputs match target. It
illustrates in figure 30. The neural network grows rapidly and has already been applied to
many fields, such as industrial, manufacturing, transportation and other practical fields.

32
Figure 30 A neural network, Howard (2002)
The fundamental and algorithm of back-propagation network are briefly illustrated below. A
neuron network consists of R inputs shown below figure 31, and each input is weighted with
w which is random chosen. The sum of all the weighted inputs and the bias constitutes the
input to an activation function f. After computing its output; network will compare it with the
expected output and calculate error between these two. Then the network propagates the error
backwards and continues training using back-propagation idea to minimize the error. The
process of adjusting and updating weights, biases and activation function is called training
data or learning process, Carlos (2003).
The complex back-propagation algorithm has many variations. The simplest realization of
back-propagation learning process updates the weights and biases in the direction where the
activation function decreases most rapidly, that is the negative of the gradient, see Howard
(2002).
An iteration of this algorithm is expressed as:
Xk+1 = Xk – аk * gk
Where Xk = a vector of current weights and biases,
gk = the current gradient,
аk = the learning rate.

33
Figure 31 Basic fundamental of a back-propagation neural network, Howard (2002)
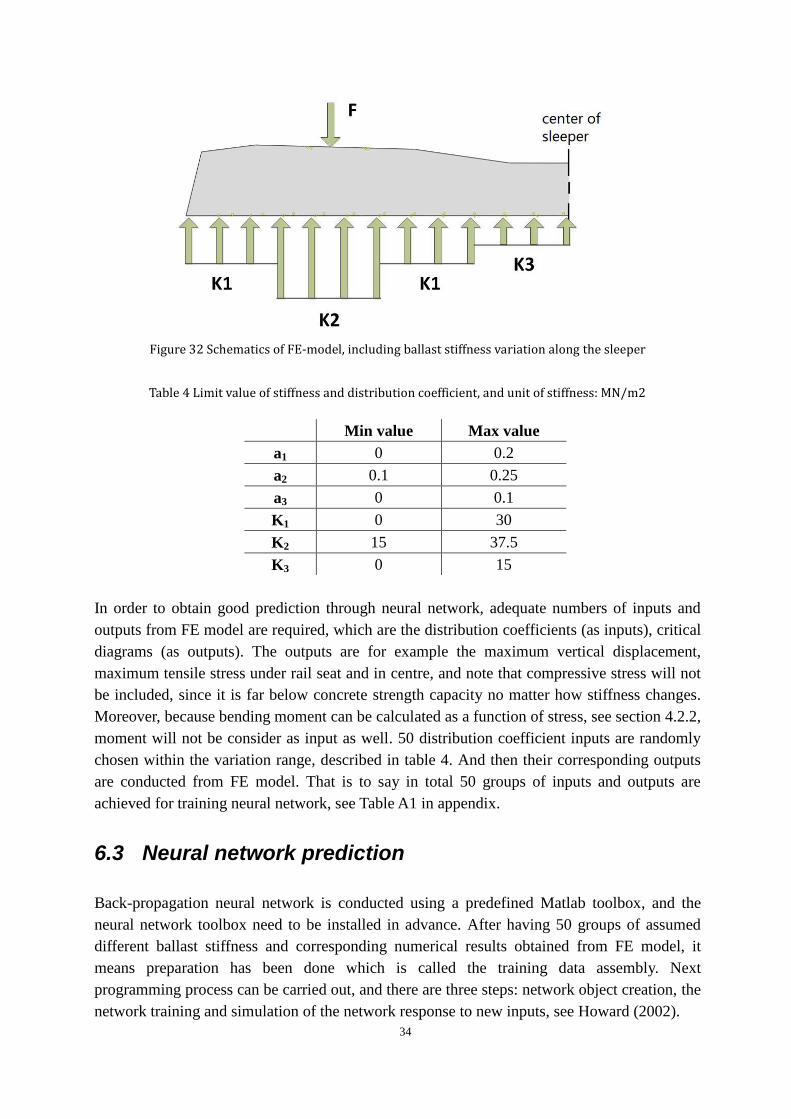
6.2 The finite element model
To simplify the complex support situation, one sleeper can be divided into eight equal parts
along the total distance of the sleeper, and each part has its own discrete ballast stiffness, that
is to say for half of a sleeper, assume three different support stiffness is located under four
parts of the sleeper which are the rail seat, the centre, in between and the edge, moreover
ballast is distributed equally within each part of the sleeper, described in figure 32. In my
opinion, this kind of simplification seems reasonable on the basis of sleeper geometry and
loading situation. Each ballast stiffness can be expressed by the total ballast stiffness
multiplies the corresponding distribution coefficient, see below formulas.
K1 = K * a1
K2 = K * a2
K3 = K * a3
where K = total ballast stiffness under half of a sleeper, equals to 150 MN / m2,
K1-K3 = ballast stiffness for different parts,
a1-a3 = corresponding distribution coefficient.
Variation range of different stiffness shown in table 4 is assumed as reasonable value: the
minimum stiffness in centre or on sides can differ from zero; while stiffness under rail seat
will never become to zero under any circumstance otherwise the sleeper will turn completely
ruined without any support. Besides, the maximum stiffness under rail seat is much larger than
other positions because it undertakes most of traffic load; meanwhile stiffness in centre is a
little smaller.
34
Figure 32 Schematics of FE-model, including ballast stiffness variation along the sleeper
Table 4 Limit value of stiffness and distribution coefficient, and unit of stiffness: MN/m2
Min value Max value
a1 0 0.2
a2 0.1 0.25
a3 0 0.1
K1 0 30
K2 15 37.5
K3 0 15
In order to obtain good prediction through neural network, adequate numbers of inputs and
outputs from FE model are required, which are the distribution coefficients (as inputs), critical
diagrams (as outputs). The outputs are for example the maximum vertical displacement,
maximum tensile stress under rail seat and in centre, and note that compressive stress will not
be included, since it is far below concrete strength capacity no matter how stiffness changes.
Moreover, because bending moment can be calculated as a function of stress, see section 4.2.2,
moment will not be consider as input as well. 50 distribution coefficient inputs are randomly
chosen within the variation range, described in table 4. And then their corresponding outputs
are conducted from FE model. That is to say in total 50 groups of inputs and outputs are
achieved for training neural network, see Table A1 in appendix.
6.3 Neural network prediction
Back-propagation neural network is conducted using a predefined Matlab toolbox, and the
neural network toolbox need to be installed in advance. After having 50 groups of assumed
different ballast stiffness and corresponding numerical results obtained from FE model, it
means preparation has been done which is called the training data assembly. Next
programming process can be carried out, and there are three steps: network object creation, the
network training and simulation of the network response to new inputs, see Howard (2002).

35
Table 5 describes some of the training data which are the most critical ballast stiffness inputs
and outputs. It is noticeable that when establishing 50 groups of inputs, both random data and
critical data have been chosen to make sure the universality and particularity of data. This
choice has been done in order to increase the precision of network prediction, since the
learning procedure for neural network is so important that it affects the accuracy of prediction.
In table 5, the highlight represents the most undesired support condition, where the sleeper has
largest deflection or tensile stress, and it will be analysed in the following section 6.4
Table 5 Some of the inputs and outputs used in the learning procedure: critical ballast stiffness (input) and
corresponding dynamic behaviour (output)
NO. K1 K2 K3 D(max) Stress(rail) Stress(centre)
Limit
value
0 15 0 -1.156 1.822 11.149
30 15 0 -0.354 1.564 3.855
0 37.5 0 -0.668 2.236 2.816
30 37.5 0 -0.257 1.375 2.778
0 15 15 -0.911 2.576 8.563
30 15 15 -0.322 1.571 0.244
0 37.5 15 -0.643 2.655 6.535
30 37.5 15 -0.243 1.384 1.787
Even though the neural network uses advanced computational algorithm and iteration learning
process, our human brain is a highly complex and highly intelligent system, thus we should
keep in mind human brains can never be replaced with the network which is only a man-made
network and an over-simplified machine compared to brains. For this reason, results from the
neural network should be checked, that is also called quality assessment.
Table 6 is the difference of outputs obtained from neural network and finite element model
with same inputs, tested for 10 random samples. As it can be seen in Table 6 the difference or
so called prediction error is not larger than an acceptable value of 8.5%, which states that the
network model is qualified. Therefore, it represents this neural network could predict the
dynamic behaviour of sleeper subjected to a stochastic support condition in a proper manner.
To study and analyse the structural response of the sleeper on various ballast stiffness, 100
groups of data are predicted via the neural network, see appendix.

36
Table 6 Difference of results from between FE-model and Neural network
Difference (%)
NO. D(max) Stress(rail) Stress(centre)
1 8.06 8.21 5.79
2 5.41 5.76 7.18
3 4.85 7.79 7.00
4 3.55 2.51 2.79
5 6.66 6.96 7.30
6 2.19 3.89 4.38
7 3.23 4.30 7.25
8 2.90 8.55 7.10
9 4.18 4.91 8.34
10 8.47 5.21 5.99
6.4 Statistical analysis
Combining all the data obtained both from the finite element model and the neural network
model; there are approximate 150 groups on sleeper’s dynamic structural behaviour under
different stochastic support conditions. In this section, from statistical analysis, the worst
support cases will be summarized, and furthermore a regular pattern between different support
conditions and their effect on a sleeper will be analysed.
From table 5 in section 6.3, the dark highlighted support condition cases have severe problems
which have both largest vertical displacement and tensile stress, thus they have priority to be
paid attention to. The light highlighted cases may have potential damage which also has either
large displacement or tensile stress. The similarity of these two kinds of condition is that there
is no ballast supported under right and left side of rail seat. This represents that a sleeper
which does not have ballast support under two sides of rail seat has great possibility of failure,
no matter how ballast stiffness varies under the rail seat or in the centre of sleeper. Another
remarkable part is that for the first line of table 5, there is significant high tensile stress of 11
MPa which will cause cracking damage, and this is the case where the sleeper is supported
only under the rail seat by very soft ballast which has a stiffness of 15 MN/m2. One can see the
first two diagrams in figure 33.
And from the appendix which includes 150 groups of data, it can be summarized that there
exists other unfavourable ballast support conditions than those mentioned above, see
highlighted in the appendix. It is concluded that the worst supports could be: soft support both
on the sides and in the centre; only soft support in the centre; soft support distributed along the
sleeper, and etc. This is illustrated in figure 33.

37
Figure 33 The most unfavourable ballast support condition
After finishing studying the worst support conditions, variations of the vertical displacement,
tensile stress at rail seat and in centre of sleeper as function of ballast stiffness are investigated
in following.

38
Figure 34 and 35 indicate that the change proportion between sleeper performance and total
ballast stiffness. As ballast stiffness increases, vertical displacement at rail seat decreases, and
tensile stress in centre decreases as well, but the stress at the rail seat remains stable.
Figure 34 Displacement variation with ballast stiffness
Figure 35 Tensile stress variation with ballast stiffness
-0,41
-0,39
-0,37
-0,35
-0,33
-0,31
-0,29
-0,27
-0,25
12 17 22 27
Dis
pla
cem
ent
(mm
)
Ballast stiffness (MN/m2)
Displacement
1,4
1,6
1,8
2
2,2
2,4
2,6
2,8
3
12 17 22 27
Stre
ss (
MPa
)
Ballast stiffness (MN/m2)
Stress(rail seat)
Stress(center)

39
Figure 36 Displacement, stress at rail seat & midpoint variation with K1
Figure 37 Displacement, stress at rail seat & midpoint variation with K2
Figure 38 Displacement, stress at rail seat & midpoint variation with K3
-0,5
0
0,5
1
1,5
2
2,5
3
0 5 10 15 20 25 30
Displacement
Stress at rail seat
Stress at midpoint
K1 variation (MN/m2)
-1
-0,5
0
0,5
1
1,5
2
2,5
3
3,5
15 20 25 30 35 40
Displacement
Stress at rail seat
Stress at midpoint
K2 variation (MN/m2)
-1
0
1
2
3
4
5
6
0 5 10 15
Displacement
Stress at rail seat
Stress at midpoint
K3 variation (MN/m2)
40
Figure 36, 37 and 38 exhibit the effect of only one of stiffness distribution coefficients on one
single sleeper, upon the maximum vertical displacement, tensile stress at rail seat and midpoint
respectively which are of interest. K1, K2 and K3 represent the different support stiffness under
each part of sleeper, see figure 32 in section 6.2. When one single stiffness Ki (i = 1, 2, 3) is
analysed, other stiffness remains constant.
For displacement, it illustrates displacement remains constant by changing stiffness, but when
looking at those specific numbers, it reveals that displacement under rail seat decreases
slightly with the increase of each stiffness. This phenomenon is the same as displacement
versus total stiffness.
The figures also provide some interesting data regarding tensile stress at midpoint, which
declines when each stiffness increases. As it is seen from the broken green curve in figure 38,
when the stiffness K3 is very small the tensile stress at midpoint is much larger than concrete
tensile capacity of 2.85 MPa, because this position is quite close to the top surface in the
centre where there is no rebar placed, that is to say that the sleeper may face cracking problem.
Tensile stresses can be reduced by increasing ballast stiffness K3 to a moderate value, but
increasing stiffness to a very large value may be liable to cause brittle failure of structure.

41
7. Conclusion and further research
From analysing the structural behaviour of prestressed concrete railway sleeper subjected to
deterministic and stochastic sleeper-ballast interaction, it can be seen clearly that the
performance and bearing capacity of a sleeper is dependent not only on traffic loading,
material characteristics, sleeper geometry, but also upon ballast support condition underneath
the sleeper. The gradual change of the ballast distribution takes place with time due to gradual
wear and tear of the ballast, and it is impossible to forecast the accurate support distribution,
therefore it is of concern for sleeper designers and manufacturers to investigate the influence
of variation of ballast stiffness and distribution.
In this thesis, based on statistic the possible unfavourable ballast support cases are presented.
For instance, very soft support underneath the rail seat and large variation of ballast stiffness
along the length of sleeper might cause severe cracking problems especially at the top surface
in the middle of the sleeper.
Furthermore, artificial neural network is used to predict the effect on deflection and tensile
stress with the stochastic ballast distribution. This mathematical and computational method
proves to be appropriate and easy way to study and predict the behaviour of a sleeper under a
non-deterministic ballast support conditions. But it is not a master key to solve all problems,
and this method generates full of uncertainties. Large numbers of data and strong
representative data are required to increase its precision.
Further research could be done on studying various ballast stiffness and its distribution based
on field measurements, so that random ballast stiffness can be generated using stochastic
analysis, such as Karhunen-Loeve expansion and Latin hypercube sampling. What’s more,
more accurate result can be obtained by modelling discrete ballast stiffness with high
resolution. In addition it is also a good idea for engineers to design the optimized geometry of
sleeper which can function well under stochastic support condition.

42
43
8. References
1. Rikard G. (2000), Static and dynamic finite element analysis of concrete sleepers,
Department of structural engineering, Chalmers University of Technology, Göteborg,
Sweden, 2000. Licentiate Thesis.
2. Johanna L. (2006), Preliminaries for probabilistic railway sleeper design, Department of
applied mechanics, Chalmers University of Technology, Göteborg, Sweden, 2006.
Licentiate Thesis.
3. Siti H. H. and Khafilah D. (2008), Appraisal of used wooden railway sleeper, Journal of
Engineering Science and Technology, Vol. 3, No. 3, 224-233, School of Engineering,
Taylor’s University College, 2008.
4. Siril Y. (2007), Automating condition monitoring of wooden railway sleepers,
EngineeringIT, October, 2007.
5. Bernhard L. (2005), Track compendium, Eurailpress Tetzlaff-Hestra GmbH & Co. KG,
2005.
6. FIP Commission on Prefabrication (1987), Concrete railway sleepers, Chairman of the
working party Gylltoft K, FIB state of art report, Thomas Telford, London, 1987.
7. Amlan K. S. and Devdas M. (2008), Prestressed concrete structures, Indian Institute of
Technology Madras, online version.
8. Johan S. and Håkan S. (2008), Prestressed concrete structures, TRITA-BKN. Report 122,
Structural design & bridges, KTH Royal Institute of Technology, Stockholm, Sweden,
2008.
9. Doyle N. F. (1980), Railway track design: a review of current practice, BHP Melbourne
Research Laboratories, Australian Government Publishing Service, Canberra, 1980.
10. Wikipedia: http://en.wikipedia.org/wiki/Artificial_neural_network
11. Howard D. and Mark B. (2002), Neural network toolbox for use with MATLAB, User’s
guide, version 4, online version, The MathWorks, Inc., July, 2002.
12. Carlos G. (2003), Artificial neural networks for beginners, online version.
13. Tore D. (2003), Railway track dynamics-a survey, Solid mechanics/IKP, Linköping
University, Linköping, Sweden.
14. Infraset (2009), Railway products, the Aveng group, February 2009.

44

45
9. Appendix
Table A1 Results from FE-model: first 50 groups; results from Neural network: remaining groups,
highlights represent undesirable values
NO. a1 a2 a3 K1 K2 K3 D(max) Stress(rail) Stress(centre)
1 0 0.1 0 0 15 0 -1.1564 1.8223 11.1487
2 0.2 0.1 0 30 15 0 -0.3543 1.5643 3.8554
3 0 0.25 0 0 37.5 0 -0.6676 2.2364 2.8156
4 0.2 0.25 0 30 37.5 0 -0.2566 1.3754 2.7776
5 0 0.1 0.1 0 15 15 -0.9112 2.576 8.5632
6 0.2 0.1 0.1 30 15 15 -0.3223 1.5712 0.2443
7 0 0.25 0.1 0 37.5 15 -0.6432 2.6546 6.5345
8 0.2 0.25 0.1 30 37.5 15 -0.2434 1.3836 1.7874
9 0.19 0.206 0.098 28.5 30.9 14.7 -0.2634 1.4298 1.9554
10 0.186 0.239 0.067 27.9 35.85 10.05 -0.2565 1.3876 1.6327
11 0.153 0.198 0.014 22.95 29.7 2.1 -0.2989 1.4143 3.3855
12 0.176 0.184 0.086 26.4 27.6 12.9 -0.2709 1.4434 1.9272
13 0.165 0.173 0.066 24.75 25.95 9.9 -0.2845 1.4454 1.8354
14 0.153 0.135 0.094 22.95 20.25 14.1 -0.3087 1.5459 2.2167
15 0.096 0.244 0.037 14.4 36.6 5.55 -0.3243 1.3113 2.6895
16 0.167 0.238 0.009 25.05 35.7 1.35 -0.2723 1.3722 3.4587
17 0.08 0.227 0.055 12 34.05 8.25 -0.3537 1.3154 2.3212
18 0.169 0.213 0.061 25.35 31.95 9.15 -0.2738 1.4324 1.6867
19 0.16 0.175 0.051 24 26.25 7.65 -0.2874 1.4354 0.1848
20 0.184 0.156 0.022 27.6 23.4 3.3 -0.2822 1.4694 2.6859
21 0.194 0.128 0.065 29.1 19.2 9.75 -0.2855 1.5177 1.8559
22 0.15 0.195 0.038 22.5 29.25 5.7 -0.28693 1.40429 2.2931
23 0.187 0.199 0.018 28.05 29.85 2.7 -0.26707 1.41843 2.63537
24 0.191 0.21 0.036 28.65 31.5 5.4 -0.26091 1.4106 2.09425
25 0.164 0.171 0.092 24.6 25.65 13.8 -0.28311 1.44603 2.03855
26 0.181 0.151 0.061 27.15 22.65 9.15 -0.28269 1.47787 1.79221
27 0.155 0.116 0.008 23.25 17.4 1.2 -0.32533 1.50932 3.95004
28 0.025 0.14 0.016 3.75 21 2.4 -0.61105 1.32802 5.84529
29 0.105 0.226 0.032 15.75 33.9 4.8 -0.31887 1.33778 2.92415
30 0.05 0.211 0.001 7.5 31.65 0.15 -0.43582 1.28471 5.95543
31 0.19 0.192 0.071 28.5 28.8 10.65 -0.26428 1.43294 1.74108
32 0.122 0.156 0.016 18.3 23.4 2.4 -0.33693 1.42939 3.93395
33 0.11 0.145 0.025 16.5 21.75 3.75 -0.35864 1.43562 3.51516
34 0.152 0.108 0.016 22.8 16.2 2.4 -0.33259 1.52153 3.61937
35 0.081 0.113 0.094 12.15 16.95 14.1 -0.41711 1.46378 2.97515

46
36 0.055 0.105 0.043 8.25 15.75 6.45 -0.49744 1.43879 2.71209
37 0.02 0.136 0.012 3 20.4 1.8 -0.65241 1.32217 6.61886
38 0.07 0.123 0.095 10.5 18.45 14.25 -0.4304 1.43525 3.1052
39 0.148 0.111 0.047 22.2 16.65 7.05 -0.32765 1.51746 2.21497
40 0.172 0.174 0.071 25.8 26.1 10.65 -0.2592 1.3908 1.7077
41 0.165 0.166 0.063 24.75 24.9 9.45 -0.263 1.3916 1.7614
42 0.175 0.156 0.089 26.25 23.4 13.35 -0.2585 1.3958 1.6916
43 0.164 0.217 0.08 24.6 32.55 12 -0.2573 1.3917 1.6765
44 0.179 0.208 0.006 26.85 31.2 0.9 -0.3775 1.4283 3.3598
45 0.185 0.198 0.097 27.75 29.7 14.55 -0.2578 1.3962 1.6786
46 0.188 0.124 0.023 28.2 18.6 3.45 -0.2445 1.4605 2.2484
47 0.177 0.249 0.014 26.55 37.35 2.1 -0.325 1.406 2.5548
48 0.166 0.241 0.002 24.9 36.15 0.3 -0.3997 1.4254 3.5254
49 0.155 0.23 0.094 23.25 34.5 14.1 -0.2605 1.4015 1.7091
50 0.162 0.213 0.022 24.3 31.95 3.3 -0.3198 1.4045 2.5043
51 0.197 0.141 0.011 29.55 21.15 1.65 -0.2641 1.4874 2.7221
52 0.177 0.149 0.039 26.55 22.35 5.85 -0.2768 1.4047 2.0503
53 0.181 0.246 0.028 27.15 36.9 4.2 -0.2877 1.3961 2.0724
54 0.192 0.214 0.056 28.8 32.1 8.4 -0.2614 1.3899 1.7374
55 0.194 0.203 0.045 29.1 30.45 6.75 -0.2683 1.3926 1.8401
56 0.197 0.221 0.026 29.55 33.15 3.9 -0.2904 1.3993 2.1421
57 0.159 0.231 0.024 23.85 34.65 3.6 -0.3085 1.4009 2.3404
58 0.184 0.162 0.016 27.6 24.3 2.4 -0.3161 1.4376 2.7959
59 0.186 0.187 0.042 27.9 28.05 6.3 -0.2735 1.3952 1.9207
60 0.186 0.126 0.033 27.9 18.9 4.95 -0.2528 1.4294 2.0329
61 0.19 0.137 0.061 28.5 20.55 9.15 -0.2568 1.3948 1.7324
62 0.188 0.129 0.05 28.2 19.35 7.5 -0.2554 1.4031 1.802
63 0.19 0.119 0.078 28.5 17.85 11.7 -0.254 1.3936 1.6721
64 0.193 0.11 0.067 28.95 16.5 10.05 -0.2479 1.3979 1.6632
65 0.182 0.233 0.048 27.3 34.95 7.2 -0.2659 1.3906 1.791
66 0.171 0.124 0.046 25.65 18.6 6.9 -0.2661 1.4059 1.9437
67 0.178 0.186 0.074 26.7 27.9 11.1 -0.2578 1.3903 1.6876
68 0.199 0.119 0.063 29.85 17.85 9.45 -0.2474 1.3985 1.6674
69 0.192 0.179 0.092 28.8 26.85 13.8 -0.2565 1.393 1.6661
70 0.171 0.151 0.084 25.65 22.65 12.6 -0.2585 1.3944 1.6953
71 0.174 0.117 0.075 26.1 17.55 11.25 -0.2571 1.3945 1.7067
72 0.181 0.182 0.053 27.15 27.3 7.95 -0.2656 1.392 1.803
73 0.172 0.159 0.043 25.8 23.85 6.45 -0.2769 1.3986 1.9899
74 0.162 0.153 0.018 24.3 22.95 2.7 -0.3432 1.4338 3.0504
75 0.158 0.245 0.012 23.7 36.75 1.8 -0.3467 1.4113 2.8198
76 0.195 0.213 0.087 29.25 31.95 13.05 -0.2554 1.3903 1.653

47
77 0.194 0.194 0.08 29.1 29.1 12 -0.256 1.3897 1.6627
78 0.151 0.162 0.021 22.65 24.3 3.15 -0.3472 1.4208 2.9649
79 0.153 0.129 0.012 22.95 19.35 1.8 -0.3737 1.4747 3.7784
80 0.167 0.14 0.077 25.05 21 11.55 -0.2592 1.3935 1.7118
81 0.189 0.132 0.068 28.35 19.8 10.2 -0.2557 1.3934 1.7021
82 0.169 0.139 0.042 25.35 20.85 6.3 -0.2763 1.4042 2.039
83 0.194 0.108 0.037 29.1 16.2 5.55 -0.2112 1.442 1.7084
84 0.161 0.225 0.004 24.15 33.75 0.6 -0.4038 1.4264 3.6025
85 0.174 0.172 0.004 26.1 25.8 0.6 -0.3954 1.4611 3.8783
86 0.195 0.14 0.073 29.25 21 10.95 -0.2553 1.3918 1.681
87 0.186 0.106 0.036 27.9 15.9 5.4 -0.2223 1.442 1.8267
88 0.166 0.145 0.005 24.9 21.75 0.75 -0.3895 1.4884 4.0832
89 0.155 0.137 0.005 23.25 20.55 0.75 -0.4166 1.4947 4.4366
90 0.19 0.144 0.071 28.5 21.6 10.65 -0.2566 1.3917 1.6945
91 0.172 0.234 0.09 25.8 35.1 13.5 -0.2568 1.3936 1.6678
92 0.189 0.202 0.055 28.35 30.3 8.25 -0.2627 1.3905 1.7569
93 0.169 0.183 0.056 25.35 27.45 8.4 -0.2656 1.3915 1.7946
94 0.191 0.151 0.024 28.65 22.65 3.6 -0.2785 1.4302 2.3178
95 0.172 0.118 0.088 25.8 17.7 13.2 -0.2591 1.3986 1.708
96 0.163 0.243 0.056 24.45 36.45 8.4 -0.2621 1.3899 1.7385
97 0.182 0.235 0.057 27.3 35.25 8.55 -0.2608 1.3894 1.7241
98 0.169 0.241 0.024 25.35 36.15 3.6 -0.3013 1.3994 2.2467
99 0.194 0.245 0.019 29.1 36.75 2.85 -0.3028 1.4009 2.2821
100 0.181 0.213 0.093 27.15 31.95 13.95 -0.257 1.3941 1.6695
101 0.19 0.17 0.018 28.5 25.5 2.7 -0.3067 1.4282 2.602
102 0.194 0.159 0.043 29.1 23.85 6.45 -0.266 1.4003 1.8903
103 0.189 0.146 0.069 28.35 21.9 10.35 -0.2572 1.3918 1.7027
104 0.165 0.231 0.094 24.75 34.65 14.1 -0.2587 1.3979 1.6884
105 0.153 0.218 0.029 22.95 32.7 4.35 -0.3018 1.3991 2.2567
106 0.166 0.207 0.054 24.9 31.05 8.1 -0.2657 1.3908 1.7895
107 0.183 0.2 0.08 27.45 30 12 -0.2565 1.3903 1.6681
108 0.152 0.236 0.005 22.8 35.4 0.75 -0.3977 1.4239 3.4835
109 0 0.18 0.05 0 27 7.5 -0.3419 1.4148 2.9406
110 0.02 0.18 0.05 3 27 7.5 -0.3271 1.3656 2.7431
111 0.04 0.18 0.05 6 27 7.5 -0.3206 1.3469 2.6471
112 0.06 0.18 0.05 9 27 7.5 -0.3176 1.3406 2.5891
113 0.08 0.18 0.05 12 27 7.5 -0.3165 1.3413 2.5242
114 0.1 0.18 0.05 15 27 7.5 -0.3165 1.3513 2.3887
115 0.12 0.18 0.05 18 27 7.5 -0.3168 1.3792 2.0774
116 0.14 0.18 0.05 21 27 7.5 -0.3152 1.43 1.5328
117 0.16 0.18 0.05 24 27 7.5 -0.3055 1.4781 1.0396
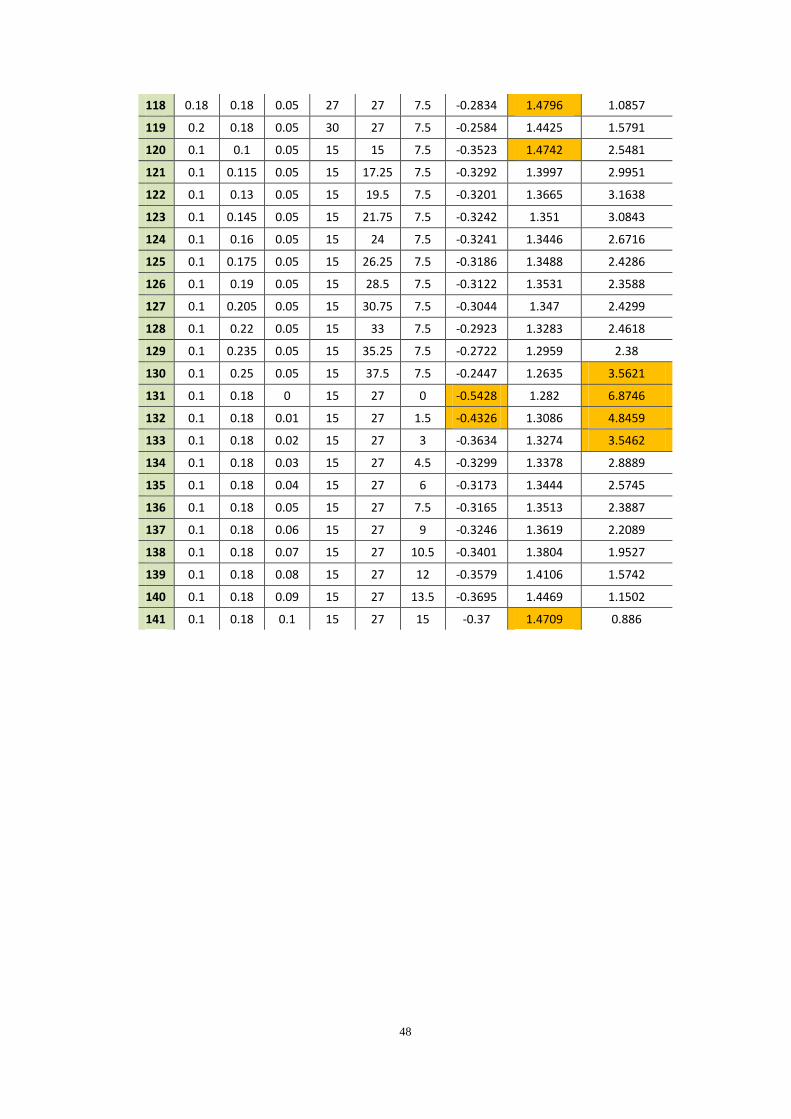
48
118 0.18 0.18 0.05 27 27 7.5 -0.2834 1.4796 1.0857
119 0.2 0.18 0.05 30 27 7.5 -0.2584 1.4425 1.5791
120 0.1 0.1 0.05 15 15 7.5 -0.3523 1.4742 2.5481
121 0.1 0.115 0.05 15 17.25 7.5 -0.3292 1.3997 2.9951
122 0.1 0.13 0.05 15 19.5 7.5 -0.3201 1.3665 3.1638
123 0.1 0.145 0.05 15 21.75 7.5 -0.3242 1.351 3.0843
124 0.1 0.16 0.05 15 24 7.5 -0.3241 1.3446 2.6716
125 0.1 0.175 0.05 15 26.25 7.5 -0.3186 1.3488 2.4286
126 0.1 0.19 0.05 15 28.5 7.5 -0.3122 1.3531 2.3588
127 0.1 0.205 0.05 15 30.75 7.5 -0.3044 1.347 2.4299
128 0.1 0.22 0.05 15 33 7.5 -0.2923 1.3283 2.4618
129 0.1 0.235 0.05 15 35.25 7.5 -0.2722 1.2959 2.38
130 0.1 0.25 0.05 15 37.5 7.5 -0.2447 1.2635 3.5621
131 0.1 0.18 0 15 27 0 -0.5428 1.282 6.8746
132 0.1 0.18 0.01 15 27 1.5 -0.4326 1.3086 4.8459
133 0.1 0.18 0.02 15 27 3 -0.3634 1.3274 3.5462
134 0.1 0.18 0.03 15 27 4.5 -0.3299 1.3378 2.8889
135 0.1 0.18 0.04 15 27 6 -0.3173 1.3444 2.5745
136 0.1 0.18 0.05 15 27 7.5 -0.3165 1.3513 2.3887
137 0.1 0.18 0.06 15 27 9 -0.3246 1.3619 2.2089
138 0.1 0.18 0.07 15 27 10.5 -0.3401 1.3804 1.9527
139 0.1 0.18 0.08 15 27 12 -0.3579 1.4106 1.5742
140 0.1 0.18 0.09 15 27 13.5 -0.3695 1.4469 1.1502
141 0.1 0.18 0.1 15 27 15 -0.37 1.4709 0.886

49
Shan Li
Email: [email protected]
EDUCATION
Aug. 2009 – Now ROYAL INSTITUTE OF TECHNOLOGY Stockholm, Sweden
Candidate for Master of Infrastructure Engineering
Sept. 2008 – June. 2009 ENGINEERING COLLEGE OF AARHUS Aarhus, Denmark
Exchange student, Wastewater Engineering and Water Supply Engineering
Oct. 2005 – Jun, 2009 SHANDONG JIAOTONG UNIVERSITY Jinan, China
Bachelor degree of Civil Engineering
SKILLS AND QUALIFICATIONS
Teamwork Successfully undertaken team projects. Besides, during the year when I was vice
president of Student Union, I organized various activities with other partners.
Hard working I Always believe: ‘‘Only by working hard can we succeed in doing everything.’’
Language skills Chinese (mother tongue), English (good writing, reading and speaking ability),
Swedish (learning)
Computer skills AutoCAD, Lusas, Abaqus, Matlab, Mathcad, Microsoft Office
ACHIEVEMENTS
President Scholarship in 2005-2006 academic year, given by Shandong Jiaotong University
Comprehensive Scholarship in six semesters at Shandong Jiaotong University
KEY COURSES
Structural Engineering, Concrete and Steel Structures, Bridge Design, Structural Dynamic for Civil Engineers,
Railway Track Engineering, Advanced Pavement Engineering Analysis and Design