rainfall observation from x-band, space-borne, synthetic aperture … · 2016-01-09 · and earth...
TRANSCRIPT

Nat. Hazards Earth Syst. Sci., 9, 77–84, 2009www.nat-hazards-earth-syst-sci.net/9/77/2009/© Author(s) 2009. This work is distributed underthe Creative Commons Attribution 3.0 License.
Natural Hazardsand Earth
System Sciences
Rainfall observation from X-band, space-borne, syntheticaperture radar
J. A. Weinman1, F. S. Marzano2, W. J. Plant3, A. Mugnai4, and N. Pierdicca2
1Atmospheric Sciences Dept., University of Washington, Seattle, WA, 98195 USA2Electrical Engineering Dept., University of Rome, “La Sapienza”, 00184 Roma, Italy3Applied Physics Laboratory, University of Washington, Seattle, WA, 98195 USA4Atmospheric Physics Institute, National Research Council of Italy, 00044 Frascatti, Italy
Received: 28 April 2008 – Revised: 24 July 2008 – Accepted: 20 September 2008 – Published: 4 February 2009
Abstract. Satellites carrying X-band Synthetic ApertureRadars (SAR) have recently been launched by several coun-tries. These provide new opportunities to measure precipita-tion with higher spatial resolution than has heretofore beenpossible. Two algorithms to retrieve precipitation from suchmeasurements over land have been developed, and the re-trieved rainfall distributions were found to be consistent. Amaritime rainfall distribution obtained from dual frequency(X and C-band) data was used to compute the DifferentialPolarized Phase Shift. The computed Differential PolarizedPhase Shift compared well with the value measured fromspace. Finally, we show a comparison between a recent X-band SAR image of a precipitation distribution and an ob-servation of the same rainfall from ground-based operationalweather radar. Although no quantitative comparison of re-trieved and conventional rainfall distributions could be madewith the available data at this time, the results presented herepoint the way to such comparisons.
1 Introduction
Global precipitation measurements are needed by weatherforecasters and climate modelers because the release of la-tent heating has a profound effect on the performance ofsuch models. With the improvement in computer capabil-ity, forecast models will be able to operate with more real-istic physics, and with higher spatial and temporal resolu-tion, Randall (2006). The Japanese Earth Simulator is al-ready being run globally with∼10 km horizontal resolution,Ohfuchi et al. (2007). Several mesoscale models are nowrunning operationally with less than 4 km horizontal resolu-
Correspondence to:J. A. Weinman(jim [email protected])
tion, and Chen et al. (2007) showed that mesoscale modelswith 1.67 km resolution were needed to resolve the inner corestructure of hurricanes.
Since the 1980s much of our understanding of globaloceanic precipitation has come from space-borne passive mi-crowave radiometers. Space-borne microwave radiometershave spatial resolution in excess of 10 km. Detailed observa-tions of hurricanes over oceans are obscured by that limita-tion.
Microwave radiometric measurements of rainfall over landrely on the scattering properties of ice in the upper regionsof precipitating clouds. However Bennartz and Petty (2001)showed that the relationship between surface rainfall ratesand the scattering properties of frozen hydrometeors is prob-lematic.
These limitations can be mitigated by space-borne radars.The Precipitation Radar (PR) aboard the Tropical Rain-fall Measurement Mission (TRMM) satellite has providedunique precipitation measurements as demonstrated by Kum-merow et al. (2000), but even the 4 km horizontal resolution,and the Signal/Noise Ratio (SNR) floor of the PR may inhibitthe measurement of compact rain cells, Durden et al. (1998).
C-band and L-band (∼5 and ∼21 cm wavelengths, re-spectively) Synthetic Aperture Radars (SAR)s have a longheritage of Earth observation with high spatial resolution.However such radars are insensitive to rainfall in the at-mosphere. Atlas and Moore (1987), Jameson et al. (1997),Moore et al. (1997) Melsheimer et al. (1998) and Alpersand Melsheimer (2004) showed that SARs operating at theshorter wavelength X-band (∼3 cm wavelength) could detectrainfall. With∼100 m resolution, X-band Synthetic ApertureRadars (X-SARs) can provide new insights into the structureof precipitating clouds.
In order to illustrate how rainfall may be retrieved fromX-SAR measurements, we used data from the STS-59 andSTS-68 Shuttle missions of 1994 that carried the first X-SAR
Published by Copernicus Publications on behalf of the European Geosciences Union.
78 J. A. Weinman et al.: Synthetic aperture radar for precipitation retrieval
Fig. 1
einman et al.
W
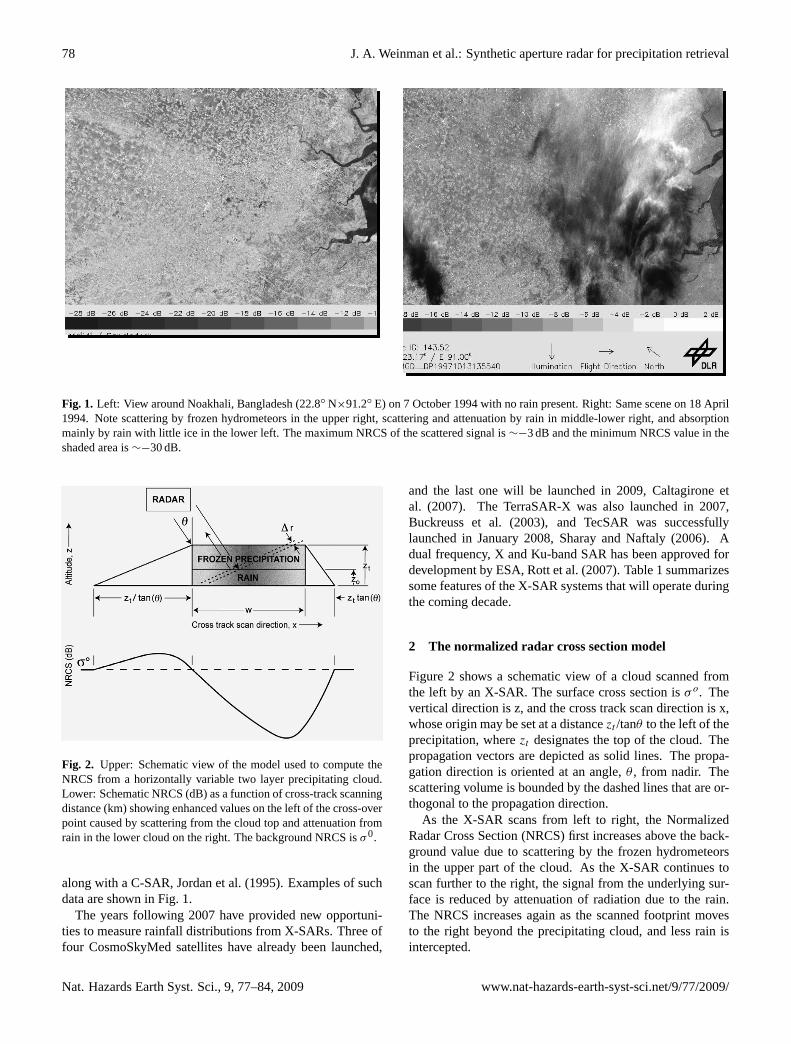
Fig. 1. Left: View around Noakhali, Bangladesh (22.8◦ N×91.2◦ E) on 7 October 1994 with no rain present. Right: Same scene on 18 April1994. Note scattering by frozen hydrometeors in the upper right, scattering and attenuation by rain in middle-lower right, and absorptionmainly by rain with little ice in the lower left. The maximum NRCS of the scattered signal is∼−3 dB and the minimum NRCS value in theshaded area is∼−30 dB.
Fig. 2.
einman et al.
W
Fig. 2. Upper: Schematic view of the model used to compute theNRCS from a horizontally variable two layer precipitating cloud.Lower: Schematic NRCS (dB) as a function of cross-track scanningdistance (km) showing enhanced values on the left of the cross-overpoint caused by scattering from the cloud top and attenuation fromrain in the lower cloud on the right. The background NRCS isσ0.
along with a C-SAR, Jordan et al. (1995). Examples of suchdata are shown in Fig. 1.
The years following 2007 have provided new opportuni-ties to measure rainfall distributions from X-SARs. Three offour CosmoSkyMed satellites have already been launched,
and the last one will be launched in 2009, Caltagirone etal. (2007). The TerraSAR-X was also launched in 2007,Buckreuss et al. (2003), and TecSAR was successfullylaunched in January 2008, Sharay and Naftaly (2006). Adual frequency, X and Ku-band SAR has been approved fordevelopment by ESA, Rott et al. (2007). Table 1 summarizessome features of the X-SAR systems that will operate duringthe coming decade.
2 The normalized radar cross section model
Figure 2 shows a schematic view of a cloud scanned fromthe left by an X-SAR. The surface cross section isσ o. Thevertical direction is z, and the cross track scan direction is x,whose origin may be set at a distancezt /tanθ to the left of theprecipitation, wherezt designates the top of the cloud. Thepropagation vectors are depicted as solid lines. The propa-gation direction is oriented at an angle,θ , from nadir. Thescattering volume is bounded by the dashed lines that are or-thogonal to the propagation direction.
As the X-SAR scans from left to right, the NormalizedRadar Cross Section (NRCS) first increases above the back-ground value due to scattering by the frozen hydrometeorsin the upper part of the cloud. As the X-SAR continues toscan further to the right, the signal from the underlying sur-face is reduced by attenuation of radiation due to the rain.The NRCS increases again as the scanned footprint movesto the right beyond the precipitating cloud, and less rain isintercepted.
Nat. Hazards Earth Syst. Sci., 9, 77–84, 2009 www.nat-hazards-earth-syst-sci.net/9/77/2009/

J. A. Weinman et al.: Synthetic aperture radar for precipitation retrieval 79
Table 1. Characteristics of previous, existing, and planned X-band SARs.
Mission Polarization ScanSAR ScanSAR Orbit Incidence Missioncapability swath width resolution altitude angle range duration
(km) (m) (km) (o)
Shuttle V, V 15–60 20×30 225 20–55 2×10 daysSTS-59,68 1994
Cosmo HH, VV 200 30–100 620 25–57 5 yrsSky-Med selectable 7 Jun 2007(4 satellites) 9 Feb 2007
25 Oct 20082009
TerraSAR-X HH, HV 100 16 514 20–45 5 yrsVH, VV 15 Jun 2007
TecSAR HH, HV 20 550 4–8 yrsVH, VV 21 Jan 2008
Kompsat-5 HH, HV 100 20 685 5 yrsVH,VV 2009 start
CoRe-H2O VV, VH >100 25×9 30–40 5 yrsDual Frequency TBDWith 17.2 GHz
The NRCS,σSAR, consists of two parts: namely scatteringfrom the surface,σ srf, and scattering by the precipitation,σvol, such that:
σSAR = σsrf + σvol
whereσsrf (x) = σ 0(x)e
−2x∫
x−zt tanθ
k(x”) dx”sinθ
σvol(x) = sinθx+zt/ tanθ∫
x
η(x′)e
−2x′∫
x′−X(x′,θ)
k(x”) dx”sinθ
dx′
cosθ
The projection of the propagation vector onto the cross trackdirection is designatedx”, and the projection along the crosstrack direction of the vector defining the scattering volume isx′. It follows that
x′− x′′
= (z′′− z′) tanθ
z′= (x′
− x) tanθ.
and
X(x, θ) = x′+(x′
− x) tan2 θ − zt tanθ.
Attenuation takes place along the propagation path with acoefficient represented by,k=aRb (km−1). The volumetricscattering occurs within a slice of oblique thickness1r inthe direction perpendicular to the propagation path from theradar. The reflectivity within the volume element,η (km−1),in terms of wavelength,λ (cm), is
η = 10−5π5 |K|2
λ4Ze
and the attenuation corrected effective radar reflectivity fac-tor isZe=cRd .
Numerous types of hydrometeors, characterized by therainfall rate, R (mm/h), may occur within precipitatingclouds, and they contribute differently toη andk. Thusa,b, c, andd are constants that depend on the phase, density,and size distribution of the hydrometeors. They can initiallybe given a priori values, as is done for computations of con-ventional single frequency radar returns.
3 Model precipitation distributions
The model rainfall rate distributions,R(x, z), were repre-sented in the form,
R(x, z) = H(x)V (z)
as in Marzano et al. (2006), Weinman and Marzano (2008),and by Marzano and Weinman (2008).
The vertical distributions
V (z) =V (z0){(zt−z)/(zt−z0)}
0.25 for z0≤z≤zt
V (0){0.85+0.15[(z0−z)/z0]0.5
} for 0≤z≤z0
were representations extracted from Contoured Frequencyby Altitude Diagrams (CFAD) found by Yuter and Houze(1995). The snow cloud top heights werezt . The freez-ing level heights,z0, could be determined from surface tem-peratures by assuming that the lapse rate was 5.8 C/km orfrom temperature profiles obtained from nearby radiosondeascents.
www.nat-hazards-earth-syst-sci.net/9/77/2009/ Nat. Hazards Earth Syst. Sci., 9, 77–84, 2009

80 J. A. Weinman et al.: Synthetic aperture radar for precipitation retrieval
Fig. 3. Left: X-SAR image of an isolated convective cell over Amazonas, Brazil (9.01◦ S×68.38◦ W) obtained at 18:45 UTC on 15 April1994. The X-SAR viewed this scene from the left and the satellite passed from the top of the scene to the bottom. Center: The rainfall ratedistribution,R(x, z), along the transectA−A′ retrieved by the statistical algorithm, and right: that retrieved by the VIE solution.
The horizontal distributions,H(x), were the most vari-able, and they were derived from two distinct algorithms.
4 Precipitation retrieval algorithms over homogeneousland
Two separate retrieval algorithms were developed to inferR(x, z). One was statistical and the other was an analyticalsolution to the Volterra Integral Equation (VIE) of the secondkind.
Briefly summarized, the statistical algorithm described inMarzano and Weinman (2008) and Weinman and Marzano(2008) finds a crossing node,xo, where the NRCS makes atransition from enhancement due to scattering to reductiondue to attenuation. The algorithm then relates moments oftheH(x) to moments of the NRCS aboutxo. It also deter-mines NRCS gradients at several locations. Eleven parame-ters thus comprise components of a vector,xSAR. The shapeof H(x) is obtained by minimizing the quantity
d(cH ) = (xSAR − mSAR)∗C−1CSAR(xSAR − mSAR)
where the subscriptC identifies the cloud shape class, andm
is the vector of the mean parameters. The asterisk representsthe transpose of a vector, andCCSAR is the covariance matrixof the population of model clouds.
The VIE retrieval algorithm was first described in Pichuginand Spiridonov (1991). The NRCS equation presented at thebeginning of this paper was transformed, by a series of alge-braic manipulations, to a form:
P(x) = f (x) + λ
x∫x∗
K(x, t)P (t)dt
whereP(. . . ) is the transformed function ofH(x), andK(x,t),f(x) andλ are transformations of clusters of various param-
eters that appear in the NRCS formulation. The reader isreferred to Pichugin and Spiridonov (1991) and to Marzanoand Weinman (2008) for a comprehensive description of thismethod.
An X-band image of a convective cell in the Amazon isshown in Fig. 3 (left) along with the retrievedR(x, z) dis-tributions (center and right) obtained from the statistical andVIE retrieval algorithms respectively. Although no indepen-dent validation was available, the agreement between the tworesults is reasonably consistent.
5 Dual frequency precipitation retrieval over an inho-mogeneous sea surface
The determination of rainfall over a sea surface is more dif-ficult than over land because sea surface NRCS values arehighly variable, and that variability is related to the rainfallrate. The wind field that roughens the sea surface aroundprecipitating clouds, and the impinging raindrops that dampsurface waves complicate the sea surface structure. Exam-ples of sea surface roughness patterns around precipitationobserved by C-band SARs (C-SARs) are shown in Alpersand Melsheimer (2004).
Although the retrieval of marine rainfall from single fre-quency X-SAR radar cross sections is hobbled by this surfacecross section ambiguity, the problem becomes tractable whenC and X-band SARs observe the same scene. The model ofContreras and Plant (2006) was used to compute the rela-tionship between C and X-band values ofσ 0(x) for wind-roughened, and rain impacted sea surfaces. Those modelcomputations were run for VV and HH polarization, and forincidence angles of 30, 45 and 60 degrees. Various combina-tions of rainfall rates, 0, 5, 10, and 40 mm/h along with windspeeds values of 3, 4, 5, 10, 15, and 20 m/s at 10 m above the
Nat. Hazards Earth Syst. Sci., 9, 77–84, 2009 www.nat-hazards-earth-syst-sci.net/9/77/2009/

J. A. Weinman et al.: Synthetic aperture radar for precipitation retrieval 81 Weinman et al.
Fig.3
Fig.4
einman et al.
W
Fig. 4. Comparison between modelσ0C andσ0X at VV and HH polarization for wind roughened and rain impacted sea surfaces. Black(o), red (*) and blue () represent up-wind, cross-wind and down-wind computations respectively. The left and right columns present therelations among the VV and HH polarizedσ o respectively. The cross section model of Contreras and Plant (2006) was used to model variouscombinations ofR=0, 5, 10, and 40 mm/h andV10=3, 4, 5, 10, 15, and 20 m/s, Values forV10=25, 30, 35, 45 m/s for wind roughened surfaceswere interpolated from measured values by Fernandez et al. (2006).
sea surface were considered. The viewing directions could beup-wind, cross-wind and down-wind. In addition, sea surfacecross section measurements for wind-roughened sea surfacesfound by Fernandez et al. (2006) were interpolated to yield
comparable relationships for 25, 30, 35, 45 m/s, with no rain.These results are shown in Fig. 4. Linear fits to those crosssections, including the wind roughened sea surface measure-ments by Fernandez et al. (2006) can be fitted by:
www.nat-hazards-earth-syst-sci.net/9/77/2009/ Nat. Hazards Earth Syst. Sci., 9, 77–84, 2009

82 J. A. Weinman et al.: Synthetic aperture radar for precipitation retrieval
AA AA’’
Fig.5
einman et al.
W
Fig. 5. Upper left: An X-band image observed over the Gulf of Mexico, 17 April 1994 at 18:47 UTC during STS-59, first presented inMelsheimer et al. (1998) as part of their Fig. 3. Upper right: The X-band NRCS scan along the red transectA−A′ in Fig. 7a of theMelsheimer et al. (1998) paper (- - - -). The NRCS computed from the modelR(x, z) distribution found in our study was (——-). Theσ0(x) was obtained from the transformed C-band NRCS. Lower left: The model C-band DPPS for the sameR(x, z) compared to thatpresented in Fig. 7d of Melsheimer et al. (1998) (- - - -). TheKdp−R relationship was an extrapolation from Teschl et al. (2006) and privatecommunication. Lower right: TheR(x, z) distribution used in the model. Note that the width of this cell is∼3 km. This cell width isconsistent with the along-track dimension shown in the upper left. This cell would just fill one TRMM PR footprint.
σ 0X= fX−Cσ 0C
It is noteworthy that the model data from wind roughenedsurfaces only, and those from sea surfaces subjected to windroughening and rain impact damping follow common lineartrends within∼15%. Values forfX−C for VV polarization at30◦, 45◦, and 60◦ are 1.53, 1.47 and 1.16, respectively, andthose for HH polarization are 1.50, 1.88 and 1.42.
A sample of data presented in Fig. 7 of Melsheimer etal. (1998) was analyzed to demonstrate the use of dualfrequency data. It was noted from various model runsthat rainfall had a minor effect on C-band NRCS measure-ments. (∼0.3 dB) so thatσC
SAR(x)'σ 0C(x). The backgroundσ 0X(x) was thus derived from the application of the linearequation shown above to yieldσ 0C(x) presented in Fig. 7aof Melsheimer et al. (1998). The X-band NRCS measued
along A-A′, and that computed from a model with trans-formed sea surface NRCS values is shown in Fig. 5 (upperright). TheR(x, z) that produces this NRCS scan is shownin Fig. 5 (lower right).
6 The C-band differential polarized phase shift as aform of validation
Bringi and Chandrasekhar (2001) showed that the Differ-ential Polarized Phase Shift (DPPS) provides a measure ofrainfall rate along a propagation path. Although no measure-ments of the X-band DPPS were available, the C-band DPPS,shown in Fig. 5 (lower left), provides a check on the valid-ity of the rainfall rate distribution,R(x, z), derived from theX-band NRCS.
Nat. Hazards Earth Syst. Sci., 9, 77–84, 2009 www.nat-hazards-earth-syst-sci.net/9/77/2009/

J. A. Weinman et al.: Synthetic aperture radar for precipitation retrieval 83
The DPPS is determined by the integral of the specific dif-ferential phase,Kdp, along the two way propagation path,i.e.
DPPS=2
σSAR cosθ
z0∫
0
Kdp [x (z)] σsrf [x (z)] dz
+
z0∫0
Kdp [x (z)]σvol [x (z)] dz
wherezo is the height of the freezing layer. We used theC-bandKdp−R values for raindrops tabulated by Teschl etal. (2006). These were generalized to account for incidenceangles,θ , down to 30◦ to yield:
Kdp =0.168
λsin2 θR1.20 (◦/km)
Ryzhkov and Zrnic (1998) found thatKdp, for snow was∼0.03◦/km at S-band (∼10 cm wavelength). That value wasnearly independent of the melted rainfall rate. TheKdp, ofsnow is expected to be about twice that large at C-band.Marzano and Weinman (2008) computedKdp, for snow atC-band and those computations also yield small values. Be-cause of the irregular shape of snow, there was even someuncertainty about the sign ofKdp. In view of these consider-ations, we neglected the effect of snow on the C-band DPPS.
7 Comparison of rainfall distributions over land ob-served from ground based radar and X-SAR
This discussion has been based on data available from the1994 Shuttle missions. However new opportunities to mea-sure X-band NRCS are rapidly becoming available. Figure 6(upper) displays a TerraSAR-X image of the region aroundOrleans, France obtained on 16 March 2008 in which thepresence of rain is identified within the red ellipse. The PlanPosition Indicator (PPI) display recorded at a height of 2 kmby the Trappes operational radar (lower) confirms the pres-ence of rain in the scene. (The Loire River provides a refer-ence in both images.) A 12:00 UTC sounding from Trappes,France suggested that the freezing level was at 1.6 km so thatthe PPI probably responded to scattering by frozen hydrom-eteors. Digital data files for this case were not available asthis document was being written, so a quantitative evaluationof the rainfall retrieval could not be conducted.
8 Preliminary conclusion and discussion
This study employed rainfall retrieval algorithms based onstatistical and analytical VIE methods to infer the rainfall dis-tribution over the uniform land surface of the Amazon Basin.Although the techniques are quite distinct, they gave distri-butions that were in reasonable agreement. It should however
Fig. 6
Weinman et al.
OOrrlleeaannss
LAME D EAU PANTHERE (mode operationnel): Trappes: :2008/03/16/1740
Fig. 6. Upper: A TerraSAR-X image obtained at 17:42 UTC overOrleans, France on 16 March 2008. The region enclosed by the redellipse contains precipitation. Lower: Plan Position Position Indi-cator (PPI) output at 2 km elevation from the Trappes operationalradar at 17:40 UTC. Units are mm/5 min.
be stressed that we had no independent verification of the va-lidity of those retrieved distributions.
In spite of the variability of the NRCS of sea surfacesin the proximity of rainfall, we were able to take advan-tage of the insensitivity of the C-band NRCS to atmosphericrain to infer the C-band NRCS of the surface. That C-bandNRCS could be transformed to X-band sea surface NRCSsthat were needed as boundary conditions to compute the X-band NRCS.
A combined C and X-band retrieval from two SARs car-ried on satellites in a common polar orbital plane may yieldadditional information regarding precipitation distributions.One such pair of SARs might be the TerraSAR-X and theRadarSAT-2.
Although we had no independent rainfall measurementswith which to validate our retrieved maritime rainfall ratedistribution, we had measurements of the C-band DPPS. Themeasured and modeled DPPS were reasonably consistent.However several simplifying assumptions about theKdp, ofthe various species of hydrometeors were made. More com-prehensive polarization measurements would lend additional
www.nat-hazards-earth-syst-sci.net/9/77/2009/ Nat. Hazards Earth Syst. Sci., 9, 77–84, 2009

84 J. A. Weinman et al.: Synthetic aperture radar for precipitation retrieval
credence to the retrieved results, Bringi and Chandrsekar(2001). Once sufficient confidence in the retrievals has beengenerated, the DPPS and the NRCS could both be incorpo-rated into a future retrieval algorithm. The DPPS could thenserve as a constraint on the size distribution used to computetheη andk in the X-band NRCS computation.
Acknowledgements.We would like to thank Saverio Mori,Roberto Cantelmi and Gabriele Poccia, (UniRoma) for their pro-gramming assistance. We also thank Ziad Haddad, Eastwood Im,Bruce Chapman, Steve Durden (NASA-JPL, Cal Tech.), andSusanne Lehner, (DLR, Germany) for their valuable advice. We arealso grateful for the data that were provided by Andreas Roesler ofInfoTerra and Pierre Tabary of the French Meteorological Office.The graphic support of Beth Tully is also gratefully acknowledged.
Edited by: F. GuzzettiReviewed by: E. A. Smith and another anonymous referee
References
Alpers, W. and Melsheimer, C.: Rainfall, Synthetic Aperture RadarMarine Users, Manual, US Dept. of Commerce, NOAA, 355–371, 2004.
Atlas, D. and Moore, R. K.: The measurement of precipitation withsynthetic aperture radar, J. Atmos. Ocean Technol., 4, 368–376,1987.
Bennartz, R. and Petty, G. W.: The sensitivity of microwave remotesensing observations of precipitation to ice particle size distribu-tions, J. Appl. Meteor., 40, 345–364, 2001.
Bringi, V. N. and Chandrsekar, V.: Polarimetric Doppler WeatherRadar, Cambridge University Press, pp. 636, 2001.
Buckreuss, S., Balzer, W., Muhlbauer, P., Werninghaus, R., andPitz, W.: The TerraSAR-X satellite project, Proc. Intern. Geosci.Remote Sensing Symp. (IGARSS03), 3096–3098, 2003.
Caltagirone, F., Angino, G., Impagnatiello, F., Capuzi, A., Fagi-oli, S., and Leonardi, R.: COSMO-SkyMed: An advanced dualsystem for Earth observation, Proc. Intern. Geoscience RemoteSensing Symp. (IGARSS07), Barcelona (E), 23–27 July 2007.
Chen, S. S., Price, J. F., Zhao, W., Donelan, M. A., and Walsh, E. J.:The CBLAST-Hurricane Program and the next generation fullycoupled atmosphere-wave-ocean models for hurricane researchand prediction, B. Am. Meteorol. Soc., 88, 311–317, 2007.
Contreras, R. F. and Plant, W. J.: Surface effect of rain on mi-crowave backscatter from the ocean: Measurement and model-ing, J. Geophys. Res., 111, C08019, doi:10.1029/2005JC003356,2006.
Durden, S. L., Haddad, Z. S., Kitiyakara, A., and Li, F. K.: Ef-fects of non-uniform beam filling on rainfall retrieval for theTRMM Precipitation Radar, J. Ocean Atmos. Technol., 15, 635–646, 1998.
Fernandez, D. E., Carswell, J. R., Frasier, S., Chang, P. S., Clark,P. G., and Marks, F. D.: Dual-polarized C- and Ku-band oceanbackscatter response to hurricane-force winds, J. Geophys. Res.,111, C08013, doi:10.1029/2005JC003048, 2006.
Jameson, A. R., Li, F., Durden, S. L., Haddad, Z. S., Holt, B., Fog-ary, T., Im, E., and Moore, R. K.: SIR-C/X-SAR Observations ofrainstorms, Rem. Sens. Environ, 59, 267–279, 1997.
Jordan, R. L., Huneycutt, B. L., and Werner, M.: The SIR-C/X SARsynthetic aperture radar system, IEEE Trans. Geosci. Rem. Sens.,33, 829–839, 1995.
Kummerow, C., Ong, Y., Olson, W. S., Yang, S., Adler, R. F., Mc-Collum, J., Ferraro, R., Petty, G., Sun, D. B., Wilheit, T. T.: Thestatus of the Tropical Rainfall Measuring Mission (TRMM) aftertwo years in orbit, J. Appl. Meteor., 39, 1965–1982, 2000.
Marzano, F. S., Weinman, J. A., Mugnai, A., and Pierdicca, N.:Rain retrieval over land from X-band spaceborne synthetic aper-ture radar: a model study, Presentation at the Fourth EuropeanConference on Radar Meteorology and Hydrology, ERAD06,Barcelona, 18–21 September 2006.
Marzano, F. S., Scaranari, D., and Vulpiani, G.: Supervisedfuzzy logic classification of hydrometeors using C-band weatherradars, IEEE Trans. Geosci. and Remote Sens., 45, 3784–3799,2007.
Marzano, F. S. and Weinman, J. A.: Inversion of space-borne X-band synthetic aperture radar measurements for precipitation re-mote sensing over land, IEEE Trans. Geosci. and Remote Sens.,46, 3472–3487, 2008.
Melsheimer, C., Gade, M., and Alpers, W.: Investigation of multi-frequency/multipolarization radar signatures of rain cells derivedfrom SIR-C/X-SAR data, J. Geophys. Res., 103, 18 867–18 884,1998.
Moore, R. K., Mogili, A., Fang, Y., Beh, B., and Ahamad, A.: Rainmeasurement with SIR-C/X-SAR, Rem. Sens. Environ., 59, 280–293, 1997.
Ohfuchi, W., Sasaki, H., Masumoto, Y., and Nakamura, H.: “Vir-tual” atmospheric and oceanic circulation in the Earth Simulator,B. Am. Meteorol. Soc., 88, 861–866, 2007.
Pichugin, A. P. and Spiridonov, Yu. G.: Spatial distributions of rain-fall intensity recovery from space radar images, Sov. J. Rem.Sens., 8, 917–932, 1991.
Randall, D.: Towards global cloud resolving models – Modeling inthe age of GPM, 6 GPM International Planning Workshop, 6–8November, Annapolis, MD, 2006.
Rott, H., Cline, D., Nagler, T., Pulliainen, J., Rebhan, H., and Yueh,S.: CoRe-H2O- A dual-frequency SAR mission for hydrologi-cal and climate research, International Geosci. Remote SensingSymposium (IGARSS’07), Barcelona, Spain, 23–27 July 2007.
Ryzhkov, A. V. and Zrnic, D. S.: Discrimination between rain andsnow with a polarization radar, J. Appl. Meteor., 37, 1228–1240,1998.
Sharay, Y. and Naftaly, U.: TecSAR: design considerations and pro-gramme status, IEE Proceedings- Radar, Sonar and Navigation,ISSN: 1350-2395, 153(2), 117–121, 2006.
Teschl, F., Randeu, W. L., Schonhuber, M., and Teschl, R.: Sim-ulation of the specific differential phase (KDP) from 2D-Video-Distrometer measurements at S- and C-band wavelengths, Pa-per 61P1.16, ERAD2006 Conference, Barcelona, 9/18–22 Spain,and private communication, 2006.
Weinman, J. A. and Marzano, F. S.: An exploratory study to de-rive precipitation over land from X-band synthetic aperture radarmeasurements, J. Appl. Met., 47, 562–575, 2008.
Yuter, S. E. and Houze, R. A.: Three-dimensional kinematic andmicrophysical evolution of Florida cumulonimbus. Part II: Fre-quency distributions of vertical velocity, reflectivity, and differ-ential reflectivity, Mon. Weather Rev., 123, 1941–1963, 1995.
Nat. Hazards Earth Syst. Sci., 9, 77–84, 2009 www.nat-hazards-earth-syst-sci.net/9/77/2009/