raising achievement and reducing gaps
TRANSCRIPT

RAISING ACHIEVEMENT AND REDUCING GAPS:Reporting Progress Toward Goals for Academic
Achievement
By Paul E. Barton
March 2001
A REPORT TO THE NATIONAL EDUCATION GOALS PANEL

NATIONAL EDUCATION GOALS PANEL
GOVERNORS
Frank O’Bannon, Indiana (D), Chair 2001
Jim Geringer, Wyoming (R), Chair-elect 2002
John Engler, Michigan (R)
Jim Hodges, South Carolina (D)
Frank Keating, Oklahoma (R)
Paul E. Patton, Kentucky (D)
Jeanne Shaheen, New Hampshire (D)
Tom Vilsack, Iowa (D)
MEMBERS OF THE ADMINISTRATION
Vacant
Vacant
MEMBERS OF CONGRESS
U.S. Senator Jeff Bingaman, New Mexico (D)
U.S. Senator Jim Jeffords, Vermont (R)
U.S. Representative George Miller, California (D)
Vacant
STATE LEGISLATORS
Representative G. Spencer Coggs, Wisconsin (D)
Representative Mary Lou Cowlishaw, Illinois (R)
Representative Douglas R. Jones, Idaho (R)
Senator Stephen M. Stoll, Missouri (D)

RAISING ACHIEVEMENT AND REDUCING GAPS:Reporting Progress Toward Goals for Academic
Achievement
By Paul E. Barton
March 2001
A REPORT TO THE NATIONAL EDUCATION GOALS PANEL

About the Author
Paul E. Barton prepared this report for the National Education Goals Panel. Mr. Barton is aformer Director of the Policy Information Center at Educational Testing Service. At ETS healso has served as Associate Director of the National Assessment of Educational Progress.Barton has been President of the National Institute for Work and Learning, a member of theSecretary of Labor's Policy Planning Staff, and a staff member of the Office of Managementand Budget in the Executive Office of the President.
from THE NATIONAL EDUCATION GOALS
GOAL 3: STUDENT ACHIEVEMENT
“…all students will leave grades 4, 8 and 12, having demonstratedcompetency in challenging subject matter…”
Objective 1: “The academic performance of all students at theelementary and secondary levels will increase significantly in everyquartile, and the distribution of minority students in each quartile willmore closely reflect the student population as a whole.”
Executive Summary
Raising Achievement and Reducing Gaps:Reporting Progress Toward Goals for Achievement
by Paul E. Barton
Paul Barton provides a new analysis of student achievement scores for states onthe National Assessment of Educational Progress, NAEP. Only in mathematics (grades4 and 8) and reading (grade 4 only) are state trend data currently available, although newstate data in science and mathematics are scheduled to be released later in 2001. Bartonhas analyzed state NAEP data to identify state trends in performance of students in thetop and bottom quartiles of performance, as well as changes in the student achievementgap between whites and minority (black and Hispanic) and top and bottom quartiles.
The results show that:
• States are generally making more progress in mathematics achievement thanin reading. Between 1990 and 1996, the average student achievement scoresimproved significantly in 28 (out of 32) states in 8th grade mathematics, and nonedeclined. In 4th grade reading from 1992 to 1998, only 7 (out of 36) statesimproved and 3 states declined.
• Good readers are getting better at the same time weak readers are losingground. In half the states (18 out of 36), the performance of students in thebottom quartile in 4th grade reading declined, and performance improved in only 3states. In contrast, the performance of students in the top quartile improved in 12states and declined in none.
• During the 1990’s fourth grade students made more improvement inmathematics achievement than in reading in most states. In mathematics, 15states raised their average 4th grade NAEP score significantly; 20 states improvedscores of students in the bottom quartile; and 16 states improved scores ofstudents in the top quartile. Four or fewer states lost ground in 4th grademathematics across these three dimensions. In reading, 7 states improved 4th
graders average score; 3 improved performance of the bottom quartile; and 12improved performance of the top quartile; while average scores declined in 3states, 18 states lost ground with students in the bottom quartile, and none lostground among the top quartile.
• States have not generally reduced the achievement gap between top andbottom quartiles or between white and minority students. In 4th grade readingonly 1 state reduced the achievement gap between the top and bottom quartiles orbetween white and minority students. In mathematics, 8 states reduced the gapbetween the top and bottom quartiles at 4th grade and 5 did so at 8th grade. Only 2states reduced the gap between white and minority students in 4th grademathematics, and none did so in 8th grade mathematics.
Acknowledgements
This report is based entirely on the data collected by the National Assessment ofEducational Progress (NAEP). The data used in the report were provided for theNational Education Goals Panel through an arrangement between the National Center forEducational Statistics and the Education Testing Service (ETS). ETS made alltabulations. I thank David Freund and Laura Jerry for them.
The manuscript was reviewed by Richard Coley and John Mazzeo at ETS. Thewriting of the report, commissioned by the National Education Goals Panel, was entirelymy responsibility.
TABLE OF CONTENTS
Goals Panel Policy Highlights and Overview......................................................1
Author’s Data Highlights.....................................................................................10
Introduction..........................................................................................................13
State Trends in the Level of Student Achievement..............................................15
Mathematics, 4th Grade ............................................................................16
Mathematics, 8th Grade ............................................................................18
Reading, 4th Grade....................................................................................20
State Trends in Closing Achievement Gaps.........................................................22
Changes in the Gaps between Top and Bottom Quartiles........................22
Changes in Gaps between White and Minority Scores............................28
In Conclusion.......................................................................................................34
Appendix Tables ..................................................................................................35

1
Goals Panel Policy Highlights and Overview
Since President Bush and the nation’s Governors set Education Goals for thenation in 1990, education reform efforts have focused on raising expectations for schooland student performance. States have developed academic standards that publicly definewhat they want students to know and be able to do. States are increasingly aligning theirtests to their standards in order to determine the extent to which standards are being met.More and more states are developing accountability systems that link consequences forstudents and schools to their success in meeting the standards.
While the clear purpose is to improve student learning, the policy focus is oftenupon the results of student assessments linked to state standards. Nearly every state hasor is developing tests linked to their standards and accountability systems. Statesadminister tests in core subject areas to students in selected grades. The results of theseassessments are used to gauge performance and improvements of the educational system.In many cases, test results are linked to rewards and sanctions defined in accountabilitysystems. Test results are generally reported to the public.
Efforts to meet standards create demands for information about results.Policymakers and administrators need information on the performance of systems andspecific subgroups, particularly those who historically have not fared well in school.Administrators and teachers need information on the performance of individual studentsin order to identify needs and target responses. Both policymakers and educators needinformation on the “how” and “why” of success — which policies and practices arecontributing to desired improvements. All of these groups look to well-designedassessments to provide important data both about educational performance within theirstates and about how one state’s performance compares to that of others.
National Assessment of Educational Progress
The National Assessment of Educational Progress (NAEP) was established in1969 to provide national data on educational performance in core academic subjects. In1990 Congress authorized the administration of NAEP at the state level on a voluntarybasis. For the first time, NAEP could provide states information on how they performedcompared both to the nation and to other states. State NAEP now tests mathematics andscience, alternating with reading and writing at grades 4 and 8, on a four-year alternatingcycle. It is the only national source of comparable state-by-state data on studentacademic achievement. On average, 40 to 44 states participate in any state NAEP testingcycle. It is currently the best source of data for states seeking to compare theperformance of their students to those in other states on a technically sound basis.
Recently there have been calls to increase the frequency of state NAEP.President Bush has proposed an education initiative to “Leave No Child Behind,” bycalling on states to show improvement over time in student achievement on state tests.The Administration is exploring ways that NAEP can be used to confirm trends shown bystate tests of student achievement. The President has proposed that annual state NAEP
2
assessments be administered in mathematics and reading, disaggregated by race andwealth.
In the spring of 2000, the National Education Goals Panel convened and chargedits own advisors to recommend what new data were needed for the Panel and the nationto measure the progress of education reform efforts. The task force recommended thatNAEP collect and report new state data annually, on a schedule that would provide statedata in reading, mathematics, science, and writing.
Digging Deeper into the Data
The overriding concern of the Goals Panel is to encourage and monitorimprovements in student learning. Recognizing that test scores are our best current proxyfor that learning, what can state policymakers learn from NAEP, particularly if it isavailable on a more frequent basis?
The National Education Goals call for “all students [to] demonstrate competencyin challenging subject matter….” and for American students to become “first in the worldin mathematics and science achievement.” Upon the recommendations of technicalexperts, the Panel has agreed that “competency” sufficient to meet the Education Goals isbest reflected in attaining at least the proficient level on NAEP. Therefore, the Panelfocuses attention upon the percentage of students in a state at or above the NAEPproficient level and whether there has been a statistically significant change in thatperformance over time.
But NAEP data can provide additional insights when policymakers dig deeperinto the data. Recognizing this, the Goals Panel commissioned Paul Barton to take a newlook at state performance on NAEP. The Panel asked him to examine whether studentachievement scores improved across the board in every quartile as well as at theproficient level. This paper is the result of his inquiry.
Methods and Findings
The premise of this paper is that Americans want two results from educationreform: improvement in student achievement and a narrowing of the gap between highand low-performers. If student achievement improved, scores on NAEP would improvefor each state, including the states’ average student score, scores for both the top andbottom quartile, and the percentage of students scoring at the proficient level. If theachievement gap narrowed, the gap between the top and bottom quartiles and the gapbetween students who are white and minority (black and Hispanic combined) wouldnarrow. Paul Barton undertook this special study to determine those six dimensions ofstudent performance for every state that had participated in NAEP two times, allowingidentification of changes in the state’s performance over time.
This paper presents the results of his study. The only subjects tested twice at thestate level since 1990 were mathematics (grades 4 and 8) and reading (grade 4 only).
3
Usually, the results were mixed. While Connecticut, Hawaii, Iowa, and West Virginiaimproved on five of six dimensions in 8th grade math, most states did not.
Overall, states improved noticeably more in mathematics than in reading. In 8th
grade mathematics, both the nation and 28 (out of 32) states improved significantly.Between 1990 and 1996, no state declined in average 8th grade mathematics performance.Neither did the performance of the top or bottom quartile or the percentage of studentsscoring proficient. Twenty-four (24) states improved the performance of the bottomquartile of their students significantly; 30 did so for the top quartile; 26 improved thepercentage scoring proficient; none declined. At the 4th grade level, similar but lessdramatic improvements occurred.
Unfortunately, the achievement gaps between whites and minorities and the topand bottom quartile generally did not decline. While the gap in performance betweenwhite and minority students increased for two states for 8th grade mathematics in anystate, it narrowed in none.
In contrast, Barton’s quartile analysis of 4th grade reading shows that good readerswere improving while weak readers were getting worse. In half of all states (18 out of36), the performance of students in the bottom quartile in 4th grade reading declined from1992 to 1998. The scores of good readers went up in 12 states and went down in none.Although in many states there was no significant change in reading scores, in Arizona,Florida, Louisiana, and Minnesota, the performance of students in the bottom quartiledeclined during the same period that the performance of those in the top quartileimproved. Likewise, the gap in performance between the top and bottom quartilesincreased in 16 states.
State policymakers need these data to inform state education policy. Why areachievement gaps widening between white and minority 4th graders in reading but notmathematics? What can be done about it? The National Education Goals Panel feels thata quartile analysis can help each state determine trends in their average state score thatmight not have been evident otherwise. States should know not only the percentage ofstudents scoring proficient, but the performance of their top and bottom quartiles andchanges in the gaps between groups. Why are students in the bottom quartile ofperformance improving in 8th grade mathematics in 24 of 32 states (and declining innone), whereas students in the bottom quartile of performance in 4th grade readingdeclined in 18 (of 36) states and improved in only 3? What can be learned fromDelaware and North Carolina, where NAEP shows a narrowing of achievement gaps inreading that have eluded others? Policymakers need this kind of information and thequestions they suggest.
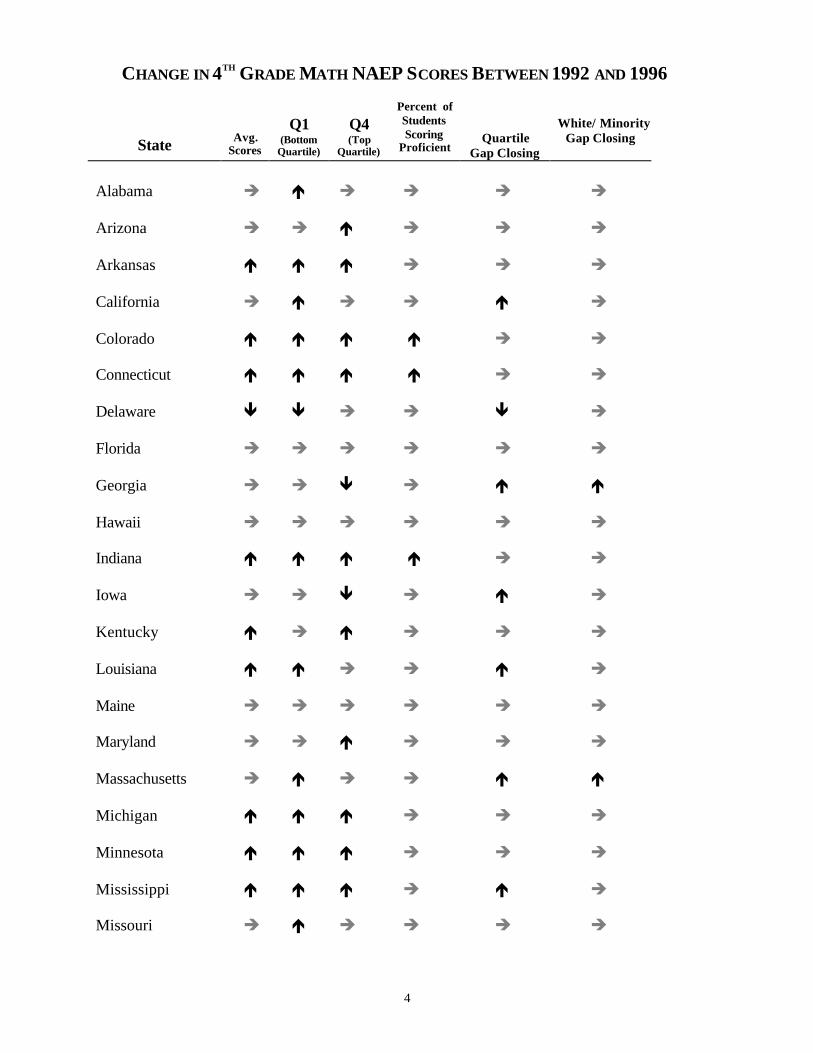
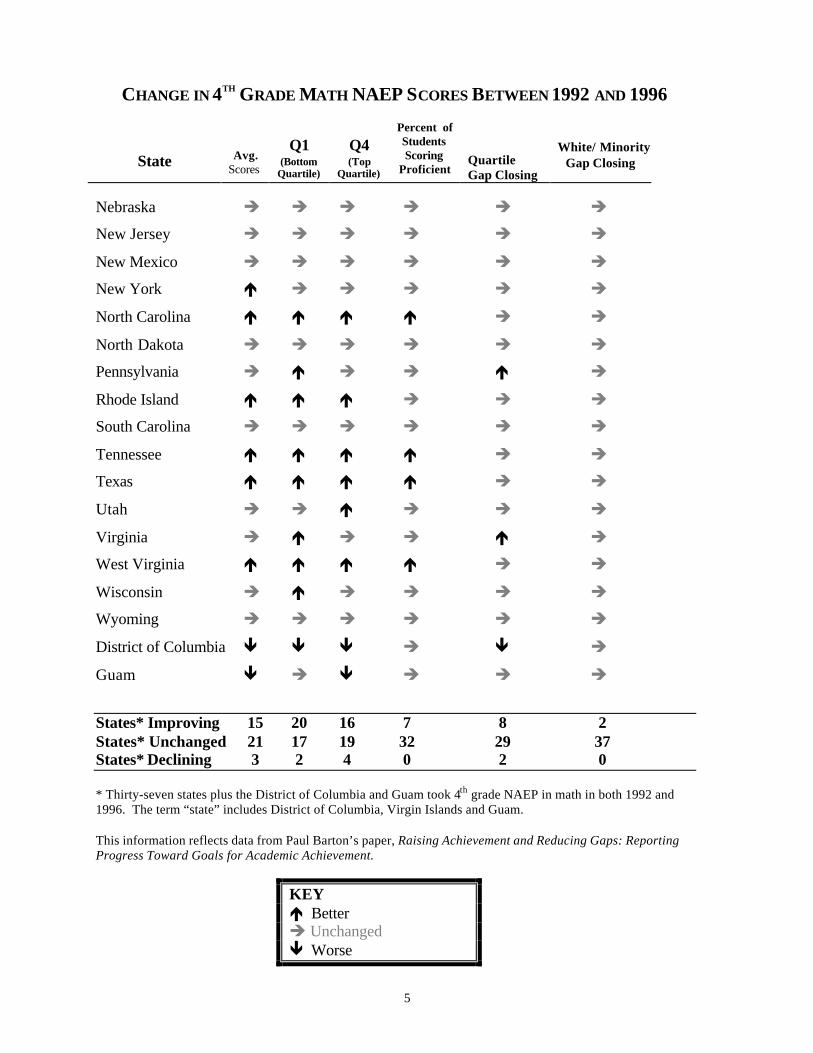
The next six pages summarize data on student performance and changes in the studentachievement gap for every state that participated in NAEP.
4
CHANGE IN 4TH GRADE MATH NAEP SCORES BETWEEN 1992 AND 1996
State Avg.Scores
Q1(Bottom
Quartile)
Q4(Top
Quartile)
Percent ofStudentsScoring
ProficientQuartile
Gap Closing
White/ MinorityGap Closing
Alabama è é è è è è
Arizona è è é è è è
Arkansas é é é è è è
California è é è è é è
Colorado é é é é è è
Connecticut é é é é è è
Delaware ê ê è è ê è
Florida è è è è è è
Georgia è è ê è é é
Hawaii è è è è è è
Indiana é é é é è è
Iowa è è ê è é è
Kentucky é è é è è è
Louisiana é é è è é è
Maine è è è è è è
Maryland è è é è è è
Massachusetts è é è è é é
Michigan é é é è è è
Minnesota é é é è è è
Mississippi é é é è é è
Missouri è é è è è è
5
CHANGE IN 4TH GRADE MATH NAEP SCORES BETWEEN 1992 AND 1996
State Avg.Scores
Q1(Bottom
Quartile)
Q4(Top
Quartile)
Percent ofStudentsScoring
ProficientQuartileGap Closing
White/ MinorityGap Closing
Nebraska è è è è è è
New Jersey è è è è è è
New Mexico è è è è è è
New York é è è è è è
North Carolina é é é é è è
North Dakota è è è è è è
Pennsylvania è é è è é è
Rhode Island é é é è è è
South Carolina è è è è è è
Tennessee é é é é è è
Texas é é é é è è
Utah è è é è è è
Virginia è é è è é è
West Virginia é é é é è è
Wisconsin è é è è è è
Wyoming è è è è è è
District of Columbia ê ê ê è ê è
Guam ê è ê è è è
States* Improving 15 20 16 7 8 2States* Unchanged 21 17 19 32 29 37States* Declining 3 2 4 0 2 0
* Thirty-seven states plus the District of Columbia and Guam took 4th grade NAEP in math in both 1992 and1996. The term “state” includes District of Columbia, Virgin Islands and Guam.
This information reflects data from Paul Barton’s paper, Raising Achievement and Reducing Gaps: ReportingProgress Toward Goals for Academic Achievement.
KEYé Betterè Unchangedê Worse
6
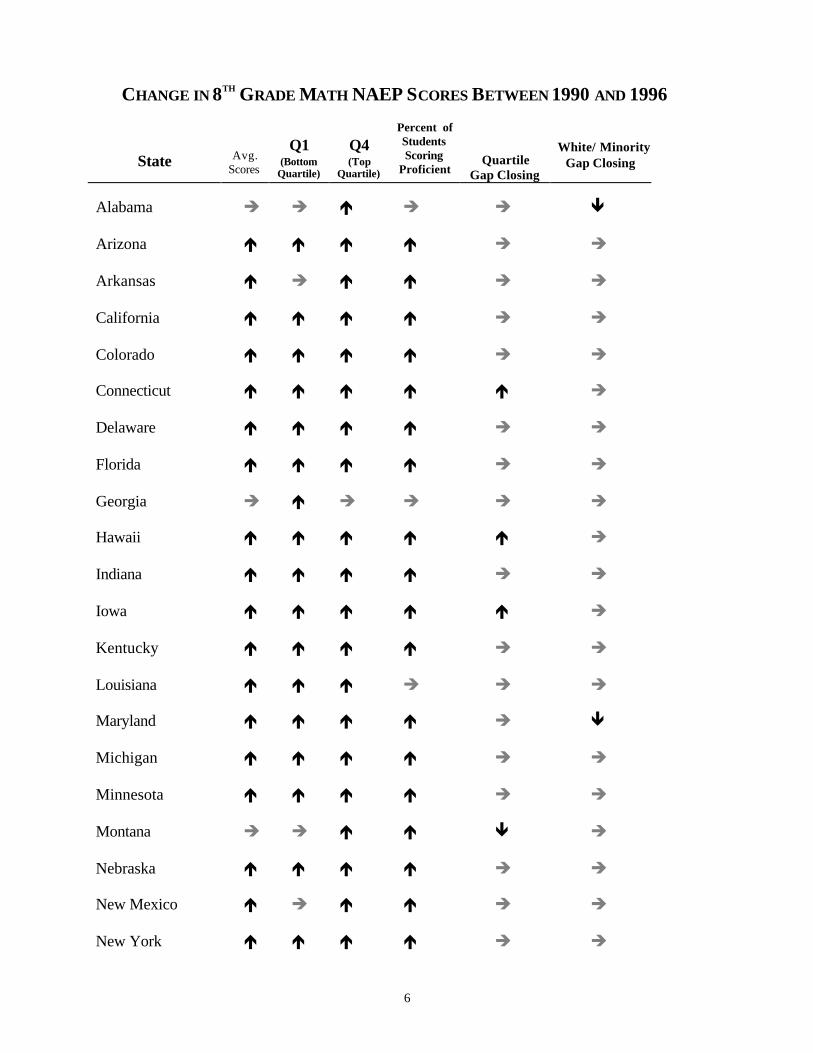
CHANGE IN 8TH GRADE MATH NAEP SCORES BETWEEN 1990 AND 1996
State Avg.Scores
Q1(Bottom
Quartile)
Q4(Top
Quartile)
Percent ofStudentsScoring
ProficientQuartile
Gap Closing
White/ MinorityGap Closing
Alabama è è é è è ê
Arizona é é é é è è
Arkansas é è é é è è
California é é é é è è
Colorado é é é é è è
Connecticut é é é é é è
Delaware é é é é è è
Florida é é é é è è
Georgia è é è è è è
Hawaii é é é é é è
Indiana é é é é è è
Iowa é é é é é è
Kentucky é é é é è è
Louisiana é é é è è è
Maryland é é é é è ê
Michigan é é é é è è
Minnesota é é é é è è
Montana è è é é ê è
Nebraska é é é é è è
New Mexico é è é é è è
New York é é é é è è
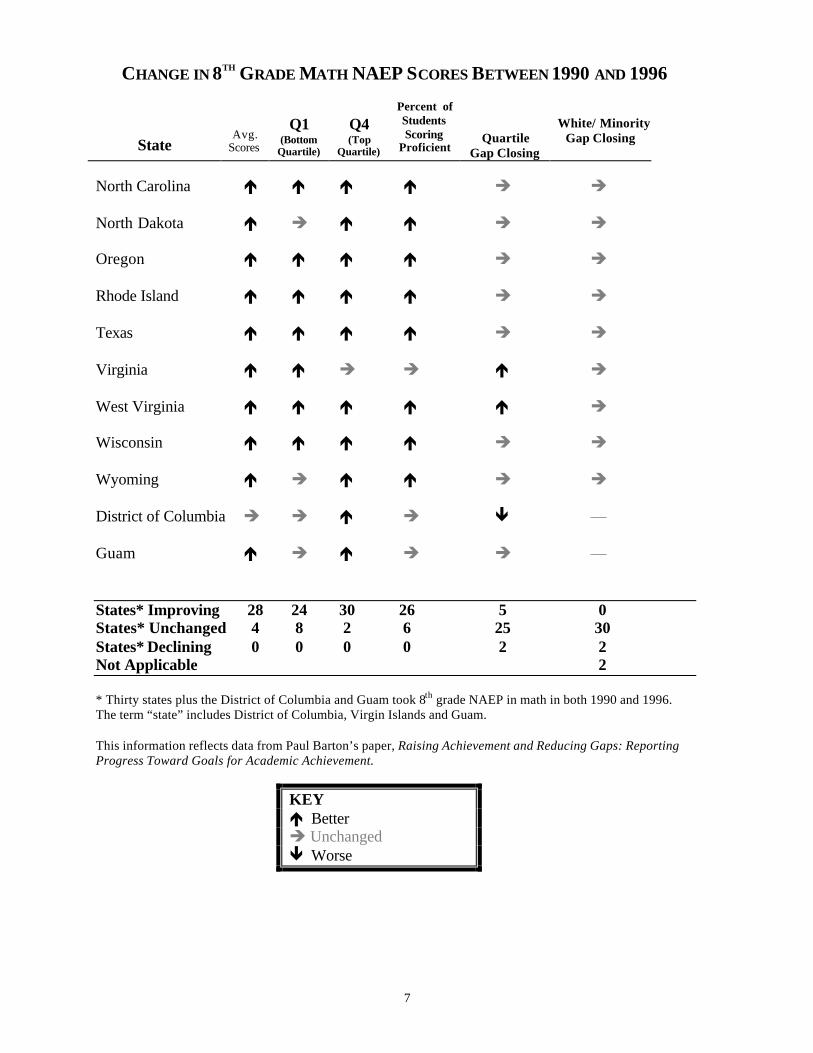
7
CHANGE IN 8TH GRADE MATH NAEP SCORES BETWEEN 1990 AND 1996
StateAvg.
Scores
Q1(Bottom
Quartile)
Q4(Top
Quartile)
Percent ofStudentsScoring
ProficientQuartile
Gap Closing
White/ MinorityGap Closing
North Carolina é é é é è è
North Dakota é è é é è è
Oregon é é é é è è
Rhode Island é é é é è è
Texas é é é é è è
Virginia é é è è é è
West Virginia é é é é é è
Wisconsin é é é é è è
Wyoming é è é é è è
District of Columbia è è é è ê —
Guam é è é è è —
States* Improving 28 24 30 26 5 0States* Unchanged 4 8 2 6 25 30States* Declining 0 0 0 0 2 2Not Applicable 2
* Thirty states plus the District of Columbia and Guam took 8th grade NAEP in math in both 1990 and 1996.The term “state” includes District of Columbia, Virgin Islands and Guam.
This information reflects data from Paul Barton’s paper, Raising Achievement and Reducing Gaps: ReportingProgress Toward Goals for Academic Achievement.
KEYé Betterè Unchangedê Worse
8
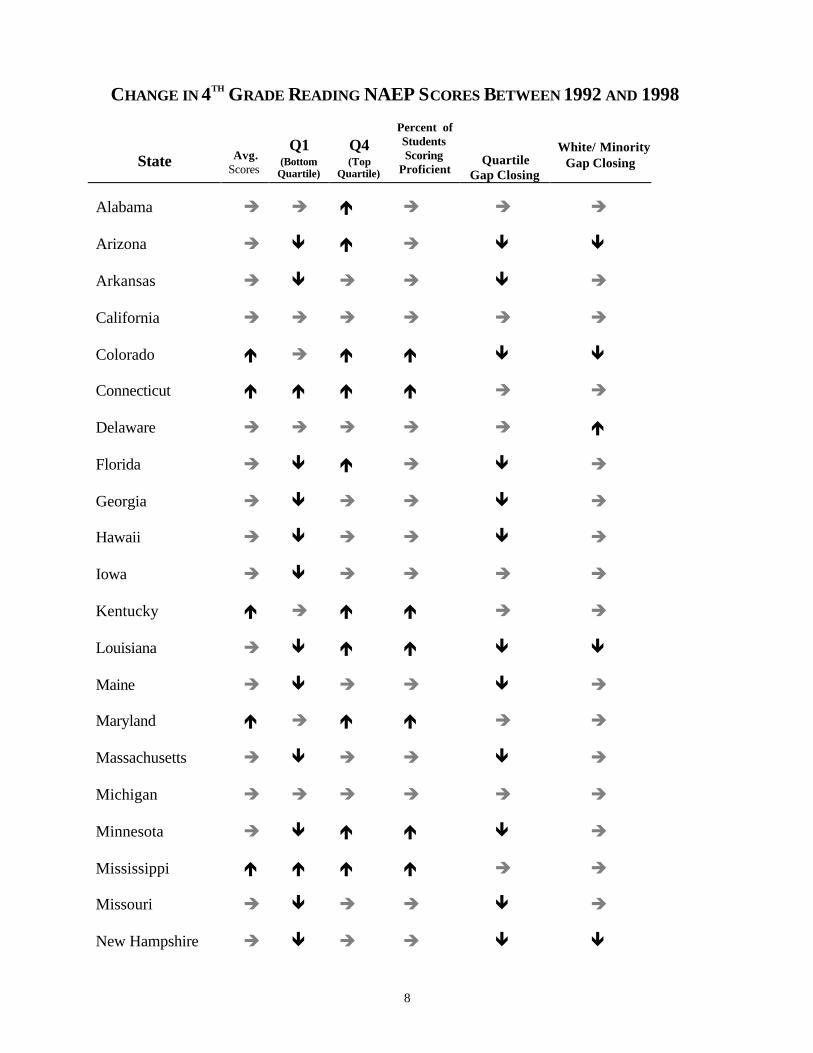
CHANGE IN 4TH GRADE READING NAEP SCORES BETWEEN 1992 AND 1998
State Avg.Scores
Q1(Bottom
Quartile)
Q4(Top
Quartile)
Percent ofStudentsScoring
ProficientQuartile
Gap Closing
White/ MinorityGap Closing
Alabama è è é è è è
Arizona è ê é è ê ê
Arkansas è ê è è ê è
California è è è è è è
Colorado é è é é ê ê
Connecticut é é é é è è
Delaware è è è è è é
Florida è ê é è ê è
Georgia è ê è è ê è
Hawaii è ê è è ê è
Iowa è ê è è è è
Kentucky é è é é è è
Louisiana è ê é é ê ê
Maine è ê è è ê è
Maryland é è é é è è
Massachusetts è ê è è ê è
Michigan è è è è è è
Minnesota è ê é é ê è
Mississippi é é é é è è
Missouri è ê è è ê è
New Hampshire è ê è è ê ê

9
CHANGE IN 4TH GRADE READING NAEP SCORES BETWEEN 1992 AND 1998
StateAvg.
Scores
Q1(Bottom
Quartile)
Q4(Top
Quartile)
Percent ofStudentsScoring
ProficientQuartile
Gap Closing
White/ MinorityGap Closing
New Mexico è ê è è ê è
New York è è è è è è
North Carolina é é è è é è
Oklahoma è è è è ê è
Rhode Island è è è è è è
South Carolina è è è è è è
Tennessee è ê è è ê è
Texas è è é è è è
Utah ê ê è è ê ê
Virginia è ê è è è è
West Virginia è è è è è è
Wisconsin è è è è è ê
Wyoming ê ê è è è è
District of Columbia ê ê è è è è
Virgin Islands é è é é è —
States* Improving 7 3 12 8 1 1States* Unchanged 26 15 24 28 19 28States* Declining 3 18 0 0 16 6Not Applicable 1
* Thirty-four states plus the District of Columbia and the Virgin Islands took 4th grade NAEP in reading in both1992 and 1998. The term “state” includes District of Columbia, Virgin Islands and Guam.
This information reflects data from Paul Barton’s paper, Raising Achievement and Reducing Gaps: ReportingProgress Toward Goals for Academic Achievement.
KEYé Betterè Unchangedê Worse
10
AUTHOR'S DATA HIGHLIGHTS
This report examines student achievement for the states. It looks at the NationalAssessment of Educational Progress (NAEP) assessment nearest 1990, and the last oneconducted.
The view of achievement is from the perspective of the National Goals, set byPresident Bush and the nation’s governors following their Education Summit in 1989 inCharlottesville, Virginia. The objective for student achievement was that “The academicperformance of all students at the elementary and secondary level will increasesignificantly in each quartile, and the distribution of minority students in each quartilewill more closely reflect the student population as a whole.” This report wascommissioned by the National Education Goals Panel. Arrangements were made by theNational Center for Education Statistics to have special tabulations made of data from theNational Assessment of Educational Progress. These were conducted by EducationalTesting Service for the Goals Panel. The use of these data is entirely the responsibilityof the author.
STATE TRENDS
Achievement (average for all students, and in the top and bottom quartiles)
• In 4th grade mathematics, from 1992 to 1996, there were 7 states where thepercent at or above the proficient level increased (the proficient level asdefined by NAEP was set as the standard for the yearly reports of theNational Education Goals Panel).
The average score increased in 15 states.
The average score for the bottom quartile increased in 20 states and declinedin 2.
Scores in 16 states rose in the top quartile and declined in 4.
In 5 states, scores increased for all students and in the top and bottomquartiles, but did not improve in terms of the percent reaching the proficientstandard.
• In 8th grade mathematics, from 1990 to 1996, there was widespreadimprovement, with the percent reaching the proficient level increasing in 26states, improvement in average scores in 28 states, in the bottom quartile in24, and in the top quartile for 30.
11
Louisiana improved in the average, and in the top and bottom quartiles, butnot at the proficient level.
• In 4th grade reading, from 1992 to 1998, 8 states improved in the percentreaching the proficient level.
The average score increased in 7 states and declined in 3.
In the bottom quartile, 18 states had declining scores and 3 improved.
Twelve states improved in the top quartile.
Two states with increases in the percent reaching the proficient level haddeclines in the bottom quartile.
The Gap Between White and Minority Scores
• In 4th grade mathematics, the gap decreased in 2 states from 1992 to 1996. The gapranged from 56 points in Washington, DC in 1998, and 35 points in New Jersey,down to 11 points in North Dakota.
• In 8th grade mathematics, the gap declined in no state, but rose in Alabama andMaryland. It ranged from 42 points in Maryland in 1996 to a low of 21 in WestVirginia and Wyoming.
• In 4th grade reading, from 1992 to 1998, the gap rose in 6 states and decreased in 1.In 1998, it ranged from 53 points in Washington, DC, and 38 points in Rhode Island,to 16 points in Maine and Wyoming.
The Gap Between the Top and Bottom Quartiles
• In 4th grade mathematics, from 1992 to 1996, the gap declined in 8 states and rose in2.
• In 8th grade mathematics, from 1990 to 1996, the gap declined in 5 states andincreased in 2.
• In 4th grade reading, from 1992 to 1998, the gap increased in 16 states and decreasedin 1.
12
IMPLICATIONS
• A single point on NAEP scale, such as the Proficient Level, can be used to trackprogress toward a standard of achievement that has been adopted, but it is notsufficient for tracking change in student achievement.
• Even when averages between two periods are compared, scores may changedifferentially among the quartiles, and sometimes increases may simply cancel outdecreases.
• It is important to know whether lower-scoring students are progressing, even if theyare not reaching the objectives we have set for them. It is also important to know ifhigher-scoring students are improving, even if they are already above the standard.
• When the gap between white and minority students grows or declines, it is importantto know how it happened, in terms of changes in quartile scores. Did it declinebecause higher-scoring minority students raised their scores? Because higher-scoringwhite students lowered theirs? Because lower-scoring, bottom-quartile, minoritystudents increased their achievement? Where the change is occurring helps tell uswhere the effort is most needed, and where we are getting results.
• A final point about the NAEP sample. If NAEP is used in the future for regulartracking of progress as is done in this paper, then the sample sizes (particularly forminority students) should be increased.

13
INTRODUCTION
This paper is concerned with the measurement of student achievement andeducational progress. The data used in it are from the National Assessment ofEducational Progress, the only source for information on the country as a whole andfor the individual states on a basis that permits measuring change over time andthat permits comparisons among states.
More specifically, the paper concerns ways of looking at and using NAEPdata in reporting progress in terms used by the National Education Goals set byPresident Bush and the Governors following the Education Summit in Charlottesville,Virginia, in September of 1989, and with the annual reports of the National EducationGoals Panel that report progress toward these goals. Goal 3 sets a goal of havingstudents demonstrate competency over “challenging subject matter” with theobjective that “The academic performance of all students at the elementary andsecondary level will increase significantly in every quartile, and the distribution ofminority students in each quartile will more closely reflect the student population as awhole.” Panel reports have reported progress in terms of the change in the percent ofstudents who have reached the “proficient” level, as defined by the National AssessmentGoverning Board.
I have argued that this single measure does not capture the extent of change inachievement from one period to the next. While it may be useful to know change in thepercent reaching a particular cut-point on the achievement scale to track progress toward aspecific standard, we need to go beyond this to track achievement of the student body as awhole. While it is sometimes the case that most student scores are changing in the samedirection, and that when more students surpass the cut-point it reflects a generally upwardtrend, this is by no means always the case. This approach measures only movement aroundthe cut-point, and it is quite possible, for example, that this percent could rise at the sametime that the average scores of all students did not, or vice versa.
This paper attempts to answer how progress during the decade of the 1990s wouldlook if measured by changes in achievement in every quartile, and the extent to whichminority student scores approached those of the majority. Minority students are defined hereas the total of black and Hispanic students combined. (This produces a significantly largersample size. When the separate groups are divided into four equal groups, the sample sizebecomes problematically small.)
The data used in this paper were produced through special tabulations of datathat have not been previously published. These tabulations were performed byEducational Testing Service for the National Education Goals Panel underarrangements made by the National Center for Education Statistics, the agencyresponsible for NAEP. Neither NCES or ETS bear responsibility for the way I havereported or used the data in this paper.

14
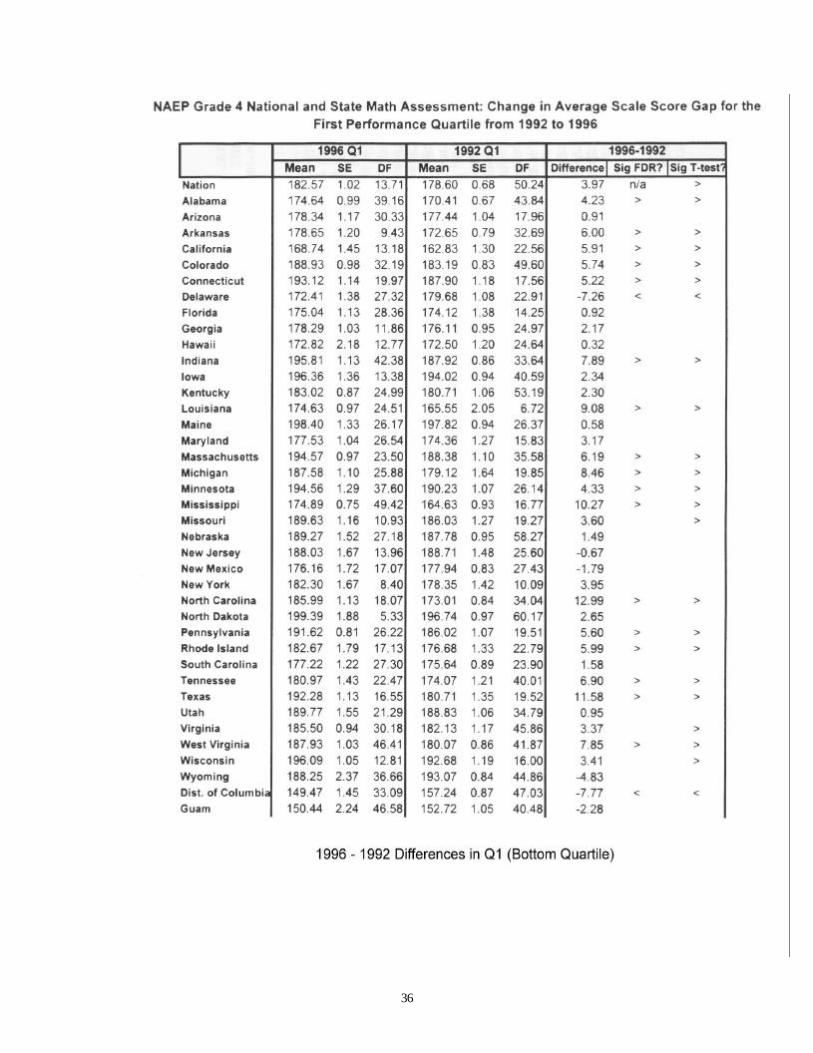
The body of this paper compares states' performance in 4th grade reading and4th and 8th grade mathematics. In what follows, each page on the right presents theassessment results for one age level in one subject area. The page on the left handsummarizes the changes in the two time periods. (All data are provided in theAppendix.) The concluding section points out what difference may occur between apresentation based on quartile and one using a single number. The appendix tablesprovide the raw data prepared by Educational Testing Service for the NationalEducation Goals Panel.
In many cases, minority student scores show a change occurring between twoperiods that was not statistically significant. This is because the sample size issmaller for minority students than for all or for white students. In the textsummarizing the changes, only changes that are statistically significant are noted.
15
STATE TRENDS IN THE LEVEL OF STUDENT ACHIEVEMNT
The pages that follow provide an analysis of changes in achievement scoreson state assessments conducted by the National Assessment of Educational Progress.The tables on the right provide the changes in score for each state, and the pages onthe left summarize the pattern of change. These tables show:
n Changes in average achievement scores for all students for each state.n Changes in average scores for students in the top and bottom quartiles.n Changes in the percent of students reaching the proficient level.n Changes in the gap in average scores between the top and bottom
quartiles.n Changes in the gap in average scores between white and minority students.
16
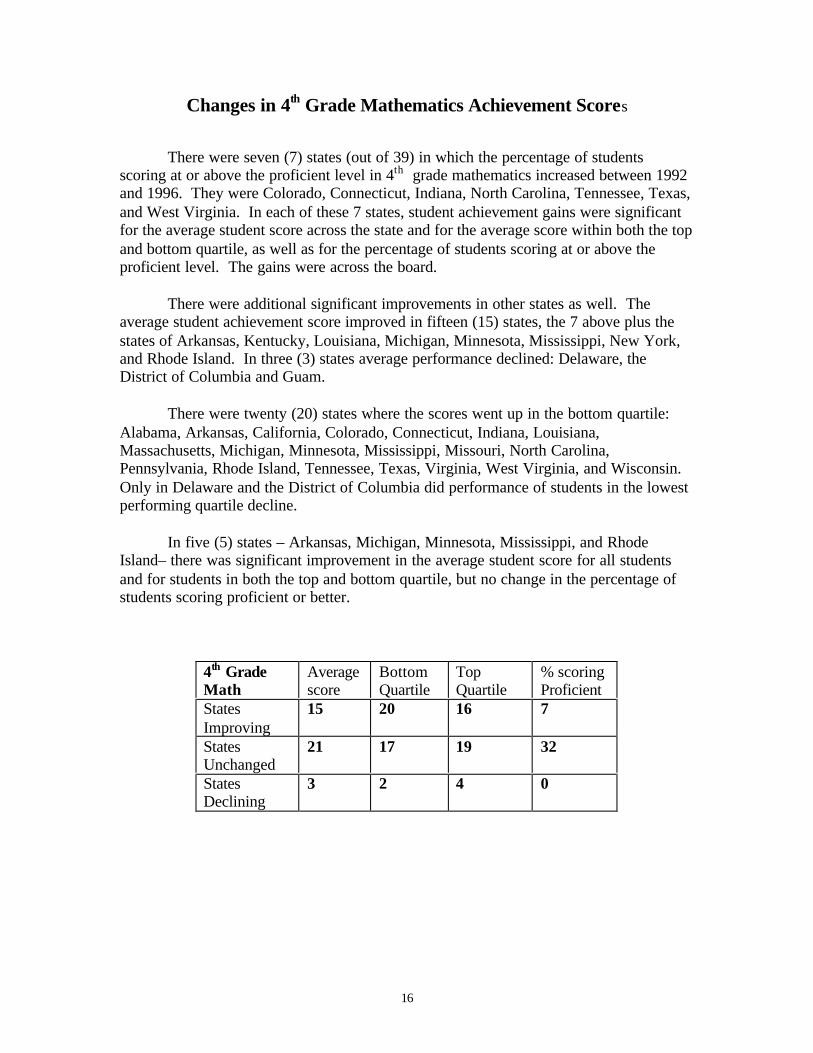
Changes in 4th Grade Mathematics Achievement Scores
There were seven (7) states (out of 39) in which the percentage of studentsscoring at or above the proficient level in 4th grade mathematics increased between 1992and 1996. They were Colorado, Connecticut, Indiana, North Carolina, Tennessee, Texas,and West Virginia. In each of these 7 states, student achievement gains were significantfor the average student score across the state and for the average score within both the topand bottom quartile, as well as for the percentage of students scoring at or above theproficient level. The gains were across the board.
There were additional significant improvements in other states as well. Theaverage student achievement score improved in fifteen (15) states, the 7 above plus thestates of Arkansas, Kentucky, Louisiana, Michigan, Minnesota, Mississippi, New York,and Rhode Island. In three (3) states average performance declined: Delaware, theDistrict of Columbia and Guam.
There were twenty (20) states where the scores went up in the bottom quartile:Alabama, Arkansas, California, Colorado, Connecticut, Indiana, Louisiana,Massachusetts, Michigan, Minnesota, Mississippi, Missouri, North Carolina,Pennsylvania, Rhode Island, Tennessee, Texas, Virginia, West Virginia, and Wisconsin.Only in Delaware and the District of Columbia did performance of students in the lowestperforming quartile decline.
In five (5) states – Arkansas, Michigan, Minnesota, Mississippi, and RhodeIsland– there was significant improvement in the average student score for all studentsand for students in both the top and bottom quartile, but no change in the percentage ofstudents scoring proficient or better.
4th GradeMath
Averagescore
BottomQuartile
TopQuartile
% scoringProficient
StatesImproving
15 20 16 7
StatesUnchanged
21 17 19 32
StatesDeclining
3 2 4 0
17
State
Alabama 3 4 2Arizona 2 1 3Arkansas 6 6 5California 1 6 -3Colorado 5 6 4Connecticut 5 5 3Delaware -3 -7 -2Florida 2 -1 2
Georgia 0 2 -2Hawaii 1 0 2
Indiana 8 8 7Iowa -1 2 -5Kentucky 5 2 4Louisiana 5 9 1Maine 1 1 1
Maryland 3 3 3Massachusetts 2 6 0
Michigan 6 8 5Minnesota 4 4 3Mississippi 7 10 4Missouri 3 4 1Nebraska 2 1 2New Jersey 0 -1 1New Mexico 1 -2 2
New York 4 4 2North Carolina 11 13 10North Dakota 2 3 2Pennsylvania 2 6 -2
Rhode Island 5 6 4South Carolina 1 2 -1
Tennessee 8 7 9Texas 11 12 10Utah 2 1 3Virginia 2 3 -1West Virginia 8 8 7Wisconsin 3 3 2Wyoming -2 -5 0District of Columbia -5 -8 -3Guam -4 -2 -6
Numbers shown in bold and against a shaded box are statistically significant. See Appendix for additional data.
Seventeen (17) states did not participate in the 1996 NAEP or their sample size was insufficient: Alaska, Idaho, Illinois, Kansas, Montana, Nevada, New Hampshire, Ohio, Oklahoma, Oregon, South Dakota, Vermont, Washington, American Samoa, Northern Marianas, Puerto Rico, and the Virgin Islands.
4th Grade Mathematics, 1992 - 1996 (Public Schools) Changes in NAEP Scores
Percentage at or Above Proficient
Change in Q4, Top Quartile
Change in Average Score
Change in Q1, Bottom Quartile
18
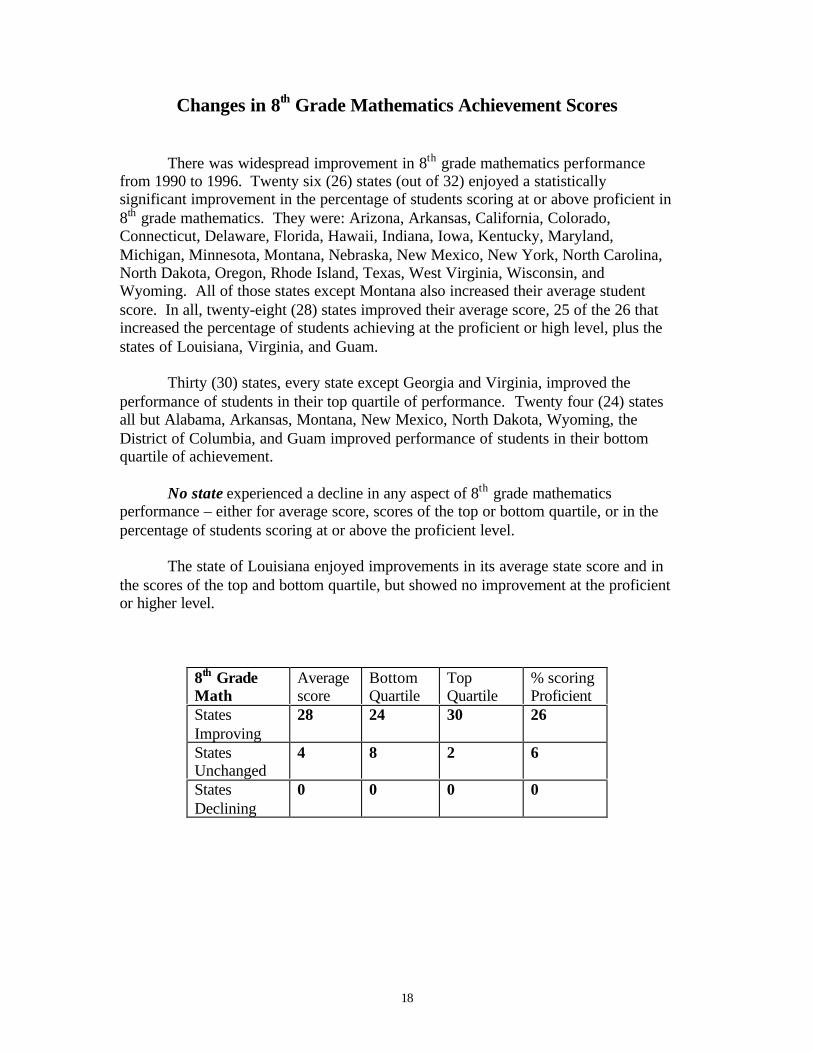
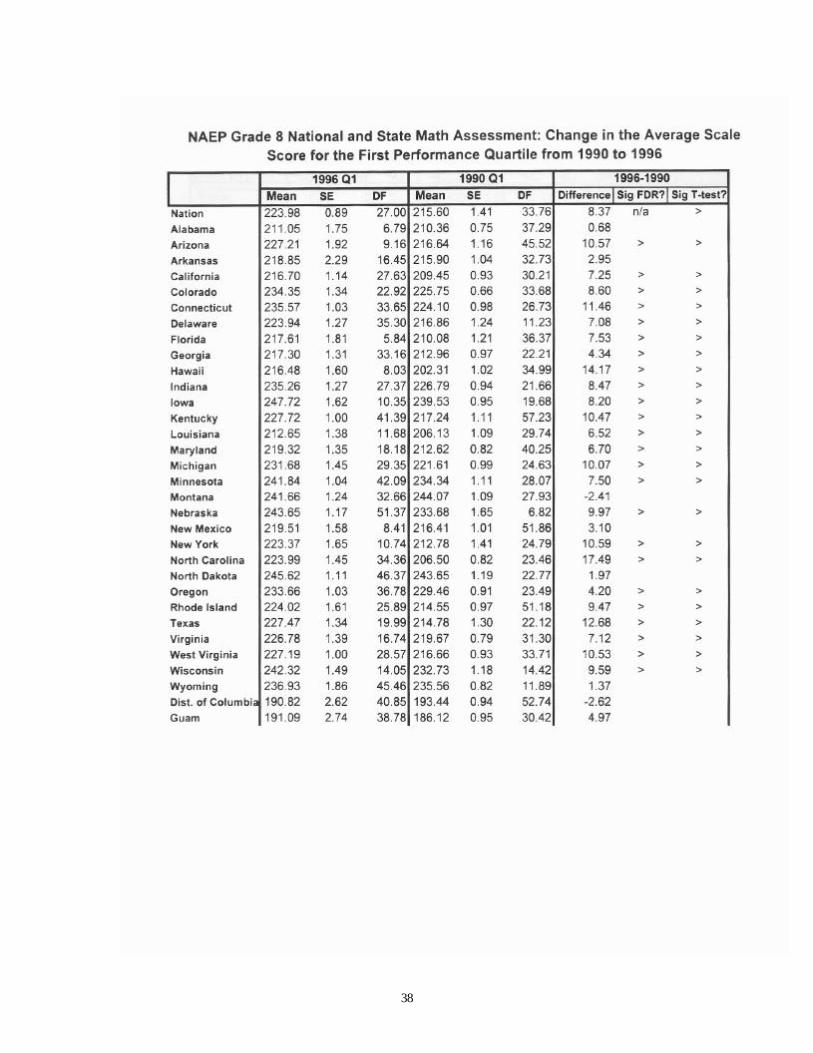
Changes in 8th Grade Mathematics Achievement Scores
There was widespread improvement in 8th grade mathematics performancefrom 1990 to 1996. Twenty six (26) states (out of 32) enjoyed a statisticallysignificant improvement in the percentage of students scoring at or above proficient in8th grade mathematics. They were: Arizona, Arkansas, California, Colorado,Connecticut, Delaware, Florida, Hawaii, Indiana, Iowa, Kentucky, Maryland,Michigan, Minnesota, Montana, Nebraska, New Mexico, New York, North Carolina,North Dakota, Oregon, Rhode Island, Texas, West Virginia, Wisconsin, andWyoming. All of those states except Montana also increased their average studentscore. In all, twenty-eight (28) states improved their average score, 25 of the 26 thatincreased the percentage of students achieving at the proficient or high level, plus thestates of Louisiana, Virginia, and Guam.
Thirty (30) states, every state except Georgia and Virginia, improved theperformance of students in their top quartile of performance. Twenty four (24) statesall but Alabama, Arkansas, Montana, New Mexico, North Dakota, Wyoming, theDistrict of Columbia, and Guam improved performance of students in their bottomquartile of achievement.
No state experienced a decline in any aspect of 8th grade mathematicsperformance – either for average score, scores of the top or bottom quartile, or in thepercentage of students scoring at or above the proficient level.
The state of Louisiana enjoyed improvements in its average state score and inthe scores of the top and bottom quartile, but showed no improvement at the proficientor higher level.
8th GradeMath
Averagescore
BottomQuartile
TopQuartile
% scoringProficient
StatesImproving
28 24 30 26
StatesUnchanged
4 8 2 6
StatesDeclining
0 0 0 0

19
State
Alabama 4 1 5Arizona 8 11 6Arkansas 5 3 7California 6 7 6Colorado 8 9 8Connecticut 10 11 7Delaware 6 7 6Florida 8 8 6Georgia 4 4 2
Hawaii 11 14 6Indiana 8 8 6Iowa 6 8 3Kentucky 9 10 7Louisiana 6 7 4Maryland 9 7 11Michigan 12 10 12Minnesota 9 8 9Montana 3 -2 5Nebraska 7 10 6New Mexico 6 3 6New York 9 11 6North Carolina 17 17 18North Dakota 3 2 4Oregon 5 4 5Rhode Island 9 9 7Texas 12 13 10Virginia 5 7 2
West Virginia 9 11 7Wisconsin 8 10 7Wyoming 3 1 3District of Columbia 1 -3 7Guam 7 5 6
Twenty-five (24) states did not participate in the 1996 NAEP or their sample size was insufficient: Alaska, Idaho, Illinois, Kansas, Maine, Massachusetts, Mississippi, Missouri, Nevada, New Hampshire, New Jersey, Ohio, Oklahoma, Pennsylvania, South Carolina, South Dakota, Tennessee, Utah, Vermont, Washington, American Samoa, Northern Marianas, Puerto Rico, and the Virgin Islands.
8th Grade Mathematics, 1990 - 1996 (Public Schools) Changes in NAEP Scores
Percentage at or Above Proficient
Change in Q4, Top Quartile
Change in Average Score
Change in Q1, Bottom Quartile
Numbers shown in bold and against a shaded line are statistically significant. See Appendix for additional data.
20
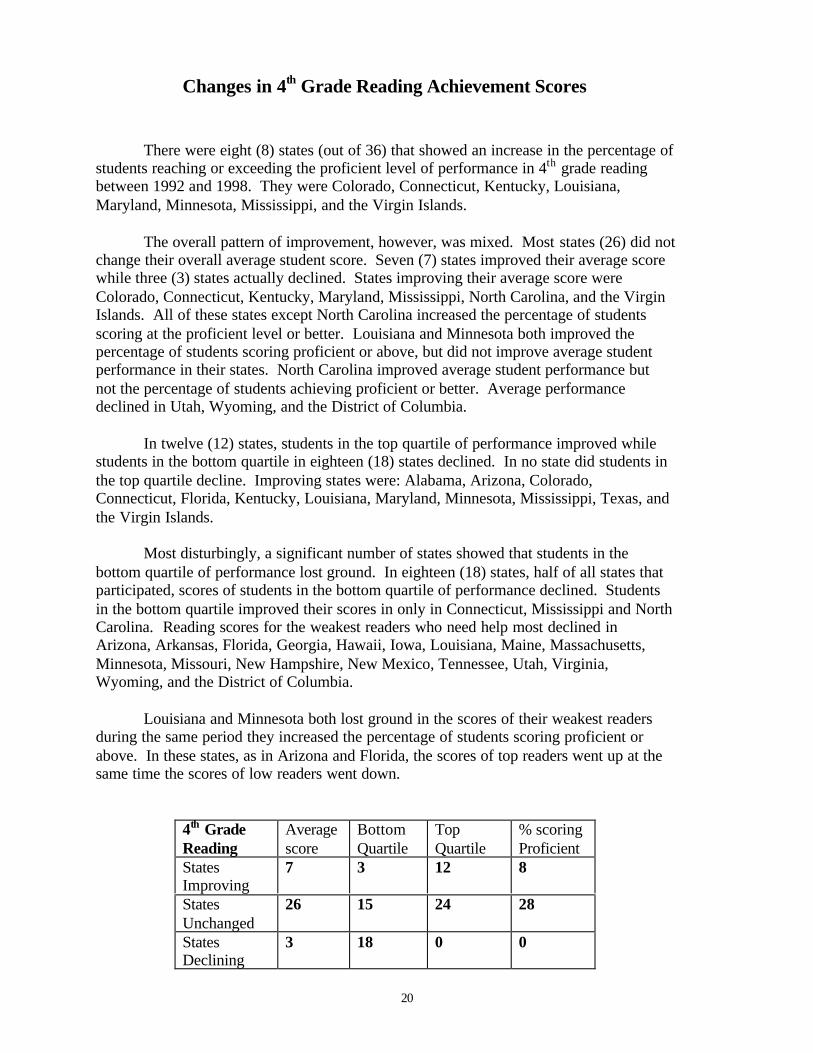
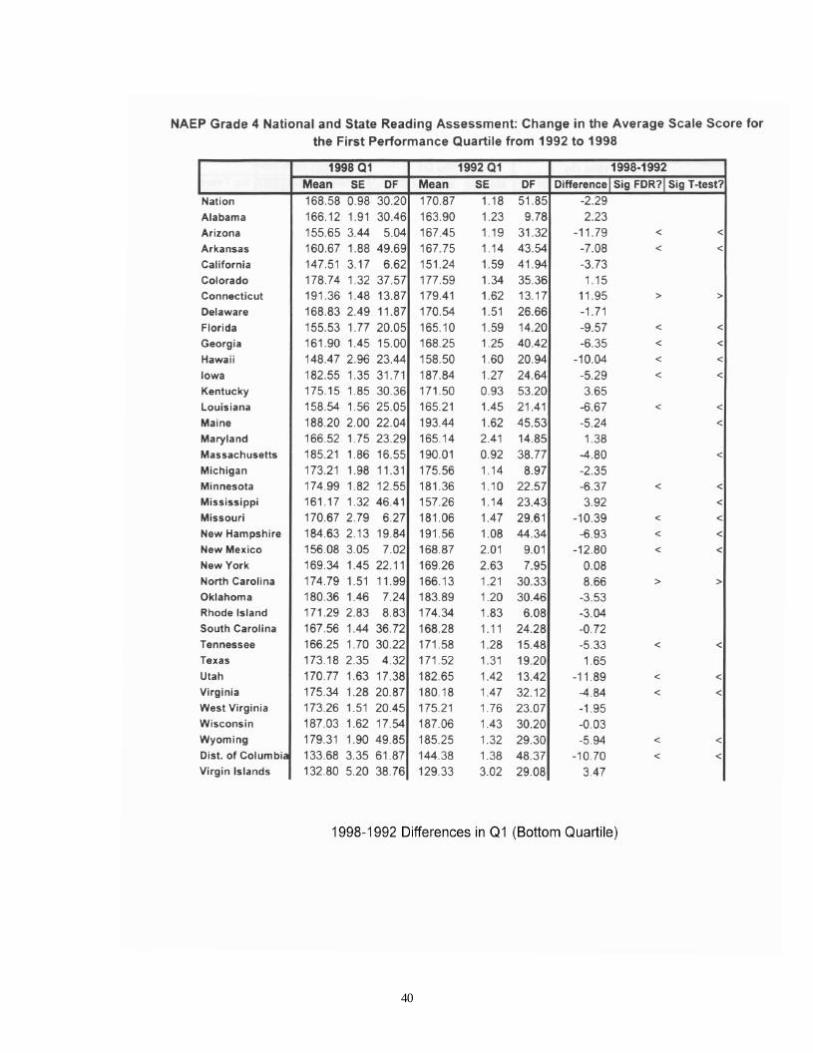
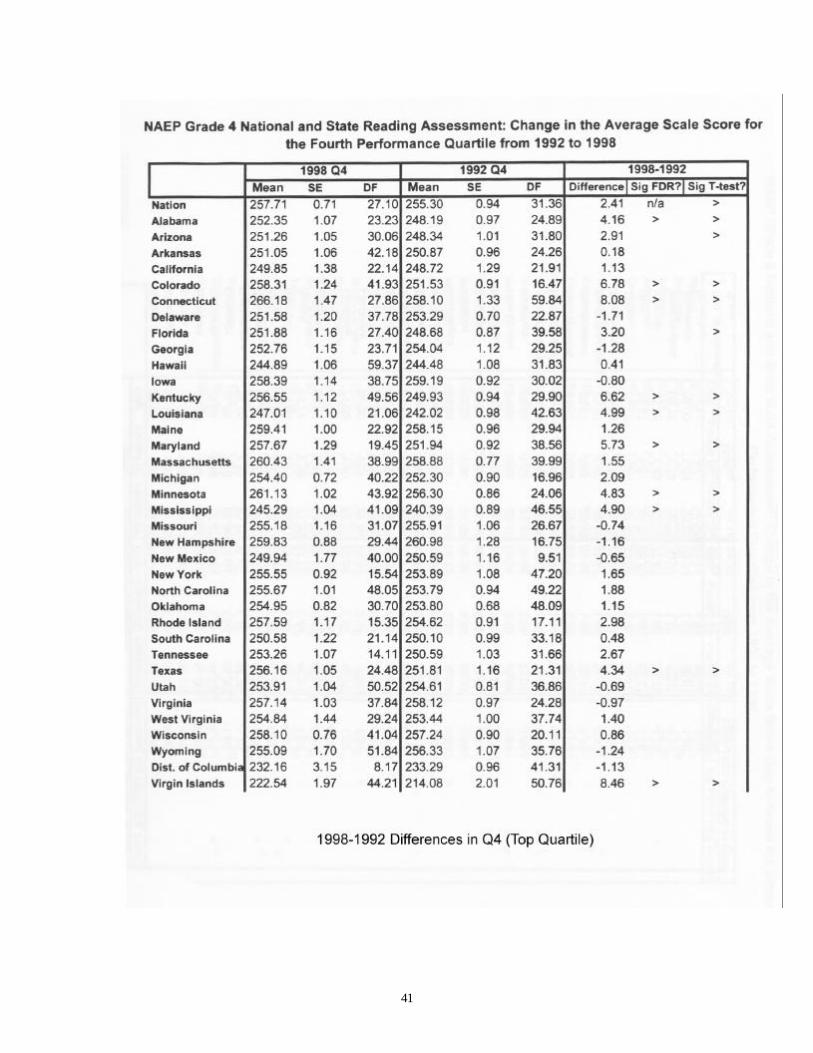
Changes in 4th Grade Reading Achievement Scores
There were eight (8) states (out of 36) that showed an increase in the percentage ofstudents reaching or exceeding the proficient level of performance in 4th grade readingbetween 1992 and 1998. They were Colorado, Connecticut, Kentucky, Louisiana,Maryland, Minnesota, Mississippi, and the Virgin Islands.
The overall pattern of improvement, however, was mixed. Most states (26) did notchange their overall average student score. Seven (7) states improved their average scorewhile three (3) states actually declined. States improving their average score wereColorado, Connecticut, Kentucky, Maryland, Mississippi, North Carolina, and the VirginIslands. All of these states except North Carolina increased the percentage of studentsscoring at the proficient level or better. Louisiana and Minnesota both improved thepercentage of students scoring proficient or above, but did not improve average studentperformance in their states. North Carolina improved average student performance butnot the percentage of students achieving proficient or better. Average performancedeclined in Utah, Wyoming, and the District of Columbia.
In twelve (12) states, students in the top quartile of performance improved whilestudents in the bottom quartile in eighteen (18) states declined. In no state did students inthe top quartile decline. Improving states were: Alabama, Arizona, Colorado,Connecticut, Florida, Kentucky, Louisiana, Maryland, Minnesota, Mississippi, Texas, andthe Virgin Islands.
Most disturbingly, a significant number of states showed that students in thebottom quartile of performance lost ground. In eighteen (18) states, half of all states thatparticipated, scores of students in the bottom quartile of performance declined. Studentsin the bottom quartile improved their scores in only in Connecticut, Mississippi and NorthCarolina. Reading scores for the weakest readers who need help most declined inArizona, Arkansas, Florida, Georgia, Hawaii, Iowa, Louisiana, Maine, Massachusetts,Minnesota, Missouri, New Hampshire, New Mexico, Tennessee, Utah, Virginia,Wyoming, and the District of Columbia.
Louisiana and Minnesota both lost ground in the scores of their weakest readersduring the same period they increased the percentage of students scoring proficient orabove. In these states, as in Arizona and Florida, the scores of top readers went up at thesame time the scores of low readers went down.
4th GradeReading
Averagescore
BottomQuartile
TopQuartile
% scoringProficient
StatesImproving
7 3 12 8
StatesUnchanged
26 15 24 28
StatesDeclining
3 18 0 0
21
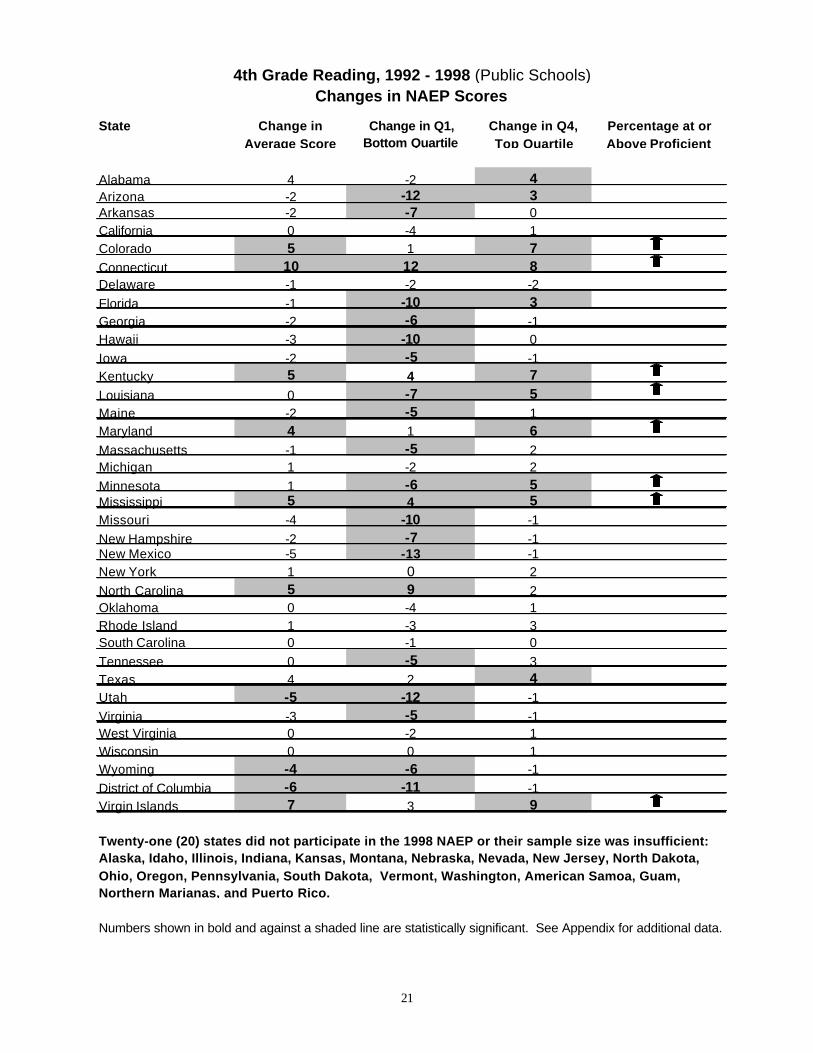
State
Alabama 4 -2 4Arizona -2 -12 3Arkansas -2 -7 0California 0 -4 1Colorado 5 1 7Connecticut 10 12 8Delaware -1 -2 -2
Florida -1 -10 3Georgia -2 -6 -1Hawaii -3 -10 0
Iowa -2 -5 -1Kentucky 5 4 7Louisiana 0 -7 5Maine -2 -5 1Maryland 4 1 6Massachusetts -1 -5 2Michigan 1 -2 2
Minnesota 1 -6 5Mississippi 5 4 5Missouri -4 -10 -1
New Hampshire -2 -7 -1New Mexico -5 -13 -1New York 1 0 2
North Carolina 5 9 2Oklahoma 0 -4 1Rhode Island 1 -3 3South Carolina 0 -1 0
Tennessee 0 -5 3Texas 4 2 4Utah -5 -12 -1
Virginia -3 -5 -1West Virginia 0 -2 1Wisconsin 0 0 1Wyoming -4 -6 -1
District of Columbia -6 -11 -1Virgin Islands 7 3 9
Numbers shown in bold and against a shaded line are statistically significant. See Appendix for additional data.
Change in Q1, Bottom Quartile
Change in Average Score
Change in Q4, Top Quartile
Percentage at or Above Proficient
Twenty-one (20) states did not participate in the 1998 NAEP or their sample size was insufficient: Alaska, Idaho, Illinois, Indiana, Kansas, Montana, Nebraska, Nevada, New Jersey, North Dakota, Ohio, Oregon, Pennsylvania, South Dakota, Vermont, Washington, American Samoa, Guam, Northern Marianas, and Puerto Rico.
4th Grade Reading, 1992 - 1998 (Public Schools) Changes in NAEP Scores
22
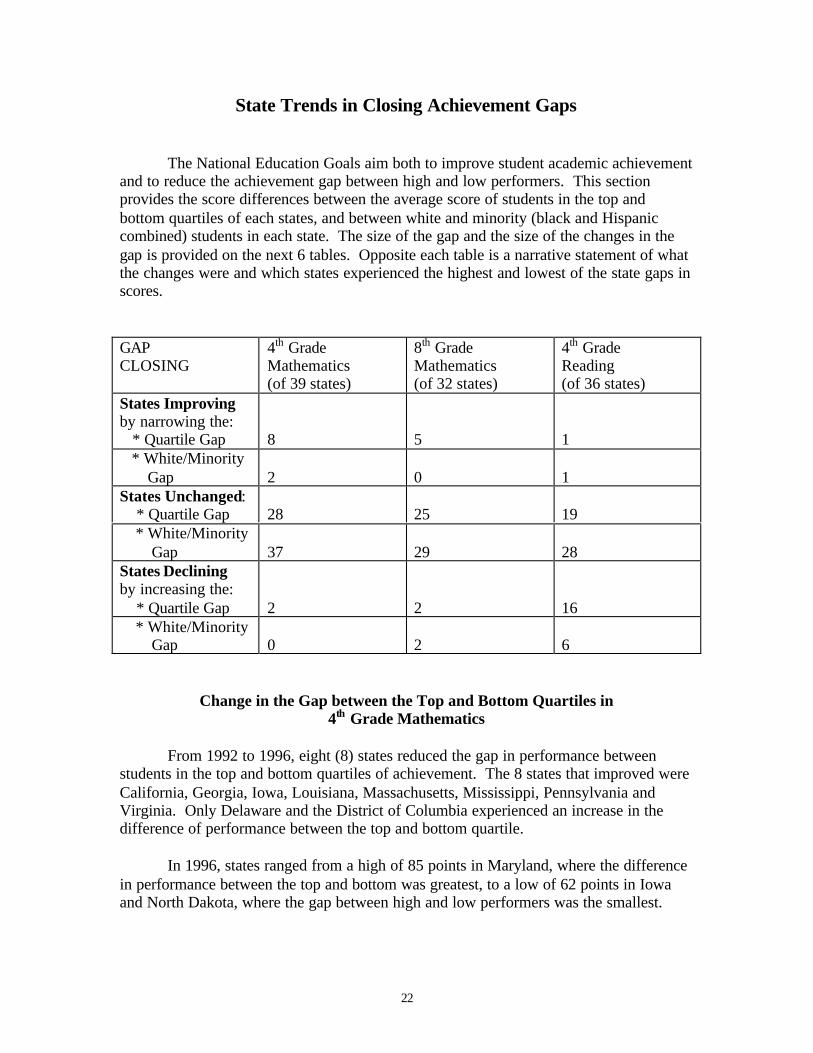
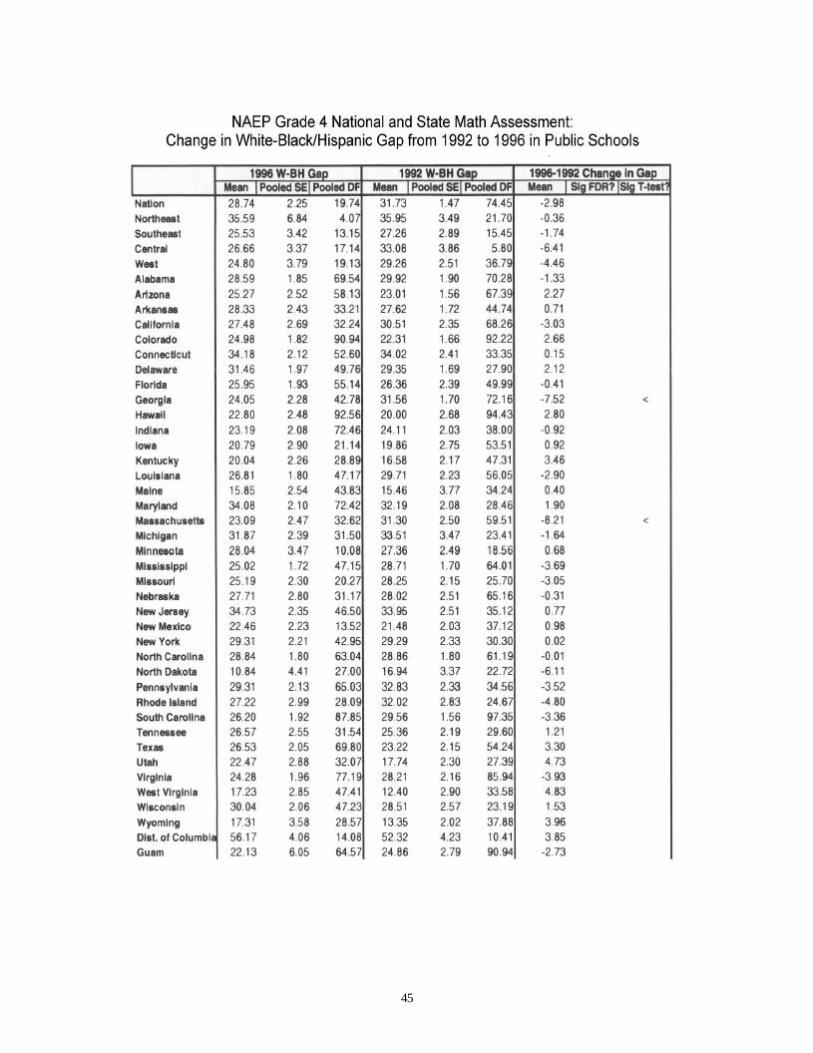
State Trends in Closing Achievement Gaps
The National Education Goals aim both to improve student academic achievementand to reduce the achievement gap between high and low performers. This sectionprovides the score differences between the average score of students in the top andbottom quartiles of each states, and between white and minority (black and Hispaniccombined) students in each state. The size of the gap and the size of the changes in thegap is provided on the next 6 tables. Opposite each table is a narrative statement of whatthe changes were and which states experienced the highest and lowest of the state gaps inscores.
GAPCLOSING
4th GradeMathematics(of 39 states)
8th GradeMathematics(of 32 states)
4th GradeReading(of 36 states)
States Improvingby narrowing the: * Quartile Gap 8 5 1 * White/Minority Gap 2 0 1States Unchanged: * Quartile Gap 28 25 19 * White/Minority Gap 37 29 28States Decliningby increasing the: * Quartile Gap 2 2 16 * White/Minority Gap 0 2 6
Change in the Gap between the Top and Bottom Quartiles in4th Grade Mathematics
From 1992 to 1996, eight (8) states reduced the gap in performance betweenstudents in the top and bottom quartiles of achievement. The 8 states that improved wereCalifornia, Georgia, Iowa, Louisiana, Massachusetts, Mississippi, Pennsylvania andVirginia. Only Delaware and the District of Columbia experienced an increase in thedifference of performance between the top and bottom quartile.
In 1996, states ranged from a high of 85 points in Maryland, where the differencein performance between the top and bottom was greatest, to a low of 62 points in Iowaand North Dakota, where the gap between high and low performers was the smallest.

23
State
Alabama 74 -2 Arizona 76 2Arkansas 73 -1California 80 -8Colorado 72 -2Connecticut 73 -2Delaware 82 5Florida 78 1Georgia 74 -4Hawaii 83 2Indiana 66 -1Iowa 62 -7Kentucky 72 2Louisiana 69 -8Maine 66 0Maryland 85 0Massachusetts 67 -7Michigan 74 -4Minnesota 71 -2Mississippi 69 -6Missouri 68 -3Nebraska 73 0New Jersey 76 2New Mexico 75 4New York 76 -2North Carolina 75 -3North Dakota 62 -1Pennsylvania 67 -7Rhode Island 73 -2South Carolina 73 -3Tennessee 75 2Texas 72 -2Utah 70 2Virginia 73 -4West Virginia 70 -1Wisconsin 68 -1Wyoming 68 5District of Columbia 81 5Guam 77 -4
Numbers shown in bold and against a shaded box are statistically significant. See Appendix for additional data.
4th Grade Mathematics, 1992 - 1996 (Public Schools) Changes in the Gap Between Top and Bottom Quartile Scores
Statistically Significant Change
Change in the Gap between 1992 and 1996
Gap Between Average Score of Top and Bottom
Quartiles in 1996[Decreases represent improvements indicated by ]
Seventeen (17) states did not participate in the 1996 NAEP or their sample size was insufficient: Alaska, Idaho, Illinois, Kansas, Montana, Nevada, New Hampshire, Ohio, Oklahoma, Oregon, South Dakota, Vermont, Washington, American Samoa, Northern Marianas, Puerto Rico, and the Virgin Islands.
24
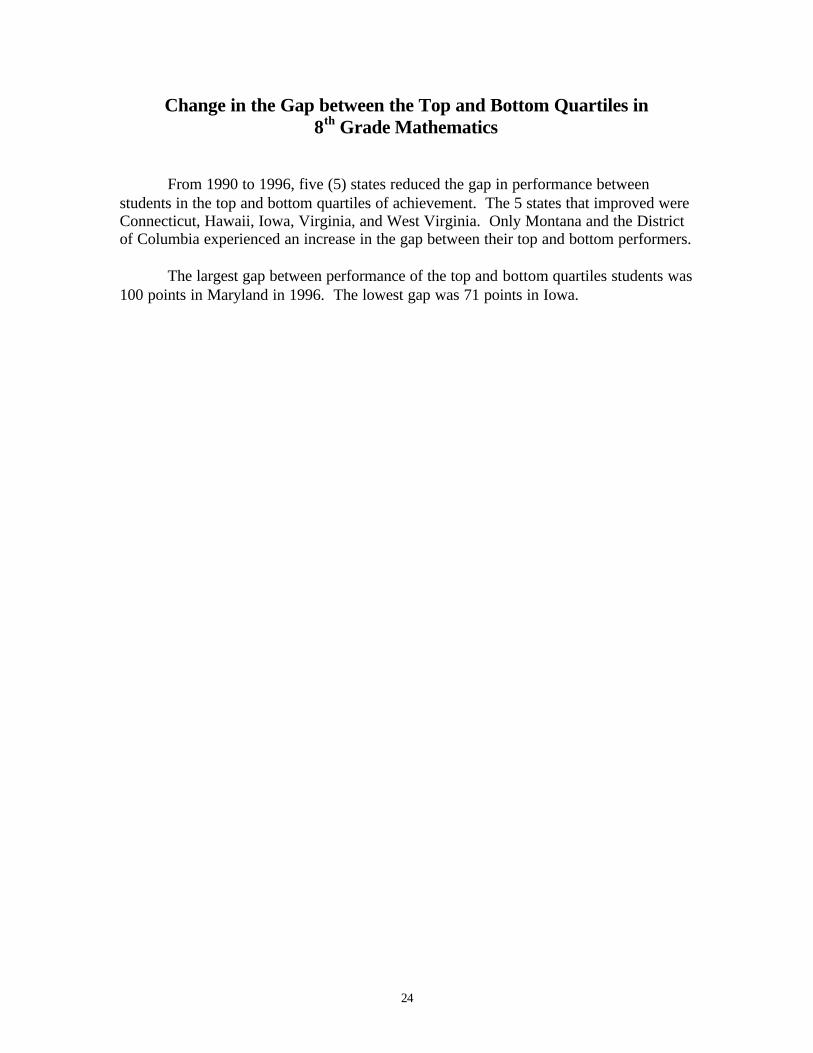
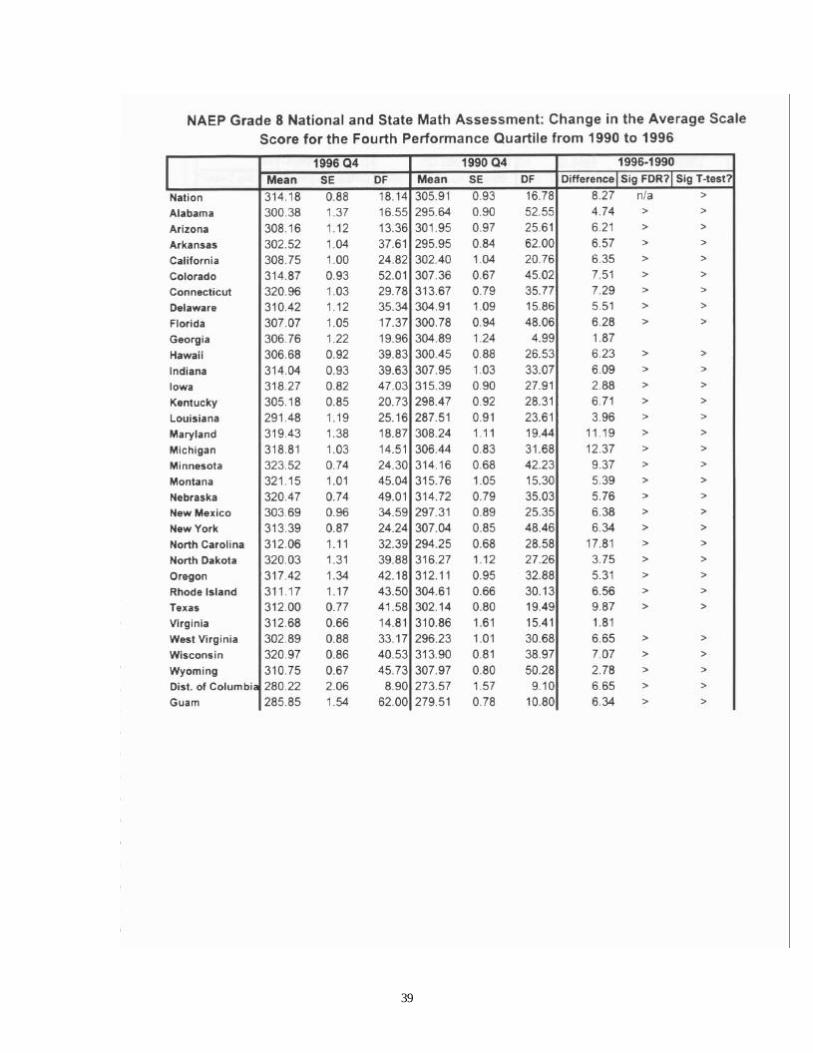
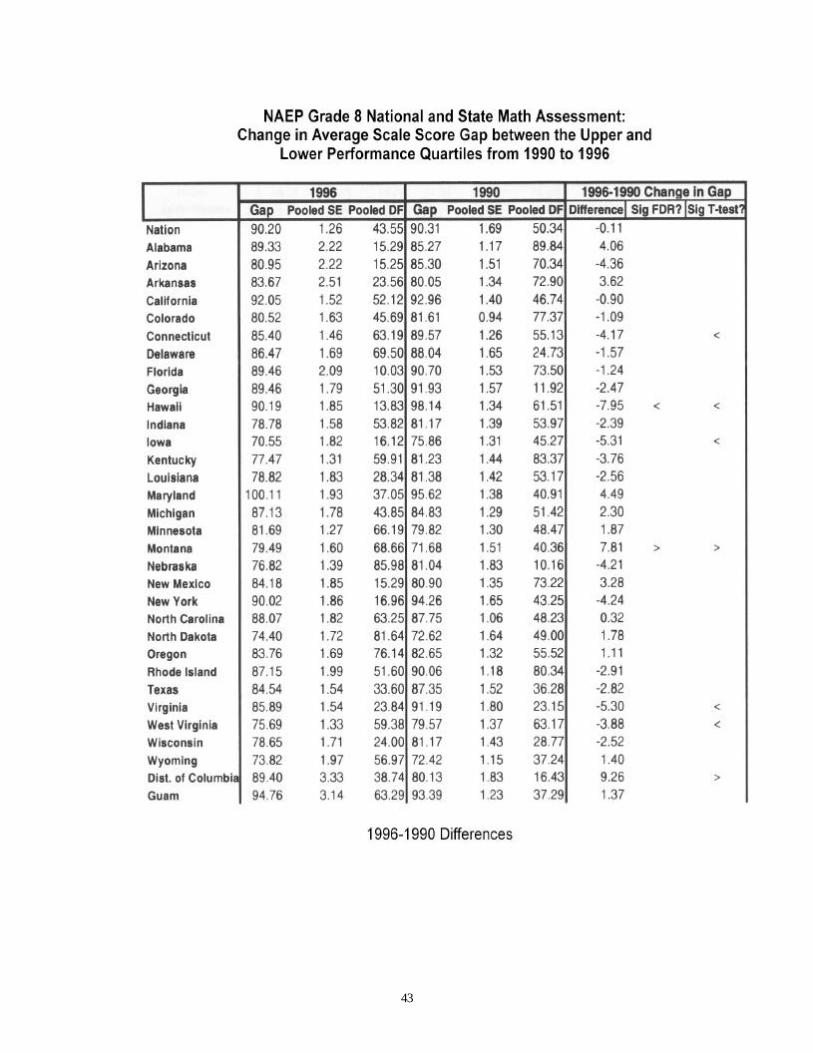
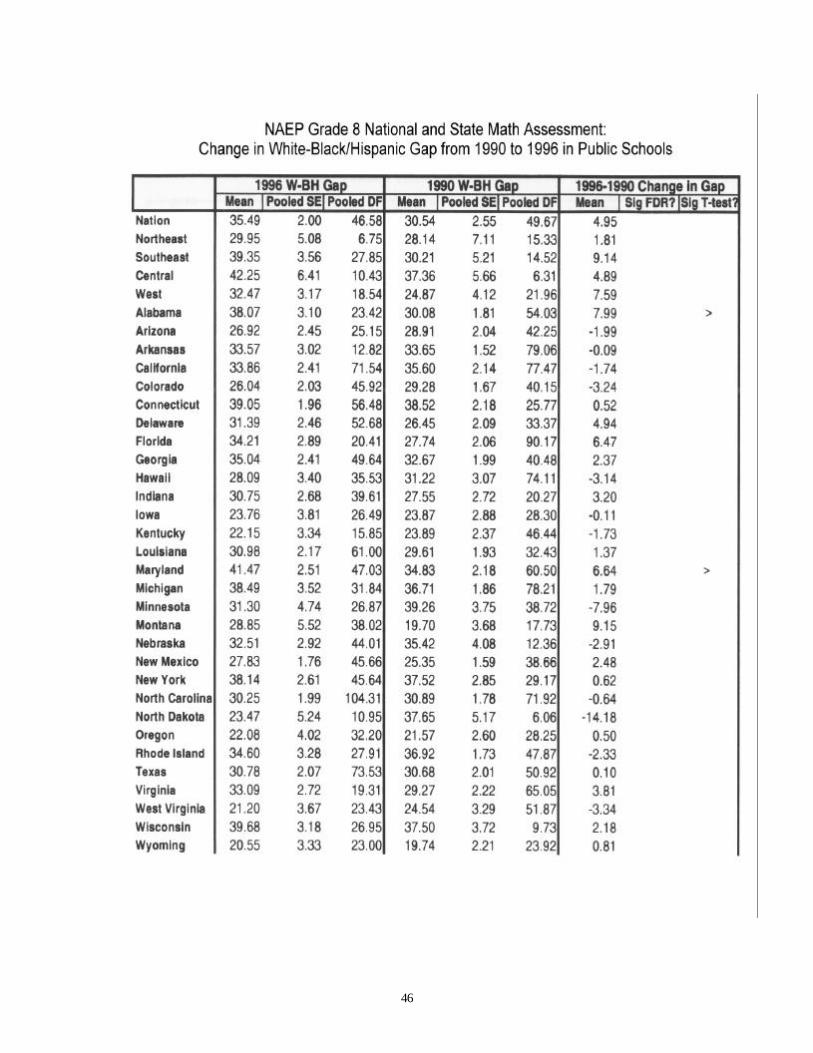
Change in the Gap between the Top and Bottom Quartiles in8th Grade Mathematics
From 1990 to 1996, five (5) states reduced the gap in performance betweenstudents in the top and bottom quartiles of achievement. The 5 states that improved wereConnecticut, Hawaii, Iowa, Virginia, and West Virginia. Only Montana and the Districtof Columbia experienced an increase in the gap between their top and bottom performers.
The largest gap between performance of the top and bottom quartiles students was100 points in Maryland in 1996. The lowest gap was 71 points in Iowa.

25
State
Alabama 89 4Arizona 81 -4Arkansas 84 4California 92 -1Colorado 81 -1Connecticut 85 -4Delaware 86 -2Florida 89 -1Georgia 89 -2Hawaii 90 -8Indiana 79 -2Iowa 71 -5Kentucky 77 -4Louisiana 79 -3Maryland 100 4Michigan 87 2Minnesota 82 2Montana 79 8Nebraska 77 -4New Mexico 84 3New York 90 -4North Carolina 88 0North Dakota 74 2Oregon 84 1Rhode Island 87 -3Texas 85 -3Virginia 86 -5West Virginia 76 -4Wisconsin 79 -3Wyoming 74 1District of Columbia 89 9Guam 95 1
[Decreases represent improvements indicated by ]
Twenty-five (25) states did not participate in the 1996 NAEP or their sample size was insufficient: Alaska, Idaho, Illinois, Kansas, Maine, Massachusetts, Mississippi, Missouri, Nevada, New Hampshire, New Jersey, Ohio, Oklahoma, Pennsylvania, South Carolina, South Dakota, Tennessee, Utah, Vermont, Washington, American Samoa, Northern Marianas, Puerto Rico, and the Virgin Islands.Numbers shown in bold and against a shaded box are statistically significant. See Appendix for additional data.
8th Grade Mathematics, 1990 -1996 (Public Schools) Changes in the Gap Between Top and Bottom Quartile Scores
Statistically Significant Change
Change in the Gap between 1990 and 1996
Gap Between Average Score of Top and Bottom
Quartiles in 1996

26
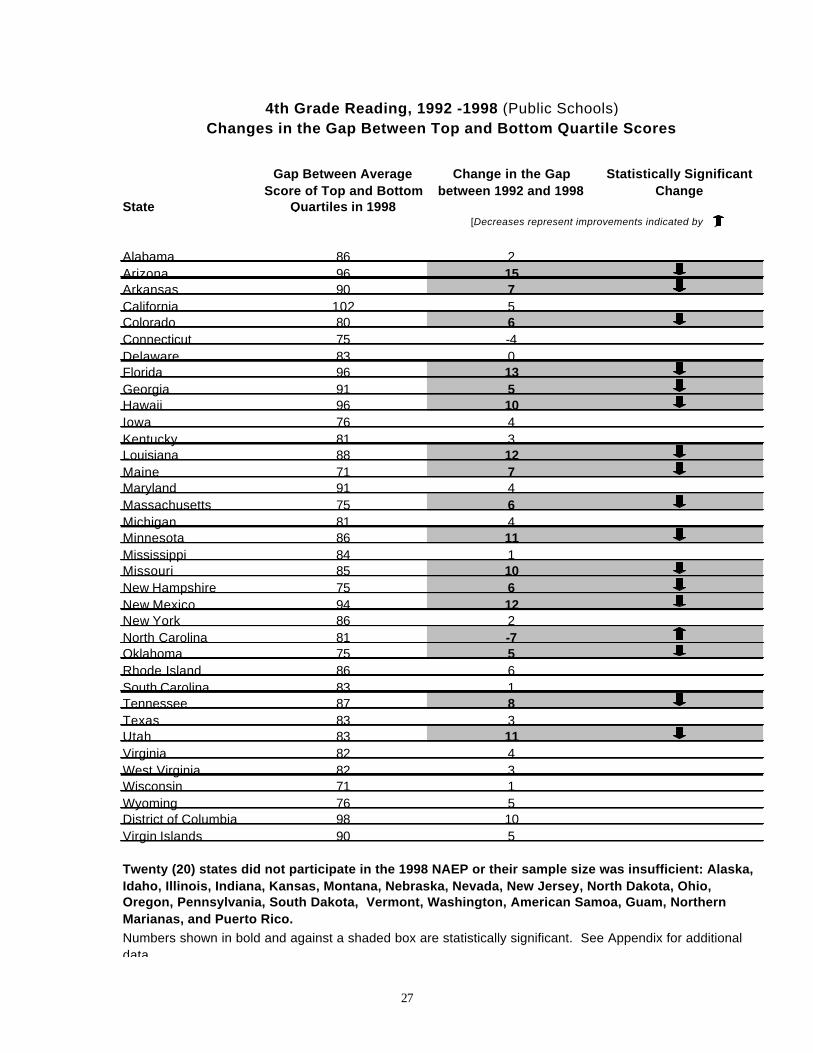
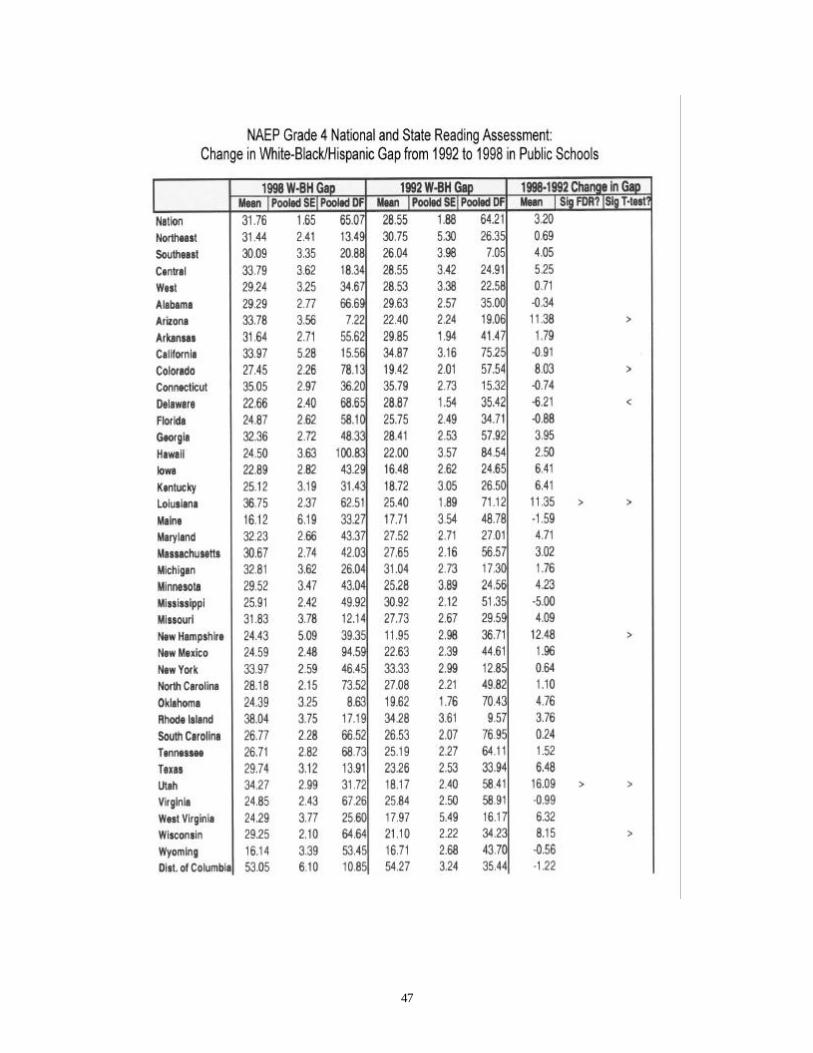
Change in the Gap between the Top and Bottom Quartiles in4th Grade Reading
From 1992 to 1998, almost half of all states that participated in the NAEP 4th
grade reading assessments (16 out of 36) experienced a discouraging increase in the gapof performance between students in the top and bottom quartile of achievement. The 16states that suffered this increase in their gap were Arizona, Arkansas, Colorado, Florida,Georgia, Hawaii, Louisiana, Maine, Massachusetts, Minnesota, Missouri, NewHampshire, New Mexico, Oklahoma, Tennessee, and Utah. The only state to reduce thegap in performance between top and bottom quartiles was North Carolina.
The gap in performance between the top and bottom quartiles ranged in 1998from a high of 102 scale points in California to a low of 71 points in Maine andWisconsin.
27
State
Alabama 86 2Arizona 96 15Arkansas 90 7California 102 5Colorado 80 6Connecticut 75 -4Delaware 83 0Florida 96 13Georgia 91 5Hawaii 96 10Iowa 76 4Kentucky 81 3Louisiana 88 12Maine 71 7Maryland 91 4Massachusetts 75 6Michigan 81 4Minnesota 86 11Mississippi 84 1Missouri 85 10New Hampshire 75 6New Mexico 94 12New York 86 2North Carolina 81 -7Oklahoma 75 5Rhode Island 86 6South Carolina 83 1Tennessee 87 8Texas 83 3Utah 83 11Virginia 82 4West Virginia 82 3Wisconsin 71 1Wyoming 76 5District of Columbia 98 10Virgin Islands 90 5
Numbers shown in bold and against a shaded box are statistically significant. See Appendix for additional data.
4th Grade Reading, 1992 -1998 (Public Schools) Changes in the Gap Between Top and Bottom Quartile Scores
Statistically Significant Change
Change in the Gap between 1992 and 1998
Gap Between Average Score of Top and Bottom
Quartiles in 1998[Decreases represent improvements indicated by ]
Twenty (20) states did not participate in the 1998 NAEP or their sample size was insufficient: Alaska, Idaho, Illinois, Indiana, Kansas, Montana, Nebraska, Nevada, New Jersey, North Dakota, Ohio, Oregon, Pennsylvania, South Dakota, Vermont, Washington, American Samoa, Guam, Northern Marianas, and Puerto Rico.
28
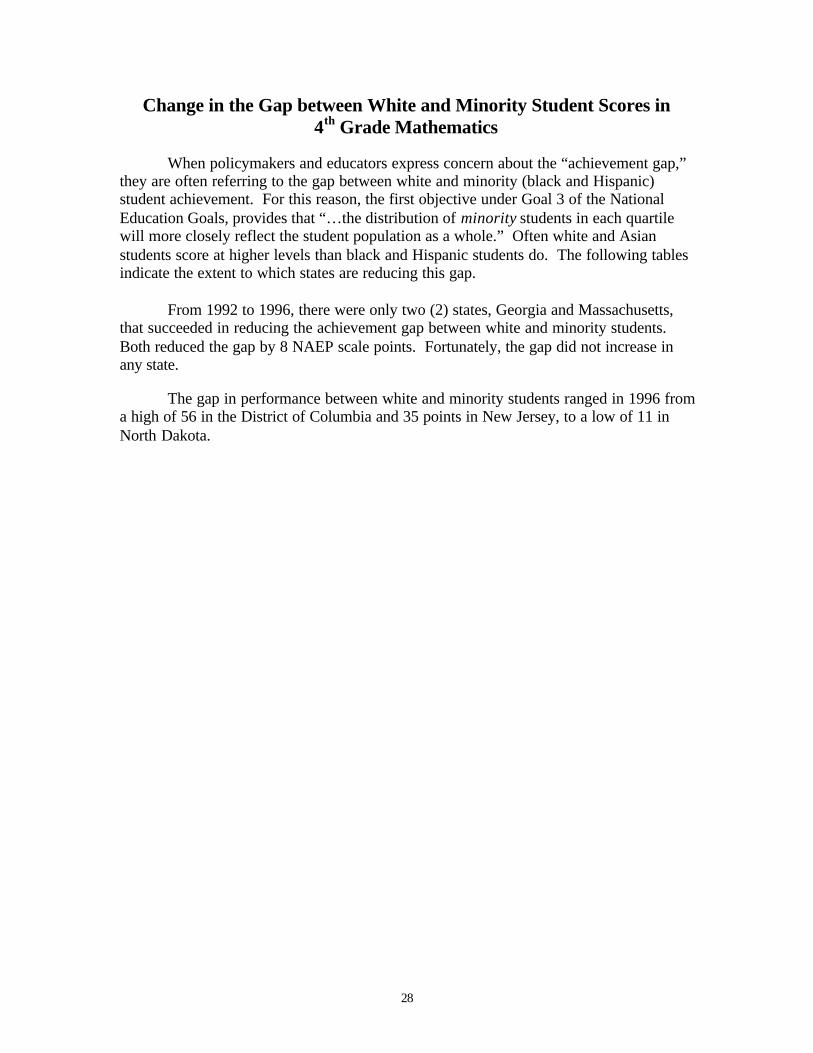
Change in the Gap between White and Minority Student Scores in4th Grade Mathematics
When policymakers and educators express concern about the “achievement gap,”they are often referring to the gap between white and minority (black and Hispanic)student achievement. For this reason, the first objective under Goal 3 of the NationalEducation Goals, provides that “…the distribution of minority students in each quartilewill more closely reflect the student population as a whole.” Often white and Asianstudents score at higher levels than black and Hispanic students do. The following tablesindicate the extent to which states are reducing this gap.
From 1992 to 1996, there were only two (2) states, Georgia and Massachusetts,that succeeded in reducing the achievement gap between white and minority students.Both reduced the gap by 8 NAEP scale points. Fortunately, the gap did not increase inany state.
The gap in performance between white and minority students ranged in 1996 froma high of 56 in the District of Columbia and 35 points in New Jersey, to a low of 11 inNorth Dakota.
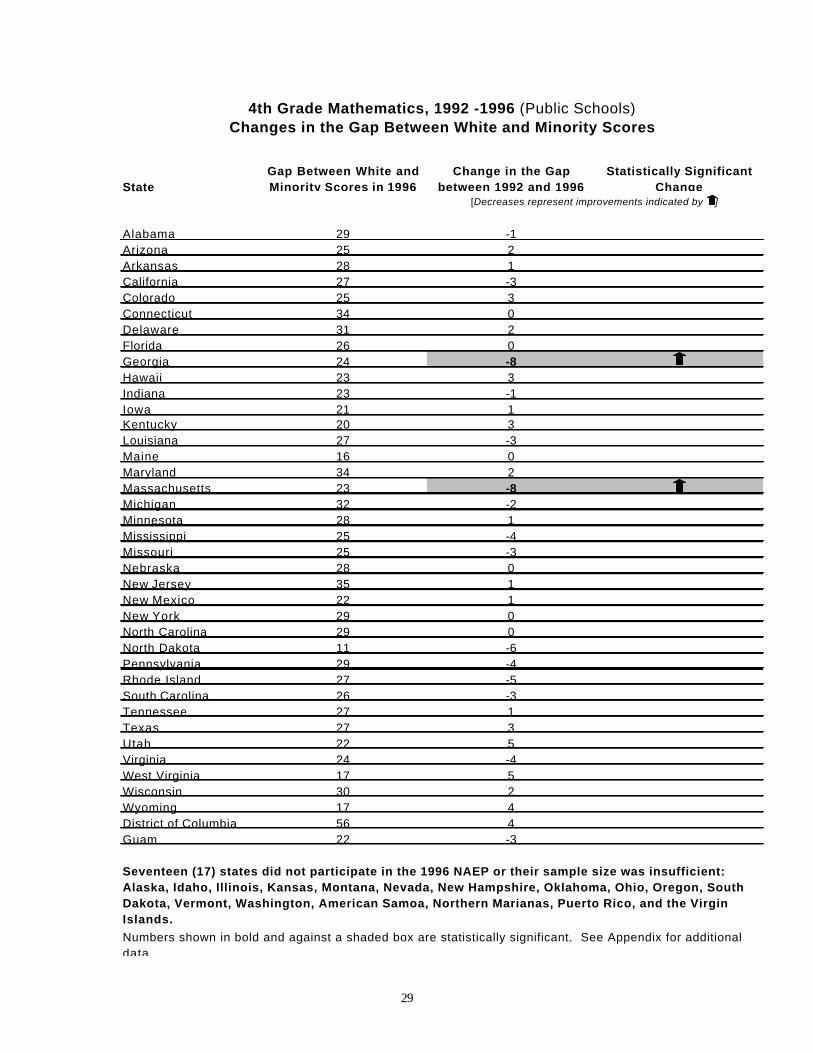
29
State
Alabama 29 -1Arizona 25 2Arkansas 28 1California 27 -3Colorado 25 3Connecticut 34 0Delaware 31 2Florida 26 0Georgia 24 -8Hawaii 23 3Indiana 23 -1Iowa 21 1Kentucky 20 3Louisiana 27 -3Maine 16 0Maryland 34 2Massachusetts 23 -8Michigan 32 -2Minnesota 28 1Mississippi 25 -4Missouri 25 -3Nebraska 28 0New Jersey 35 1New Mexico 22 1New York 29 0North Carolina 29 0North Dakota 11 -6Pennsylvania 29 -4Rhode Island 27 -5South Carolina 26 -3Tennessee 27 1Texas 27 3Utah 22 5Virginia 24 -4West Virginia 17 5Wisconsin 30 2Wyoming 17 4District of Columbia 56 4Guam 22 -3
Numbers shown in bold and against a shaded box are statistically significant. See Appendix for additional data.
4th Grade Mathematics, 1992 -1996 (Public Schools) Changes in the Gap Between White and Minority Scores
[Decreases represent improvements indicated by ]
Seventeen (17) states did not participate in the 1996 NAEP or their sample size was insufficient: Alaska, Idaho, Illinois, Kansas, Montana, Nevada, New Hampshire, Oklahoma, Ohio, Oregon, South Dakota, Vermont, Washington, American Samoa, Northern Marianas, Puerto Rico, and the Virgin Islands.
Gap Between White and Minority Scores in 1996
Change in the Gap between 1992 and 1996
Statistically Significant Change
30
Change in the Gap between White and Minority Student Scores in8th Grade Mathematics
From 1990 to 1996, no state reduced the achievement gap between white andminority (black and Hispanic) students. Two states, Maryland and Alabama, increasedthe gap significantly.
In 1996, this gap ranged from a high of 42 NAEP scale points in Maryland to alow of 21 scale points in West Virginia and Wyoming.
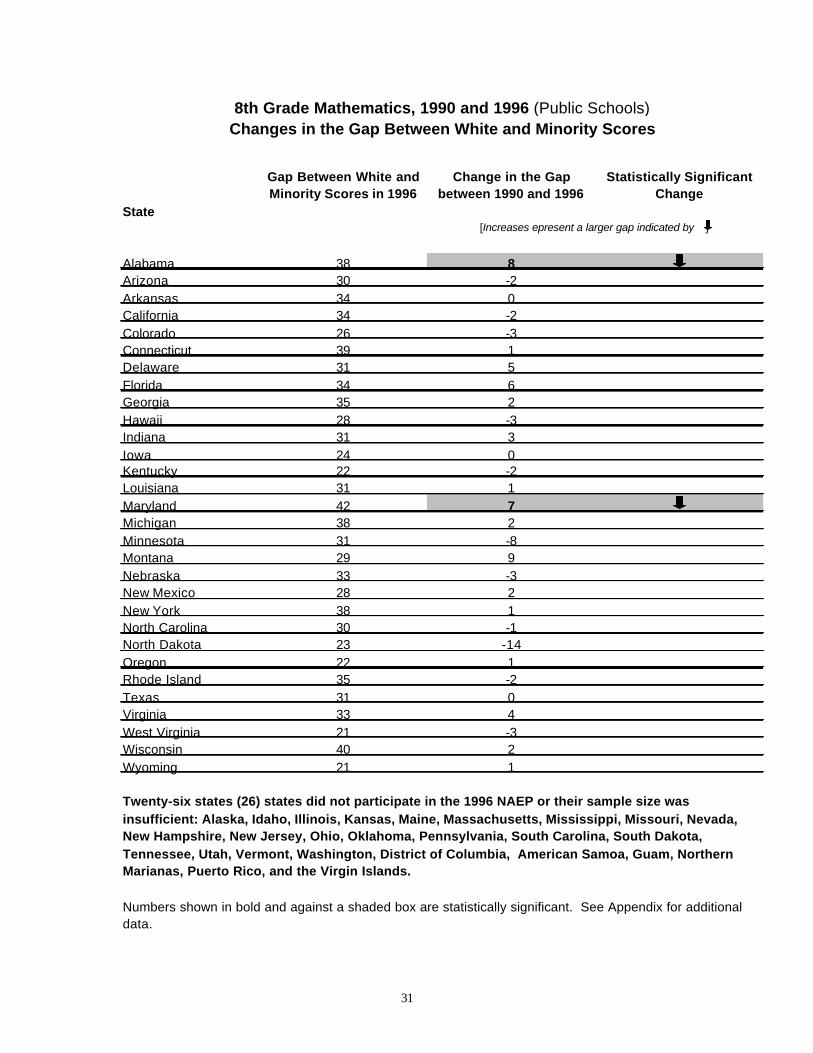
31
State
Alabama 38 8Arizona 30 -2Arkansas 34 0California 34 -2Colorado 26 -3Connecticut 39 1Delaware 31 5Florida 34 6Georgia 35 2Hawaii 28 -3Indiana 31 3Iowa 24 0Kentucky 22 -2Louisiana 31 1Maryland 42 7Michigan 38 2Minnesota 31 -8Montana 29 9Nebraska 33 -3New Mexico 28 2New York 38 1North Carolina 30 -1North Dakota 23 -14Oregon 22 1Rhode Island 35 -2Texas 31 0Virginia 33 4West Virginia 21 -3Wisconsin 40 2Wyoming 21 1
Numbers shown in bold and against a shaded box are statistically significant. See Appendix for additional data.
Twenty-six states (26) states did not participate in the 1996 NAEP or their sample size was insufficient: Alaska, Idaho, Illinois, Kansas, Maine, Massachusetts, Mississippi, Missouri, Nevada, New Hampshire, New Jersey, Ohio, Oklahoma, Pennsylvania, South Carolina, South Dakota, Tennessee, Utah, Vermont, Washington, District of Columbia, American Samoa, Guam, Northern Marianas, Puerto Rico, and the Virgin Islands.
8th Grade Mathematics, 1990 and 1996 (Public Schools) Changes in the Gap Between White and Minority Scores
Statistically Significant Change
Change in the Gap between 1990 and 1996
Gap Between White and Minority Scores in 1996
[Increases epresent a larger gap indicated by ]

32
Change in the Gap between White and Minority Student Scores in4th Grade Reading
From 1992 to 1998, Delaware was the only state to reduce the achievement gapbetween white and minority (black and Hispanic) students. Unfortunately, the gapincreased in six (6) states: Arizona, Colorado, Louisiana, New Hampshire, Utah, andWisconsin.
The gap between white and minority achievement scores ranged from a high of 53NAEP scale points in the District of Columbia and 38 points in Rhode Island to a low of16 points in Maine and Wyoming.
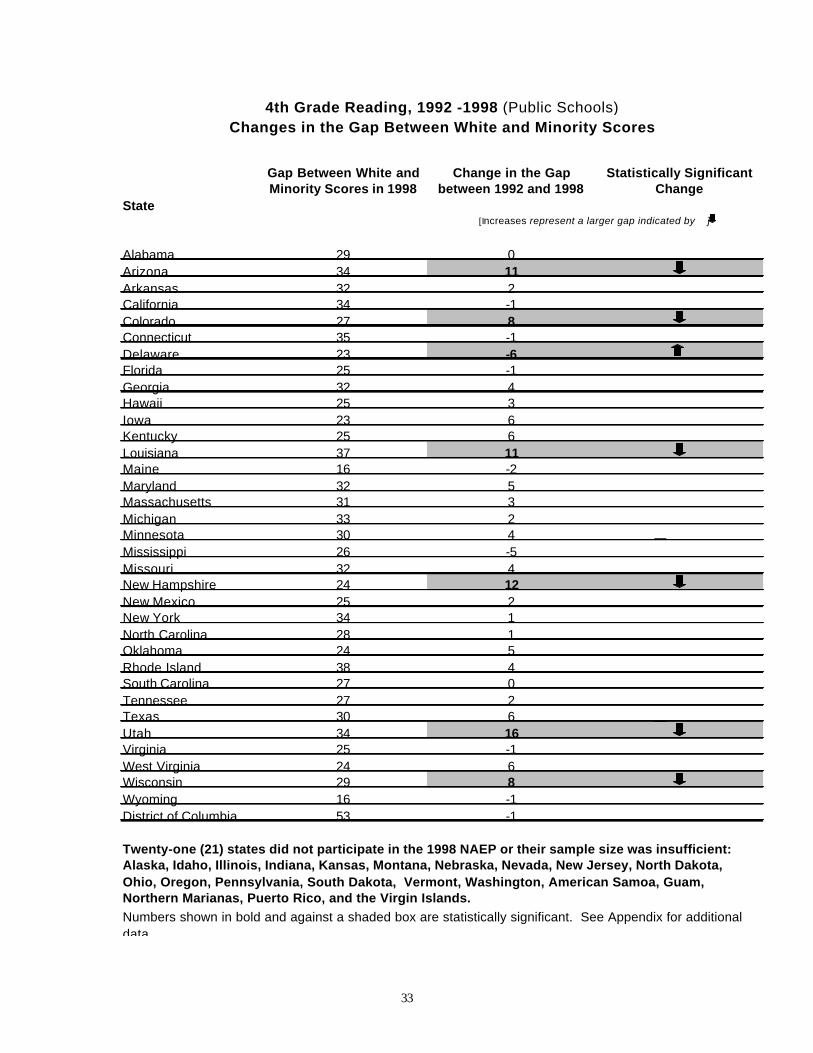
33
State
Alabama 29 0Arizona 34 11Arkansas 32 2California 34 -1Colorado 27 8Connecticut 35 -1Delaware 23 -6Florida 25 -1Georgia 32 4Hawaii 25 3Iowa 23 6Kentucky 25 6Louisiana 37 11Maine 16 -2Maryland 32 5Massachusetts 31 3Michigan 33 2Minnesota 30 4Mississippi 26 -5Missouri 32 4New Hampshire 24 12New Mexico 25 2New York 34 1North Carolina 28 1Oklahoma 24 5Rhode Island 38 4South Carolina 27 0Tennessee 27 2Texas 30 6Utah 34 16Virginia 25 -1West Virginia 24 6Wisconsin 29 8Wyoming 16 -1District of Columbia 53 -1
Numbers shown in bold and against a shaded box are statistically significant. See Appendix for additional data.
4th Grade Reading, 1992 -1998 (Public Schools) Changes in the Gap Between White and Minority Scores
Statistically Significant Change
Change in the Gap between 1992 and 1998
Gap Between White and Minority Scores in 1998
[Increases represent a larger gap indicated by ]
Twenty-one (21) states did not participate in the 1998 NAEP or their sample size was insufficient: Alaska, Idaho, Illinois, Indiana, Kansas, Montana, Nebraska, Nevada, New Jersey, North Dakota, Ohio, Oregon, Pennsylvania, South Dakota, Vermont, Washington, American Samoa, Guam, Northern Marianas, Puerto Rico, and the Virgin Islands.
34
In Conclusion
The prior charts, tables, and summaries of the statistically significant changes byquartile present NAEP data in the terms originally specified in the National EducationGoals. As a participant in meetings chaired by Michael Cohen at the National Governors’Association the summer of 1989 before the Education Summit, I remember lengthydiscussions about the complexity of tracking education progress well. There was anunwillingness to oversimplify the reporting problems. This analysis was intended to meetthe spirit of those discussions and show every participating state whether “the academicperformance of all students… increase[d] significantly in every quartile, and [whether]the distribution of minority students in each quartile… [reflected] the student populationas a whole.”
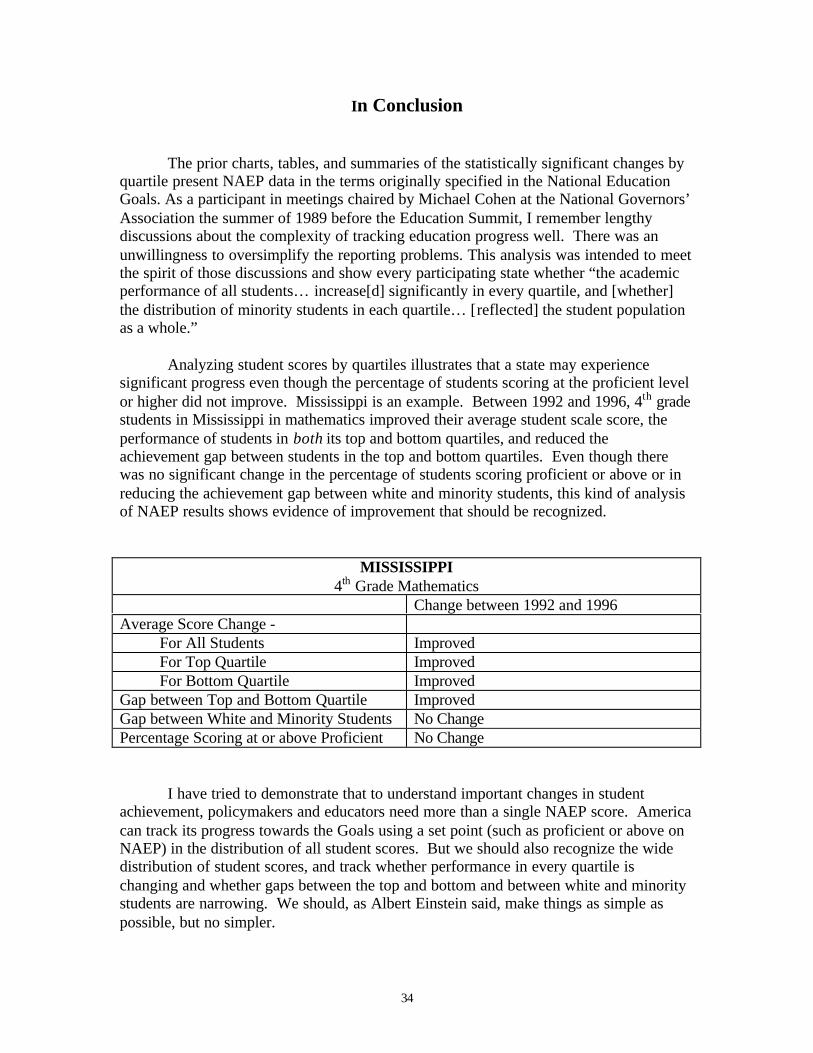
Analyzing student scores by quartiles illustrates that a state may experiencesignificant progress even though the percentage of students scoring at the proficient levelor higher did not improve. Mississippi is an example. Between 1992 and 1996, 4th gradestudents in Mississippi in mathematics improved their average student scale score, theperformance of students in both its top and bottom quartiles, and reduced theachievement gap between students in the top and bottom quartiles. Even though therewas no significant change in the percentage of students scoring proficient or above or inreducing the achievement gap between white and minority students, this kind of analysisof NAEP results shows evidence of improvement that should be recognized.
MISSISSIPPI4th Grade Mathematics
Change between 1992 and 1996Average Score Change - For All Students Improved For Top Quartile Improved For Bottom Quartile ImprovedGap between Top and Bottom Quartile ImprovedGap between White and Minority Students No ChangePercentage Scoring at or above Proficient No Change
I have tried to demonstrate that to understand important changes in studentachievement, policymakers and educators need more than a single NAEP score. Americacan track its progress towards the Goals using a set point (such as proficient or above onNAEP) in the distribution of all student scores. But we should also recognize the widedistribution of student scores, and track whether performance in every quartile ischanging and whether gaps between the top and bottom and between white and minoritystudents are narrowing. We should, as Albert Einstein said, make things as simple aspossible, but no simpler.
35
APPENDIX TABLES
These tables were prepared by Educational Testing Service for the National EducationGoals Panel under arrangements made by the National Center for Education Statistics.
36

37
38
39
40
41

42
43

44
45
46
47
48
Executive Summary
Raising Achievement and Reducing Gaps:Reporting Progress Toward Goals for Achievement
by Paul E. Barton
Paul Barton provides a new analysis of student achievement scores for states onthe National Assessment of Educational Progress, NAEP. Only in mathematics (grades4 and 8) and reading (grade 4 only) are state trend data currently available, although newstate data in science and mathematics are scheduled to be released later in 2001. Bartonhas analyzed state NAEP data to identify state trends in performance of students in thetop and bottom quartiles of performance, as well as changes in the student achievementgap between whites and minority (black and Hispanic) and top and bottom quartiles.
The results show that:
• States are generally making more progress in mathematics achievement thanin reading. Between 1990 and 1996, the average student achievement scoresimproved significantly in 28 (out of 32) states in 8th grade mathematics, and nonedeclined. In 4th grade reading from 1992 to 1998, only 7 (out of 36) statesimproved and 3 states declined.
• Good readers are getting better at the same time weak readers are losingground. In half the states (18 out of 36), the performance of students in thebottom quartile in 4th grade reading declined, and performance improved in only 3states. In contrast, the performance of students in the top quartile improved in 12states and declined in none.
• During the 1990’s fourth grade students made more improvement inmathematics achievement than in reading in most states. In mathematics, 15states raised their average 4th grade NAEP score significantly; 20 states improvedscores of students in the bottom quartile; and 16 states improved scores ofstudents in the top quartile. Four or fewer states lost ground in 4th grademathematics across these three dimensions. In reading, 7 states improved 4th
graders average score; 3 improved performance of the bottom quartile; and 12improved performance of the top quartile; while average scores declined in 3states, 18 states lost ground with students in the bottom quartile, and none lostground among the top quartile.
• States have not generally reduced the achievement gap between top andbottom quartiles or between white and minority students. In 4th grade readingonly 1 state reduced the achievement gap between the top and bottom quartiles orbetween white and minority students. In mathematics, 8 states reduced the gapbetween the top and bottom quartiles at 4th grade and 5 did so at 8th grade. Only 2states reduced the gap between white and minority students in 4th grademathematics, and none did so in 8th grade mathematics.

NATIONAL EDUCATION GOALS PANEL STAFF
EXECUTIVE DIRECTOR
Emily O. Wurtz, Acting
PROGRAM STAFF
John Barth Senior Education Associate
Burt Glassman Education Associate
Chris Harrington Education Associate
Lois Peak Senior Education Associate
Cynthia D. Prince Associate Director for Analysis and Reporting
ADMINISTRATIVE STAFF
Cynthia M. Dixon Executive Officer
Erika Kirby Project Assistant

National Education Goals Panel1255 22nd Street, NW, Suite 502
Washington, DC 20037202-724-0015
Fax: 202-632-0957www.negp.gov